investigating the use of commodity dust sensors …budde/publications/inss2012_budde.pdf ·...
TRANSCRIPT

Investigating the Use of Commodity Dust Sensorsfor the Embedded Measurement
of Particulate MatterMatthias Budde, Mathias Busse, and Michael Beigl
Karlsruhe Institute of TechnologyTECO / Pervasive Computing Systems
Karlsruhe, GermanyEmail: {lastname}@teco.edu
Abstract—A variety of studies in the past decades have shownthat fine particulate matter can be a serious health hazard,contributing to respiratory and cardiovascular disease. Due tothis, more and more regulations defining certain permissibleconcentration limits have been set by governments around theworld. However, current standard measurement equipment islarge, expensive and sparsely deployed. Additionally, both theexposure to hazardous conditions and the susceptibility to nega-tive health effects vary from person to person. As a result, we seethe need for fine-grained, mobile and distributed measurements,e.g. to identify hot spots or monitor people at risk. Our researchinvestigates the feasibility of particulate matter measurementsusing cheap, commodity dust sensors which are small enough tobe incorporated into mobile devices. This paper first discussesapplication scenarios which would benefit from inexpensivemethods to assess the particulate matter load. Subsequently,commercial-off-the-shelf (COTS) sensors are compared and theirgeneral suitability for the application scenarios is examined.Finally, an experimental setup for the evaluation of one of thesensors is presented along with preliminary results.
I. INTRODUCTION
The effects of particulate matter on human health have beenextensively studied in the past decades. The results are that finedust can be a serious health hazard, contributing to or evencausing respiratory and cardiovascular diseases. Due to this,more and more regulations regarding the reduction of man-made particulate matter have been set by governments aroundthe world. Such standards usually define limits for particlematter concentrations which may not be exceeded. Today,there are usually several of such maximum permissible valuesfor different particle size classes and observation periods.Different classes of particulate matter have successively beendefined by the U.S. Environmental Protection Agency (EPA).The most important ones are PM10 and PM2.5. These arecommonly assumed to be the total mass of particles withaerodynamic diameter less than 10 (respectively 2.5) µm. Thisis not 100% correct. PM10 is actually defined as “particulatematter which passes through a size-selective inlet with a 50%efficiency cut-off at 10 µm aerodynamic diameter” [1]. 1
1However, the exact measurement of particulate matter according to thisdefinition is not trivial. [2] discusses some issues regarding the precision.
TABLE IMAXIMUM PERMISSIBLE VALUES FOR PARTICULATE MATTER AS
SUGGESTED BY THE WHO [4], THE EU [1], AND EPA (USA) [5].
Class Maximum permitted Tolerated exceedings
10µg
m3 (annual mean) –PM2.5 25
µg
m3 (24-hour mean) –WHO
20µg
m3 (annual mean) –PM10 50
µg
m3 (24-hour mean) –
40µg
m3 (annual mean)EU PM10 50
µg
m3 (24-hour mean) max. 35 days per year
15µg
m3 (annual mean)
USAPM2.5 35
µg
m3 (24-hour mean)
PM10 150µg
m3 (24-hour mean) max. 1 day in 3 years
Table I shows different limits for the two classes (PM10
and PM2.5), as defined by the World Health Organization(WHO), the European Commission, and the EPA. While thevalues provided by the WHO are mere recommendations, thelimits of the EU as well as the EPA are supposed to bebinding. However, violations of these standards are toleratedto a certain extent (see Table I), but also these tolerances areexceeded frequently. In Germany for example, 54 of 354 listedmeasuring stations exceeded the maximum permissible valueson more than 35 days in the year 2011. The station with thelargest number of violations exceeded the threshold on 79days, more than double of what is allowed. The year beforethat, in 2010, even more stations (63) exceeded the 35-day-limit [3]. In addition to the slack enforcement of the thresholds,the denseness of monitoring networks could be improved:Often, only a single measurement station is used to determinethe particulate matter load for a large urban area. Also, boththe individual exposure to potentially hazardous conditions aswell as the susceptibility to negative health effects vary fromperson to person [4]. As a result, we see the need for morefine-grained, distributed and/or mobile measurements, e.g inorder to identify hot spots or monitor people at risk.
In this work, we focus on applications that emphasize themobile and/or distributed measurement of fine dust. Standard978-1-4673-1786-3/12/$31.00 © 2012 IEEE

stationary measurement equipment usually uses gravimetricmeasurement to determine the particulate matter concentration.Such stations are typically large and expensive and thus notsuitable for the described scenarios. In order to be practical fortruly mobile, unobtrusive ways to measure particulate matter,the measurement equipment should ideally be embeddableinto mobile phones. However, since the available sensors arecurrently still too large for this, the next best thing would bethe incorporation into small handheld sensor devices that canbe docked to, or wirelessly communicate with, a smartphoneor handheld computer.
This is why in this paper we investigate the feasibilityof particulate matter measurements using cheap, commoditydust sensors, that are low-power and small enough to beincorporated into mobile devices. The remainder of this sectionpresents some application scenarios which could benefit fromthe use of such sensors for the measurement of particulatematter. Classical applications for these sensors, such as airquality control (e.g. in air purifiers or air monitors) or station-ary smoke alarms, are not considered here.
1) Urban/Participatory Sensing: Urban City Sensing ap-proaches have been proposed in the past to create noisepollution maps of urban areas [6], [7]. Similar to the creationof such maps, mobile particulate matter measurements couldbe used in order to map hazardous areas and mark pollutionhot spots. While it is expected that the accuracy using simpledevices is lower than that of expensive stationary equipment,mobile measurements would allow for a much higher spatialand temporal resolution. Also, cheap measurement equipmentcould e.g. allow developing countries to erect inexpensivemeasurement grids for air quality monitoring purposes.
2) Personal/Life Log: Similar to the kind of devices whichpeople carry in nuclear facilities in order to measure andrecord their occupational exposure to radioactivity, mobile dustsensors could be applied in potentially hazardous environmentssuch as coal mines or woodworking shops. However, sincesuch scenarios are highly health relevant, a sufficient accuracyneeds to be reached.
3) Personal Information: Since the effects of both long-term and short-term exposure may vary greatly between indi-viduals, any standard or guideline cannot completely protecteach individual [4]. People may want to be sure on an informallevel that they are not overexposed to high concentrations ofparticulate matter. This application scenario is similar to theone that was described before. However, the focus lies moreon coarse information rather than precise measurements here,much as it is the case with cheap commodity UV-meters orthermometers anyone can buy for a few dollars.
II. RELATED WORK
Not a lot of research has been done that specifically ad-dresses embedded mobile measurement of particulate matter,neither in general, nor specifically for participatory sensingapplications. Mobile-phone-based urban sensing is done in theUCLA project peir (personal environmental impact report)[8], [9]. This project aims at sharing "how you impact the
environment and how the environment impacts you". Amongother things, the smog exposure (PM2.5 particulate exposure)and sensitive site impact (PM2.5 particulate impact on sen-sitive sites such as schools and hospitals) are included in thelogged data. However, the exposure is not directly measured,but calculated based on a variety of parameters such as thecloseness to known hazardous conditions or areas, as forexample a freeway.
In [10], a distributed network of nodes was introduced,which was made out of smart sensors in order to moni-tor dust, particularly in urban areas. The nodes used theSharp GP2Y1010 optical dust sensor. Several measurementswere made and the accuracy was analyzed against that of agravimetric measuring device. However, the paper focused onnetwork aspects and the measurement of dust in general, notso much on particulate matter measurements. In addition tothat, the paper does not contain detailed information on theevaluation, just that the results were "calculated based on 20measurements". Unfortunately, there is no information on thesampling frequencies or the duration of those measurements.
III. EXPERIMENTS
For our experiments, we took a series of measurementswith cheap commodity dust sensors in order to investigatethe general suitability of such sensors for the measurement ofparticulate matter. We did not expect the results to be perfectin terms of accuracy, since we did not use any filters to keepour samples clean from coarse dust. Our goal was to observeand quantify the margin of error between our cheap sensorsand a calibrated reference device and to assess for which kindof application cheap COTS dust sensors can be used, if any.
1) Sensor selection: While there is a variety of stationaryand handheld dust monitors commercially available, there arenot many of small sensors to choose from (see Table II):The Japanese company Shinyei [11] carries several relativelysophisticated particle sensing modules in the upper price range.Their availability is fair, since Shinyei’s sensor portfolio isonly available through the company itself as well as fewselected distributors. Two Korean sensors – the SYhitechDSM501 and the NIDS PS02C-PWM – are both very closeto the design of the Shinyei PPD42. However, while informa-tion on the NIDS sensors is available online [16], [17], our
TABLE IISPECS OF CANDIDATE DUST SENSORS ACCORDING TO THE DATA SHEETS.
Size RetailSensor
(mm3)Range Power
Price
Sharp GP2Y1010 [12] 46×30×18 0 – 0.5mg
m3 0.1 W ~ 10 $
SYhitech DSM501 [13] 59×45×20 0 – 1.4mg
m3 0.45 W ~ 10 $
Shinyei PPD42NS [14] 59×45×22 0 – 800,000pcs
ft3 0.45 W ~ 200 $
Shinyei PPD60PV [11] 88×60×22 0 – 2,000,000pcs
ft3 0.7 W ~ 420 $
Shinyei AES-1 [15] 90×90×23 300 – 300,000pcs
ft3 3.6 W ~ 1,100 $
NIDS PSX-01E [16] 59×45×20 0 – 2.0mg
m3 0.15 W n/a
NIDS PS02C-PWM [17] n/a 0 – 2.0mg
m3 n/a n/a
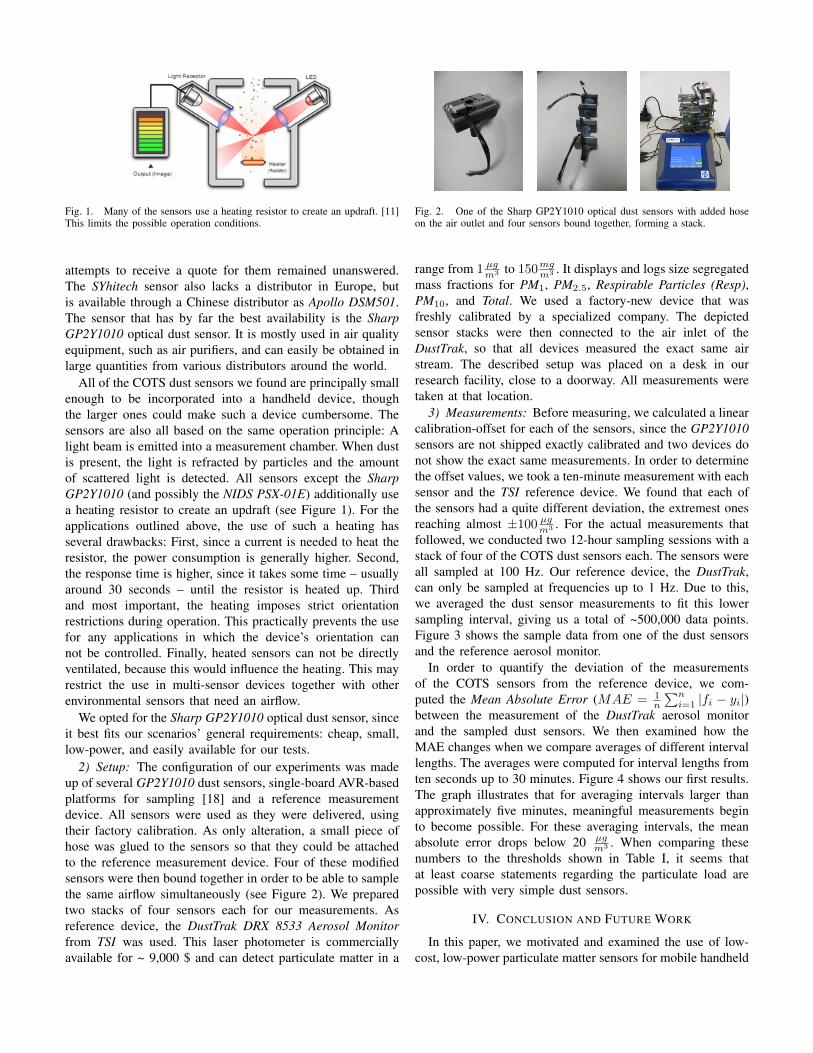
Fig. 1. Many of the sensors use a heating resistor to create an updraft. [11]This limits the possible operation conditions.
attempts to receive a quote for them remained unanswered.The SYhitech sensor also lacks a distributor in Europe, butis available through a Chinese distributor as Apollo DSM501.The sensor that has by far the best availability is the SharpGP2Y1010 optical dust sensor. It is mostly used in air qualityequipment, such as air purifiers, and can easily be obtained inlarge quantities from various distributors around the world.
All of the COTS dust sensors we found are principally smallenough to be incorporated into a handheld device, thoughthe larger ones could make such a device cumbersome. Thesensors are also all based on the same operation principle: Alight beam is emitted into a measurement chamber. When dustis present, the light is refracted by particles and the amountof scattered light is detected. All sensors except the SharpGP2Y1010 (and possibly the NIDS PSX-01E) additionally usea heating resistor to create an updraft (see Figure 1). For theapplications outlined above, the use of such a heating hasseveral drawbacks: First, since a current is needed to heat theresistor, the power consumption is generally higher. Second,the response time is higher, since it takes some time – usuallyaround 30 seconds – until the resistor is heated up. Thirdand most important, the heating imposes strict orientationrestrictions during operation. This practically prevents the usefor any applications in which the device’s orientation cannot be controlled. Finally, heated sensors can not be directlyventilated, because this would influence the heating. This mayrestrict the use in multi-sensor devices together with otherenvironmental sensors that need an airflow.
We opted for the Sharp GP2Y1010 optical dust sensor, sinceit best fits our scenarios’ general requirements: cheap, small,low-power, and easily available for our tests.
2) Setup: The configuration of our experiments was madeup of several GP2Y1010 dust sensors, single-board AVR-basedplatforms for sampling [18] and a reference measurementdevice. All sensors were used as they were delivered, usingtheir factory calibration. As only alteration, a small piece ofhose was glued to the sensors so that they could be attachedto the reference measurement device. Four of these modifiedsensors were then bound together in order to be able to samplethe same airflow simultaneously (see Figure 2). We preparedtwo stacks of four sensors each for our measurements. Asreference device, the DustTrak DRX 8533 Aerosol Monitorfrom TSI was used. This laser photometer is commerciallyavailable for ~ 9,000 $ and can detect particulate matter in a
Fig. 2. One of the Sharp GP2Y1010 optical dust sensors with added hoseon the air outlet and four sensors bound together, forming a stack.
range from 1 µgm3 to 150mgm3 . It displays and logs size segregatedmass fractions for PM1, PM2.5, Respirable Particles (Resp),PM10, and Total. We used a factory-new device that wasfreshly calibrated by a specialized company. The depictedsensor stacks were then connected to the air inlet of theDustTrak, so that all devices measured the exact same airstream. The described setup was placed on a desk in ourresearch facility, close to a doorway. All measurements weretaken at that location.
3) Measurements: Before measuring, we calculated a linearcalibration-offset for each of the sensors, since the GP2Y1010sensors are not shipped exactly calibrated and two devices donot show the exact same measurements. In order to determinethe offset values, we took a ten-minute measurement with eachsensor and the TSI reference device. We found that each ofthe sensors had a quite different deviation, the extremest onesreaching almost ±100 µgm3 . For the actual measurements thatfollowed, we conducted two 12-hour sampling sessions with astack of four of the COTS dust sensors each. The sensors wereall sampled at 100 Hz. Our reference device, the DustTrak,can only be sampled at frequencies up to 1 Hz. Due to this,we averaged the dust sensor measurements to fit this lowersampling interval, giving us a total of ~500,000 data points.Figure 3 shows the sample data from one of the dust sensorsand the reference aerosol monitor.
In order to quantify the deviation of the measurementsof the COTS sensors from the reference device, we com-puted the Mean Absolute Error (MAE = 1
n
∑ni=1 |fi − yi|)
between the measurement of the DustTrak aerosol monitorand the sampled dust sensors. We then examined how theMAE changes when we compare averages of different intervallengths. The averages were computed for interval lengths fromten seconds up to 30 minutes. Figure 4 shows our first results.The graph illustrates that for averaging intervals larger thanapproximately five minutes, meaningful measurements beginto become possible. For these averaging intervals, the meanabsolute error drops below 20 µg
m3 . When comparing thesenumbers to the thresholds shown in Table I, it seems thatat least coarse statements regarding the particulate load arepossible with very simple dust sensors.
IV. CONCLUSION AND FUTURE WORK
In this paper, we motivated and examined the use of low-cost, low-power particulate matter sensors for mobile handheld

1 2 3 4 5 6 7 8 9 10 11 12 13 14 15 16 17 18 19 20 21 22 23 240
0.02
0.04
0.06
0.08
0.1
0.12
0.14
0.16
0.18
t in hours
mg/
m 3
Fig. 3. Data from one of the dust sensors (red curve) and the referencedevice (blue curve) in mg
m3 .
measurements. Several application scenarios were discussedand various cheap commercial-off-the-shelf (COTS) dust sen-sors were studied with respect to their general suitability forthe outlined scenarios. Finally, one of the sensors was selectedand used to make some experiments aiming at assessing inhow far COTS sensors are suitable for the measurement ofparticulate matter. We argue that there are definitely severalinteresting application scenarios that would benefit from inex-pensive sensors that can measure the particulate load. Theseinclude Participatory Sensing applications, such as creatingmaps pointing out pollution hot spots or the erection ofinexpensive measurement grids, as well as personal appliances,e.g. exposure logs or warning systems. At the same time, onlyfew of the currently available COTS sensors that are availablein the market fit the general requirements to be incorporatedinto mobile handheld measurement devices. With respect tothe question of whether or not the accuracy of the COTSsensors is sufficient for fine dust measurements, there is nodefinite answer: While we found that the measurements of thesimple sharp sensor generally correspond with the particulateload which our gauged reference aerosol monitor measured,the margin of error can be considered to be inadequate forsome of the application scenarios. However, when observinglonger intervals, the advantages (higher spatial and temporalresolution, low price, low-power, relatively compact size) mayoutweigh the accuracy deficiencies.
In future work, the preliminary results presented in thispaper will be deepened. This will include the investigationof methods to automatically calibrate the sensors, since welearned that this compensation is crucial as a basis formeaningful measurements. Other promising steps may be theanalysis of the sensor’s noise characteristics in order to selectappropriate filters for preprocessing or the use of distributedmeasurements to increase the sensing accuracy. In parallel,we will experiment with modifications of the sensors, such asvarying the light intensity or spectra of the diode, applyingHEPA filters and/or impactors and studying the effects offurther miniaturization. We hope to learn from these future
0 5 10 15 20 25 300
0.1
0.2
0.3
0.4
0.5
0.6
0.7
0.8
0.9
1
t in min
mg/
m 3
mean absolute error
standard deviation
Fig. 4. Mean Absolute Error and Standard Deviation over different averagingintervals.
investigations, for which type of application optical COTS dustsensors are suitable, and for which types the need to explorenew measurement approaches from other fields – such as e.g.capacitive or microfluidic detection – should be explored.
REFERENCES
[1] Council directive 1999/30/EC of 22 april 1999 relating to limit valuesfor sulphur dioxide, nitrogen dioxide and oxides of nitrogen, particulatematter and lead in ambient air.
[2] D. M. Butterfield and P. Quincey, “Measurement science issues relatingto PM10 and PM2.5 airborne particles,” NPL Report AS 15, 2007.
[3] Umweltbundesamt. (2012) Luftdaten: Feinstaub (pm10). [Online].Available: http://www.env-it.de/luftdaten/trsyear.fwd?comp=PM1
[4] The World Health Organization. (2005) WHO air quality guidelines forparticulate matter, ozone, nitrogen dioxide and sulfur dioxide – globalupdate 2005 – summary of risk assessment. [Online]. Available: http://whqlibdoc.who.int/hq/2006/WHO_SDE_PHE_OEH_06.02_eng.pdf
[5] United States Environmental Protection Agency. (2006) Nationalambient air quality standards (NAAQS) – air and radiation – US EPA.[Online]. Available: http://www.epa.gov/air/criteria.html
[6] S. Santini, B. Ostermaier, and R. Adelmann, “On the use of sensor nodesand mobile phones for the assessment of noise pollution levels in urbanenvironments,” in INSS’09, 2009.
[7] N. Maisonneuve, M. Stevens, M. E. Niessen, and L. Steels, “Noise-tube: Measuring and mapping noise pollution with mobile phones,” inInformation Technologies in Environmental Engineering, 2009.
[8] PEIR – personal environmental impact report. [Online]. Available:http://urban.cens.ucla.edu/projects/peir
[9] M. Mun, et al., “Peir, the personal environmental impact report, as aplatform for participatory sensing systems research,” in MobiSys’09.
[10] M. I. Khadem and V. Sgarciu, “Dust monitoring systems,” in Proceed-ings of the ICSNC’11, 2011, pp. 68–71.
[11] Shinyei – products – particle sensor. [Online]. Available: http://www.sca-shinyei.com/particlesensor
[12] GP2Y1010 optical dust sensor. [Online]. Available: http://sharp-world.com/products/device/lineup/data/pdf/datasheet/gp2y1010au_e.pdf
[13] Apollo DSM501 dust sensor module. [Online].Available: http://www.apollounion.com/Upload/DownFiles/DSM501%20Technical%20Specifications.pdf
[14] Specification sheet of PPD42NS. [Online]. Available: http://www.sca-shinyei.com/pdf/PPD42NS.pdf
[15] Specification sheet of AES-1, -4. [Online]. Available: http://www.sca-shinyei.com/pdf/AES-1&4.pdf
[16] NIDS – PS02C-PWM. [Online]. Available: http://www.nids.co.kr/eng/product1_2.html
[17] NIDS – PS02C-PWM. [Online]. Available: http://www.nids.co.kr/eng/product1_4.html
[18] M. Budde, et al., “The TECO Envboard: a mobile sensor platform foraccurate urban sensing – and more,” in INSS’12, 2012.