investigating the value of appending new types of big data
TRANSCRIPT

Investigating the Value of Appending New Types of Big Data to Address-based
Survey Frames and Samples
Paul J. Lavrakas, Independent Consultant
Ashley Hyon, Marketing Systems Group
David Malarek, Marketing Systems Group
BIGSURV18 Conference, Barcelona, 27 October 2018

Preface
• Acknowledgement/Thanks• To MSG for providing the Big Data used in this research
• To Simmons Research for giving permission to use one of their 2018 National Consumer Survey (NCS) datasets
• Disclosures• Neither MSG nor Simmons nor any other organization funded Lavrakas’ work
on this research or his expenses related to this conference
• The information presented here is not meant to represent the views of Simmons Research
2

Introduction
• Considerable advances have taken place in survey science in the past two decades through the usage of auxiliary data that can be appended to survey sampling frames and survey samples
• These advances continue to take place as survey researchers delve creatively into ways that appended data can aid: • Sampling (e.g., for stratification)
• Recruitment (e.g., for response propensity modeling to help tailor recruitment protocols to different sample units/elements)
• Weighting (e.g., using psychographics characteristic, not merely demographics)
• Nonresponse bias investigations (e.g., for explaining nonignorable differences in key measures between responders vs. nonresponders)
3

Introduction• In the USA, these appended data have traditionally included local
area census block group data including variables such as • % dwelling units that are single-family houses,
• % residents that are Hispanic
• median household income,
• the Census’s Low Response Score variable
• Survey sample vendors have access to other non-public “Big Data” that can be matched to the level of an individual address or at the person-level at an address, such as• Age, educational attainment, race, and Hispanicity of the head of
household; myriad consumption/expenditure data and other psychographics
4
Introduction• House-level and person-level variables often come from
commercial sources and are not without error• Despite these measurement errors, some of these variables are
statistically reliable (and meaningful within a multivariate context) predictors of survey response
• And, although household specific data are not available for all addresses, “missingness” is sometimes found to be a reliable/important predictor of survey response
5

Our Research Study• Research Question: Are there other types of Big Data than
traditional demographics (aka “the usual suspects”) that survey researchers should be using for various statistical/analytic purposes, including investigating what best predicts response/nonresponse in a particular survey?
• To pursue this:• We first secured a dataset for a completed longitudinal cross-sectional
survey from Simmons Research that contained a USA national random sample of approximately 19K addresses for the 2018 First Quarter Wave of the Simmons National Consumer Survey (NCS)
• The NCS is a two-stage mail survey about “consumer behaviors,” wherein each sampled address is mailed a brief enumeration questionnaire in Phase 1 and asked to (a) return the completed questionnaire and (b) consent to be sent a very long Phase 2 questionnaire
• The Phase 1 Complete/Phase 2 Consent rate (AAPOR RR1) for this survey was 26.7%
6

Our Research Study• To pursue this (cont.):
• This dataset had auxiliary data – traditional demographic characteristics –originally appended to it from the most recent ACS (at the local block group level) and other household/person level demographic variables from MSG’s commercially licensed sources
• To this dataset, and for the purposes of the present research study, MSG appended more than 900 atypical demographic variables and psychographic variables from some of their other commercially licensed consumer databases
7
Our Research Study• Analytic Approach
• The frequency distributions of the new variables were viewed for skewness
• Variables that had 80% or more of the cases fall into the modal category were excluded• This narrowed the variables to approximately 300
• Within the context of the large sample size for the NCS, Crosstab and Bivariate Correlation were then used to select variables that showed differences for nominal and ordinal variables of at least 10 pp between the lowest and highest categories as they related to response/nonresponse in the NCS, or had a correlation of at least 0.07 for interval and ratio variables and response/nonresponse – These were somewhat arbitrary thresholds• That narrowed further analyses to approximately 120 variables
8
Our Research Study• Analytic Approach (cont.)
• Each of these variables was then used in logistic regression analyses with variables from the same domain in a stepwise backwards approach with the Wald significance-value-to-eliminate being a conservative p > .05• That narrowed the further analyses to approximately 40 variables
• Those variables were used in a logistic regression analysis (using the same threshold criteria), and that narrowed the final set of predictor variables to 23
9

Our Research Study• 23 HH-level Auxiliary Variables Selected for Further Testing
10
• HH is Phone Objector• HH length of residence• Number of adults in HH• HH contributes to charities• HH has premium credit card• HH has interest in reading• HH has computer and peripherals• Marital status of Member 1• Religion of Member 1 Protestant• Occupational group of Member 1• European Ethnicity of Member 1• Member 1 owns business• Gender of Member 1 known
• Educ. attainment of Member 1 known• Multi-buyer HH• Book buyer HH• Gifts & Gadgets buyer HH• General Merchandise buyer HH• Presence of Child in HH• Mosaic group of HH• HH on Federal DNC list• Home owner Prob. Model score of HH• HH has Cat Enthusiast

Investigating the Newly Identified Auxiliary Variables• Bivariate examples of how these variables relate to Response/
Nonresponse in the 2018 NCS, and its overall AAPOR RR1 for completion/consent of 27%• 47% of Premium credit card HHs completed/consented
• 45% of Cat Enthusiast HHs completed/consented
• 44% of Contributor to charities HHs completed/consented
• 43% of HHs where Member 1 owns a business completed/consented
• 39% of Higher status occupation or Retired completed/consented
• 39% of Gifts/Gadgets buyer completed/consented
• 38% of HHs where Educational of Member 1 is known completed/consented
• 37% of HHs with General Merchandise buyer completed/consented
• 34% of HH with Interest in Reading completed/consented
• 33% of Phone Objector HHs completed/consented
11

Investigating the Newly Identified Auxiliary Variables• CASE STUDY: The remainder of our results shows how these new
auxiliary variables worked in an RPM to predict response/ nonresponse in the 2018 Wave 1 of the Simmons NCS, and how they were used to generate a Response Propensity score for each case in the dataset• REMINDER: This usage of auxiliary data is one of the primary ways that such
data can aid survey researchers
12

Investigating the Newly Identified Auxiliary Variables• Of note, prior research at Simmons had found 13 predictors for a Simmons RPM
project, using three NCS databases from 2016 & 2017• Census Low Response Score• Census Median home value in block group• Census Percent speaking English in block group• MSG Age of head of household• MSG Household income• MSG Age of second person in household• MSG Home tenure (own or rent)• Simmons Stratum variables derived from data provided by MSG
• Hispanic• Landline• Race• Metro area• Region
• Simmons’ contingent incentive amount offered for a returned Phase 1 NCS questionnaire completion
13

Investigating the Newly Identified Auxiliary Variables• Modeling Response Propensity and Creating RP Scores
• The RP model predicts the likelihood that an address became a completion/consent in the completed survey
• The RP Model can be applied to a similar, but yet-to-be conducted survey and the RP scores for that new survey can be used to form RP Cohorts to recruit with tailored/differential recruitment protocols
• The value of the RP model and the RP scores that it produces in this type of application is the extent to which it provides an accurate ranking of cases from least-likely to most-likely to cooperate
14

Investigating the Newly Identified Auxiliary Variables• Characteristics of the RP Model/Scores
• Original 13 Predictor Set of Demographic Characteristics• In-sample AUC = 0.612
• Ave-out-sample AUC= 0.601
• Max/Min RP Scores = .511/.089
• New Predictor Set of 23 Psychographic and Demographic Characteristics• In-sample AUC =0.633
• Ave-out-sample AUC=0.617
• Max/Min RP Scores =.720/.103
• Combined Predicator Set of Demographic and Psychographic Characteristics• In-sample AUC = 0.641
• Ave-out-sample AUC= 0.623
• Max/Min RP Scores =.727/.083
15

Investigating the Newly Identified Auxiliary Variables• Plotting RP Score Quantiles to Help Identify RP Cohorts
• Original Predictor Set of Demographic Characteristics and Simmons Design Variables from Simmons RP model (Quantile size, n = 804)
16
0.000
0.100
0.200
0.300
0.400
0.500
0.600
1 2 3 4 5 6 7 8 9 10 11 12 13 14 15 16 17 18 19 20 21 22 23 24
Chart Title

Investigating the Newly Identified Auxiliary Variables• Plotting RP Score Quantiles to Help Identify RP Cohorts
• New Predictor Set of Psychographic and Demographic Characteristics and Key Variables from Original Simmons RP model (Quantile size, n = 804)
17
0.000
0.100
0.200
0.300
0.400
0.500
0.600
1 2 3 4 5 6 7 8 9 10 11 12 13 14 15 16 17 18 19 20 21 22 23 24
Chart Title
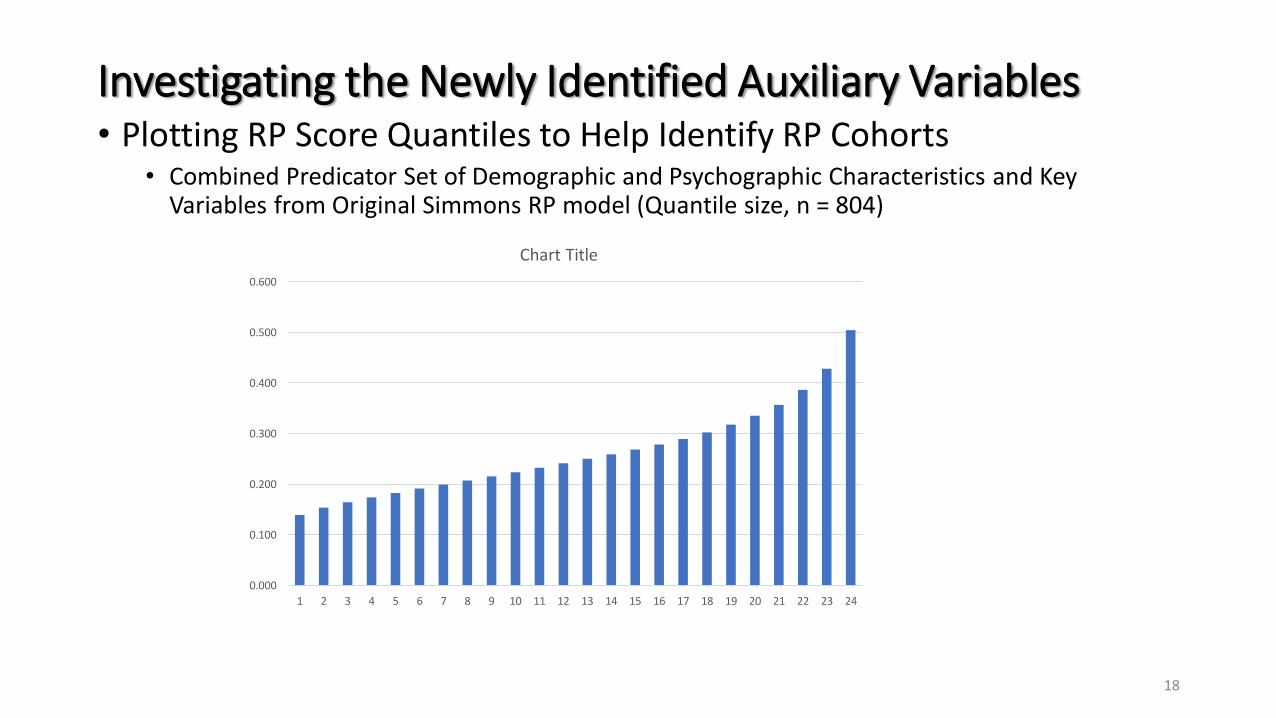
Investigating the Newly Identified Auxiliary Variables• Plotting RP Score Quantiles to Help Identify RP Cohorts
• Combined Predicator Set of Demographic and Psychographic Characteristics and Key Variables from Original Simmons RP model (Quantile size, n = 804)
18
0.000
0.100
0.200
0.300
0.400
0.500
0.600
1 2 3 4 5 6 7 8 9 10 11 12 13 14 15 16 17 18 19 20 21 22 23 24
Chart Title
Discussion
• Conclusions• Adding atypical auxiliary data at the level of the individual address improved
ability to predict response/nonresponse in the Simmons NCS and to be better able to discriminate between cases
• In doing so it enhanced the value of the RP model to tailor recruitment protocols in a future NCS across different RP sub-cohorts
• Some psychographic variables were found to enhance the model that originally only contained local area demographic variables and some HH level demographic variables• The psychographic variables available for our research were mostly
consumption-related characteristics from Big Data sources
• In some cases “missingness” on a variable was what made it an important predictor of response/nonresponse
19

Discussion
• Implications• As database companies improve the range of Big Data variables that can be
matched/appended to sampling frames and thus to initially designated survey samples, survey researchers should be able to improve the cost-effectiveness of their surveys and raise survey accuracy by:• Stratifying samples on more than demographics and thereby generate more
effective initially designated samples
• Devising more powerful Response Propensity Models to allow for the tailoring of differential recruitment protocols that are targeted to various RP Cohorts (subgroups of sampled units)
• Study nonresponse bias with greater precision and more robustly
• Weight final samples more effectively to reduce bias while minimizing the rise in imprecision (variance)
20

Discussion
• Next Steps• Our results are preliminary and we have additional analyses to carry out
• Determining which of the variables that predict response/nonresponse also predict differences in key survey measures to a meaningful extent
• Identifying theory to help explain why the new predictors should be related to response/nonresponse
21
