investigation of plasma wall interaction based on plasma ... documents/sso 9th... · 1 for sso...
TRANSCRIPT
Author:Hiroaki Ohwada1, K. HANADA2, N. Yoshida2, K. Nakamura2,, K. Yamazaki2, Hao LONG2, QUEST group2
1. Interdisciplinary Graduate School of Engineering Sciences IGSES, Kyushu University
2. Research Institute for Applied Mechanics RIAM, Kyushu University 6-1 Kasugakoen, Kasuga, P.R. Japan
Investigation of plasma wall interaction based on plasma radiation measurement in long duration discharge on QUEST
1
For SSO realization…
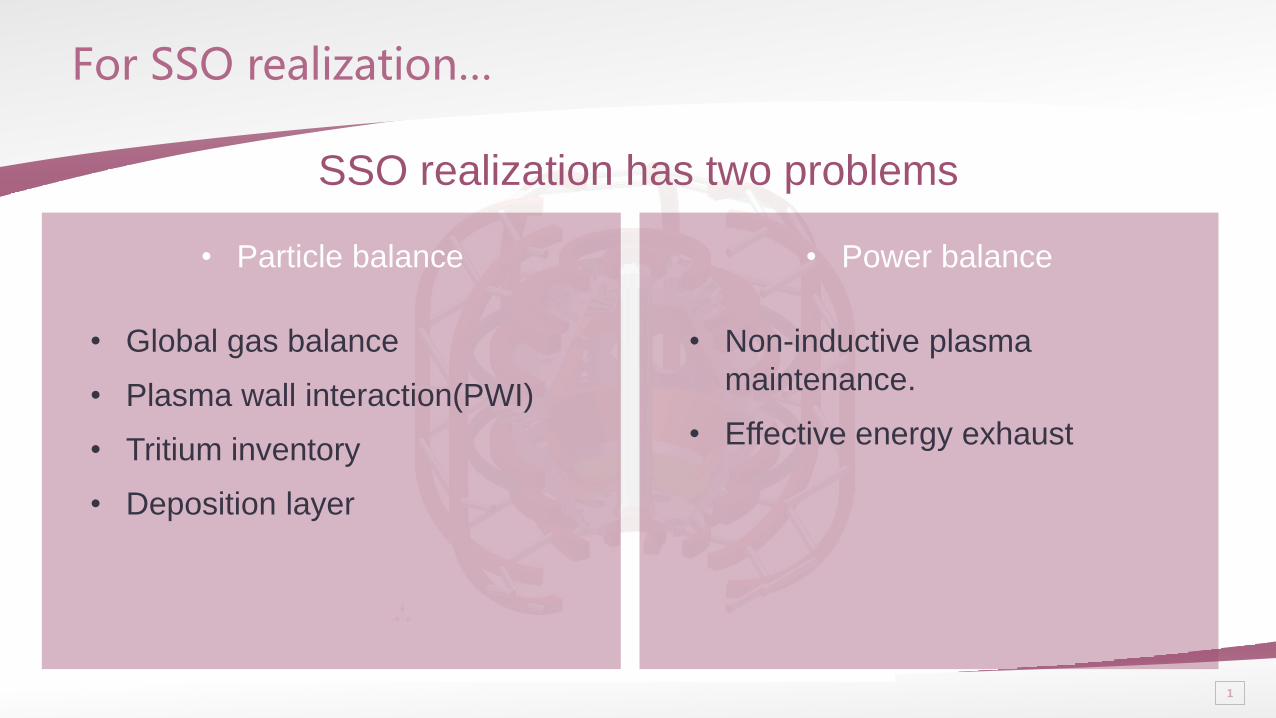
SSO realization has two problems
• Power balance • Particle balance
• Global gas balance
• Plasma wall interaction(PWI)
• Tritium inventory
• Deposition layer
• Non-inductive plasma
maintenance.
• Effective energy exhaust
2
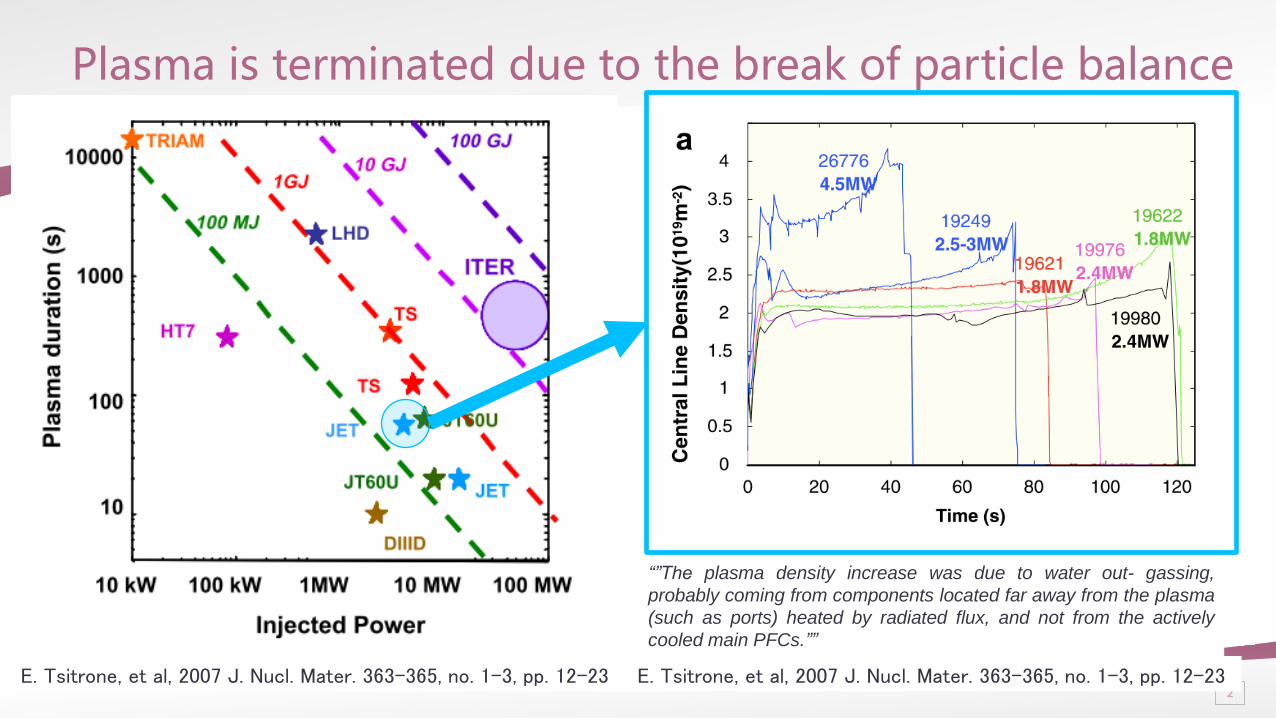
Plasma is terminated due to the break of particle balance
“”The plasma density increase was due to water out- gassing,
probably coming from components located far away from the plasma
(such as ports) heated by radiated flux, and not from the actively
cooled main PFCs.””
E. Tsitrone, et al, 2007 J. Nucl. Mater. 363–365, no. 1–3, pp. 12–23 E. Tsitrone, et al, 2007 J. Nucl. Mater. 363–365, no. 1–3, pp. 12–23
3
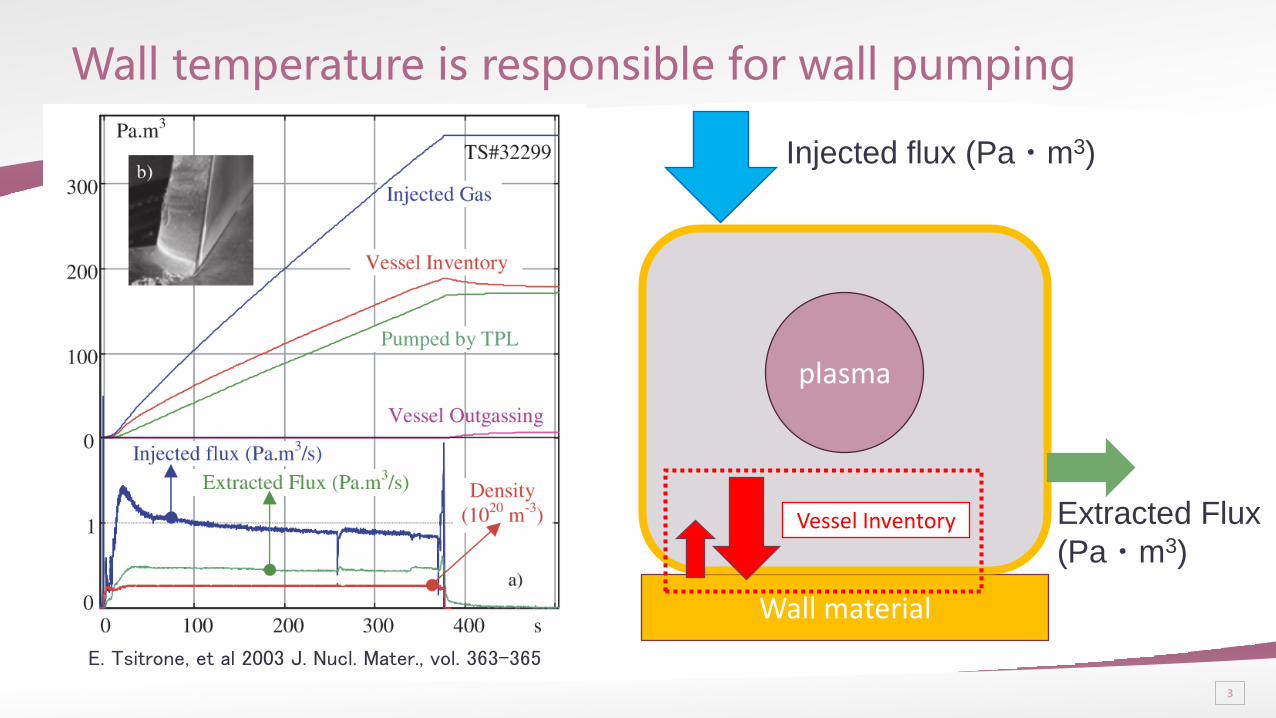
Wall temperature is responsible for wall pumping
Wall material
plasma
Injected flux (Pa・m3)
Extracted Flux
(Pa・m3) Vessel Inventory
E. Tsitrone, et al 2003 J. Nucl. Mater., vol. 363–365
4
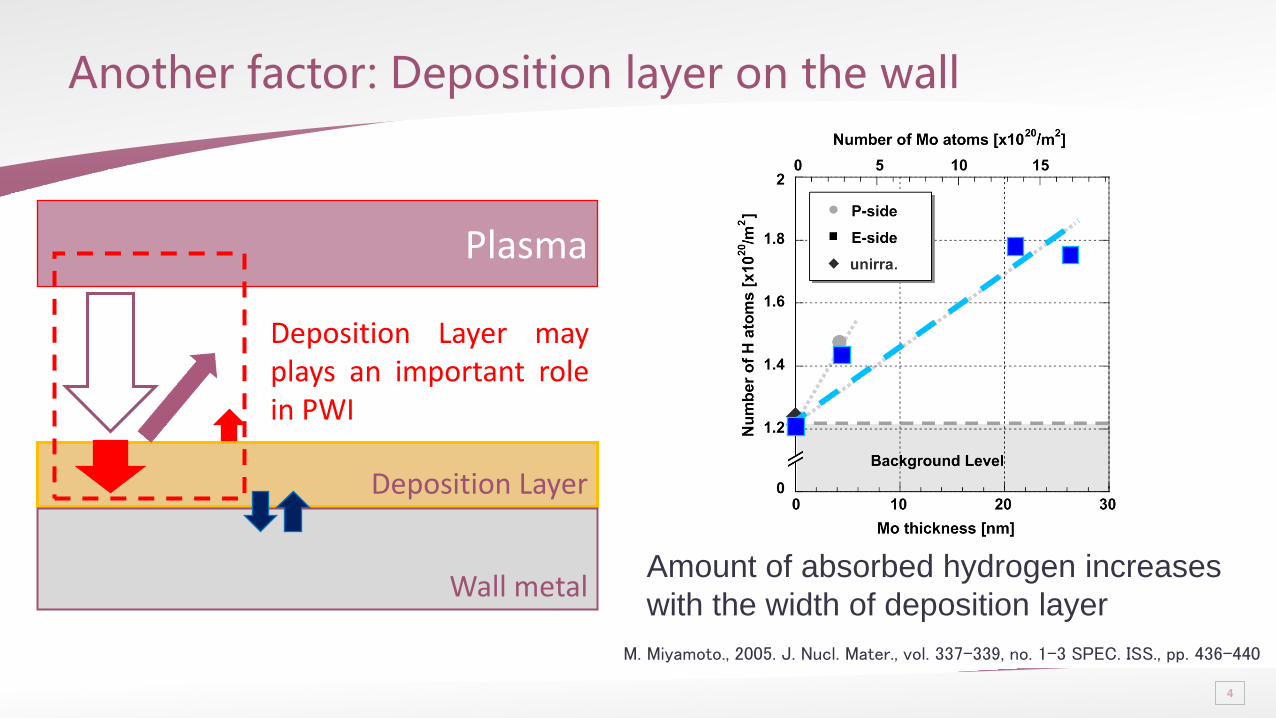
Another factor: Deposition layer on the wall
Deposition Layer
Plasma
Wall metal
Deposition Layer may plays an important role in PWI
Amount of absorbed hydrogen increases
with the width of deposition layer
M. Miyamoto., 2005. J. Nucl. Mater., vol. 337–339, no. 1–3 SPEC. ISS., pp. 436–440
5
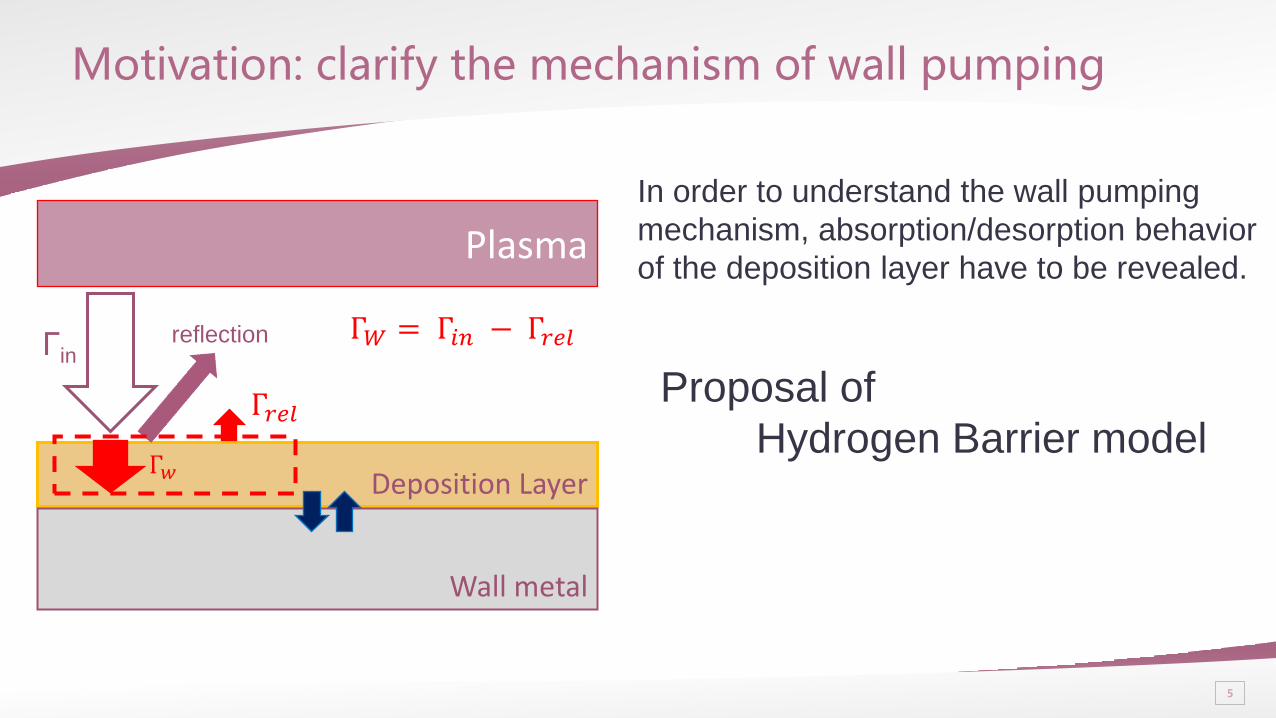
Motivation: clarify the mechanism of wall pumping
Deposition Layer
Plasma
Wall metal
Γ𝑤
Γ𝑟𝑒𝑙
reflection
In order to understand the wall pumping
mechanism, absorption/desorption behavior
of the deposition layer have to be revealed.
Proposal of
Hydrogen Barrier model
Γin Γ𝑊 = Γ𝑖𝑛 − Γ𝑟𝑒𝑙
6
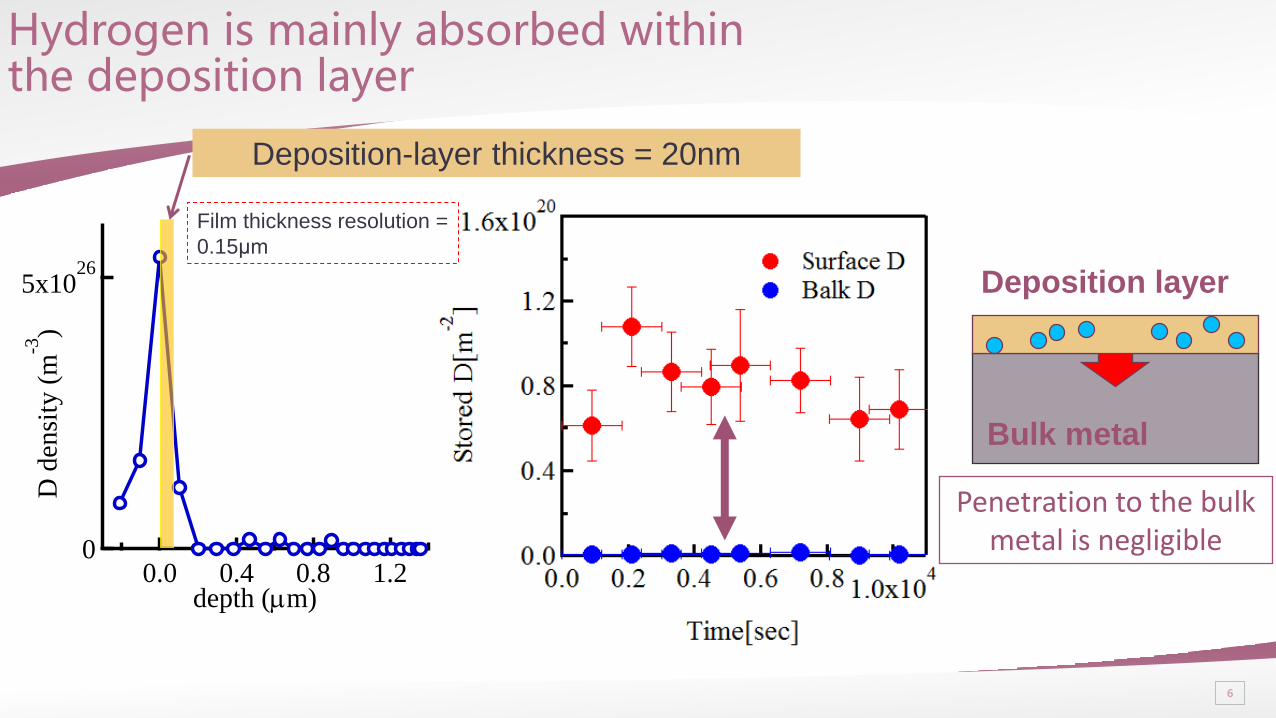
Hydrogen is mainly absorbed within the deposition layer
5x1026
0
D d
ensi
ty (
m-3
)
1.20.80.40.0depth (m)
重水素分布
分解能150nm
Deposition-layer thickness = 20nm
Deposition layer
Penetration to the bulk metal is negligible
Bulk metal
Film thickness resolution =
0.15μm
7
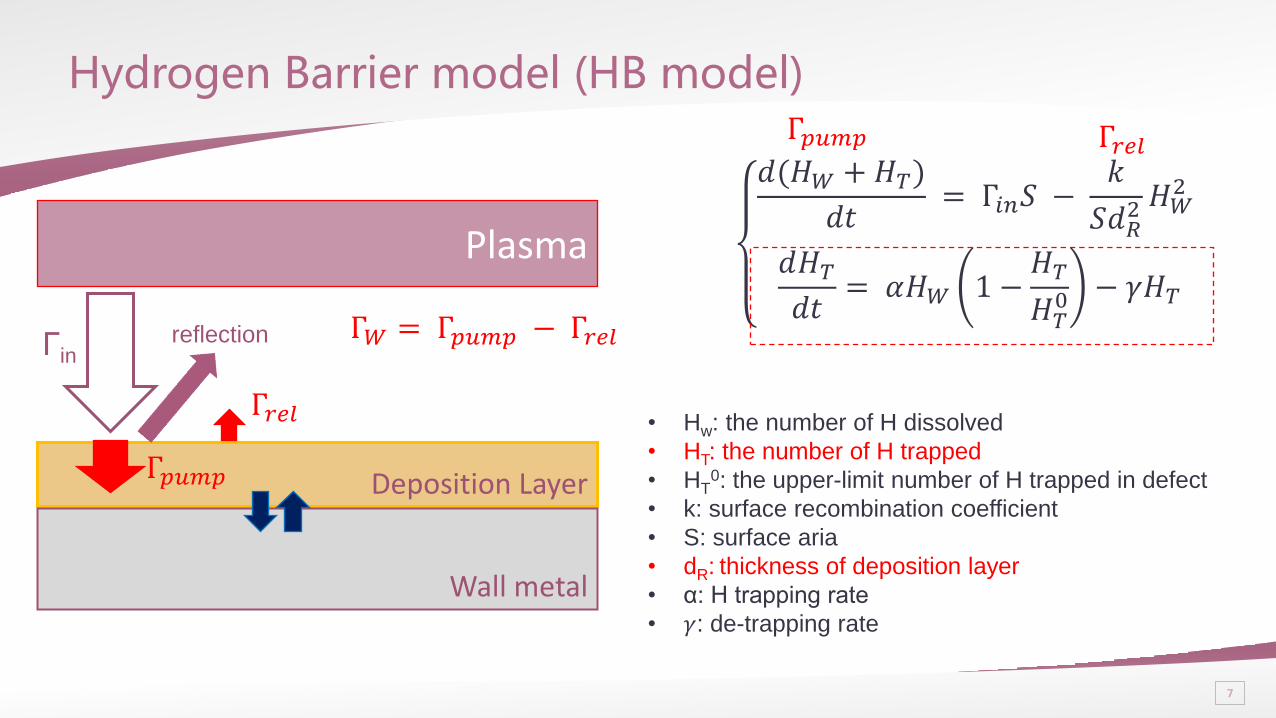
Hydrogen Barrier model (HB model)
Deposition Layer
Plasma
Wall metal
Γ𝑝𝑢𝑚𝑝
Γ𝑟𝑒𝑙
reflection Γin Γ𝑊 = Γ𝑝𝑢𝑚𝑝 − Γ𝑟𝑒𝑙
𝑑(𝐻𝑊 + 𝐻𝑇)
𝑑𝑡 = Γ𝑖𝑛𝑆 −
𝑘
𝑆𝑑𝑅2 𝐻𝑊
2
𝑑𝐻𝑇
𝑑𝑡= 𝛼𝐻𝑊 1 −
𝐻𝑇
𝐻𝑇0 − 𝛾𝐻𝑇
• Hw: the number of H dissolved
• HT: the number of H trapped
• HT0: the upper-limit number of H trapped in defect
• k: surface recombination coefficient
• S: surface aria
• dR: thickness of deposition layer
• α: H trapping rate
• 𝛾: de-trapping rate
Γ𝑝𝑢𝑚𝑝 Γ𝑟𝑒𝑙
8
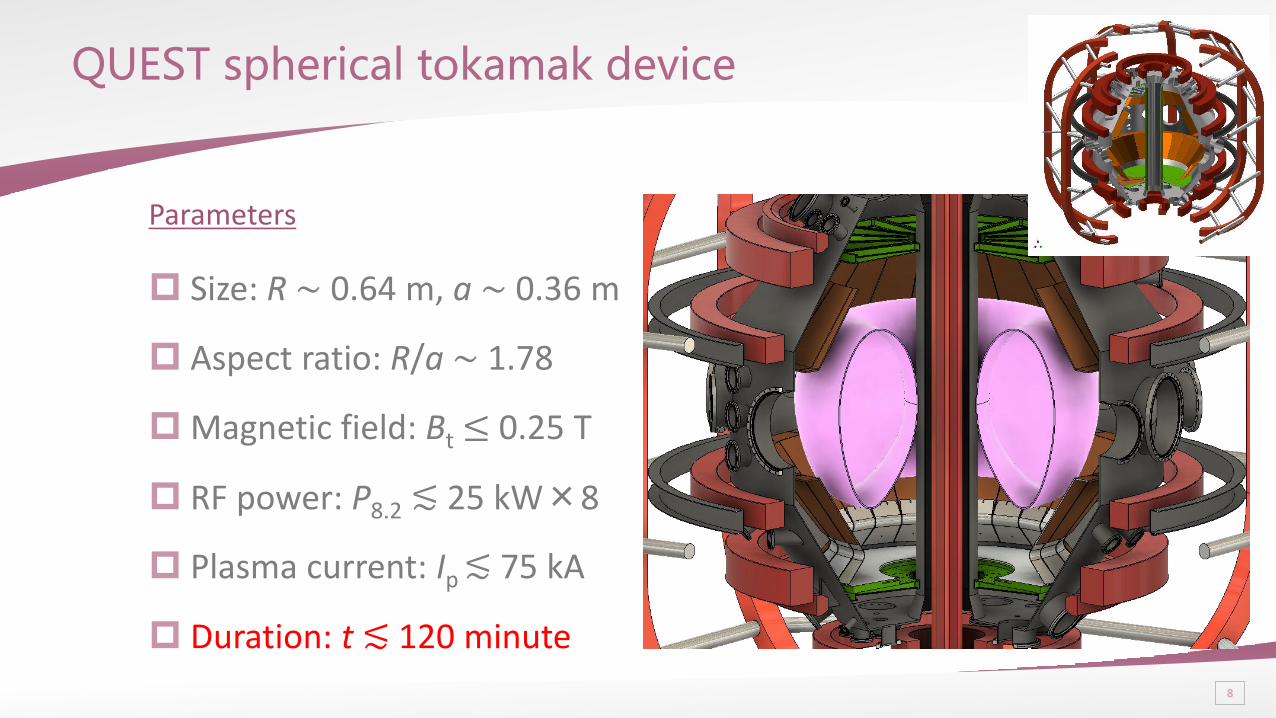
QUEST spherical tokamak device
Parameters
Size: R ~ 0.64 m, a ~ 0.36 m
Aspect ratio: R/a ~ 1.78
Magnetic field: Bt ≤ 0.25 T
RF power: P8.2 ≲ 25 kW×8
Plasma current: Ip ≲ 75 kA
Duration: t ≲ 120 minute
9
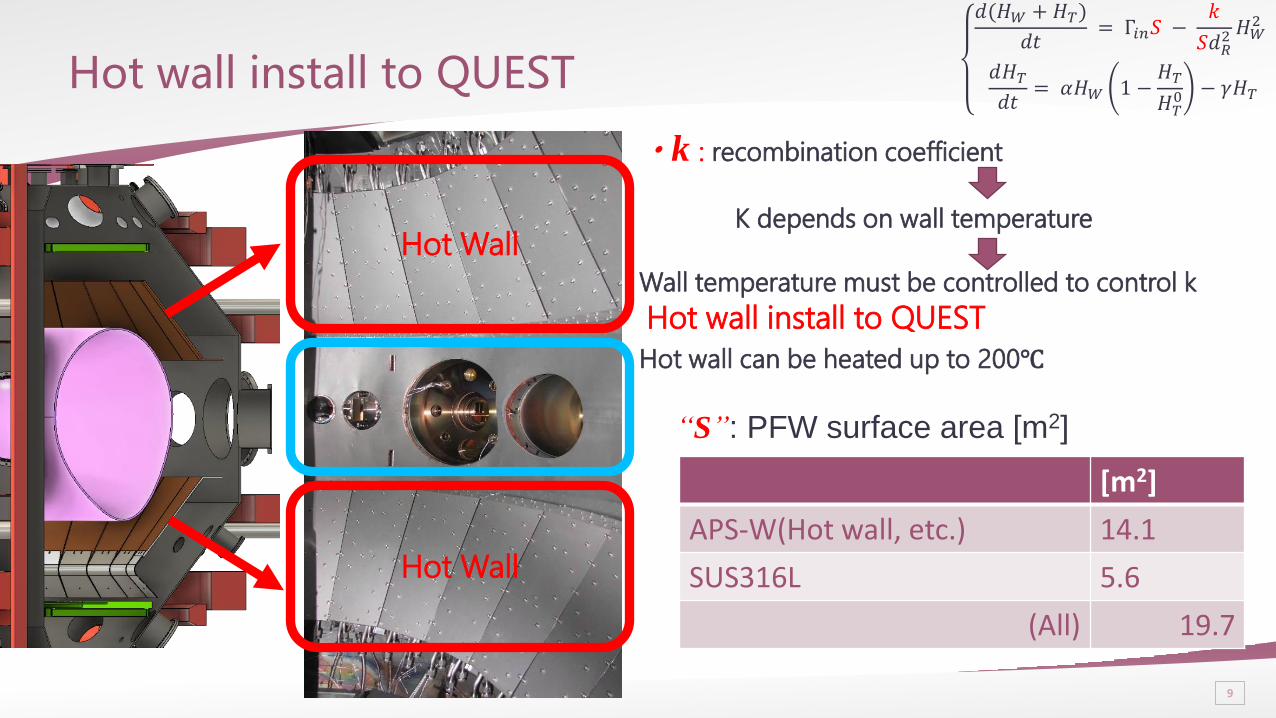
Hot wall install to QUEST
Hot Wall
Hot Wall
・k : recombination coefficient
K depends on wall temperature
Wall temperature must be controlled to control k
Hot wall install to QUEST
Hot wall can be heated up to 200℃
“S”: PFW surface area [m2]
[m2]
APS-W(Hot wall, etc.) 14.1
SUS316L 5.6
(All) 19.7
𝑑(𝐻𝑊 + 𝐻𝑇)
𝑑𝑡 = Γ𝑖𝑛𝑆 −
𝑘
𝑆𝑑𝑅2 𝐻𝑊
2
𝑑𝐻𝑇
𝑑𝑡= 𝛼𝐻𝑊 1 −
𝐻𝑇
𝐻𝑇0 − 𝛾𝐻𝑇
10
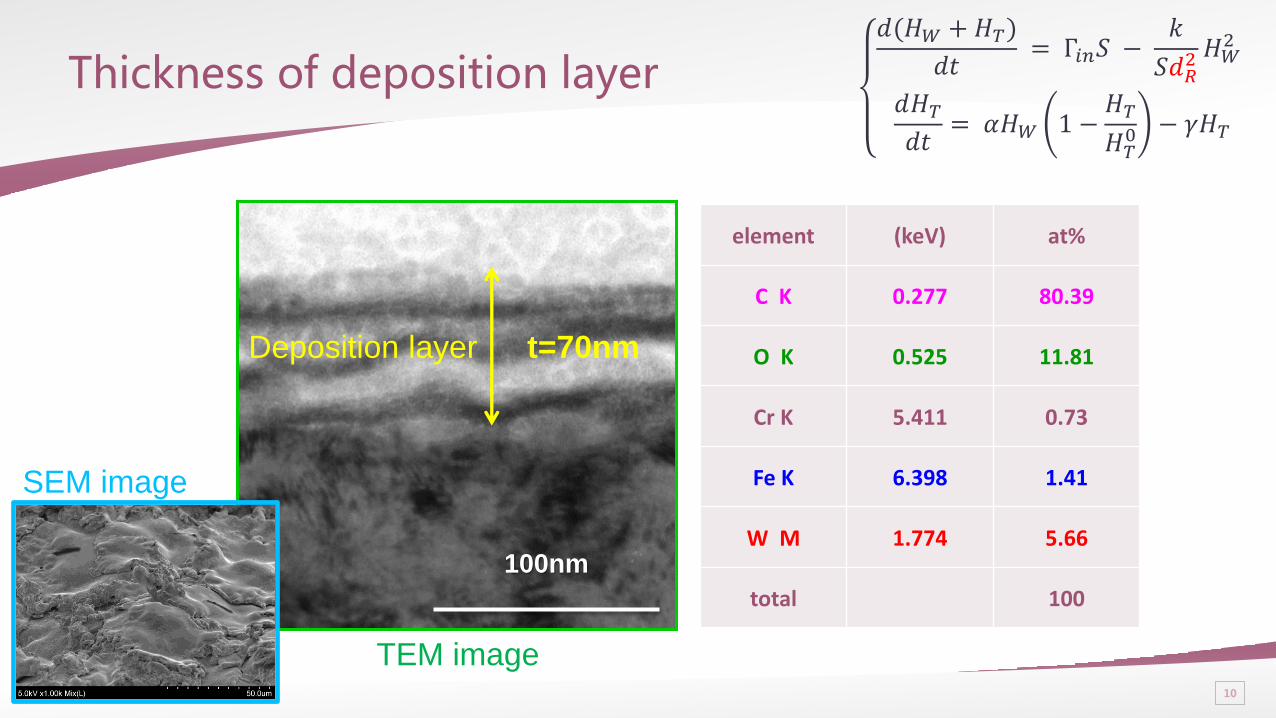
Thickness of deposition layer 𝑑(𝐻𝑊 + 𝐻𝑇)
𝑑𝑡 = Γ𝑖𝑛𝑆 −
𝑘
𝑆𝑑𝑅2 𝐻𝑊
2
𝑑𝐻𝑇
𝑑𝑡= 𝛼𝐻𝑊 1 −
𝐻𝑇
𝐻𝑇0 − 𝛾𝐻𝑇
100nm
Deposition layer t=70nm
element (keV) at%
C K 0.277 80.39
O K 0.525 11.81
Cr K 5.411 0.73
Fe K 6.398 1.41
W M 1.774 5.66
total 100
TEM image
SEM image
11
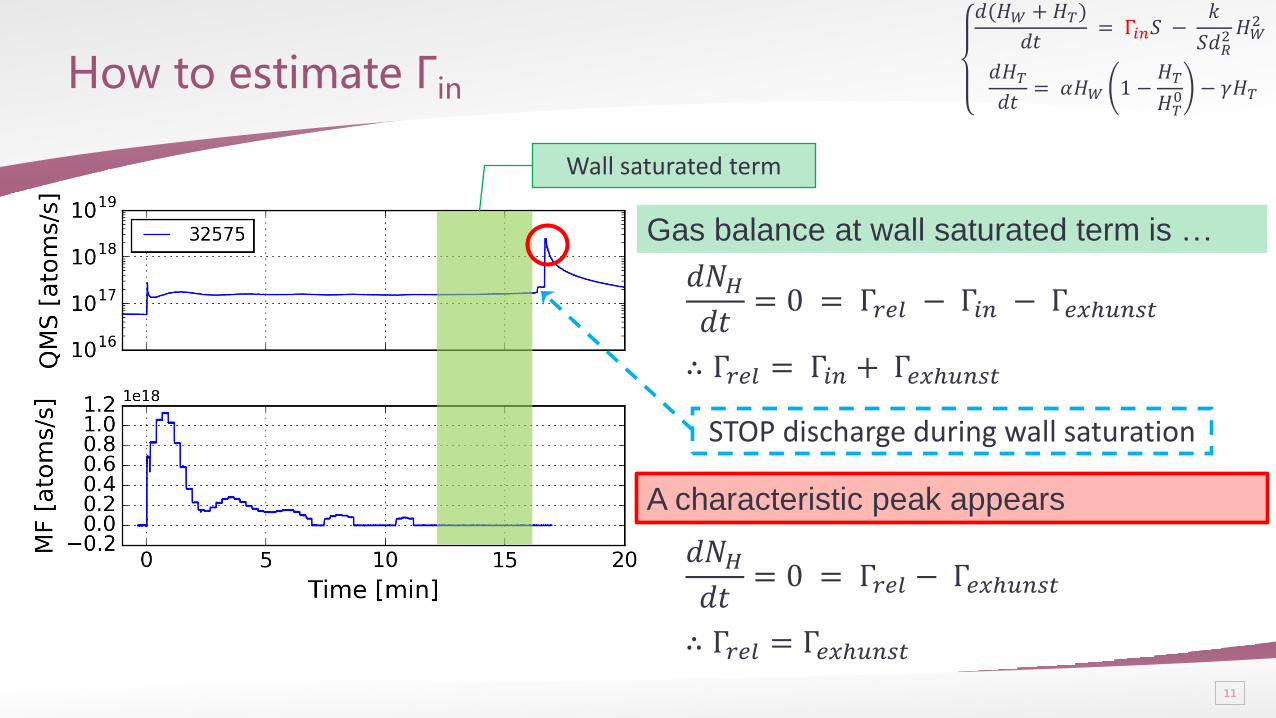
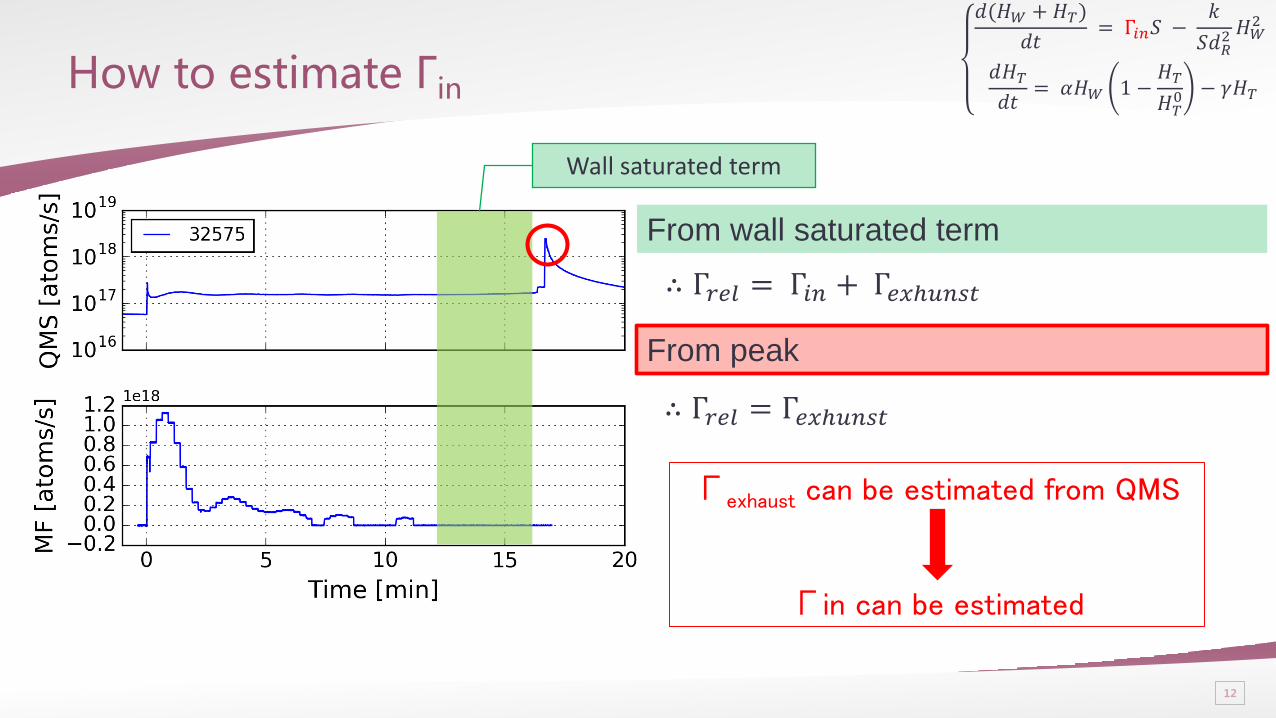
How to estimate Γin
Wall saturated term
Gas balance at wall saturated term is …
𝑑𝑁𝐻
𝑑𝑡= 0 = Γ𝑟𝑒𝑙 − Γ𝑖𝑛 − Γ𝑒𝑥ℎ𝑢𝑛𝑠𝑡
∴ Γ𝑟𝑒𝑙 = Γ𝑖𝑛 + Γ𝑒𝑥ℎ𝑢𝑛𝑠𝑡
𝑑𝑁𝐻
𝑑𝑡= 0 = Γ𝑟𝑒𝑙 − Γ𝑒𝑥ℎ𝑢𝑛𝑠𝑡
∴ Γ𝑟𝑒𝑙 = Γ𝑒𝑥ℎ𝑢𝑛𝑠𝑡
STOP discharge during wall saturation
A characteristic peak appears
𝑑(𝐻𝑊 + 𝐻𝑇)
𝑑𝑡 = Γ𝑖𝑛𝑆 −
𝑘
𝑆𝑑𝑅2 𝐻𝑊
2
𝑑𝐻𝑇
𝑑𝑡= 𝛼𝐻𝑊 1 −
𝐻𝑇
𝐻𝑇0 − 𝛾𝐻𝑇
12
How to estimate Γin
Wall saturated term
From wall saturated term
∴ Γ𝑟𝑒𝑙 = Γ𝑖𝑛 + Γ𝑒𝑥ℎ𝑢𝑛𝑠𝑡
∴ Γ𝑟𝑒𝑙 = Γ𝑒𝑥ℎ𝑢𝑛𝑠𝑡
From peak
Γexhaust can be estimated from QMS ↓
Γin can be estimated
𝑑(𝐻𝑊 + 𝐻𝑇)
𝑑𝑡 = Γ𝑖𝑛𝑆 −
𝑘
𝑆𝑑𝑅2 𝐻𝑊
2
𝑑𝐻𝑇
𝑑𝑡= 𝛼𝐻𝑊 1 −
𝐻𝑇
𝐻𝑇0 − 𝛾𝐻𝑇
13
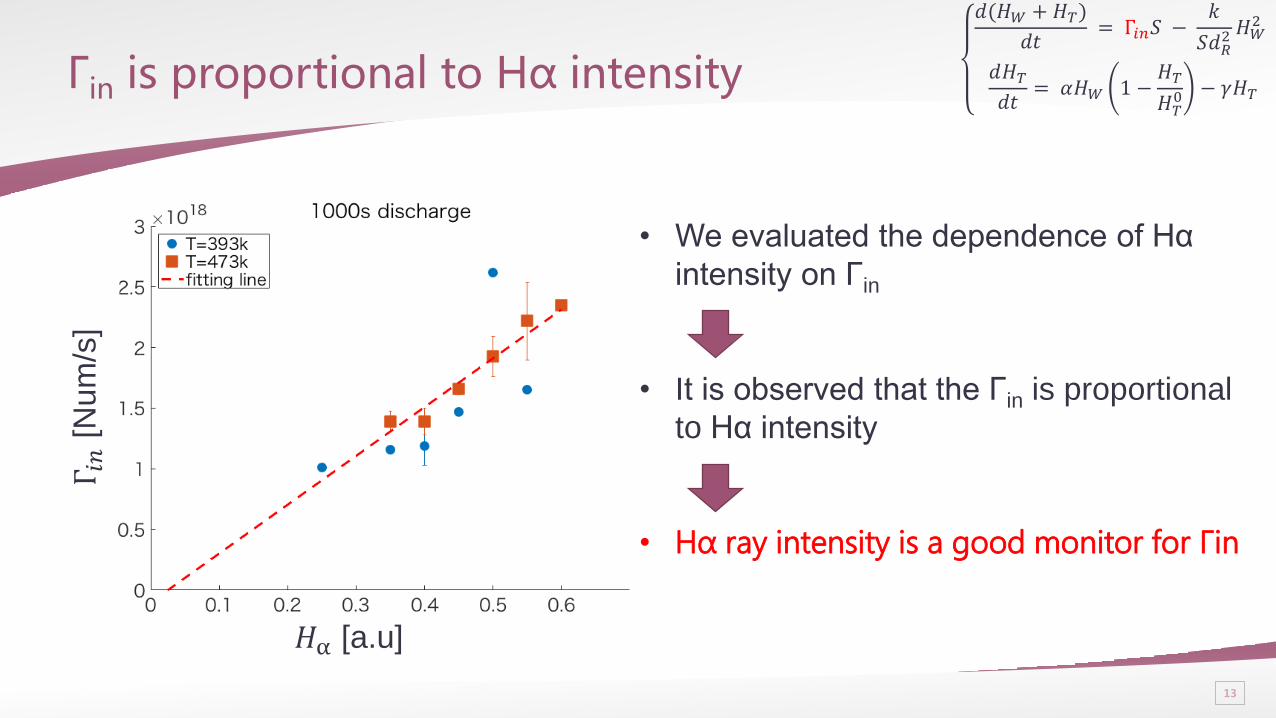
Γin is proportional to Hα intensity Γ 𝑖
𝑛 [N
um
/s]
𝐻α [a.u]
• We evaluated the dependence of Hα
intensity on Γin
• It is observed that the Γin is proportional
to Hα intensity
• Hα ray intensity is a good monitor for Γin
𝑑(𝐻𝑊 + 𝐻𝑇)
𝑑𝑡 = Γ𝑖𝑛𝑆 −
𝑘
𝑆𝑑𝑅2 𝐻𝑊
2
𝑑𝐻𝑇
𝑑𝑡= 𝛼𝐻𝑊 1 −
𝐻𝑇
𝐻𝑇0 − 𝛾𝐻𝑇
14
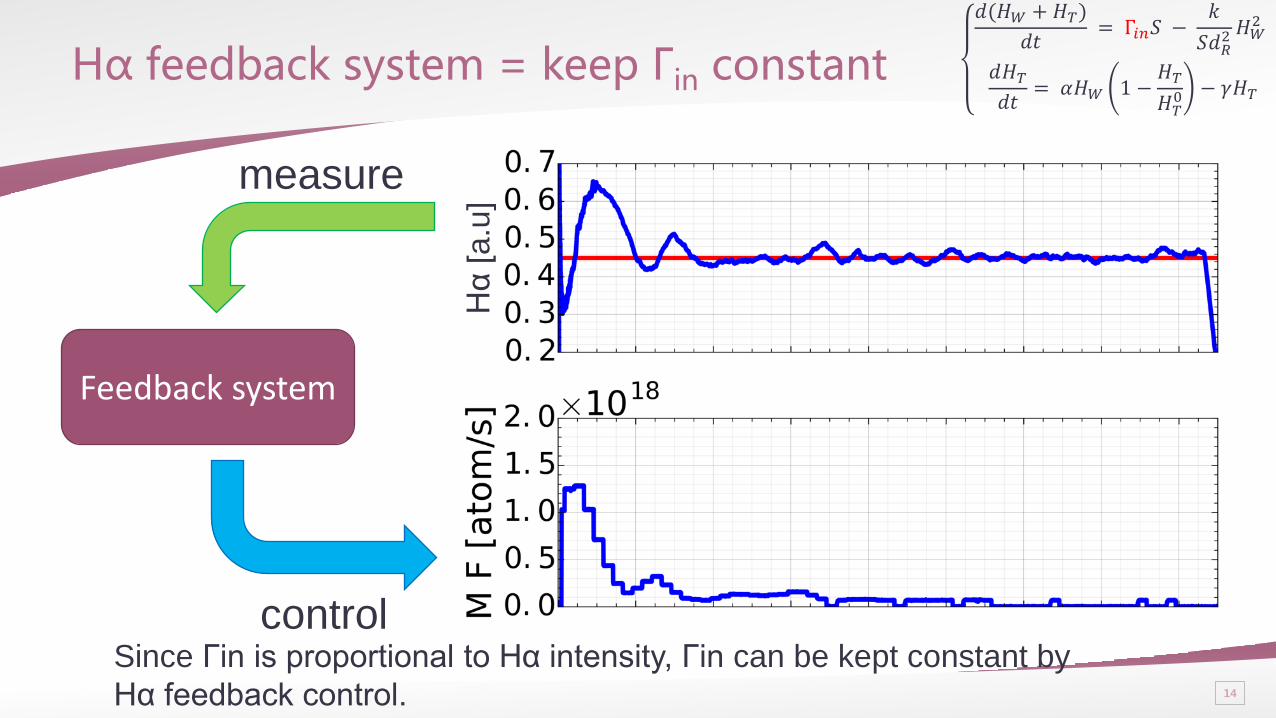
Hα feedback system = keep Γin constant
Feedback system
measure
control
Hα
[a.u
]
Since Γin is proportional to Hα intensity, Γin can be kept constant by
Hα feedback control.
𝑑(𝐻𝑊 + 𝐻𝑇)
𝑑𝑡 = Γ𝑖𝑛𝑆 −
𝑘
𝑆𝑑𝑅2 𝐻𝑊
2
𝑑𝐻𝑇
𝑑𝑡= 𝛼𝐻𝑊 1 −
𝐻𝑇
𝐻𝑇0 − 𝛾𝐻𝑇
15
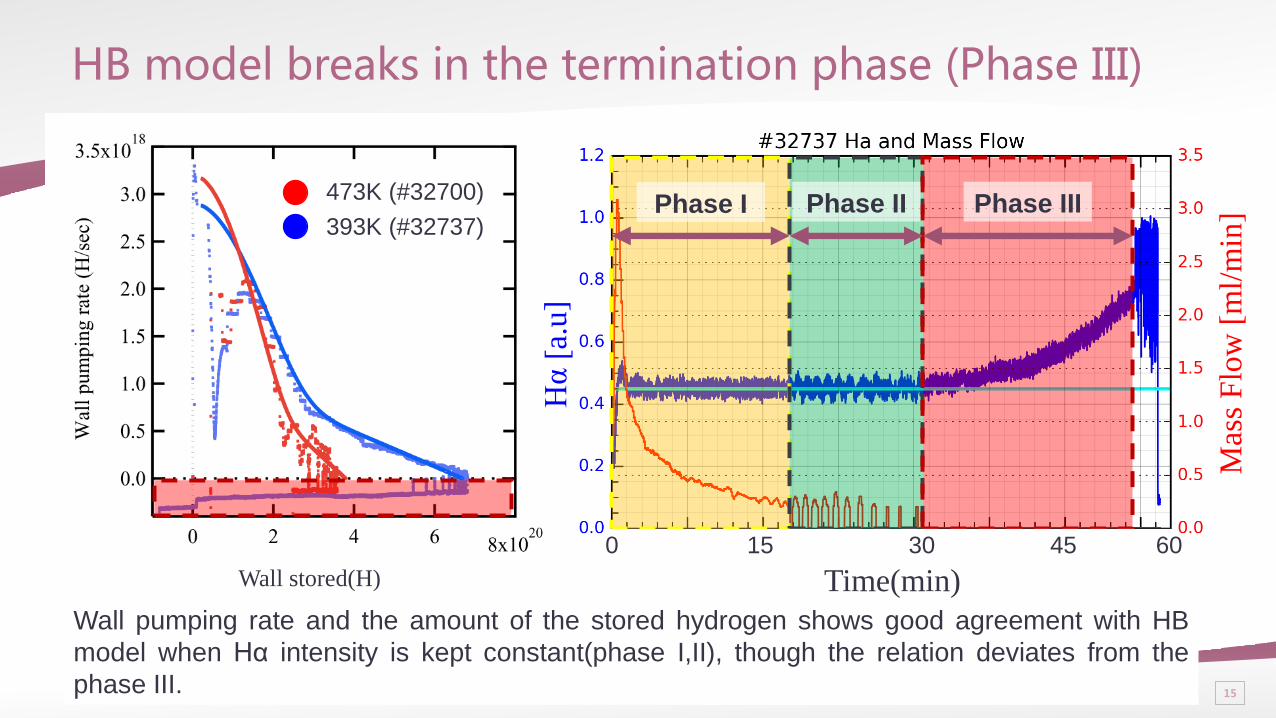
393K (#32737)
473K (#32700)
Wall stored(H)
HB model breaks in the termination phase (Phase III)
Wall pumping rate and the amount of the stored hydrogen shows good agreement with HB
model when Hα intensity is kept constant(phase I,II), though the relation deviates from the
phase III.
Phase I Phase II Phase III
0 15 30 45 60
Time(min) H
α [
a.u
]
Mas
s F
low
[m
l/m
in]
16
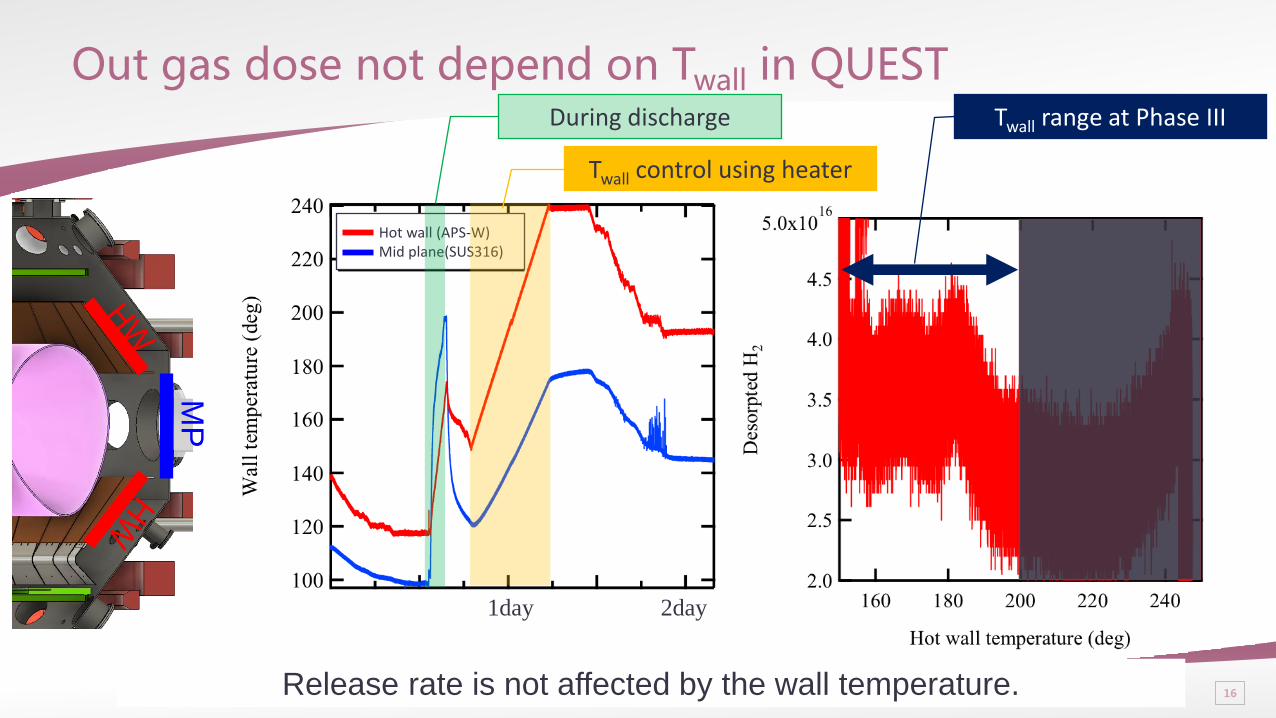
Out gas dose not depend on Twall in QUEST
MP
1day 2day
Hot wall (APS-W) Mid plane(SUS316)
During discharge
Twall control using heater
Twall range at Phase III
Release rate is not affected by the wall temperature.
17
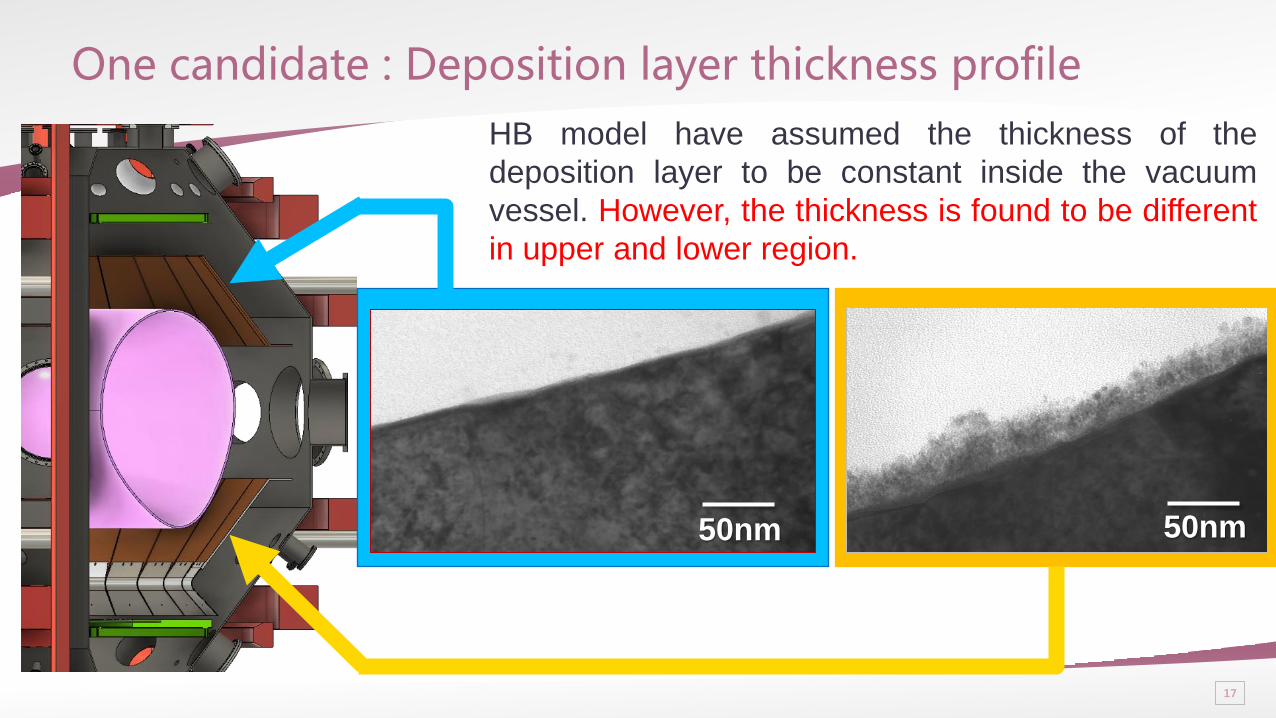
One candidate : Deposition layer thickness profile
Fig 2B TEM cross section image of
deposition layer at lower side
Fig 2B TEM cross section image of
deposition layer at lower side
50nm 50nm
HB model have assumed the thickness of the
deposition layer to be constant inside the vacuum
vessel. However, the thickness is found to be different
in upper and lower region.
18
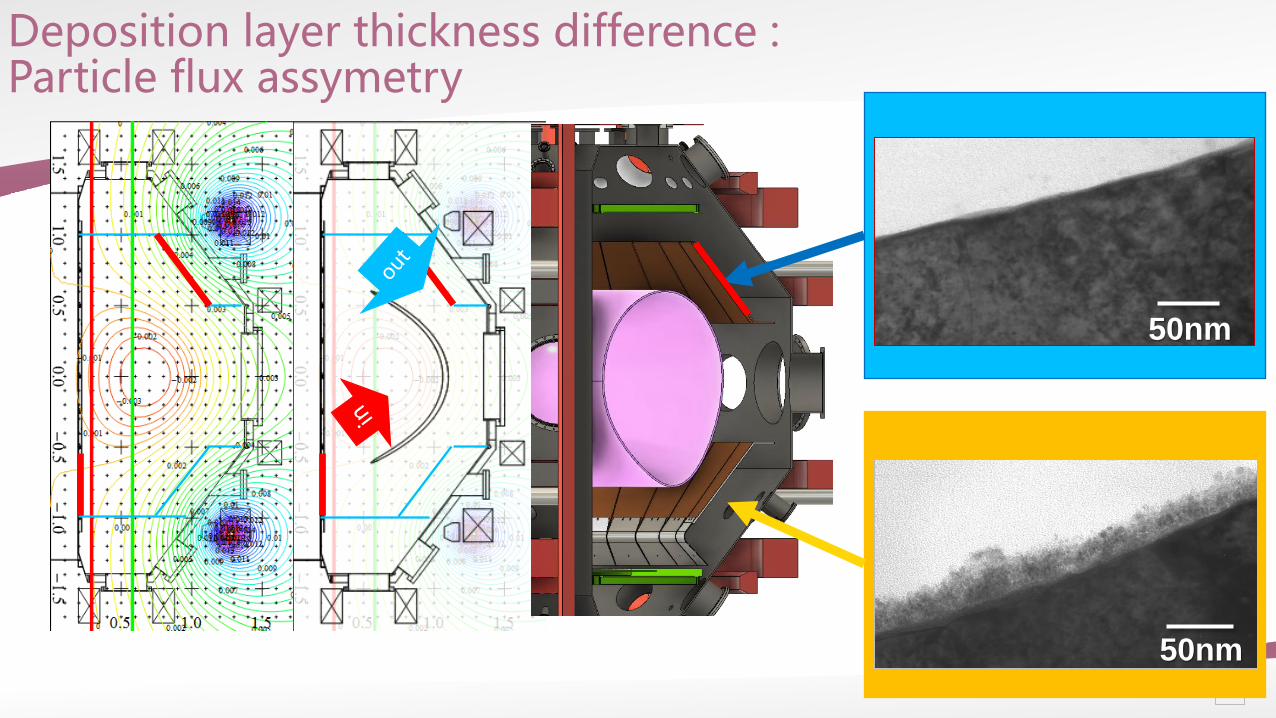
Deposition layer thickness difference : Particle flux assymetry
Fig 2B TEM cross section image of
deposition layer at lower side
Fig 2B TEM cross section image of
deposition layer at lower side
50nm
50nm
19
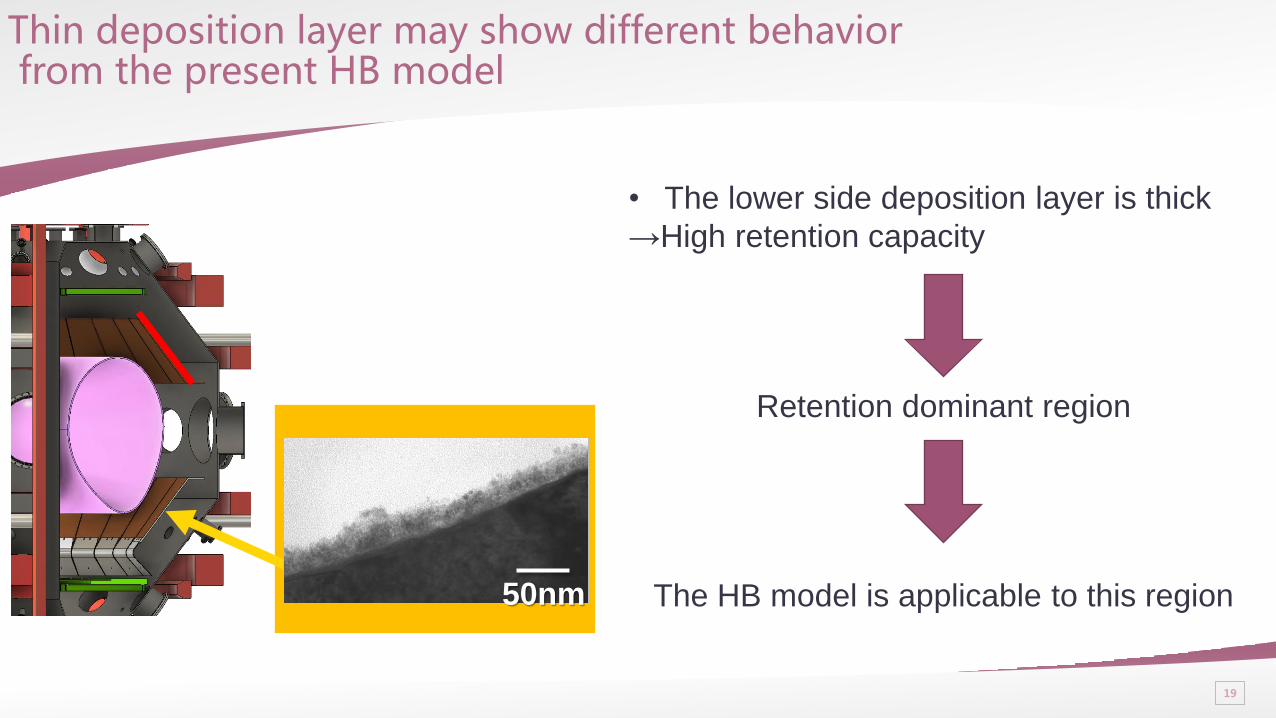
Thin deposition layer may show different behavior from the present HB model
Fig 2B TEM cross section
image of deposition layer at lower side
50nm
Retention dominant region
• The lower side deposition layer is thick
→High retention capacity
The HB model is applicable to this region
20
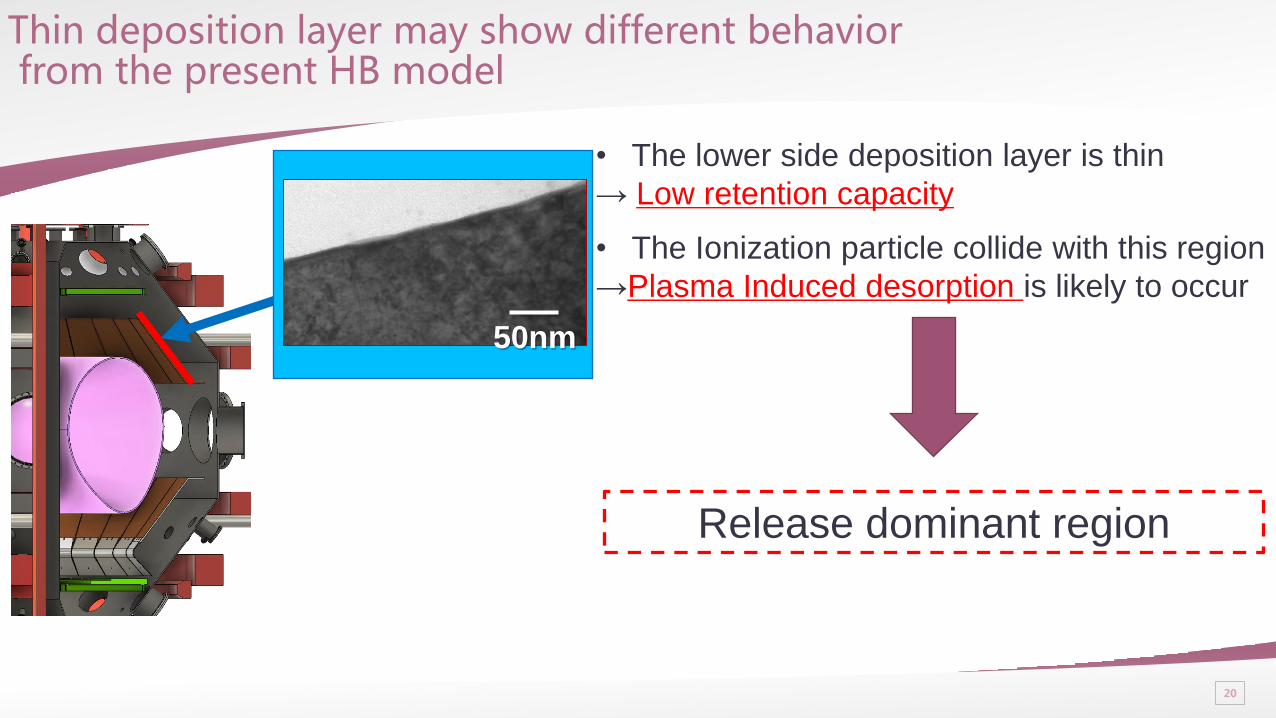
Fig 2B TEM cross section
image of deposition layer at lower side
50nm
Release dominant region
• The lower side deposition layer is thin
→ Low retention capacity
• The Ionization particle collide with this region
→Plasma Induced desorption is likely to occur
Thin deposition layer may show different behavior from the present HB model
21
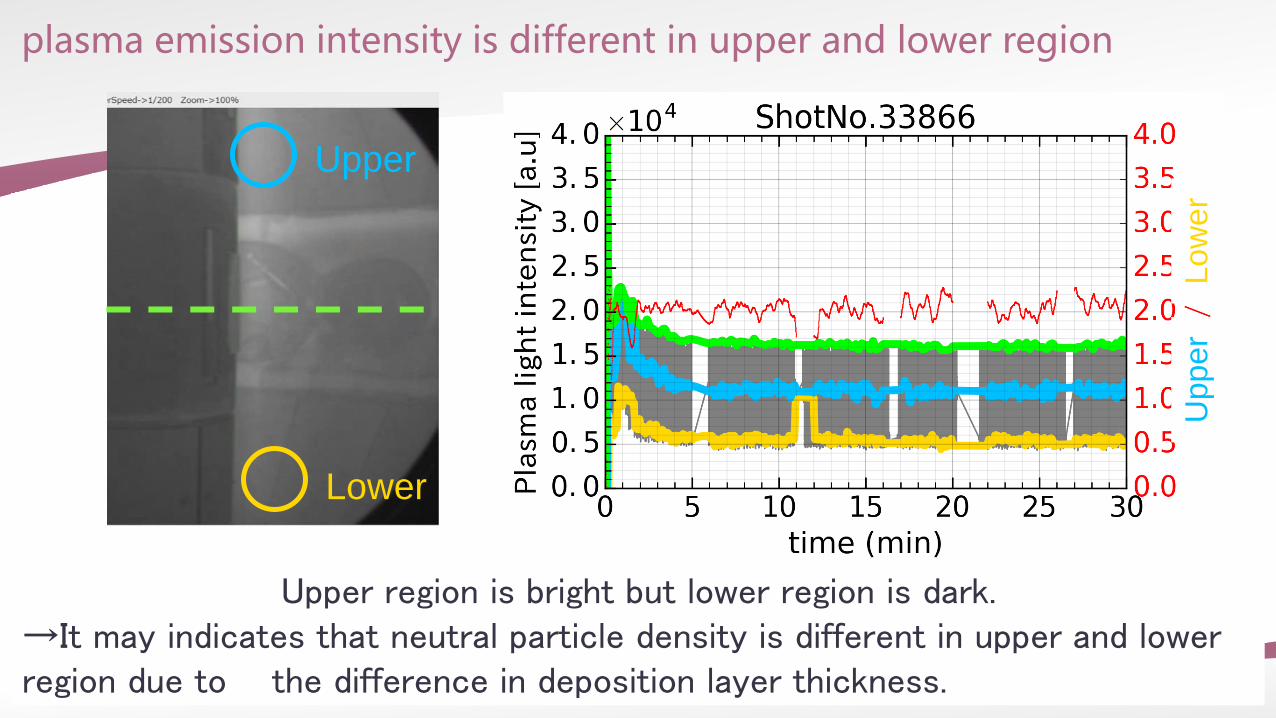
plasma emission intensity is different in upper and lower region
Upper
Lower
Upp
er
Low
er
Upper region is bright but lower region is dark. →It may indicates that neutral particle density is different in upper and lower region due to the difference in deposition layer thickness.
22
Summary
• Hydrogen Barrier model (HB model) is tested in long duration discharge on
QUEST.
• HB model is consistent until the termination phase.
• It is observed that the deposition layer is different in upper and lower region.
• Absorption/Desorption behavior may be different depending on the thickness
of the deposition layer.
Future Work
Clarify the absorption / release behavior in the APS-W wall without deposition
layer

Thank you For Your Listening
24
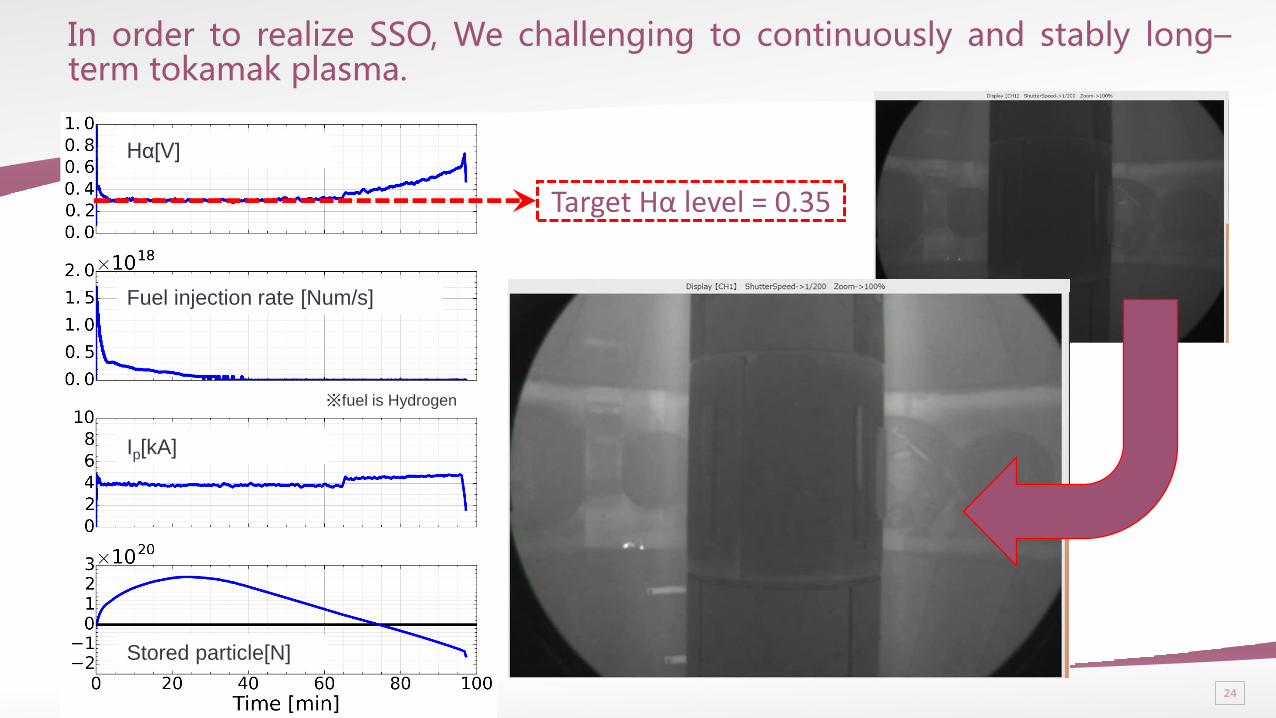
In order to realize SSO, We challenging to continuously and stably long–term tokamak plasma.
Fuel injection rate [Num/s]
Hα[V]
Stored particle[N]
Ip[kA]
※fuel is Hydrogen
Target Hα level = 0.35
25
26
Hα
[a
.u]
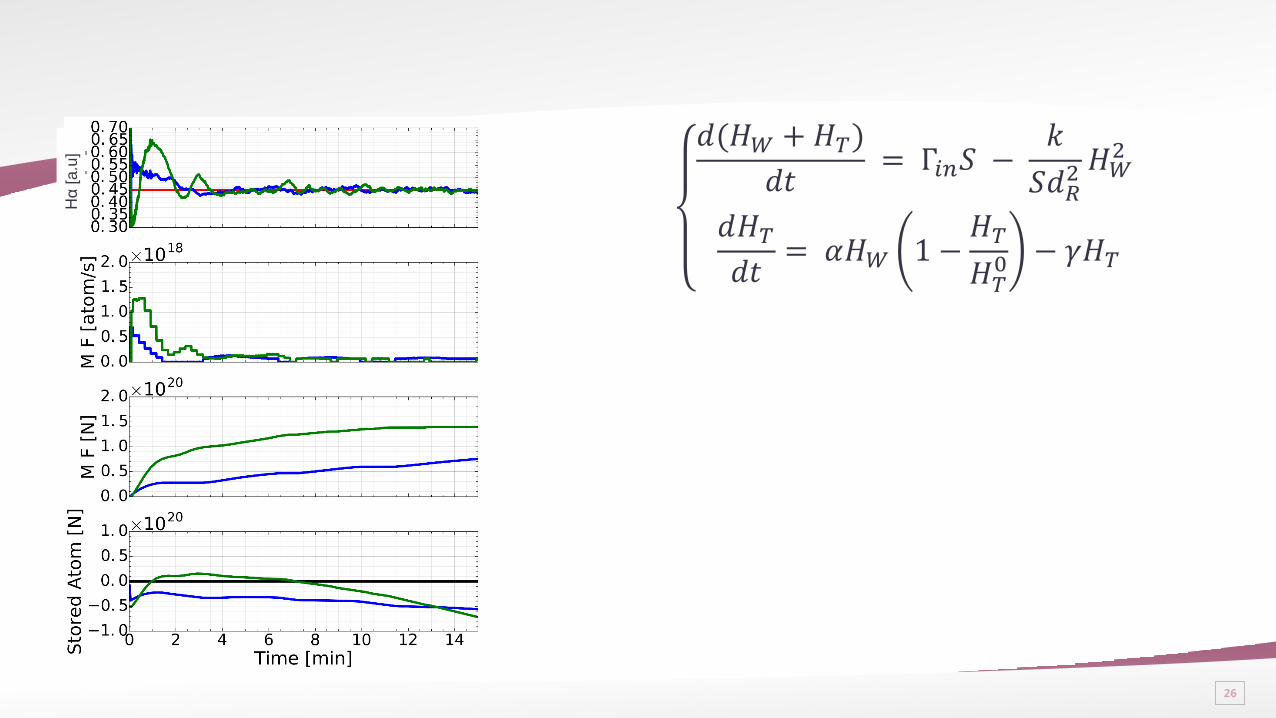
𝑑(𝐻𝑊 + 𝐻𝑇)
𝑑𝑡 = Γ𝑖𝑛𝑆 −
𝑘
𝑆𝑑𝑅2 𝐻𝑊
2
𝑑𝐻𝑇
𝑑𝑡= 𝛼𝐻𝑊 1 −
𝐻𝑇
𝐻𝑇0 − 𝛾𝐻𝑇
27
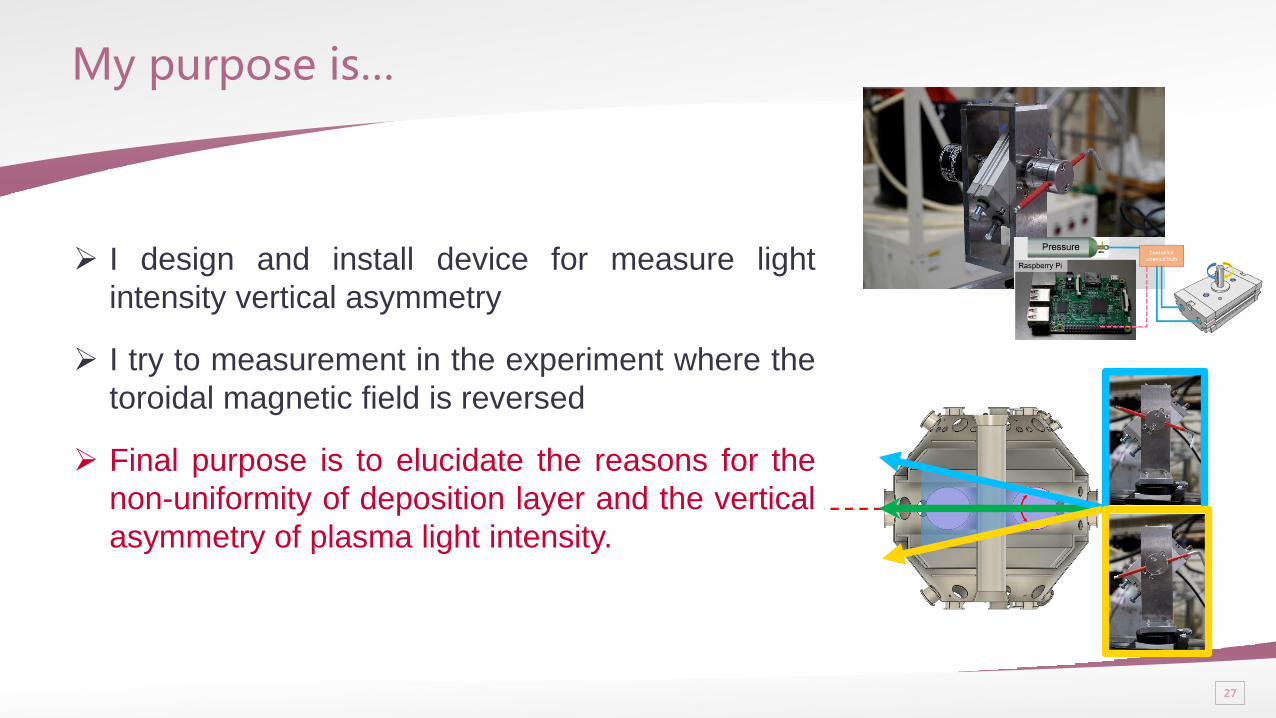
My purpose is…
I design and install device for measure light
intensity vertical asymmetry
I try to measurement in the experiment where the
toroidal magnetic field is reversed
Final purpose is to elucidate the reasons for the
non-uniformity of deposition layer and the vertical
asymmetry of plasma light intensity.
28
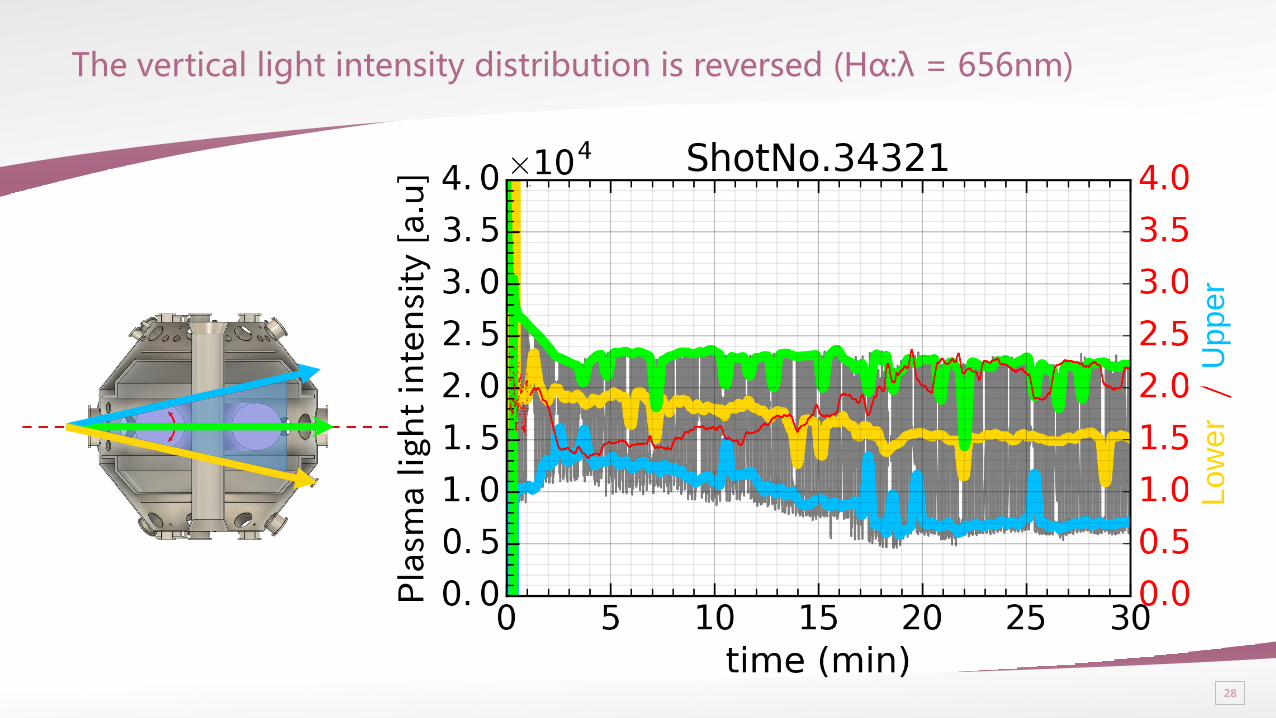
Upper
Low
er
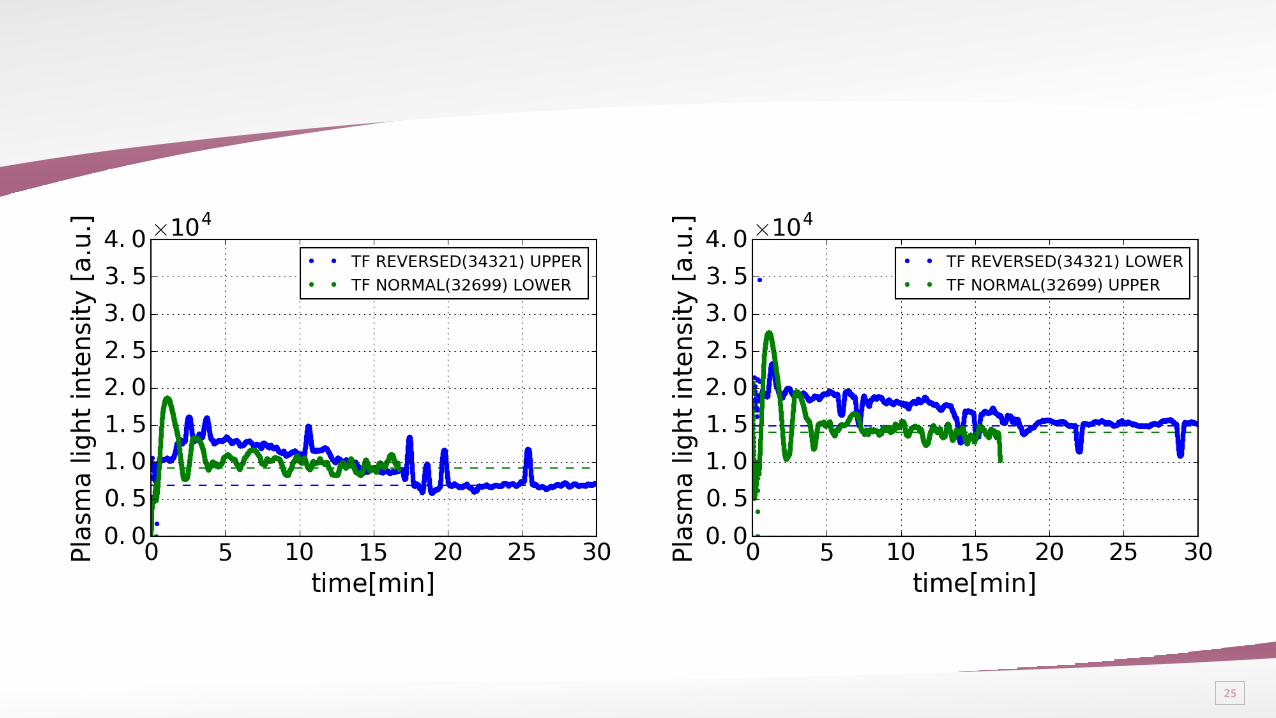
The vertical light intensity distribution is reversed (Hα:λ = 656nm)
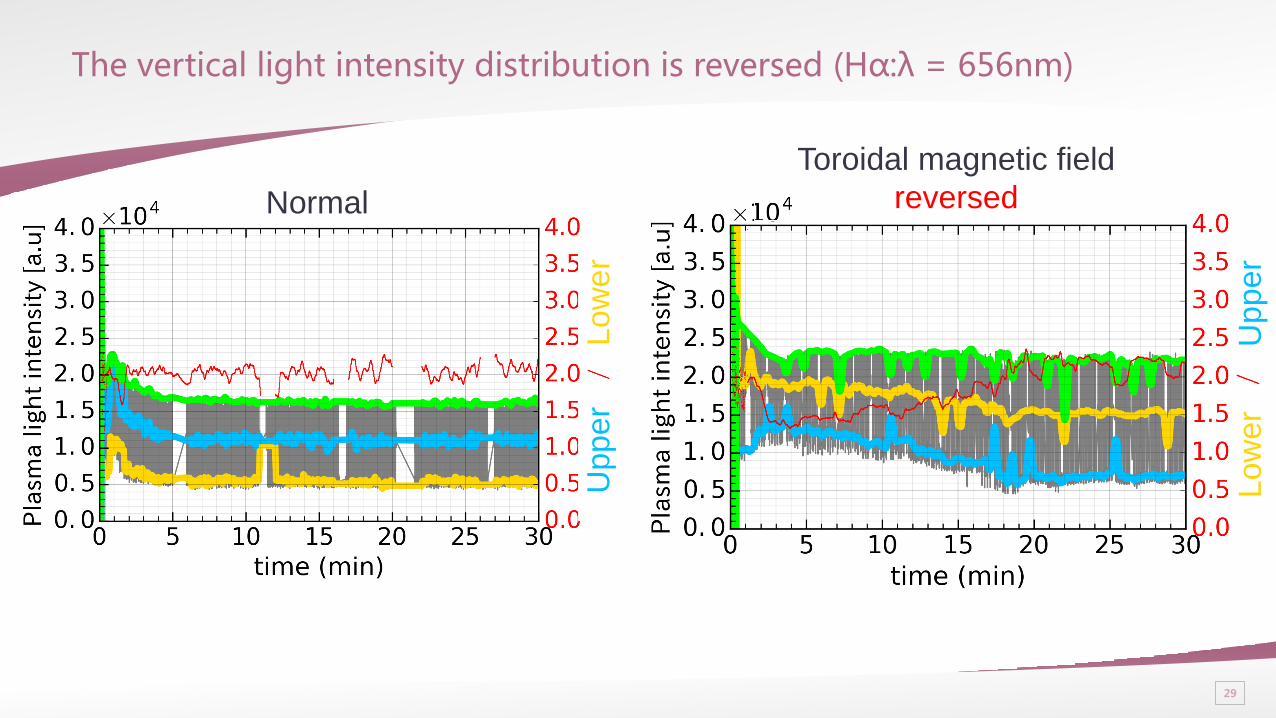
29
Upper
Low
er
Normal
Up
per
Low
er
Toroidal magnetic field
reversed
The vertical light intensity distribution is reversed (Hα:λ = 656nm)