investigationofhighperformanceconfig- urations on the
TRANSCRIPT

Investigation of high performance config-urations on the Evolved Packet Gateway
Master’s thesis in Computer science and engineering
TSIGABU MEBRAHTU BIRHANU
GEORGIOS CHATZIADAM
Department of Computer Science and Engineering
Chalmers University of Technology
University of Gothenburg
Gothenburg, Sweden 2020


Master’s thesis 2020
Investigation of high performance con�gurations onthe Evolved Packet Gateway
TSIGABU MEBRAHTU BIRHANUGEORGIOS CHATZIADAM
Department of Computer Science and EngineeringChalmers University of Technology
University of GothenburgGothenburg, Sweden 2020

Investigation of high performance con�gurations on the Evolved Packet Gateway
TSIGABU MEBRAHTU BIRHANUGEORGIOS CHATZIADAM
© TSIGABU MEBRAHTU BIRHANU AND GEORGIOS CHATZIADAM, 2020.
Supervisor: Romaric Duvignau, Computer Science and Engineering DepartmentSupervisor: Ivan Walulya, Computer Science and Engineering DepartmentAdvisor: Patrik Nyman, Ericsson ABExaminer: Philippas Tsigas, Computer Science and Engineering Department
Master’s Thesis 2020Department of Computer Science and EngineeringChalmers University of Technology and University of GothenburgSE-412 96 GothenburgTelephone +46 31 772 1000
Gothenburg, Sweden 2020
iii

Abstract
Modern servers today are based on multi-socket motherboards to increase their powerand performance �gures. These setups provide CPU interconnection through a highspeed bus. If processes on one CPU need access to memory or devices local to anotherCPU, they need to traverse this bus and this adds a delay to the execution time. Thisis where the concept of Non-Uniform Memory Access (NUMA) presents as a solution.Every socket with its local memory is considered a node, that is locked and processesare not allowed to migrate. This means that loading instructions has low latency, butthey can also access the main memory connected to the other NUMA nodes at a givenpenalty cost. The latest CPUs such as the EPYC series from AMD are using this concepteven within the processor module, and there is no possibility to avoid taking into ac-count NUMA aspects.
There has been a plethora of benchmarks to analyze the impact of NUMA node archi-tecture on di�erent processors. In this work, we have used the Packet Gateway of theEvolved Packet Core (EPC) as a test case to investigate the e�ectiveness of NUMA archi-tecture on Intel processors on a virtual large-scale distributed production system withhigh performance requirements. On the virtualization setups, di�erent CPU pining anddeployment strategies are used, while Packet Per Second (pps) is the preferred perfor-mance indicator in systems like the Evolved Packet Gateway (EPG). We further describeand analyze di�erent scenarios, combining CPU pinning and process placement, withinthe virtual machines running the EPG.
Keywords: NUMA, EPG, Computer Science, engineering, project, thesis.
iv

Acknowledgements
We would �rst like to thank our examiner Philippas Tsigas and our supervisors RomaricDuvignau and Ivan Walulya of the Computer Science and Engineering Department atChalmers University of Technology. Their door has always been open for us when weran into a trouble spot or had questions about our work, and their support and guidancewas of extreme importance for the completion of this project.
We would also like to thank our supervisor at Ericsson, Patrik Nyman, who assistedus in all stages of our research and made us feel like home by always checking in on usand being very immediate in his responses and actions. The technical experts involvedin this project: Oscar Leijon, Jonas Hemlin, Patrik Hermansson and Devakumar Kannanprovided critical support and are undoubtedly an important part of it.
Finally, we want to express our gratitude to our families for their continuous encourage-ment and support throughout our years of study and through the process of researchingand completing this thesis. This accomplishment would not have been possible withoutthem.
Tsigabu Mebrahtu Birhanu and Georgios Chatziadam, Gothenburg, January 2020
vi


Contents
1 Introduction 21.1 Background . . . . . . . . . . . . . . . . . . . . . . . . . . . . . . . . . . 21.2 Motivation . . . . . . . . . . . . . . . . . . . . . . . . . . . . . . . . . . . 31.3 Aim . . . . . . . . . . . . . . . . . . . . . . . . . . . . . . . . . . . . . . . 31.4 Challenges . . . . . . . . . . . . . . . . . . . . . . . . . . . . . . . . . . . 4
2 Background 52.1 The Evolved Packet Core . . . . . . . . . . . . . . . . . . . . . . . . . . . 5
2.1.1 The Home Subscriber Server . . . . . . . . . . . . . . . . . . . . 52.1.2 The Mobility Management Entity . . . . . . . . . . . . . . . . . . 62.1.3 Evolved Packet Gateway . . . . . . . . . . . . . . . . . . . . . . . 62.1.4 EPC as a Distributed System . . . . . . . . . . . . . . . . . . . . . 7
2.2 Non-Uniform Memory Access . . . . . . . . . . . . . . . . . . . . . . . . 82.3 Related Work . . . . . . . . . . . . . . . . . . . . . . . . . . . . . . . . . . 10
3 Methodology 123.1 Studied Hardware . . . . . . . . . . . . . . . . . . . . . . . . . . . . . . . 12
3.1.1 Intel Skylake . . . . . . . . . . . . . . . . . . . . . . . . . . . . . 123.2 Tra�c Modeling using the Dallas Tool . . . . . . . . . . . . . . . . . . . 133.3 Baseline Con�guration (NUMA-aware) . . . . . . . . . . . . . . . . . . . 143.4 Virtualization . . . . . . . . . . . . . . . . . . . . . . . . . . . . . . . . . 16
3.4.1 vEPG deployment using VIRTIO . . . . . . . . . . . . . . . . . . 173.4.2 vEPG deployment with 8vCPUs UP on each NUMA node . . . . 193.4.3 vEPG deployment with 2CP and 2UP VMs . . . . . . . . . . . . . 223.4.4 vEPG deployment with 2CP and 1UP VMs . . . . . . . . . . . . . 233.4.5 vEPG deployment with 1CP and 2UPs VMs . . . . . . . . . . . . 243.4.6 vEPG deployment with 1CP and 1UP VMs . . . . . . . . . . . . . 24
4 Results 264.1 Evaluation . . . . . . . . . . . . . . . . . . . . . . . . . . . . . . . . . . . 264.2 Baseline Con�guration on SSR . . . . . . . . . . . . . . . . . . . . . . . . 274.3 Virtualization . . . . . . . . . . . . . . . . . . . . . . . . . . . . . . . . . 29
4.3.1 vEPG deployment with 8vCPU UP on each NUMA node . . . . . 324.3.2 vEPG deployment with 3CP and 2UP VMs . . . . . . . . . . . . . 334.3.3 vEPG deployment with 2CP and 3UP VMs . . . . . . . . . . . . . 344.3.4 vEPG deployment with 2CP and 2UP VMs . . . . . . . . . . . . . 34
viii

Contents
4.3.5 vEPG deployment with 2CP and 1UP VMs . . . . . . . . . . . . . 354.3.6 vEPG deployment with 1CP and 2UP VMs . . . . . . . . . . . . . 364.3.7 vEPG deployment with 1CP and 1UP VMs . . . . . . . . . . . . . 36
4.4 Discussion . . . . . . . . . . . . . . . . . . . . . . . . . . . . . . . . . . . 37
5 Conclusion 425.1 Conclusion . . . . . . . . . . . . . . . . . . . . . . . . . . . . . . . . . . . 425.2 Future Work . . . . . . . . . . . . . . . . . . . . . . . . . . . . . . . . . . 42
5.2.1 AMD EPYC . . . . . . . . . . . . . . . . . . . . . . . . . . . . . . 43
Bibliography 44
List of Figures I
List of Tables II
1
1Introduction
The transition of current mobile broadband networks to 5G along with the variety ofconnected Internet of Things (IoT) devices and the increase in bandwidth available forend users, introduce a new challenge for the underlying system responsible for handlingthe tra�c. The amount of data being transferred will only continue to grow in the futureand there is an obvious need for more capable servers in order to meet this evolution.This project is an evaluation of the possible con�gurations of modern hardware, aimingto identify the components that could be used to optimize future mobile infrastructuresystems in the pursuit of performance.
In this chapter, we want to describe the purpose of this thesis work and its signi�cance.We shall go through some background information regarding the system that we workon, our motivation, and the overall aim of this thesis work. We provide some generalinformation about the EPC’s architecture, components and functions, while presentingthe goals and impacts of the present work.
1.1 Background
EPC is part of the mobile broadband network, connecting base stations to the IP back-bone and providing cellular-speci�c processing of tra�c [1]. This framework is a criticalnetwork component that provides converged voice and data on a 4G network. In a 4GEPC, network functions are not grouped to a single network node as in a traditional orhierarchical centralized network like 2G or 3G, but they are distributed to provide con-nectivity where it is needed. The design of this split architecture focuses on increasingthe e�ciency, scalability and elasticity of the system.
One of the main components of EPC is the Packet Gateway (PG) which acts as an inter-face between the Radio Access Network (RAN) and other IP based packet data networks.The Evolved Packet Gateway (EPG), Ericsson’s instantiation of the PG, supports SmartServices Cards (SSCs), Line cards and Switch cards. The SSCs provide modularity func-tions such as control handling, user packet handling, and tunneling. The line cards pro-vide connectivity to external physical interfaces, while the switch cards provide routing,alarm management, and packet switching functionalities.
Generally, EPG provides core function of the EPC such as session management. Sessionmanagement is the process of establishing and managing user sessions between the UEand an Access Point Name (APN) network. This includes activating, deactivating, and
2

1. Introduction
modifying IP addresses.
1.2 Motivation
During the last decades mobile networks have been growing rapidly with the introduc-tion of new technologies such as 5G networks, smart end devices and advanced applica-tions. All those changes challenge mobile operators and network equipment providersto deliver the best service for their customers. The EPG is one of the main EPC com-ponents that is used for this purpose, and it is responsible to forward and control thetra�c that the network can process. The upcoming increase of the tra�c in the nextgeneration of networks, entails challenging research questions, related to the ability ofthe current system to be capable of functioning successfully in the future. In order toidentify the hardware components that could provide a certain boost to the system, weneed to investigate which ones have the biggest impact and what is the potential forfuture improvements.
The concept investigated in this thesis work is the impact of NUMA-aware con�gu-rations and variety of CPU-pinning con�gurations within a virtual EPG deployment.
As the placement of main memory relative to the system cores plays a great role onthe performance of the system, we have used di�erent hardware con�gurations to in-vestigate the overall packet per second processing capacity of the EPG. The packetsper second is the main metric which we used as the best performance indicator of theEPG con�guration. To analyze the pps processing capacity of each con�guration, theEPG node uses smart cards that are installed on a Smart Service Router platform. Thesmart service cards use Intel-based server processors. In this thesis work [2], the e�ectof NUMA-aware and Uniform Memory Access (UMA) con�guration is investigated onboth the SSR and Commercial o�-the-shelf (COTS) platforms.
1.3 Aim
Currently, a large number of requests from user equipments are processed by the EPGto connect to the internet using packet switching technology. The number of user sub-scriptions allowed to get the service depends on the packet processing capacity of theEPG. Considering all the other components of the EPC provide full services, the EPGis responsible for assigning IP addresses and interacting with the external packet basednetworks. At a time, a large number of subscriptions may rise from user equipment (UE)and more packets may be dropped if the processing capacity of the EPG is bottleneckedor if the processes are overloaded.
The packet per second processing capacity of the EPG is a�ected by the con�gurationand type of processor on the platform used for the EPG deployment. Di�erent vendorsuse various processor versions with diverse processing performance and con�gurations.The NUMA and UMA (Uniform Memory Access) memory placement architectures are
3
1. Introduction
the two main con�gurations of the EPG discussed in this work. These con�gurationsa�ect the overall performance of the system. In this thesis work, the impact of NUMA-aware and UMA con�gurations of the EPG are evaluated on the SSR and COTS hardware.The main aim of this thesis is to investigate high performance con�gurations using Intelprocessors on both these platforms, and identify the components with the most signi�-cant overall e�ects.
1.4 Challenges
Working on such a project on a well de�ned system in a big enterprise, we expect tomeet a number of obstacles.
• The experimentation on CPU pinning can only be executed on a virtual environ-ment, which means testing on smaller scale hardware and comparing the statisticsbetween the scenarios instead of actual metrics.
4

2Background
This chapter provides detailed background information and a description of some com-ponents used in this project. Since EPG is one of the main components of EPC, a detaileddescription of EPC and its sub components are discussed in the �rst section. Next, EPCas a distributed system and the role of the load balancer to distribute tra�c is analysed.In addition, this chapter provides some background information about some proces-sors, NUMA concepts and our main objective of investigating the performance of all thecon�gurations. Finally, this chapter provides a related work section that speci�es theconnection of this thesis work with other studies.
2.1 The Evolved Packet Core
EPC is one of the main components of the Universal Mobile Telecommunications Sys-tem (UMTS) network. It is a framework for providing converged voice and data on a 4GLong-Term Evolution (LTE) network [2]. On the LTE, EPC is sandwiched between theRadio Access Network and the packet switch based external data networks. Requestscoming from User Equipment (UE) to access a communication channel using packetswitching and their replays are passed through the EPC. Since EPC is an all IP basednetwork, it does not support traditional circuit switched connections that were still par-tially supported until 3G. The basic architecture of EPC is shown in Figure 2.1.
Figure 2.1 shows the basic architecture of the Evolved Packet System (EPS) when theUser Equipment (UE) is connected to the EPC. The Evolved NodeB (eNodeB) is thebase station for Long LTE radio access network. The EPC contains at least four net-work elements that provide di�erent functions. The dotted line shows control signalswhich allow independent scaling of control and user plane functions [3]. This includesEPC components like Home Subscriber Server (HSS) and Mobility Management Entity(MME). Both the Service Gateway (SGW) and the Packet Gateway (PGW) nodes are partsof the EPG where both of them have di�erent functions. To have a good understandingsof the EPC, it is important to describe the function of each component.
2.1.1 The Home Subscriber ServerThe HSS is a database that stores and controls information about user sessions and sub-scription related activities. It manages user data and pro�le information for users who
5

2. Background
HSS
MME
PDN GW
Serv GW
ExternalNetworks
LTE
eNB
S6a
S11
S1-MME
SGi
S5/S8
S1-U
Figure 2.1: Basic EPC architecture for LTE.
are accessing over the LTE RAN [2]. It also controls other functions like session estab-lishment, roaming, user Authentication and Access Authorization (AAA), and mutualnetwork-terminal authentication function services.
2.1.2 The Mobility Management EntityThe MME server is responsible almost exclusively for the control plane related functionsof the EPC. It handles signaling related tasks like user subscription management, sessionmanagement, handovers, mobility and security of control plane functions. A handoveris the process where one can get full network access while moving from one networkto another and keeping the same IP connectivity. The purpose of doing handovers is tomake the attachment from one network to another completely transparent for the user.Therefore, the user always stays connected no matter which network he is using.
As it is shown in Figure 2.1, the MME is linked through the S6a interface to HSS whichcontains all the database user subscription information [2]. The MME �rst collects user’ssubscription and data authentication information for registering in the network.
2.1.3 Evolved Packet GatewayEPG is a gateway for the EPC to interact with the external IP-based networks. All in-coming and outgoing IP packets pass through this gateway using the SGi interface. Asit is shown in Figure 2.1, the SGW and PGW are connected over an interface either S5or S8. If the user is roaming to connect to home networks, S5 interface is used to createa connection between the service gateway and the evolved packet gateway. If the useris roaming to attach to the visited LTE, S8 interface is used instead [3].
The Evolved Packet Gateway provides functions like IP address allocation, charging,packet �ltering and policy-based control of user-speci�c IP �ows. It also has a key role
6

2. Background
in providing Quality of Service (QoS) for end-user IP services. Since an external datanetwork is identi�ed by an APN, the PGW will select privileged sessions to connect tothe external Packet Data Network (PDN) servers on the basis of which APN the end userwants to connect to.
The Service Gateway
The SGW is the part of the EPG that deals more with session forwarding functions. It isa point of interconnection between the RAN and EPC that transports tra�c from userequipment to the external network through PG. The IP packets �owing to and fromthe mobile devices are handled by the user plane service gateway and evolved packetgateway nodes [3]. If there is an access request that comes from the user equipmentthrough the Evolved nodeB (eNodeB), the SGW is responsible to forward the service tothe PGW node based on the privilege signal sent from MME.
Packet Gateway
The Packet Gateway (PGW) is the part of the EPG which provides connectivity to ex-ternal networks and allocates an IP address to the UE. The PGW uses interfaces S5/S8to connect towards the SGW and SGi to connect with an external network. Its job is toroute, upload and download user plane data packets between the external IP networksand UE.
An important role of the PGW is performing Packet Inspection and Service Classi�-cation (PISC) by enforcing Policy and Charging Control (PCC) rules. When an event istriggered, the PGW also sends a report to Policy and Charging Rules Function (PCRF).PCRF is a software component in the node that operates at the network layer and is usedto determine policy rules in multimedia networks. Some events are always reported,while others PCRF can choose to subscribe to report. Based on the triggered events, thePCRF can create, update or delete the PCC rules.
2.1.4 EPC as a Distributed SystemThe implementation of a single software instance of any element of the EPC, such asthe MME or the SGW can become congested under heavy tra�c and the hardware re-sources could limit the capabilities of the software. The sensible solution is splitting theincoming load between a number of identical instances of the individual component,thus deploying the entire EPC as a distributed system. Depending on the amount oftra�c, it is possible to spawn new duplicates of EPC components as clusters. This elas-ticity is proven more capable to handle �uctuating demands, without wasting resources[4].
In Figure 2.2 we show the structure of the clusters with various instances of the sameEPC components. The load balancer is responsible for distributing the tra�c betweenthe cluster’s members and the synchronization of the duplicates is achieved either bycopying their status in others, or by using shared storage [4].
7

2. Background
HSS
Internet
SGW
MME
PGW
Control PlaneData Plane
Load Balancer
VNF Replica
Data Store
UE
eNodeB
Figure 2.2: Distributed EPC [4].
In a 5G network, EPG has Control Plane (CP) and User plane (UP) functions that are�exible to deploy and can scale the CP and UP functions independently. The CP makesdecisions about where tra�c is to be sent, from the underlying data plane that forwardsthe payload tra�c to the selected destination. It deals more with session management,alarm management and routing information. On the other hand, the UP deals more withpacket processing, routing and inspection functions. On 3G and 4G network, the CP andUP functions are merged together in the EPG.
2.2 Non-Uniform Memory Access
NUMA is an architecture that is widely used in high-end servers and computing systemstoday due to its performance and scalability [5]. Multiprocessor systems have introducedchallenges for compilers and run-time systems when it comes to shared memory and itscontention1.
Whenever there is con�ict over access to shared resources as memory, disk or cache,buses or external network devices, we are facing contention. A resource experiencingongoing contention can be described as "oversubscribed". Processors are currently so ca-pable that they require directly attached memory on their socket, because remote accessfrom another socket leads to additional latency overhead and contention of the Quick-Path Interconnect (QPI) which sits between the sockets. Since 2017 in Xeon Skylake-SPplatforms, the QPI has been replaced by the Ultra Path Interconnect (UPI).
A basic NUMA architecture is shown in Figure 2.3, where each physical core is allowedto access the memory that is connected to it. Every core inside the NUMA node hasits own cache memory. Di�erent processors have di�erent cache placement and accesslevel strategy. Most NUMA nodes today have Level1 (L1), Level2 (L2) and Level3 (L3)
1Contention: Competition for resources.
8

2. Background
caches where L1 cache is only allowed to be accessed by one core, L2 is accessed by twoneighboring cores and L3 can be accessed by all the cores in the same NUMA node.
Processor
Cache
Processor
Cache
Processor
Cache
Processor
Cache
Memory
Memory
Memory
Memory
BUS
Figure 2.3: Basic NUMA Architecture.
It is important to properly place data in order to increase the bandwidth and minimizethe memory latency [6] of each NUMA node. The two most important points for man-aging the performance of NUMA shared memory architecture are processor a�nity anddata placement [6]. In processor a�nity, each process is restricted to be executed undera speci�c number of nearest CPUs, and for the data placement, each process is assignedto access a memory location connected to the NUMA node where the process is pined.
Generally, di�erent operating systems have di�erent ways of managing NUMA archi-tecture, but there are many strategies used by the di�erent operating systems to managedi�erent NUMA con�gurations. Some of them are described below:
• Heuristic memory placement of applicationsIn this approach, if the operating system is numa-aware, it is possible to enable anddisable the con�gurations during compile time with a kernel parameter. Here, theoperating system determines the memory characteristics from the �rmware and itcan adjust its internal operation to match to the memory con�guration. This ap-proach tries to place applications inside their local node and the memory from thislocal node is to be preferred as default storage. If possible, all memory requested bya process will be allocated from the local node to avoid the use of context switch-ing.
• Special NUMA con�guration for applicationsThis approach provides con�guration option for applications to change the defaultassumptions of memory placement policy by the operator. In this approach, it ispossible to establish NUMA con�guration policy for all applications using com-mand line tools without modifying the code.
9

2. Background
• Ignore the di�erenceThis is an initial approach which allows software and the operating system to runwithout any modi�cation to the original con�guration. Since this approach treatseverything as equal regarding performance between con�gurations, the operatingsystem is not aware of any nodes. Therefore, the performance is not optimal andwill likely be di�erent each time the application runs since the con�guration willchange on boot-up.
2.3 Related Work
Since performance of a system is mainly a�ected by latency, bandwidth and available ofcores, a large amount of research has been invested in comparing and analyzing per-formance. Awasthi et al. [7], Cho and Jin [8] and Dybdahl and Stenstrom[9], havediscussed optimizing data placement in last-level shared Non-Uniform Cache Access(NUCA) caches.
Awasthi et al. [10], developed a relevant approach to manage data placement on memorysystem with multiple Memory Controllers (MC). Their placement strategy is incorpo-rated more on the queuing delay at the MC, the DRAM access latency and the communi-cation distance and latency between the core and MC. From the methodologies they haveused to investigate best data placement, they have got an e�cient thread’s data place-ment by modifying the default operating system’s frame allocation algorithm. From thisplacement, they found 6.5% improvement when pages are assigned by �rst touch dataplacement algorithm and 8.9% when pages are allowed to migrate across memory con-trollers. This approach di�ers from ours in the way that, they are concerned more aboutthe frame allocation algorithm, while ours impacts on network performance in large dis-tributed systems.
As many processes in the same processor share a common cache, the issues of memorymanagement and process mapping are becoming critical [11], [12]. Molka et al. [13]investigated a benchmark for main memory and cache identi�cation to �nd out the fun-damental performance property for both Intel and AMD x86_64 architectures in termsof latency and bandwidth. For both architectures they used a NUMA memory layout.Based on their identi�cation, although the size of the L2 cache for the AMD architectureis large, it gave almost the same performance result with L3 cache bandwidth that scalesbetter with the core count on the Intel system. The transfer rate between the socket inIntel architecture is also four times better than the transfer rate between the two dies inthe AMD architecture [13].
Oltan Majo and Thomas R. Gross.[11] show that, if the allocation of physical memoryand the structure of memory system is not managed well, the operating system will failto obtain good performance on the system. From their point of view, if the memoryallocation in the system is balanced, then local scheduling provides large performancebene�ts. If the memory allocation con�guration of the system is not balanced, then map-
10

2. Background
ping given by the maximum-local scheme needs to be modi�ed, otherwise it is knownto cause performance degradation even with relative to default scheduling. Therefore,if the distraction of system memory is not fair to all the processors, then mapping pro-cesses can lead to severe cache contention.
Hackenberg et al. [14] also did a comparison on Cache Architectures and Coherency Pro-tocols on x86-64 Mediocre Symmetric Multiprocessing (SMP) Systems. This benchmarkis done to get an e�ective in-depth comparison for the multilevel memory subsystem ofdual-socket SMP systems based on the quad-core processors AMD Opteron 2384 (Shang-hai) and Intel Xeon X5570 (Nehalem) [14]. To the best of the authors’ result, the AMD’scache coherency protocol provides the expected performance advantage over the Intel’sNehalem processor for accessing modi�ed cache lines for remote processor.
Blagodurov et al. [15], presented Contention Management on Multicore Systems. Themain focus of their work was to investigate why contention-aware schedulers that aretargeted to work on UMA are failing to work in NUMA, and to �nd an algorithm thatcan work on NUMA as scheduling contention-aware control. Based on the author’s ex-perimental result, one reason why contention-aware schedulers fail to work in NUMA,is that if one process that is computing for Last Level Cache (LLC) is migrated from onecore to other core in di�erent NUMA node, the process will still compute to get accessfor memory controller with the previous processes that were in the same core. The al-gorithm they have devised to solve this problem is Distributed Intensity NUMA Online(DINO) which prevents thread migration, or if the tread is migrated, the memory of thisthread should also be migrated to the memory where this thread’s core is connected.The evaluation of their algorithm shows that, moving thread’s memory to the locationwhere the thread is migrated is not a su�cient solution, but it is better to prevent un-necessary migrations.
Qazi et al. [1] proposed a new architecture for EPC called PEPC. On their implementa-tion, they used the Net-Bricks platform which allows to run multiple PEPC slices withinthe same process. Their results show a throughput improvement 3-7 times higher thana comparable software EPCs that is implemented in the industry, and 10 times higherthroughput than a popular open-source implementation. This paper work relates to oursin the way that, its main objective is also to increase the processing performance of theEPG but, our work focuses more on the EPG instead of EPC.
In general, all the above articles are related to our work, due to their focus on the impactof memory management, CPU pinning and NUMA architectures. This thesis focusesmore on investigating the impact of the NUMA concept and various con�gurations onhigh-performance virtually deployed distributed systems, such as EPG, which is the testcase for our experiments and benchmarks. The scalability of the Packet Gateway will beput to the test during the upcoming 5G era more than the other EPC components, andit is essential to identify the factors that could a�ect its performance.
11

3Methodology
This chapter focuses on hardware and software methodologies used to evaluate thepacket processing capacity of each NUMA con�guration. The NUMA-aware and deacti-vated NUMA-awareness con�gurations on the Intel processors, and the di�erent vEPGdeployments with more CPU pinning scenarios are discussed in detail.
We proceed with system level testing to �nd the packet-per-second processing capacityof the EPG. System level testing is a testing technique that is used to determine whetherthe integrated and complete software satis�es the system requirements or not. The pur-pose of this test is to evaluate the system’s compliance with the speci�ed requirements[16]. In our case, the test case used to test the EPG at system level is a payload test case.We want to evaluate the packet per second processing capacity of the EPG at systemlevel with one payload test case chosen from the available pool. Taking this as a base-line, we run a test for a NUMA-aware and a NUMA-unaware con�guration on the SSRand virtual EPG (vEPG).
3.1 Studied Hardware
In this project the main processor product we used to run the EPG with di�erent con-�gurations is from the Intel Xeon series. These processors are installed on the smartservice cards that are insulated under the SSR platform.
3.1.1 Intel SkylakeSkylake is the code name given for the project implemented in the 6th generation ofIntel Core micro-architecture that delivers a record level of performance and battery lifein many computing cases [17]. It is designed to meet a demanding set of requirementsfor various power performance points. Skylake also introduces a new technology calledIntel Software Guard Extensions (IntelSGX), in which application developers can createsecure code to encrypt memory so that no one can not modify or disclose it. The Skylakememory solution has an e�cient and �exible system memory controller. This controllerenables the processor to use Skylake System-on-Chip (SoC) on multilevel platforms us-ing di�erent Double Data Rate (DDR) technology.
Skylake’s fabric is an extended development of the successful ring topology that is in-troduced in the Sandy Bridge generation [17]. It has a built-in last-level cache, that isdesigned to provide high memory bandwidth from di�erent memory source. Introduc-
12

3. Methodology
ing eDRAM-based memory-side cache is a main signi�cant change in Skylake’s memoryhierarchy.
3.2 Tra�c Modeling using the Dallas Tool
Dallas is a distributed system tool, developed by Ericsson, that can easily be scaled upto meet di�erent load testing requirements. Dallas can simulate up to millions of sub-scribers, and simulate UEs and the radio network in the packet core network testing.From the system testing point of view, Dallas can be used for stability testing by run-ning tra�c for a long time, robustness testing by running di�erent tra�c models andby performing di�erent types of failures, and capacity testing by running speci�c tra�cmodels to measure the performance of the system. In this thesis work, Dallas is used asa capacity or payload testing tool.
Before sending any tra�c, Dallas �rst sends a signal to the node to get informationabout the memory and CPU utilization of the node. Then, it starts sending tra�c to thenode based on the status of the latter. In Figure 3.1, the Dallas testing platform sendsa command to generate tra�c that is forwarded to EPG starting from a small numberof subscribers. The command sent to the node contains the number of sessions andrate as main parameters. From the total number of sessions, rate number of session aresent in every second. Then, the waiting time of Dallas before sampling the payloadprocessing capacity of the EPG is calculated as sessions/rate + 5 seconds. If the wait-ing time expires, Dallas starts the sampling process which counts the number of packetsprocessed and measures the CPU utilization of the EPG. If the CPU load has not reachedits peak point, Dallas increases the tra�c repeatedly with batches on new subscriptionsuntil the EPG reaches its peak CPU utilization.
Finally, it calculates the average Packets Per Second (pps) handled by the EPG, which isour main metric, and stores the results in a log �le. The reason we use pps as our mainmetric is because, the system is mostly loaded by handling packet headers. There is noDeep Packet Inspection (DPI) in the process and the system is more than capable to copewith large packets, so the size of the packets is not our main concern.
Dallas will stop sending tra�c if the following conditions are not met:
• Average packet per second loss:During the execution of the test case, a required drop for each test case is set tosome constant value. This value is used to compare with the drop ratio which iscalculated as packets/1million on the test script. If the drop ratio is greater than therequired threshold, Dallas stops sending tra�c, otherwise it can continue sendingtra�c with following iterations by keeping the other conditions such as numberof iterations, peak CPU and number of bearer connections (stable).
13

3. Methodology
• Number of iterations:The maximum number of iterations Dallas can send as tra�c to the node, is setto 11 iterations. This means that if there is not any crash or failure of the nodeto pass the other constraints, Dallas can increase the injection rate up to 11 timeswith di�erent number of sessions to the node, and then terminate the connection.
• Peak CPU:The maximum value of the peak CPU is set to 100%. If the CPU reaches 100% asan average between all cores in any iteration, Dallas stops sending tra�c to thenode and collects the �nal result for that iteration.
• Bearer connectionsBearer connections refers to the number of sessions that are created safely ordeleted if the number of sessions are greater than the quantity set by the tool.If the node fails to pass one of these conditions, Dallas tries for the second timeby sending tra�c again while lowering the number of sessions to some a numberwhich is multiplied with a constant multiplier that is initially set on the test script.If the node still fails to pass the above conditions, it stops sending tra�c and out-puts the result to the log �le at that iteration. If the node ful�lls all the conditions,Dallas continues sending tra�c to the node by multiplying the number of sessionsby the constant multiplier 1.02 for SSR or 1.1 for the vEPG.
Dallas EPG
Switch
Figure 3.1: Tra�c �ow between Dallas and EPG.
3.3 Baseline Con�guration (NUMA-aware)
The default con�guration of the EPG is NUMA-aware. Processes are allowed to accessspeci�c memory locations connected directly to the NUMA node they are running on.Based on their application, the processes are classi�ed in three groups. We call thema-processes, b-processes and c-processes. A-processes are used to forward the packets,b-processes to distribute the coming packets to a-processes, and c-processes are usedto control the communication between them. Figures 3.2 and 3.3 show a NUMA-awarecon�guration of the EPG on SSC1 and SSC3 cards respectively.
14

3. Methodology
B0 A A
B1 A A
NUMA 0
B2 A A
B3 A A
B4 A A
B5 A A
NUMA 1
B6 A A
B7 A A
QPI
Figure 3.2: NUMA-aware EPG Con�guration for SSC1.
The SSC3 card architecture follows the same concept in a 4-socket motherboard. Asshown in �gure 3.3 we have one NUMA node for every socket and it contains 4 b-processes. Every CPU model has 14 physical cores and 28 threads, for a total of 112processes across the whole motherboard. The operating system installed on both theSSC1 and SSC3 cards is x86_64 architecture GNU/Linux. Both these cards are installedon the Smart Service Router (SSR) platform.
The b-processes can only distribute packets to the a-processes sharing the same NUMAnode. In the SSR platform, b-processes have dedicated groups of a-processes under theircommand, and by default are not allowed to use a-processes belonging to another group.This means that for the SSC1 card, there is only one b-process per 5 a-processes in agroup as it shown in Figure 3.2. This b-process is allowed to send the packets to thesea-processes. In the SSC3 card, there are two b-processes and 9 a-processes in a group,in which the two b-processes can distribute the packets among the 9 a-processes. In thevEPG, this feature does not exist and the only bound is the node.
15

3. Methodology
B0 A A
B1 A A
NUMA 0
B2 A A
B3 A A
B4 A A
B5 A A
NUMA 1
B6 A A
B7 A A
B8 A A
B9 A A
NUMA 2
B10 A A
B11 A A
B12 A A
B13 A A
NUMA 3
B14 A A
B15 A A
QPIs
Figure 3.3: NUMA-aware EPG Con�guration for SSC3.
For the case of Uniform Memory Access (UMA) con�guration, the NUMA-awareness forboth the SSC1 shown in Figure 3.2 and SSC3 shown in Figure 3.3 is deactivated. Thismeans b-processes are free to send the packets to any of the a-processes on the card andthere is no dedicated memory location for speci�c cores. It is the responsibility of thescheduler to assign which process should use which memory region.
3.4 Virtualization
Virtualization is the process of creating a virtual version of an entity, including but notlimited to virtual computing, storage and networking resources. As the SSR platform ishard coded for a speci�c CPU pinning con�guration, enabling and disabling the CPUpinning on the EPG source code doesn’t bring any change. To investigate di�erent re-sults from di�erent CPU pinning strategies, virtualization is the preferred option as itgives us the freedom to pin CPUs to di�erent NUMA nodes and group them. To virtual-ize the EPG, Virtual I/O (VIRTIO) and Single Root I/O (SRIO) interfaces are used in bothIntel servers.
As mentioned previously, our work continued on the vEPG, which can only be deployedon SSC1 cards. This means that we proceed with a smaller scale platform but with adedicated node for our experiments only. We deployed on one SSC card only, so that wecan manipulate the CPU pinning con�guration.
16

3. Methodology
VM
NIC
NIC
HOST
(a) VM deployment in host.
Interface
b-process
a-process
a-process
a-processVM
(b) VM function.
Figure 3.4: V-EPG in physical hosts.
Figure 3.4a shows, the way EPG Virtual Machine (VMs) are deployed in a host. A VM isan emulation of a computer system where a physical computer can be partitioned intoseveral software based VMs. A VM can run its own OS and applications, contain speci�cnumber of CPU cores, dedicated RAM, hard disk and Network Interface Card (NIC). Thephysical Network Interface c-processess (NICs) can be split into smaller virtual ones,and dedicate each of them on one VM. Currently it is possible to simulate up to 64 NICson one physical. Figure 3.4b shows a simpli�ed way, the role of the b-processes anda-processes in the VM. The b-processes receive the tasks (packets) and forward them tothe a-processes for processing. Currently each a-process is pinned to a speci�c core andthe amount of available a-processes is equally distributed to them. For every b-process,there is a speci�c pool of a-processes that are allowed to access the memory connectedto them, and this is how they form a NUMA node in SSC1 and SSC3.
On the SSC1 we have 32 vCPUs available and on the SSC3 there are 112 vCPUs, butnot all of them are allocated by the a-b-c-processes. Since we cannot alter the numberof free vCPUs on SSC1 and SSC3 on SSR, we will do that in the vEPG where we havethe freedom to change the NUMA placement. On the vEPG, we will consider di�erentCPU pinning, so that the b-processes are assigned to a core automatically. We will try alarger number of b-processes in a NUMA node in order to evaluate if those processes area bottleneck while distributing the packets to the a-processes, and a larger number ofa-processes by utilizing the free vCPUs. Eventually the main purpose of all this tests oncon�gurations is to identify which parameters have the biggest impact on performanceand why.
3.4.1 vEPG deployment using VIRTIOThe deployment of vEPG in Cloud Execution Environment (CEE) with OpenStack fora lab using VIRTIO interface is shown in Figure 3.5. OpenStack is a cloud computingoperating system that is used to deploy virtual machines and other instances to controldi�erent tasks for building and managing public and private cloud-computing platforms[18]. The OpenStack is responsible for controlling the visualization process. The VMthat is used to deploy vEPG has 48 vCPUs with two sockets and one NUMA node on
17

3. Methodology
each socket. It is x86 architecture with GNU/Linux hyper-threaded enabled. Since thereare only 48 vCPUs on the host machine, the total number of vCPUs on all the VMs com-bined, should not exceed that number.
Openstack
NMRP
Host HW (x86)
NMRP PP PP LB LB CP CP CP
TOR(Switch)
External IP Networks
BGW(Router)
CEE VM(vSSC) VM(vSSC) VM(vSSC) VM(vSSC)VM(vSSC)VM(RP)VM(vRP) VM(vLC) VM(vLC)CloudInfrastructure
vNIC vNIC vNIC vNIC vNIC vNIC vNIC vNIC vNIC
vSwitch Hypervisor
pNIC
Figure 3.5: vEPG virtualization using VIRTIO interface.
The deployment process starts by generating a Heat Orchestration Template (HOT) �leusing a python script HOT �le generator. Orchestration is the process of creating oneor more virtual machine at a time. Next the image is downloaded using the Virtual De-ployment Package (VDP) to the glance from any EPG build. Glance is component thatprovide services to the OpenStack. Using this service, a user can register, discover, andretrieve virtual machine images for use in the OpenStack environment. The images thatare deployed using the OpenStack image service can be stored in di�erent locations likeOpenStack object storage, �le system and other distributed �le systems [18]. Then, the�avors are created and the HOT template is executed to generate and create the Open-stack resources. Flavors are de�ned on the con�guration �le to set the vCPU, memory,and storage capacity of the virtual machines. During the deployment process, vCPUs,Disk and main memory of the VMs are created based on the de�nition of the �avors onthe con�guration �le.
The deployment of vEPG from the default con�guration �le is shown in Figure 3.5. Here,nine VMs are created with 2 of them used for Payload Processing (PP), 3 of them used asCP, 2 of them as Route Processing (RP) and two of them as a Line Cards (LCs). Line cardsare used to send the out-going packet from the EPG to the PDN servers or the in-goingpackets from the EPG to the UE devices. The RPs are used to manage and facilitate thecommunication between the VMs. The default deployment con�guration, assigns 6vC-PUs for the control and user plane VMs. In each of the user plane vCPUs, one of themis used as a-process, one as a b-process and 4 of the are left for the background processof the VM.
Deploying vEPG using VIRTIO interface is simple and �exible to change the VM con-
18

3. Methodology
�guration. It is possible to change the number of CPs or UPs from one role to anotherand to pin the CPU to di�erent NUMA nodes. But, since the hypervisor process createsa Virtual Switch (vSwitch) from the Top Of Rack (TOR) physical switch, it slows thetra�c that is forwarded to the b-processes. The bandwidth of the vSwitch is limited toprocess a maximum of 10 Gbps, and the tra�c that passes through this vSwitch can notoverload the a-processes of the VMs to reach their max CPU utilization. Even if thisvirtualization is is not recommended to test EPG at a system level, we decided and pro-ceeded with testing our di�erent con�gurations by using 50% average CPU utilizationas the reference point, by continuing to send the same number of sessions and rate forall the con�gurations.
Since our main metric is packets per second for comparing the performance of each con-�guration based on CPU utilization, we selected a test case that works with �xed CPUutilization. By �xed CPU utilization, we mean that Dallas stops sending tra�c to thenode if its CPU utilization reaches between +2% or -2% of the speci�ed utilization per-centage. The test case we use was designed to work with a �xed CPU utilization of 27%using 2CPs and 2UPs with some constant initial sessions. This means that Dallas stopssending tra�c if the CPU utilization of the node reaches a value between 25% and 29%in any of the iterations.
Therefore, since the default test script con�guration of this test case does not match withour requirement, we changed all the parameters of the test script and the conditions tomatch our desired 50% �xed CPU utilization.
3.4.2 vEPG deployment with 8vCPUs UP on each NUMA nodeFor our customized default con�guration with 8vCPUs VMs, the setup is presented inFigure 3.6. Every square represents one vCPU on the VMs. The reason we chose earlierto proceed with 8vCPU VMs is because of the number of a-processes in smaller scaledeployments. As we mentioned before, 6vCPU deployment UP instances have one b-processes and one a-processes deployed on each socket, which does not allow splittinga-processes of a single user plane between NUMA nodes.
If we check the properties of the host, we are presented with the NUMA nodes andthe IDs of the processes they include. This gives us the ability to map the location ofevery thread. We can see the instances deployed and the vCPUs they contain, and alsoidentify the b-process and a-process threads. In this test case, we identify where everyVM is running and manually change the IDs of the processes it uses to customize thetopology. By changing all the vCPUs a VM uses, we are able to practically move it wher-ever we want in the system. We are basically telling the VM which vCPUs to use. This isgoing to be our new baseline for all the rest of the con�gurations. Every VM is deployedon a speci�c NUMA node (socket) with 1 CP and 1 UP on socket 0, and 1 CP and 1 UPon socket 1.
19

3. Methodology
C B
CP1
UP2
NUMA 0
QPI
A A C B
CP2
UP1
NUMA 1
A A
Figure 3.6: vEPD deployment with 8vCPUs on UPs (result 4.3).
The user plane VMs have 1 c-process, 1 b-process and 2 a-processes. The c-process isa sibling of the �rst UP a-processes and the b-processes is a sibling of the second UPa-processes. This deployment achieved better performance because the VMs with a-processes do not exchange data between sockets and work independently.
CPU Pinning Scenarios
Following the test on NUMA-awareness in the system, we want to experiment with thedeployment of the Virtual Machines. The virtualization allows us to experiment withCPU pinning, something that was not possible in the SSR platforms as it is hard coded.The performance degradation in NUMA-unaware systems is mainly a result of processesrequesting memory from non-local sockets, thus having to traverse the QPI bus. Thismethod adds latency to the run-time of the process.
There are a variety of combinations we could test with CPU pinning, but we will pro-ceed with the following scenarios for this con�guration, since according to our researchthese introduce the most major diversities in the system and performance.
Pinning a-processes to another NUMA-node
In this con�guration, the a-processes of each user plane VMs are separated from the restof the vCPUs and are pinned to the other NUMA node. By default, one a-process of eachUP is a sibling of c-process and the other a-process is also a sibling of the b-process. Onthis scenario, both the a-processes for both the user plane VMs are migrated to the otherNUMA node as shown in Figure 3.7.
C
A
CP1
UP1
NUMA 0
QPIB
A C
A
CP2
UP2
NUMA 1
A
B
Figure 3.7: A-processes on separate NUMA node (result 4.4).
20

3. Methodology
The purpose of this scenario is to evaluate the con�guration of two a-processes whenthey are con�gured as sibling processes, by separating them from the rest of the vCPUsof the VM. Since the b-processes of each user plane VM is in a di�erent NUMA nodethan the a-processes, communication implies traversing the QPI to distribute the pack-ets to the a-processes, and this may cause a performance degradation with respect tothe baseline con�guration in section 3.4.2. Even if the two a-processes are siblings, theresult of this con�guration may result in high performance degradation compared to thebaseline con�guration, as the latency to distribute the packets is worse than the baselinecon�gurations.
Pinning b-processes and one a-processes to other NUMA-node
In the con�guration shown in Figure 3.8, we want to test how forcing the b-processesand one a-processes of the UP to work with the QPI bottleneck will a�ect the �nal re-sults. On this scenario, the sibling b-processes and one a-processes of each UP VMs areseparated and pinned to the other NUMA node from the rest of the vCPUs. Therefore,the latency between the the b-processes and one a-processes remains the same as thedefault con�guration since they are pinned as sibling process to the other NUMA node,but the latency between the b-processes and the other a-processes as well as the latencybetween the a-processes will increase as they are in di�erent NUMA nodes.
C
B
CP1
UP1
NUMA 0
QPIA
A C
B
CP2
UP2
NUMA 1
A
A
Figure 3.8: One b-process and one a-process on separate NUMA node (result 4.4).
The task of the UPs is the most CPU-intensive in the system and we expect a signi�cantamount of negative impact and packet loss and the overall performance of this conjuga-tion may be worse than all the pinning scenarios and the default con�guration in section3.4.2
vEPG deployment with 3CP and 2UP VMs
Figure 3.9 is used to describe the VM setups for the default 6vCPU con�guration. Whenthe EPG is deployed on a virtual machine, the default con�guration on the 48core hostcreates 5 VMs, where 3 of them are Control Plane and 2 them User Plane instances. EachVM though has 6 vCPUs available as shown in Figure 3.9. In a 6core User Plane VMs,one vCPU is used as a-process, one vCPU as c-process and b-process and the rest areused for line cards.
21

3. Methodology
B A
B A
CP1
UP1
CP2
CP3
UP2
NUMA 0 NUMA 1
QPI
Figure 3.9: vEPG deployment with 3CPs and 2UPs (result 4.5).
On this deployment, two control plane and one user plane VMs are deployed on the �rstNUMA node and one control plane and one user plane VMs are deployed on the secondNUMA node. This deployment is not e�cient based on the usage of vCPUs, memory anda hard disk of the host machine. Since control plane VMs are not that much overloadedto give routing information for the user plane VMs, deploying three CPs on one NUMAnode is almost a waste of resources.
vEPG deployment with 2CP and 3UP VMs
Figure 3.10, shows a vEPG deployment with 2 control plane and 3 user plane VMs with6 vCPUs each. This deployment is the modi�ed version of the 3CP and 2UP deploymentcon�guration. There are two user plane and one control plane VMs on the �rst NUMAnode and one control plane and two user plane VMs on the second NUMA node.
B A
B A
B A
UP2
UP3
CP2
CP1
UP1
NUMA 1NUMA 0
QPI
Figure 3.10: vEPG deployment with 2CPs and 3UPs (result 4.6).
The main objective of this deployment is, to compare with the default 6vCPU con�gu-ration, and we found that this deployment is better than the one in section 3.4.2, due tothis deployment having more user plane VMs than control plane VMs. Since packet for-warding and processing burden is more on the user plane VMs than on the control planeVMs, having more user plane VM is a good option to avoid overloading the b-processesand a-processes.
3.4.3 vEPG deployment with 2CP and 2UP VMsFor this deployment, the con�guration �le is changed to deploy two control plane VMsin the �rst NUMA node with 6vCPUs each and two user plane VMs on the second NUMAnode with 8vCPUs each as shown in Figure 3.11. In this deployment, we want to separatethe Control Plane VMs from the User Plane. The communication between the controlplane and user plane implies traversing the QPI but the the communication between user
22

3. Methodology
planes does not traverse the QPI as they are on the same NUMA node. Since communi-cation between control plane and user plane VMs is more intensive than communicationbetween user plane VMs, this con�guration impacts the performance negatively morethan the default con�guration in section 3.4.2.
C BCP1 UP1
NUMA 0
QPIA A
C BCP2 UP2
NUMA 1
A A
Figure 3.11: vEPG deployment by separating CP and UP VMs (result 4.7).
On this con�guration, there are a total of two b-processes and four a-processes on thesame NUMA node. Even if it is easy for the line cards to distribute the packets to theb-processes on the same NUMA node and there is less latency between the user planeVMs, the signaling communication between the control plane VMs and the user VMsare more costy. This con�guration showed slight performance degradation compared tothe default con�guration, since all signals for communication traverse the QPI.
3.4.4 vEPG deployment with 2CP and 1UP VMsThis deployment is almost the same as the deployment in section 3.4.3 as shown in Fig-ure 3.12. This con�guration creates 2 control plane VMs on the the �rst NUMA nodewith 6vCPUs each and one user plane on the other NUMA node with 16vCPUs. The userplane has 16vCPUs out of which 2 of them are b-processes, 9 of them a-processes andone c-process. This deployment saves the memory and hard disk of the host machinethat was allocated for the second user plane by the �avors as in section 3.4.3.
C BCP1
UP1
NUMA 0
QPI B A
A A A AA ACP2
NUMA 1
A A
Figure 3.12: vEPG deployment with 2CPs and 1UP (result 4.8).
The objective of this con�guration is to evaluate the EPG by deploying one user plane touse most of the vCPUs as a-processes and compare with the default con�guration thatdeploys two user planes. On the default con�guration in section 3.4.2 and in section3.4.3, out of the total 16vCPUs on the user plane VMs, only 4 vCPUs are assigned asa-processes and 4 vCPUs as line cards. But, this deployment assigns 9 vCPUs as a-processes as it only uses 4 vCPUs for line cards. This con�guration performed betterthan the default con�guration since there are 5 more a-processes than the 2 user plane
23

3. Methodology
VMs deployment, but there might be more packet drops as the signaling communicationbetween the control plane and user plane VMs traverses the QPI.
3.4.5 vEPG deployment with 1CP and 2UPs VMsThis con�guration deploys one control plane with 12vCPUs on the �rst NUMA node andtwo user planes with 16vCPUs on the second NUMA node as shown in Figure 3.13. Eachuser plane VM has 1 c-process, 1 b-process and 2 a-processes. On this con�guration onecontrol plane is used to send the routing information for both user plane instances. Thiscon�guration saves memory and hard disk on the host machine that was allocated forthe other control plane VM during the 2 control plane con�gurations.
C B
CP1
UP1
NUMA 0
QPIA A
C BUP2
NUMA 1
A A
Figure 3.13: vEPG deployment with 1CP and 2UPs (result 4.9).
The objective of this con�guration is to evaluate the EPG with a single control planeinstance. Even if there are 12vCPUs on the control plane VM, the performance of theEPG may not increase by adding more vCPUs to a control plane, since these VMs arenot overloaded by signaling packets. In this con�guration it is not e�cient to controlboth user plane instances using one control plane. Therefore, the CPU utilization ofthis con�guration is much worse than the baseline con�guration, as there may be morepacket drops on the cards due to routing errors.
3.4.6 vEPG deployment with 1CP and 1UP VMsThis con�guration deploys the control plane VM with 12vCPUs in the �rst NUMA nodeand the user plane VM with 16vCPUs in the second NUMA node as shown in Figure 3.14.This con�guration saves almost 50% of the memory and hard disk that was allocated forthe control plane and user plane VMs during the baseline con�guration. The user planehas 16vCPUs out of which 2 are b-processes, 9 of them are a-processes and one c-processas in the Figure 3.4.6.
24

3. Methodology
C BCP1 UP1
NUMA 0
QPI B A
A A A AA A
NUMA 1
A A
Figure 3.14: vEPG deployment with 1CP and 1UP (result 4.10).
This deployment is almost the same as the deployment in section 3.4.4, but this con�g-uration saves the memory and hard disk of the host machine that was allocated for theother control plane VM on the baseline con�guration, since it deploys with only onecontrol plane. Since the signaling communication is only between the one control planeand one user plane VMs, the result is almost the same as the con�guration in section3.4.4.
25
4Results
In this chapter, the performance assessment of the di�erent con�gurations discussed inthe methodology chapter is presented in depth. First the results for the baseline con�gu-rations on the SSR platform with Intel processors for both NUMA-aware and deactivatedNUMA-awareness con�gurations are discussed. Next, the results for the di�erent con-�gurations that deploy EPG virtually (vSSR) are explained.
Finally, there is a discussion section based on the comparison of the results of all con-�gurations. For the purpose of non-disclosure of sensitive information, all the actualpacket-per-second values processed by each con�guration are not revealed. On the y-axis percentage is used to compare the result of each con�guration in relation to thebaseline con�guration on all the tables.
4.1 Evaluation
In this thesis work, the average CPU utilization is the main metric of comparing perfor-mance between di�erent con�gurations. A con�guration with lower CPU utilization isconsidered more e�cient for the same load. On the SSR, 100% is the target CPU Utiliza-tion to identify and evaluate the impact of NUMA-aware and NUMA-unaware con�g-urations on the EPG. On the virtualized deployments, 50% is taken as a target averageCPU utilization, even for the baseline con�guration. The average CPU utilization ofeach con�guration on the �nal iteration is compared with the average CPU utilizationof the baseline on that iteration for the same number of sessions. Then, the averageCPU utilization di�erence between the baseline and any con�guration is considered asperformance improvement or degradation.
During the Dallas simulations, extensive and detailed logs are generated for the perfor-mance of each con�guration tested. Comparing between these outputs is based on themain metrics provided by the tool and the ones that have been used in this study arelisted bellow:
Sessions
As mentioned previously, the amount of sessions is directly connected to the number ofsimulated users connected to the system. There is a stable ratio between sessions andnumber of packages simulated, thus it cannot be revealed. Their number is increased inevery iteration to achieve the desired load (sessions).
26

4. Results
Packets per Second
The main metric of every simulation is the amount of packets the gateway can handlebefore its breaking point is reached.
Throughput
EPG’s throughput allows further investigation based on its bandwidth and can add greatvalue on a stress test. Since the size of packets in the simulations varies and because theEPG is more than capable of withstanding loads higher than the ones achieved in ourtests, we present this result without relying on it for performance evaluation. Focusingon processing the package headers was of greater importance than the package context,and the system bottleneck we are studying.
CPU Utilization
At any given step of a simulation the percentage of CPU utilization is known. It is a reli-able representation of the e�ciency of the con�guration and reveals the real bottleneckof the system in every occasion. Two �elds relative to CPU utilization are presented inthe result tables. The average CPU reveals the utilization percentage on a stable statefor that given load, while peak CPU is the value documented on the breaking point.
Packets dropped per million
It is essential for the deployed EPG to meet a high robustness and reliability level. Inorder to maintain QoS the threshold for acceptable packet drop is kept low. This is thereason that this number is also taken into account for the success or failure of a test.Dallas has the ability to take measurements on both sides of the gateway because it actsboth as the sender and receiver of the payload. Keeping record of the sent and receivedtra�c allows for easy calculation of the amount of discarded packets.
4.2 Baseline Con�guration on SSR
The test results for NUMA-aware con�gurations on SSC3 cards when the CPU reachesits peak point, are presented in Table 4.1. On the SSR platform, every con�guration istested twice to verify its stability. As shown in Table 4.1, an amount of X packets isprocessed in the �nal iteration of the �rst test. The number of sessions sent to the nodeon both tests is identical. The same for the second test, the EPG processed 0.09% morepackets per second over the �rst test. For the NUMA-aware con�guration, Dallas ini-tially sent 2,500,000 sessions to the EPG node on both tests. At this point, the peak CPUof the node was 83% for both tests. For every following iteration, Dallas multiplies thenumber of sessions sent to the node by a factor of 1.02 until the node fails to pass theconditions discussed in section 3.2.
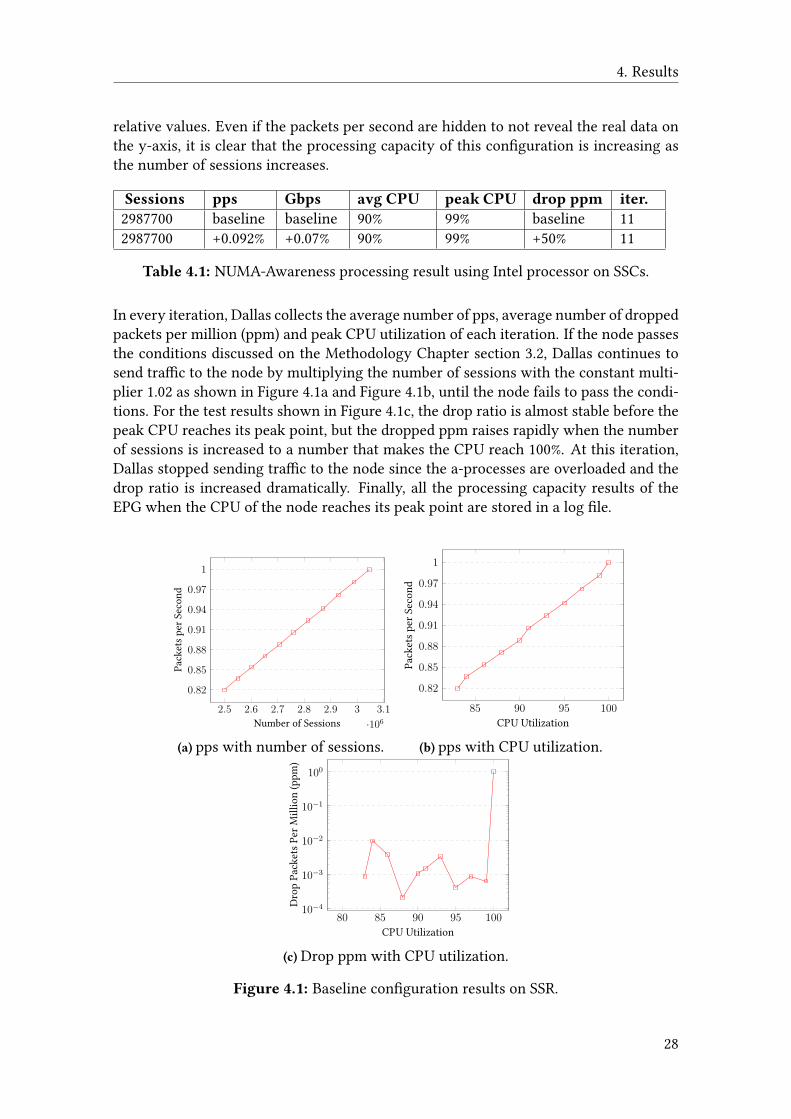
Figure 4.1 shows the test result for the NUMA aware con�guration on the SSC3 cards.The relationship between session and pps is plotted on 4.1a, where the number of ses-sions are shown on the x-axis as an independent variable and pps on the y-axis with
27
4. Results
relative values. Even if the packets per second are hidden to not reveal the real data onthe y-axis, it is clear that the processing capacity of this con�guration is increasing asthe number of sessions increases.
Sessions pps Gbps avg CPU peak CPU drop ppm iter.2987700 baseline baseline 90% 99% baseline 112987700 +0.092% +0.07% 90% 99% +50% 11
Table 4.1: NUMA-Awareness processing result using Intel processor on SSCs.
In every iteration, Dallas collects the average number of pps, average number of droppedpackets per million (ppm) and peak CPU utilization of each iteration. If the node passesthe conditions discussed on the Methodology Chapter section 3.2, Dallas continues tosend tra�c to the node by multiplying the number of sessions with the constant multi-plier 1.02 as shown in Figure 4.1a and Figure 4.1b, until the node fails to pass the condi-tions. For the test results shown in Figure 4.1c, the drop ratio is almost stable before thepeak CPU reaches its peak point, but the dropped ppm raises rapidly when the numberof sessions is increased to a number that makes the CPU reach 100%. At this iteration,Dallas stopped sending tra�c to the node since the a-processes are overloaded and thedrop ratio is increased dramatically. Finally, all the processing capacity results of theEPG when the CPU of the node reaches its peak point are stored in a log �le.
2.5 2.6 2.7 2.8 2.9 3 3.1·106
0.82
0.85
0.88
0.91
0.94
0.97
1
Number of Sessions
Pack
etsp
erSe
cond
(a) pps with number of sessions.
85 90 95 100
0.82
0.85
0.88
0.91
0.94
0.97
1
CPU Utilization
Pack
etsp
erSe
cond
(b) pps with CPU utilization.
80 85 90 95 10010−4
10−3
10−2
10−1
100
CPU Utilization
Dro
pPa
cket
sPer
Mill
ion
(ppm
)
(c) Drop ppm with CPU utilization.
Figure 4.1: Baseline con�guration results on SSR.
28

4. Results
To determine the packet-per-second processing capacity of the EPG without NUMA-awareness, we have deactivated the NUMA-aware con�guration of the EPG. As the re-sults show in Table 4.2, the peak CPU reaches 100% in the �rst iteration for both tests.When Dallas sends tra�c to the node with initial number of sessions at 2.7M, the peakCPU and the average CPU utilization on both tests reaches 100% automatically. Thismeans, both the b-processes and a-processes are overloaded and there are more pack-ets lost per million as shown in Table 4.2. Dallas sends tra�c with a lower number ofsessions less than the previous iteration to give a second chance to the node, but stillthe peak CPU is 100%. Therefore, if the node failed to process the required packets persecond, Dallas stopped sending tra�c, as the node drops a high number of packets persecond. For the second deactivated NUMA-awareness test, almost the same result isproduced as shown in Table 4.2
Sessions pps Gbps avg CPU peak CPU drop ppm iter.2382400 baseline baseline 100% 100% baseline 22382400 -0.13% -0.17% 100% 100% +24% 2
Table 4.2: Deactivated NUMA-Awareness processing result using Intel processor.
4.3 Virtualization
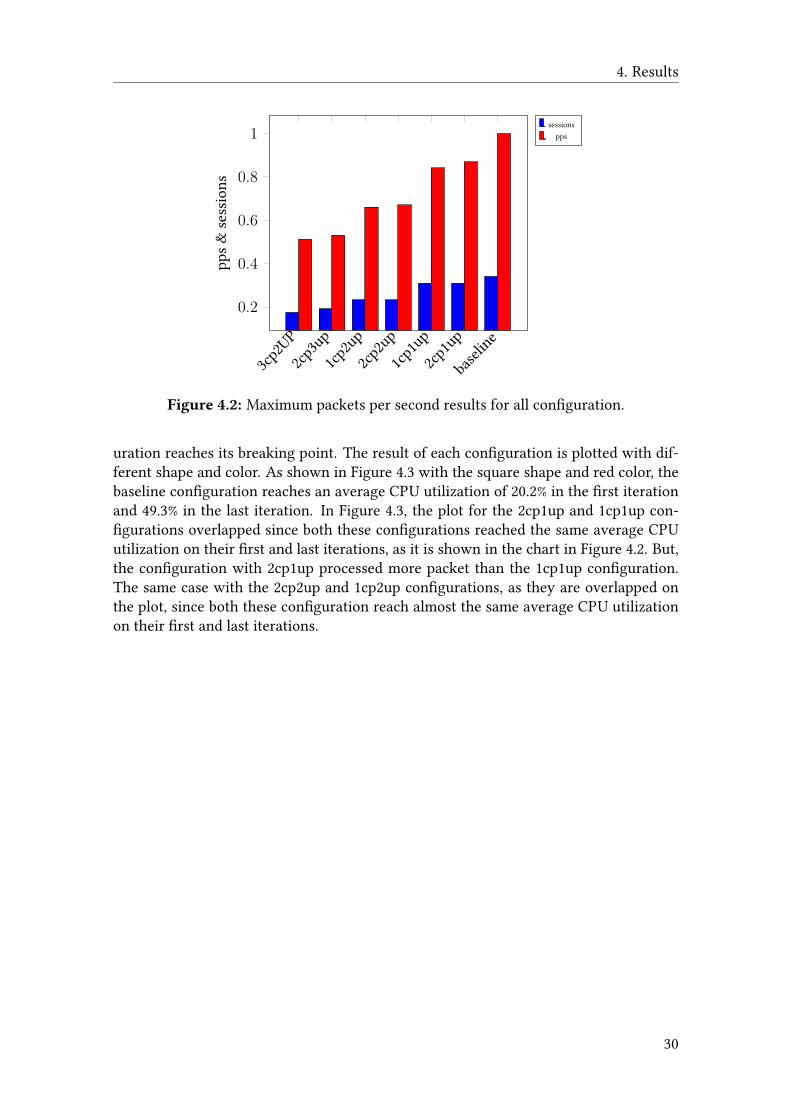
As discussed in section 3.4, the virtualization which deploys the EPG in a virtual environ-ment and the di�erent results for the vEPG using di�erent con�gurations are presentedhere. The bar chart in Figure 4.2 shows the relationship between number of sessions andpacket-per-second processing capacity of the node for the di�erent con�gurations. Theblue and red color bar charts represent the number of sessions and packet-per-secondprocessing capacity of each con�guration on the last iteration. Dallas sends a �xed num-ber of packets per second in one session with the same number of sessions for all thecon�gurations.
For every con�guration, 3.2 x 10⁵ sessions are sent in the �rst iteration but each con-�guration processed di�erent number of pps. For every con�guration, the number ofsessions for the next iteration is multiplied by a constant number 1.1. As it is shownin the Figure 4.2, there are 7 con�gurations which are named in the x-axis. Each namerepresents one of the con�guration we discussed in the methodology chapter. The name"baseline" refers to the baseline con�guration we have discussed in section 3.4.2. Thename "3cp2up" refers to the con�guration discussed in section 3.4.2 with 3 control planeand 2 user plane VMs. The name "2cp2up" refers to the con�guration discussed in sec-tion 3.4.3 that deploys the two control plane VMs in the same NUMA node and the twouser plane VMs in the second NUMA node. The names "2cp1up", "1cp2up", "1cp1up",and "3cp2up" refers to the con�gurations discussed in section 3.4.4, section 3.4.5, section3.4.6, and section 4.5 respectively. The names in Figure 4.3 and Figure 4.4 also refer tothe di�erent con�gurations discussed in the methodology chapter.
Looking at the results in Figure 4.3, we observe that each con�guration processed dif-ferent amount of packets per second when the average CPU utilization of each con�g-
29
4. Results
3cp2U
P2cp
3up1cp
2up2cp
2up1cp
1up2cp
1up
baseli
ne
0.2
0.4
0.6
0.8
1
pps&
sess
ions
sessionspps
Figure 4.2: Maximum packets per second results for all con�guration.
uration reaches its breaking point. The result of each con�guration is plotted with dif-ferent shape and color. As shown in Figure 4.3 with the square shape and red color, thebaseline con�guration reaches an average CPU utilization of 20.2% in the �rst iterationand 49.3% in the last iteration. In Figure 4.3, the plot for the 2cp1up and 1cp1up con-�gurations overlapped since both these con�gurations reached the same average CPUutilization on their �rst and last iterations, as it is shown in the chart in Figure 4.2. But,the con�guration with 2cp1up processed more packet than the 1cp1up con�guration.The same case with the 2cp2up and 1cp2up con�gurations, as they are overlapped onthe plot, since both these con�guration reach almost the same average CPU utilizationon their �rst and last iterations.
30

4. Results
10 15 20 25 30 35 40 45 500.4
0.6
0.8
1
CPU utilization
Pack
etsp
erSe
cond
baseline
2cp3up
2cp2up
2cp1up
1cp2up
1cp1up
3cp2up
Figure 4.3: Packets per second with CPU utilization.
The relationship between average CPU utilization and packets per million dropped areshown in Figure 4.4. The drops are either on the vSwitch or on the di�erent VM cards.Since the bandwidth of the vSwitch is 10Gbps, there are more packet drops on thevSwitch if the bandwidth of the EPG is greater than 8Gbps. There are also more packetdrops on the VM cards if the number of sessions sent to the node and the placementof VMs is not con�gured correctly. As shown in Figure 4.4, there is a threshold levelthat limits drops packet per million a node can drop to continue to the next iteration.The threshold is set to 2000 packets per million. If a con�guration drops more than 2000packets per million in one iteration, Dallas stops sending tra�c to the node and this dropis recorded as the �nal step of this con�guration. The packet-per-second processing ca-pacity, average CPU utilization and total packet drops per million of each con�gurationare discussed in details in the following sections.
31

4. Results
5 10 15 20 25 30 35 40 45 50 5510−6
10−5
10−4
10−3
10−2
10−1
100
CPU utilization %
drop
ppm
baseline2cp3up2cp2up2cp1up1cp2up1cp1up3cp2up
Threshold
Figure 4.4: drop packets per million vs CPU utilization.
4.3.1 vEPG deployment with 8vCPU UP on each NUMA nodeThe result for the deployment presented in section 3.4.2 with a total of 8vCPUs in eachuser plane VM is shown in Table 4.3. Since memory and vCPUs of each VM are de�nedin the con�guration �le during the deployment process, deactivating the NUMA-awarecon�guration in virtualization does not a�ect the performance of the EPG. To check thiscondition, we run a test by deactivating the NUMA-aware con�guration of the EPG,and the result is almost the same as shown in Table 4.3 for both the NUMA and UMAcon�gurations. Therefore, since the rest of the CPU pinning scenarios and di�erent con-�gurations of the virtualization are tested based on the NUMA-aware con�gurations ofthe EPG, we have taken the NUMA-aware result shown in Table 4.3 as our baseline.
Sessions pps Gbps avg CPU peak CPU drop ppm iter.NUMA 754600 baseline baseline 49.3% 55% baseline 10UMA 754600 -0.13% -0.17% 48.5% 54% +24.04% 10
Table 4.3: Results for scenario 3.6.
The packet-per-second processing capacity and number of sessions on the last iterationof this con�guration is shown in the bar chart Figure 4.2 with the name baseline. Thisbaseline con�guration processed some amount of packets when the number of sessionare 754600. The relationship between CPU utilization and packet-per-second processingcapacity of the node on this con�guration is shown in Figure 4.3. In Figure 4.3, the ppsprocessing of the node increases linearly as the average CPU utilization increases. Whenthe average CPU utilization of the EPG reaches the target 50% CPU utilization as shown
32

4. Results
in Figure 4.3 with the name "baseline", Dallas stopped sending tra�c to the node. Figure4.4 with square shape and red color, shows the total packet-per-million drops of thenode in each iteration. For the �rst �ve iterations, the packet loss was very small andthe node was stable, but when the average CPU utilization of the CPU becomes greaterthan 40%, the drop ratio increases to high packet loss. This is because, the vSwitch wehave discussed in section 3.4 is becoming a bottleneck. Therefore, when the bandwidthof the node approaches the 8Gbps mark, there are more packets dropped on the vSwitch.
CPU Pinning Scenarios
On the baseline con�guration, two pinning scenarios are tested. The results for thepinning scenarios discussed in section 3.8 and 3.7 are shown in Table 4.4. For pinningone b-process and one a-process to another NUMA node, the average CPU utilizationreaches the target CPU when the number of sessions reached 515,400 in the 6th iteration.For the second scenario pinning the two a-processes to the other NUMA node as siblingprocesses, the average CPU of the node reaches the target CPU when the number ofsessions is 468,500 in the 5th iteration. Pinning of one b-process and one a-process onanother NUMA node processed more packets than pinning two a-processes. This showsthat it is better to pair one b-process and one a-process as sibling processes so that thelatency to send the packet to the a-process is relatively small and they might use thesame cache memory.
Sessions pps Gbps avg CP peakCPU
dropppm
iter.
1A&1B 515400 -0.03% -0.12% 49.4% 53% +91.03% 62A 468500 -0.02% baseline 48.1% 51% baseline 5
Table 4.4: Results for scenarios 3.8 and 3.7 respectively.
4.3.2 vEPG deployment with 3CP and 2UP VMsFor the deployment we discussed in section 3.4.2, the result is shown in Table 4.5. Thiscon�guration stopped at iteration 3 when the average CPU utilization of the node reachedthe target CPU 50%. The average CPU utilization of this con�guration reaches the targetCPU early in iteration 3, since there is a small number of b-processes and a-processes asdiscussed in section 3.4.2. This deployment processed 0.07 percent less packets than thebaseline con�guration as shown in Table 4.5, when the target CPU is set to 50% .
Sessions pps Gbps avg CPU peak CPU drop ppm iter.387200 -0.02% baseline 48.7% 50% +38506% 3
Table 4.5: Results for scenario 3.9.
The pps processing capacity and sessions of this con�guration on the last iteration isshown in the bar chart Figure 4.2 with the name 3cp2up. The average CPU utilization of
33
4. Results
this con�guration reaches 40.1% early.The packet-per-second processing of the con�gu-ration increases almost linearly as the average CPU utilization increases, until it reachesthe target CPU shown in Figure 4.3 with triangle shape and green color. The drop ratioalso increases for every next iteration as shown in Figure 4.4 with the triangle shapeand green color. Since there are only two a-processes in the user plane VMs, they areoverloaded as the number of sessions increases in every iteration and the drop ratio alsoincreases.
4.3.3 vEPG deployment with 2CP and 3UP VMsThe following Table 4.6, contains the results for the vEPG deployment with 2 controlplane and 3 user plane VMs. As we have discussed in section 3.4.2, the main objec-tive of this con�guration is to increase the b-processes and a-processes by deploying 3user plane VMs instead of 2 user plane VM in section 3.4.2. This deployment stoppedearly at iteration 4 and processed more packets than the deployment in section 3.4.2, butthis con�guration processed less packets per second than the baseline con�guration by5.59% as shown in Table 4.6. Finally, this con�guration stopped in the 4th iteration with-out reaching the target CPU when the average CPU utilization reached 37.4%, which is27.80% performance degradation from the baseline con�guration. The relationship be-tween the average CPU utilization and packets per second of this con�guration is shownin Figure 4.3 with the square shape and black color.
Sessions pps Gbps avg CPU peak CPU drop ppm iter.425900 -5.95% -6% 37.4% 40% +4374440% 4
Table 4.6: Results for scenario 3.10.
On the 4th iteration, Dallas stopped sending tra�c to the node since there are morepackets dropped as shown in Figure 4.4 with square shape and black color. On thiscon�guration, there are more packet drops as the number of sessions is increasing inevery iteration, and the 2 control plane VMs are not able to route all the packets, becausethe a-processes are overloaded. The packets per second processed and the number ofsessions of this con�guration is shown in the bar chart shown in Figure 4.2 with thename 2cp3up. The pps processing capacity of the node was increasing linearly as thenumber of sessions increases. But, the pps processing capacity of the node fails to belinear when the number of sessions are 3.9 x 10⁵ as more packets are dropped duringthat iteration.
4.3.4 vEPG deployment with 2CP and 2UP VMsThe result for the vEPG deployment we discussed in section 3.4.3 with both the userplane VMs on the �rst NUMA node and the control plane VMs on the second NUMAnode is shown in Table 4.7. The main objective of this con�guration is to see the im-pact of separating the control VMs from the user plane VMs between the NUMA nodes.The packets per second processing capacity and number of session on the last iteration
34

4. Results
of this con�guration is shown in the bar chart shown in Figure 4.2. This con�gurationprocessed 1.97 percent less packets than the baseline con�guration when the number ofsessions is 515,400 on the last iteration.
Sessions pps Gbps avg CPU peak CPU drop ppm iter.515400 -1.97% -2.03% 34.8% 39% +25321% 6
Table 4.7: Result for scenario 3.11.
The relationship between average CPU utilization and packet-per-second processing ca-pacity of this con�guration is shown in Figure 4.3 with the name "2cp2up". The aver-age CPU utilization of this con�guration reaches 12% in the �rst iteration and 34.8% inthe last iteration. As shown in Figure 4.2, this con�guration has almost the same CPUutilization with the 1cp2up con�guration. The packet-per-million drop count of thiscon�guration was below the threshold before the average CPU utilization reaches 31.5%as it shown in Figure 4.4, but this con�guration drops almost 25321% more packets permillion than the baseline con�guration when the number of sessions is 515,400.
4.3.5 vEPG deployment with 2CP and 1UP VMsTable 4.8, shows the result at the 9th iteration for the vEPG deployment with two con-trol plane VMs on the �rst NUMA node and one user plane VM on the second NUMAnode as we discussed in section 3.4.4. This deployment processed 4.93% less packets persecond than the baseline con�guration when the CPU utilization of this con�gurationreaches 26% in the last iteration. Since this deployment has more a-processes than thedeployment in section 3.4.3 and has more control plane VMs than the user plane VMs,it processes more packets than the con�guration in section 3.4.3.
Sessions pps Gbps avg CPU peak CPU drop ppm iter.686000 -4.39% -2.29% 26% 28% 9868% 9
Table 4.8: Result for scenario 3.12.
The packet-per-second processing capacity and number of sessions of this con�gurationon the last iteration is shown on the bar chart in Figure 4.2 with the name "2cp1up". Thiscon�guration processed some packets when the number of sessions is 686,000 on thelast iteration. The packet-per-second processing capacity of the node increases as theaverage CPU utilization increases as in the Figure 4.3. This con�guration reaches 12%average CPU utilization when the number of sessions is 320,000 in the �rst iteration and26% when the number of sessions is 686,000 in the last iteration. As shown in Figure 4.4,the dropped packets per million of this con�guration was running below the thresholdlevel until iteration 7, but it raises above the threshold level in the 8th iteration. Thepps processing capacity of this con�guration is saved as the last iteration since no moreiterations are performed.
35

4. Results
4.3.6 vEPG deployment with 1CP and 2UP VMsThe result of the vEPG deployment with one control plane on the �rst NUMA node andtwo control plane VMs on the second NUMA node is shown in Table 4.9. This con�gura-tion stopped in the 6th iteration at an average CPU utilization of 35% when the numberof sessions is 515,400. The result of this con�guration is almost the same as the resultof the con�guration we discussed in section 3.4.3, but this con�guration uses only oneuser plane VM with more a-processes and b-processes instead of two UPs as in the con-�guration on section 3.4.3.
Sessions pps Gbps avg CPU peak CPU drop ppm iter.515400 -3.34% -3.43% 35% 38% +39158% 6
Table 4.9: Result for scenario 3.13.
The bar chart in Figure 4.2 with the name "1cp2up", shows the pps processing capacityand number of sessions of this con�guration. This con�guration processed 3.34% lesspackets than the baseline con�guration when the number of sessions is 515,400 in thelast iteration. The pps processing capacity of this con�guration increases as the averageCPU utilization increases as shown in Figure 4.3 with the name "1cp2up". The packetsper million dropped in this con�guration are below the threshold level until it reachesiteration 5. At iteration 6, the pps processed by the node raise above the threshold levelas shown in Figure 4.4 with a name "1cp2up". The result of this con�guration shows thathaving two CP VMs with two UP VMs like the con�guration we discussed in section3.4.3, is the same as having one CP VM for two UP VMs in this con�guration. These twocon�gurations have almost the same pps processing capacity with the same average CPUutilization as shown in Figure 4.3 with the names "2cp2up" and "1cu2up".
4.3.7 vEPG deployment with 1CP and 1UP VMsFor the con�guration discussed in section 3.4.6, the result is shown in Table 4.10. Thiscon�guration processed 15.82% less packets at an average CPU utilization of 26% whenthe number of sessions is 686,000 in the last iteration. This con�guration drops 8577%more packets per million. The packets per second processed on the node increase almostlinearly until the 8th iteration is reached, but falling rapidly after iteration 8 as there ishigh packet drop in the 9th iteration.
Sessions pps Gbps avg CPU peak CPU drop ppm iter.686000 -15.82% -14.79% 26% 28% +8577% 9
Table 4.10: Result for scenario 3.14.
The packets per second processed and the number of sessions in the last iteration of thiscon�guration is shown in the bar chart in Figure 4.2 with the name "1cp1up". The average
36

4. Results
CPU utilization of this con�guration reaches 12% in the �rst iteration and 26% in the lastiteration. As shown in Figure 4.3, the average CPU utilization of this con�guration isalmost overlapping with the 2cp1up con�guration as both of them reached the sameaverage CPU utilization in almost all of the iterations. This con�guration dropped morepackets than the 2cp1up con�guration as shown in Figure 4.4.
4.4 Discussion
As discussed in section 2.2, the di�erence in average CPU utilization between the NUMA-aware and deactivated NUMA-aware con�guration on the SSC3 (SSR platform) is notdetermined as the peak CPU of the node for the deactivated NUMA-aware con�gura-tion reached 100% early. To compare the CPU load of the baseline con�gurations withthe deactivated NUMA-aware con�guration, we made a test by lowering number of ses-sions for both con�gurations. We lowered the number of sessions to 1.5M for the �rstiteration, which means that Dallas starts sending 1,500,000 sessions to the node on the�rst iteration and multiply it by a factor of 1.02 for the next iteration until the peak CPUreaches 100%, or stop when it runs for 11 iterations without failure.
For this number of sessions, the node is stable for both the NUMA-aware and deacti-vated NUMA-aware con�gurations. Both con�gurations run for 11 iterations withoutfailure as shown in Table 4.11. From Table 4.11, it is clear 3450% more packets per mil-lion are dropped on the deactivated NUMA-aware con�guration than the NUMA aware-con�guration. This shows that even if the b-processes and a-processes of the node areable to handle this number of sessions as NUMA-aware con�gurations, there may ex-ist packet loss due to cache misses as the b-processes have no speci�ed a-processes todistribute the packets like the NUMA-aware con�guration. The CPU utilization of thenode for both con�guration increases almost linearly as the number of session increasesin Figure 4.5.
Sessions pps Gbps avg CPU peak CPU drop ppm iter.NUMA 1865100 baseline baseline 62.8% 65% baseline 11UMA 1865100 0.02% +0.12% 87% 91% +3450% 11
Table 4.11: NUMA-aware and UMA con�gurations results for less number of sessions.
In the 11th iteration, the average CPU utilization of the NUMA-aware con�gurationreaches 62.8% when the number of sessions sent from Dallas is 1,865,100. At this itera-tion the average CPU utilization of the node for the deactivated NUMA-aware con�gu-ration reaches 87.0% for the same number of sessions as the NUMA-aware con�guration.This means that the NUMA-aware con�guration processed this number of sessions at anaverage CPU utilization of 62.8% while the deactivated NUMA-aware con�guration pro-cessed the same amount at an average CPU utilization of 87%. We observed performancedegradation of almost 24.2% on the node when the NUMA-awareness is deactivated.
37

4. Results
1.2 1.4 1.5 1.6 1.7 1.8 1.9·106
40
60
80
100
Number of Sessions
CPU
utili
zatio
n
numauma
Figure 4.5: packets per second with number of sessions.
Virtualization
Since we presented the results of each con�guration on virtualization in section 4.3, theresults for the di�erent con�gurations are discussed and compared in this section.
The result for the baseline and all other con�gurations are shown in Table 4.12. Thebaseline runs for 10 iterations and is our reference for the rest of the con�gurations. Theresult of every con�guration on its breaking point is compared with the baseline on thatiteration with the same number of sessions.
In the Table 4.12, the column perf(+/-) is used to indicate the performance improvementor degradation in reference with the average CPU utilization of the baseline con�gu-ration. The CPU utilization is compared with the iteration at which the con�gurationstopped. For example, for the con�guration 3cp2up, it stopped at iteration number 3, theCPU utilization of this con�guration is compared with the baseline con�guration at iter-ation 3. The column sessions, specify the number of sessions sent on each iteration. Thenumber of sessions sent is equal for all the con�gurations on each iteration. The "iter"column, indicates the iteration at which the node failed to process the required packets,meaning the iteration at which Dallas stopped sending tra�c to the node because of thenode failing to pass one of the condition discussed in section 3.2 or may have reachedthe target CPU.
As discussed in section 4.3.1, deactivating NUMA-awareness con�guration on virtual-ization does not a�ect the performance of the node. Therefore the CPU utilization dif-ference between the NUMA-aware and deactivated NUMA-aware con�gurations is 0.8%,which is almost the same result, except there are more packet drops in the NUMA-aware
38

4. Results
con�guration than in the deactivated NUMA-aware.
For the con�guration in which we pinned one b-process and one a-process, the averageCPU utilization reaches the target CPU at iteration number 6, while the average CPUutilization of the baseline con�guration reaches 33.1% for the same number of sessionsat the same iteration. This shows a performance degradation of 16.4% on this con�gu-ration than the baseline con�guration.
The same for the con�guration in which we pinned two a-processes, the average CPUutilization reaches (48.1%) on the target CPU at iteration 5, while the CPU utilizationof the baseline con�guration at this iteration is 30% for the same number of sessions(468,500) (Table 4.12). Therefore, there is 18.1% performance degradation on this con�g-uration than the baseline con�guration.
Con�g Sessions pps Gbps avgCPU
peakCPU
dropppm
Stops@iter.
perf(+/-)
Baseline 754600 baseline 11.49 49.3% 55% baseline 10UMA 754600 -0.13% -0.17% 48.5% 54% +24.04% 10 + 0.8%baseline 515400 baseline baseline 33.1% 37% baseline 6pinn.B&1A 515400 -0.03% -0.12% 49.4% 53% +91.03% 6 -16.4%baseline 468500 baseline baseline 30.0% 34% baseline 5pinn.2A 468500 -0.02% baseline 48.1% 51% baseline 5 -18.1%baseline 387200 baseline baseline 25.0% 28% baseline 33cp2up 387200 -0.02% baseline 48.7% 50% +38506% 3 -23.7%baseline 425900 baseline baseline 27% 31% baseline 42cp3up 425900 -5.95% -6% 37.4% 40% +4374440% 4 -10.4%baseline 515400 baseline baseline 33.1% 37% baseline 62cp2up 515400 -1.97% -2.03% 34.8% 39% +25321% 6 -1.7%baseline 686000 baseline baseline 44.7% 50% baseline 92cp1up 686000 -4.39% -2.29% 26% 28% 9868% 9 +18.7%baseline 515400 baseline baseline 33.1% 37% baseline 61cp2up 515400 -3.34% -3.43% 35% 38% +39158% 6 -1.9 %baseline 686000 baseline baseline 44.7% 50% baseline 91cp1up 686000 -15.82% -14.7% 26% 28% +8577% 9 +18.7%
Table 4.12: Results for the di�erent scenarios relative to the baseline’s iteration.
The average CPU utilization of the 6vCPUs default deployment con�guration with 3CPand 2UP VMs reaches the target CPU at iteration number 3 when the number of sessionsis 387,200 while the average CPU utilization of the baseline con�guration is at 25% forthe same number of sessions. On this con�guration, there are only two b-processes andtwo a-processes which are half of the number of b-processes and a-processes in the base-line con�guration. As a result, there is 23.7% performance degradation than the baselinecon�guration.
39
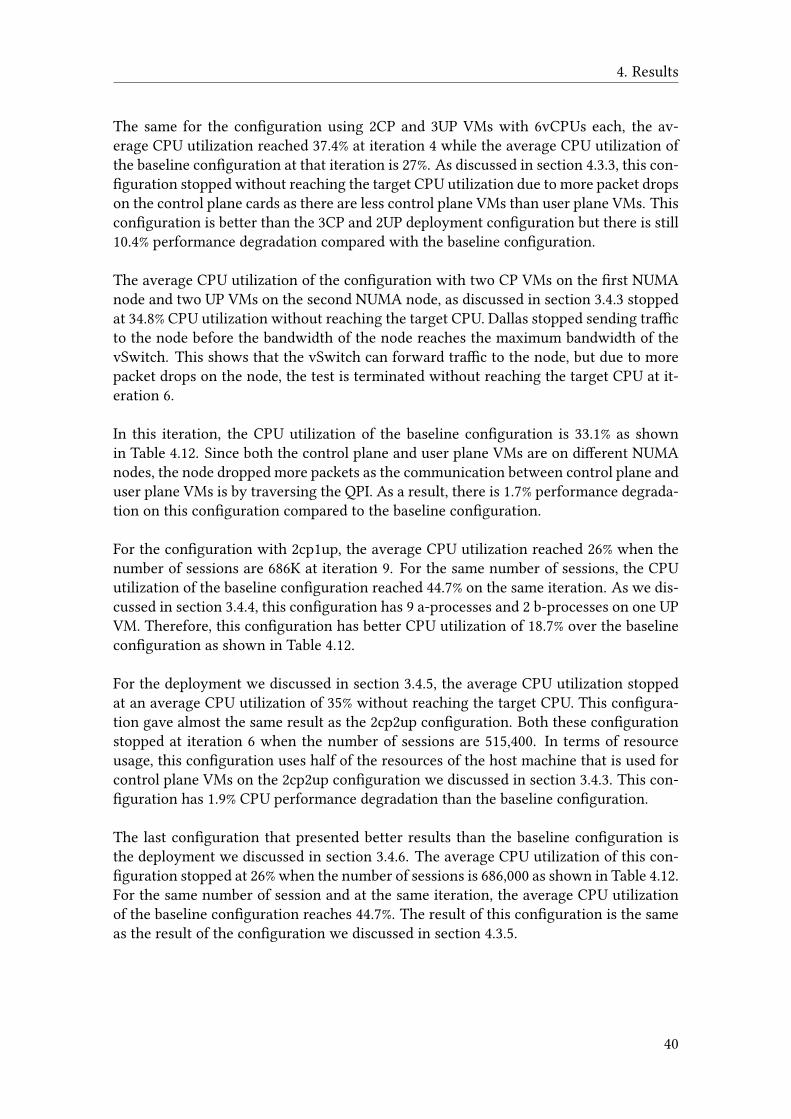
4. Results
The same for the con�guration using 2CP and 3UP VMs with 6vCPUs each, the av-erage CPU utilization reached 37.4% at iteration 4 while the average CPU utilization ofthe baseline con�guration at that iteration is 27%. As discussed in section 4.3.3, this con-�guration stopped without reaching the target CPU utilization due to more packet dropson the control plane cards as there are less control plane VMs than user plane VMs. Thiscon�guration is better than the 3CP and 2UP deployment con�guration but there is still10.4% performance degradation compared with the baseline con�guration.
The average CPU utilization of the con�guration with two CP VMs on the �rst NUMAnode and two UP VMs on the second NUMA node, as discussed in section 3.4.3 stoppedat 34.8% CPU utilization without reaching the target CPU. Dallas stopped sending tra�cto the node before the bandwidth of the node reaches the maximum bandwidth of thevSwitch. This shows that the vSwitch can forward tra�c to the node, but due to morepacket drops on the node, the test is terminated without reaching the target CPU at it-eration 6.
In this iteration, the CPU utilization of the baseline con�guration is 33.1% as shownin Table 4.12. Since both the control plane and user plane VMs are on di�erent NUMAnodes, the node dropped more packets as the communication between control plane anduser plane VMs is by traversing the QPI. As a result, there is 1.7% performance degrada-tion on this con�guration compared to the baseline con�guration.
For the con�guration with 2cp1up, the average CPU utilization reached 26% when thenumber of sessions are 686K at iteration 9. For the same number of sessions, the CPUutilization of the baseline con�guration reached 44.7% on the same iteration. As we dis-cussed in section 3.4.4, this con�guration has 9 a-processes and 2 b-processes on one UPVM. Therefore, this con�guration has better CPU utilization of 18.7% over the baselinecon�guration as shown in Table 4.12.
For the deployment we discussed in section 3.4.5, the average CPU utilization stoppedat an average CPU utilization of 35% without reaching the target CPU. This con�gura-tion gave almost the same result as the 2cp2up con�guration. Both these con�gurationstopped at iteration 6 when the number of sessions are 515,400. In terms of resourceusage, this con�guration uses half of the resources of the host machine that is used forcontrol plane VMs on the 2cp2up con�guration we discussed in section 3.4.3. This con-�guration has 1.9% CPU performance degradation than the baseline con�guration.
The last con�guration that presented better results than the baseline con�guration isthe deployment we discussed in section 3.4.6. The average CPU utilization of this con-�guration stopped at 26% when the number of sessions is 686,000 as shown in Table 4.12.For the same number of session and at the same iteration, the average CPU utilizationof the baseline con�guration reaches 44.7%. The result of this con�guration is the sameas the result of the con�guration we discussed in section 4.3.5.
40
4. Results
Summary of this chapterOn this chapter, we assessed and discussed the results of di�erent con�guration on theSSR platform and virtualization. We used average CPU utilization as our comparisonmetrics for all the con�gurations. Since CPU utilization and and packets per secondcount of a con�guration is linearly proportional, it is known a con�guration with betterCPU utilization will process mare packets than a con�guration with worse CPU uti-lization for the same number of sessions. On the SSR platform, we run a test for theNUMA-aware and deactivated NUMA-aware con�guration. As we have discussed insection 4.4, there is 24.4% performance degradation on the NUMA-unaware con�gura-tion than the NUMA-aware con�guration.
On the virtualization, we used 50% average CPU utilization as a target CPU utilizationas the bandwidth of the vSwitch is limited to some constant value. From all the con-�gurations, Both the 1cp1up and 2cp1up con�gurations showed 18.7% CPU utilizationperformance improvement over the baseline con�guration. This con�guration uses oneCP VM instead of two as the 2cp1up con�guration. Therefore, this con�guration savesthe memory and hard disk of the host machine that was used by one control plane VM onthe 2cp1up con�guration. But, the 2cp1up con�guration processed 3.1377 percent morepackets per second than the 1cp1up con�guration and has 72.4119 percent less packetsper million drop ratio than the 1cp1up con�guration. Therefore, based on average CPUutilization the 2cp1up con�guration is the most e�cient con�guration than all the con-�gurations we have tested so far.
41

5Conclusion
This chapter is a general conclusion of the thesis work. We divided the chapter into twosections. In the �rst section we conclude the work of this thesis in short, and in thefuture work section we discuss about a future study that could follow our concept andfocus on the latest AMD server processors.
5.1 Conclusion
In this project, we have shown the impact of NUMA and UMA con�gurations of the EPGon the SSR routers using Intel server processors. The results presented lead to the factthat deactivating NUMA-awareness shows a 24% average CPU utilization degradationthan the NUMA-aware con�gurations. Furthermore, we have deployed the EPG virtuallyto investigate the impact of di�erent deployment and pinning scenarios on the virtual-ized SSR using the VIRTIO virtualization technology. On the virtualization, we haveshown that deactivated NUMA-aware con�gurations do not a�ect the performance ofthe EPG, because the memory of the VMs is de�ned on the con�guration �le during theorchestration process.
As we have discussed in section 4.4, we have taken the con�guration described in sec-tion 3.4.2 as a baseline to evaluate the rest of the con�gurations. As shown in Table 4.12,both the con�gurations with 2cp1up and 1cp1up have 18.7% CPU average utilizationimprovement over the baseline con�guration and are the most e�cient con�gurationsof the ones tested in this study. Based on packet-per-second processing capacity andpackets dropped, the con�guration with 2cp1up is better than the 1cpu1up con�gura-tion, and we can state in con�dence that this con�guration showed higher e�ciency ofCPU utilization on the virtualization among all con�gurations.
5.2 Future Work
During this project, we experimented with Intel-processor servers and designed our testscenarios based on the diversity we could achieve and the variety of performance resultswe could produce. In our initial plan we also wanted to work on the newly acquired AMDEPYC series processors and the servers based on them. Since AMD EPYC has 8 NUMAnodes, it is possible to test more con�guration than we did on the virtual environment.By the time of �nishing this study we did not have the opportunity to achieve that goal,because of the availability of those systems and the time-plan of this work. This goal
42

5. Conclusion
could be achieved in a future study, because the AMD’s unique architecture is of greatinterest regarding NUMA con�gurations as shown in the next section.
5.2.1 AMD EPYCAll AMD EPYC processors are composed of four eight-core Zeppelin dies. Thus, a dualsocket EPYC setup is in fact a virtual octa-socket NUMA system. This topology is idealin applications with many independently working threads such as small VMs, which isthe case for the EPC. This processor is a System-on-Chip processor with up to 32 Zencores per SoC [19] which allows "hyperthreading" concept so that each module, can pro-vide up to 64 threads.
This processor has two sockets that are connected with a PCI-Express (PCIe). EPYCprocessors support both single and dual-socket motherboards, and each EPYC processorprovides 8 memory channels and 128 PCIe 3.0 lanes for each socket. Each die in an EPYCmodule, contains four memory channels, 8 physical cores, one NUMA node and 4 PCIesas shown in Figure 5.1.
Socket 1Socket 0
QPI
Memory
Memory
Memory
Memory
Memory
Memory
Memory
Memory
Figure 5.1: AMD EPYC architecture.
Looking at the architecture presented on the �gure above, it is clear that there is a sig-ni�cant number of possible combinations and con�gurations that can be the subject ofa future study. The freedom given by the virtual deployment displays potential on cus-tomized setups, and it would be really interesting to investigate the performance of theseprocessors and the behaviour of their "internal NUMA nodes".
43

Bibliography
[1] Z. A. Qazi, M. Walls, A. Panda, V. Sekar, S. Ratnasamy, and S. Shenker, “A highperformance packet core for next generation cellular networks”, in Proceedings ofthe Conference of the ACM Special Interest Group on Data Communication, ser. SIG-COMM ’17, Los Angeles, USA, 2017, pp. 348–361.
[2] P. Lescuyer and T. Lucidarme, Evolved packet system (EPS): the LTE and SAE evo-lution of 3G UMTS. John Wiley & Sons, 2008.
[3] M. Olsson, S. Rommer, C. Mulligan, S. Sultana, and L. Frid, SAE and the EvolvedPacket Core: Driving the mobile broadband revolution. Academic Press, 2009.
[4] P. Satapathy, J. Dave, P. Naik, and M. Vutukuru, “Performance comparison of statesynchronization techniques in a distributed lte epc”, in 2017 IEEE Conference onNetwork Function Virtualization and Software De�ned Networks (NFV-SDN), Nov.2017, pp. 1–7.
[5] Y. Liu, Y. Zhu, X. Li, Z. Ni, T. Liu, Y. Chen, and J. Wu, “Simnuma: Simulating numa-architecture multiprocessor systems e�ciently”, in 2013 International Conferenceon Parallel and Distributed Systems, IEEE, 2013, pp. 341–348.
[6] C. Lameter et al., “Numa (non-uniform memory access): An overview.”, vol. 11,no. 7, p. 40, 2013.
[7] M. Awasthi, K. Sudan, R. Balasubramonian, and J. Carter, “Dynamic hardware-assisted software-controlled page placement to manage capacity allocation andsharing within large caches”, in 2009 IEEE 15th International Symposium on HighPerformance Computer Architecture, IEEE, 2009, pp. 250–261.
[8] S. Cho and L. Jin, “Managing distributed, shared l2 caches through os-level pageallocation”, in 2006 39th Annual IEEE/ACM International Symposium on Microar-chitecture (MICRO’06), IEEE, 2006, pp. 455–468.
[9] H. Dybdahl and P. Stenstrom, “An adaptive shared/private nuca cache partitioningscheme for chip multiprocessors”, in 2007 IEEE 13th International Symposium onHigh Performance Computer Architecture, IEEE, 2007, pp. 2–12.
[10] M. Awasthi, D. Nellans, K. Sudan, R. Balasubramonian, and A. Davis, “Managingdata placement in memory systems with multiple memory controllers”, Interna-tional Journal of Parallel Programming, vol. 40, no. 1, pp. 57–83, 2012.
[11] Z. Majo and T. R. Gross, “Memory management in numa multicore systems: Trappedbetween cache contention and interconnect overhead”, SIGPLAN Not., vol. 46,no. 11, pp. 11–20, Jun. 2011, issn: 0362-1340.doi:10.1145/2076022.1993481.[Online]. Available: http://doi.acm.org/10.1145/2076022.1993481.
[12] K. Harzallah and K. C. Sevcik, “Evaluating memory system performance of a large-scale numa multiprocessor”, in MASCOTS, 1994.
44

Bibliography
[13] D. Molka, D. Hackenberg, and R. Schöne, “Main memory and cache performanceof intel sandy bridge and amd bulldozer”, Jun. 2014. doi: 10.1145/2618128.2618129.
[14] D. Hackenberg, D. Molka, and W. E. Nagel, “Comparing cache architectures andcoherency protocols on x86-64 multicore smp systems”, in 2009 42ndAnnual IEEE/ACMInternational Symposium on Microarchitecture (MICRO), IEEE, 2009, pp. 413–422.
[15] S. Blagodurov, S. Zhuravlev, A. Fedorova, and A. Kamali, “A case for numa-awarecontention management on multicore systems”, in Proceedings of the 19th interna-tional conference on Parallel architectures and compilation techniques, ACM, 2010,pp. 557–558.
[16] M. S. Reorda, Z. Peng, and M. Violante, System-level test and validation of hard-ware/software systems. Springer Science & Business Media, 2006, vol. 17.
[17] J. Doweck, W.-F. Kao, A. K.-y. Lu, J. Mandelblat, A. Rahatekar, L. Rappoport, E.Rotem, A. Yasin, and A. Yoaz, “Inside 6th-generation intel core: New microarchi-tecture code-named skylake”, IEEE Micro, vol. 37, no. 2, pp. 52–62, 2017.
[18] K. Jackson, C. Bunch, and E. Sigler, OpenStack cloud computing cookbook. PacktPublishing Ltd, 2015.
[19] X. Guo, Best Practice Guide – AMD EPYC, http://www.prace-ri.eu/best-practice-guide-amd-epyc/, 2018.
45
List of Figures
2.1 Basic EPC architecture for LTE. . . . . . . . . . . . . . . . . . . . . . . . 62.2 Distributed EPC [4]. . . . . . . . . . . . . . . . . . . . . . . . . . . . . . . 82.3 Basic NUMA Architecture. . . . . . . . . . . . . . . . . . . . . . . . . . . 9
3.1 Tra�c �ow between Dallas and EPG. . . . . . . . . . . . . . . . . . . . . 143.2 NUMA-aware EPG Con�guration for SSC1. . . . . . . . . . . . . . . . . . 153.3 NUMA-aware EPG Con�guration for SSC3. . . . . . . . . . . . . . . . . . 163.4 V-EPG in physical hosts. . . . . . . . . . . . . . . . . . . . . . . . . . . . 173.5 vEPG virtualization using VIRTIO interface. . . . . . . . . . . . . . . . . 183.6 vEPD deployment with 8vCPUs on UPs (result 4.3). . . . . . . . . . . . . 203.7 A-processes on separate NUMA node (result 4.4). . . . . . . . . . . . . . 203.8 One b-process and one a-process on separate NUMA node (result 4.4). . . 213.9 vEPG deployment with 3CPs and 2UPs (result 4.5). . . . . . . . . . . . . . 223.10 vEPG deployment with 2CPs and 3UPs (result 4.6). . . . . . . . . . . . . . 223.11 vEPG deployment by separating CP and UP VMs (result 4.7). . . . . . . . 233.12 vEPG deployment with 2CPs and 1UP (result 4.8). . . . . . . . . . . . . . 233.13 vEPG deployment with 1CP and 2UPs (result 4.9). . . . . . . . . . . . . . 243.14 vEPG deployment with 1CP and 1UP (result 4.10). . . . . . . . . . . . . . 25
4.1 Baseline con�guration results on SSR. . . . . . . . . . . . . . . . . . . . . 284.2 Maximum packets per second results for all con�guration. . . . . . . . . 304.3 Packets per second with CPU utilization. . . . . . . . . . . . . . . . . . . 314.4 drop packets per million vs CPU utilization. . . . . . . . . . . . . . . . . 324.5 packets per second with number of sessions. . . . . . . . . . . . . . . . . 38
5.1 AMD EPYC architecture. . . . . . . . . . . . . . . . . . . . . . . . . . . . 43
I

List of Tables
4.1 NUMA-Awareness processing result using Intel processor on SSCs. . . . 284.2 Deactivated NUMA-Awareness processing result using Intel processor. . 294.3 Results for scenario 3.6. . . . . . . . . . . . . . . . . . . . . . . . . . . . . 324.4 Results for scenarios 3.8 and 3.7 respectively. . . . . . . . . . . . . . . . . 334.5 Results for scenario 3.9. . . . . . . . . . . . . . . . . . . . . . . . . . . . 334.6 Results for scenario 3.10. . . . . . . . . . . . . . . . . . . . . . . . . . . . 344.7 Result for scenario 3.11. . . . . . . . . . . . . . . . . . . . . . . . . . . . 354.8 Result for scenario 3.12. . . . . . . . . . . . . . . . . . . . . . . . . . . . 354.9 Result for scenario 3.13. . . . . . . . . . . . . . . . . . . . . . . . . . . . . 364.10 Result for scenario 3.14. . . . . . . . . . . . . . . . . . . . . . . . . . . . 364.11 NUMA-aware and UMA con�gurations results for less number of ses-
sions. . . . . . . . . . . . . . . . . . . . . . . . . . . . . . . . . . . . . . . 374.12 Results for the di�erent scenarios relative to the baseline’s iteration. . . 39
II

List of Abbreviations
AAA Authentication and Access AuthorizationCEE Cloud Execution EnvironmentCP Control PlaneDDR Double Data RateDINO Distributed Intensity NUMA OnlineeNodeB Evolved NodeBEPC Evolved Packet CoreEPG Evolved Packet GatewayEPS Evolved Packet SystemHOT Heat Orchestration TemplateHSS Home Subscriber ServeIntelSGX Intel Software Guard ExtensionsIP Internet ProtocolLC Line CardLLC Last Level CacheLTE Long-Term EvolutionMME) Mobility Management EntityNIC Network Interface CardNUMA Non-Uniform Memory AccessPCC Policy and Charging ControlPCIe Peripheral Component Interconnect-ExpressPCRF Policy and Charging Rules FunctionPG Packet GatewayPGW PDN GatewayPISC Packet Inspection and Service Classi�cationPP Payload ProcessingQoS Quality of Service
I

List of Tables
QPI QuickPath InterconnectRAN Radio Access NetworkRP Route ProcessingSGW Service GatewaySoC System-on-ChipSSC Smart Service CardSSR Smart Service RouterUE User EquipmentUMTS Universal Mobile Telecommunications SystemUP User PlaneUPI Ultra Path InterconnectvCPUs virtual CPUsVDP Virtual Deployment PackagvEPG virtual EPGVIRTIO Virtual I/OVM Virtual Machine
II