investor & analyst update -...
TRANSCRIPT
1Q12 results and comments
INVESTOR & ANALYST UPDATE
11th May 2012
1
DISCLAIMER
The views expressed here contain information derived from publicly available sources that have not been independently verified. No
representation or warranty is made as to the accuracy, completeness or reliability of the information. Any forward looking information in this
presentation has been prepared on the basis of a number of assumptions which may prove to be incorrect. This presentation should not be
relied upon as a recommendation or forecast by Banpu Public Company Limited. Nothing in this release should be construed as either an
offer to sell or a solicitation of an offer to buy or sell shares in any jurisdiction.
2
1. Focus: long term coal market analysis
2. Coal operations
3. Coal marketing
4. Power business
5. Financial summary
Appendices
3
1. Focus: long term coal market analysis
4
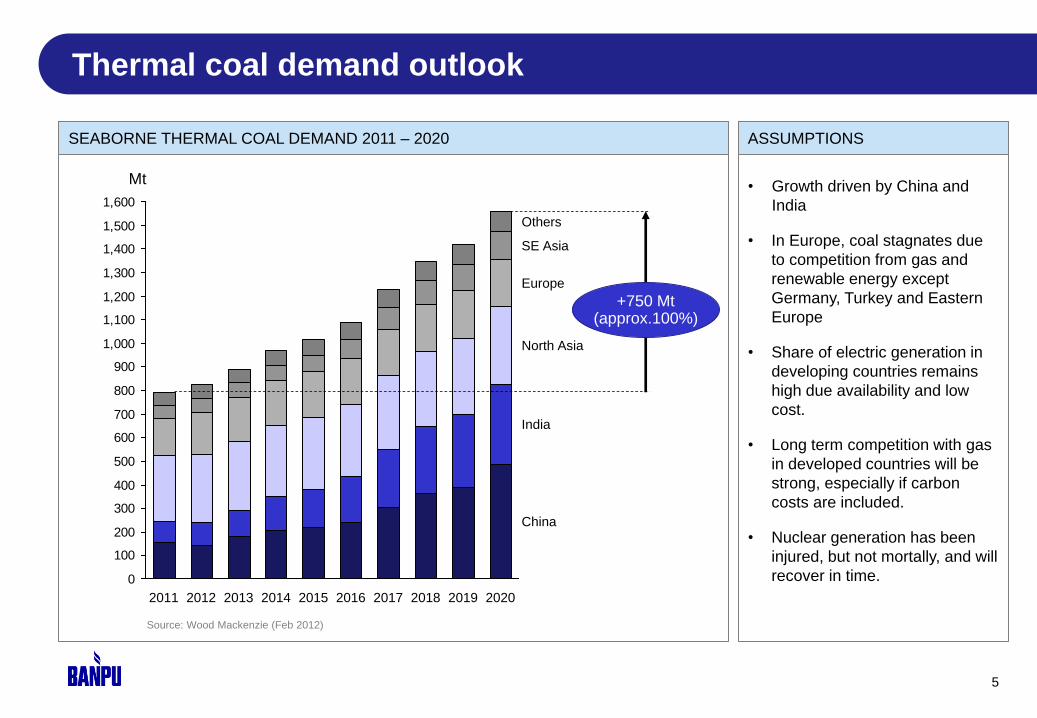
Thermal coal demand outlook
5
0
100
200
300
400
500
600
700
800
900
1,000
1,100
1,200
1,300
1,400
1,500
1,600
+750 Mt (approx.100%)
China
India
North Asia
Europe
SE Asia
Others
2020 2019 2018 2017 2016 2015 2014 2013 2012 2011
Source: Wood Mackenzie (Feb 2012)
Unit: Mt SEABORNE THERMAL COAL DEMAND 2011 – 2020 ASSUMPTIONS
• Growth driven by China and
India
• In Europe, coal stagnates due
to competition from gas and
renewable energy except
Germany, Turkey and Eastern
Europe
• Share of electric generation in
developing countries remains
high due availability and low
cost.
• Long term competition with gas
in developed countries will be
strong, especially if carbon
costs are included.
• Nuclear generation has been
injured, but not mortally, and will
recover in time.
Mt

6
Future dynamics (focus on Asia) IS
SU
ES
GOVT.
POLICY
DEMAND
ELASTICITY
NUCLEAR GAS FREIGHT ECONOMY
• Growth from
developing
countries
• EU debt
concern
• Exchange rate
• Credit issues
• China – coal price cap
• India - nuclear policy,
coal tax, environmental
policy
• Indonesian – Domestic
Market Obligation (DMO),
coal reference price, low
rank coal export ban?,
export tax?, foreign
ownership limit
• Australia – Mineral
Resource Rent Tax
(MRRT), Carbon tax
• South Africa – Mining law
and tax policy
• Development time lags
• Demand-side
management and
new technologies
• Japan – Target to
reduce energy
consumption by
7% by 2030
• China – Target to
reduce energy
intensity by 16%
and carbon
intensity by17%
by 2015 vs 2010
• Medium term
• Japan – closed,
approx.90 mtce*
or 26%, how
much will come
back?
• Taiwan –
capped?
• China and India –
diversification
and supply
security?
• Aftereffect from
Fukushima
incident
• Time lags if
recover
• US – low gas
price, availability
of domestic coal
• China –
development of
shale gas,
pipeline from
Russia and
Myanmar
• Gas price in Asia
link to oil price -
uncompetitive to
coal. Will this
delink for LNG?
• Time lags
• Low freight rates
now
• Will rise and
limit Columbia,
USA and some
South Africa
exports to Asia
• Short to medium
term
+ + +
- -
-
+ +
- - -
IMP
AC
T
+
Note: * mtce means million ton coal equivalent
7
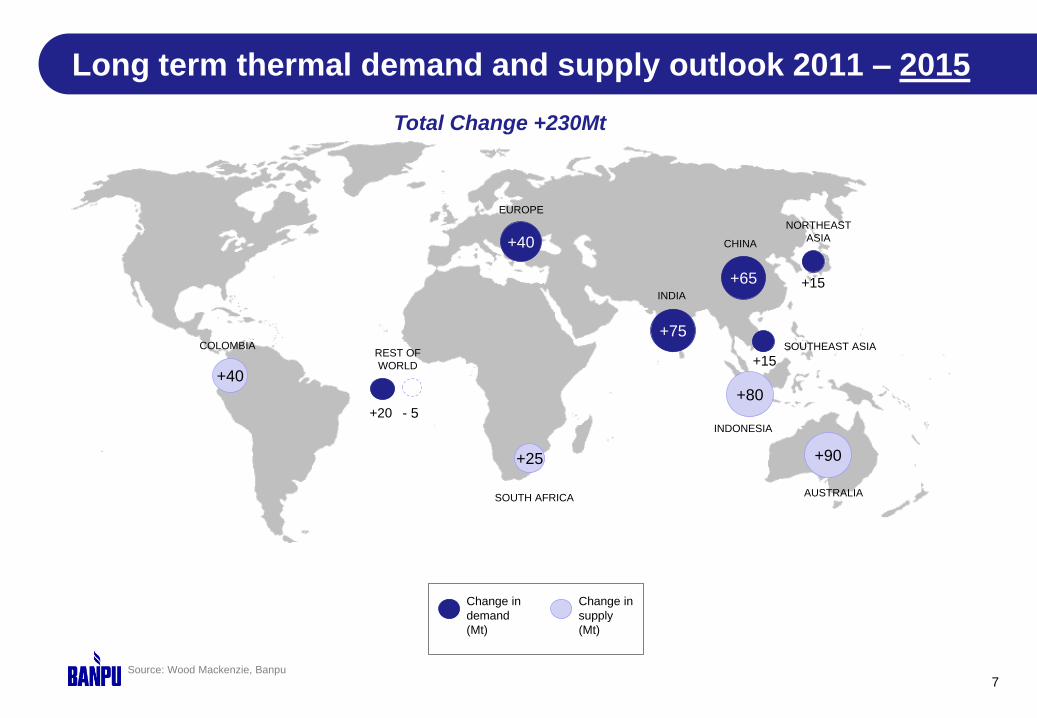
Long term thermal demand and supply outlook 2011 – 2015
Source: Wood Mackenzie, Banpu
Change in
supply
(Mt)
Change in
demand
(Mt)
+112 +75
+65 +15
+40
+20
+15 REST OF
WORLD
NORTHEAST
ASIA
SOUTHEAST ASIA
CHINA
INDIA
EUROPE
+90 +25
+40
+80 - 5
COLOMBIA
SOUTH AFRICA
INDONESIA
AUSTRALIA
Total Change +230Mt
+30
+320
+245
+45 NORTHEAST
ASIA
SOUTHEAST
ASIA +65
+45
8
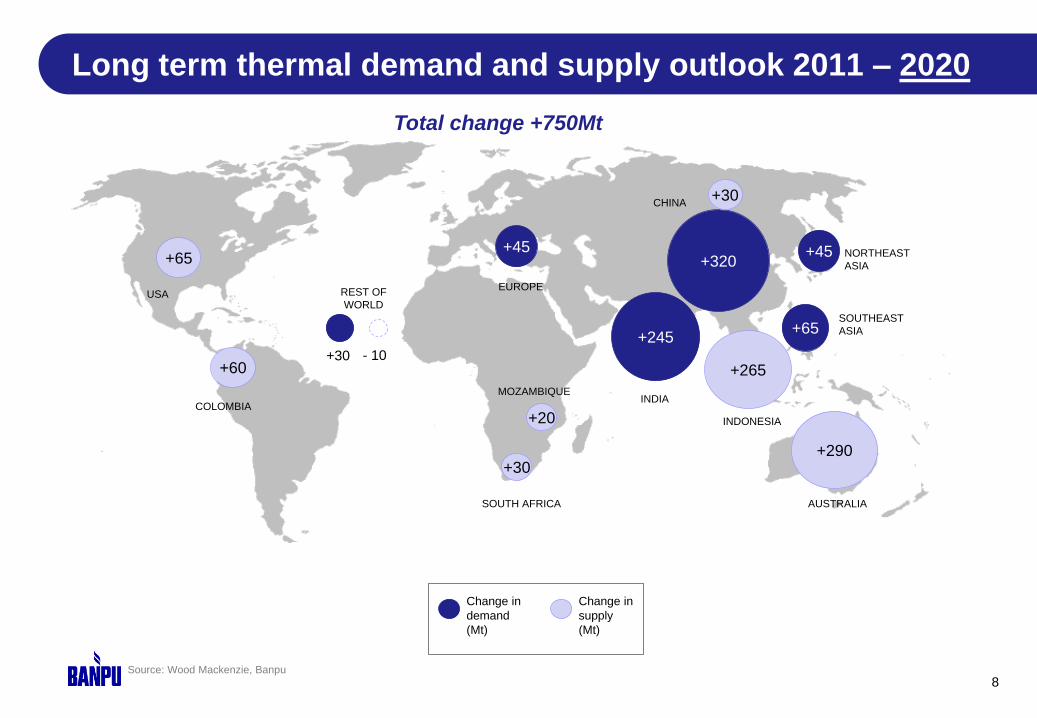
Long term thermal demand and supply outlook 2011 – 2020
Change in
supply
(Mt)
Change in
demand
(Mt)
REST OF
WORLD
INDIA
CHINA
EUROPE
+290
+265
+65
+20
+30
+30
+60 - 10
AUSTRALIA
INDONESIA
SOUTH AFRICA
MOZAMBIQUE
COLOMBIA
USA
Source: Wood Mackenzie, Banpu
Total change +750Mt
9
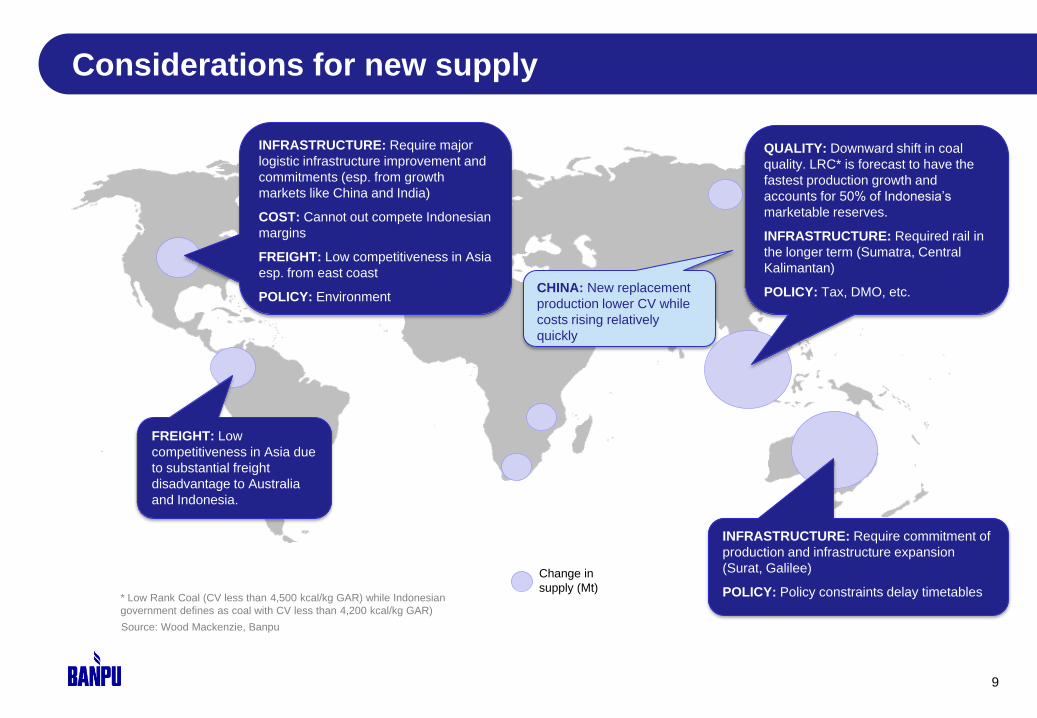
Considerations for new supply
Source: Wood Mackenzie, Banpu
Change in
supply (Mt)
QUALITY: Downward shift in coal
quality. LRC* is forecast to have the
fastest production growth and
accounts for 50% of Indonesia’s
marketable reserves.
INFRASTRUCTURE: Required rail in
the longer term (Sumatra, Central
Kalimantan)
POLICY: Tax, DMO, etc.
INFRASTRUCTURE: Require commitment of
production and infrastructure expansion
(Surat, Galilee)
POLICY: Policy constraints delay timetables
FREIGHT: Low
competitiveness in Asia due
to substantial freight
disadvantage to Australia
and Indonesia.
INFRASTRUCTURE: Require major
logistic infrastructure improvement and
commitments (esp. from growth
markets like China and India)
COST: Cannot out compete Indonesian
margins
FREIGHT: Low competitiveness in Asia
esp. from east coast
POLICY: Environment
* Low Rank Coal (CV less than 4,500 kcal/kg GAR) while Indonesian
government defines as coal with CV less than 4,200 kcal/kg GAR)
CHINA: New replacement
production lower CV while
costs rising relatively
quickly

10
More capacity is required to support growing demand
AUSTRALIA (40% of supply growth 2011 – 2020) INDONESIA (35% of supply growth 2011 – 2020)
0
50
100
150
200
250
Surat
Sydney
Galilee
Gunnedah
Others
Identified supply Required supply growth
Source: Wood Mackenzie, Banpu
Potential
0
50
100
150
200
250
Barito
E. Kali
Mahakam
Sumatra
Others
Identified supply Required supply growth
Source: Wood Mackenzie, Banpu
• Require additional supply for medium and long term need
• Rely on Sydney basin in the short term and Surat in the
longer term
• Surat and Galilee require new infrastructure
• Environmental sensitivities and challenges
• Off-Spec coal (high ash) becomes attractive
• Limited large scale project in pipeline
• More than half of identified supply is LRC
• Environmental and policy constraints
• Off-Spec coal (low CV or high sulphur) becomes attractive
Potential
Mt Mt
11
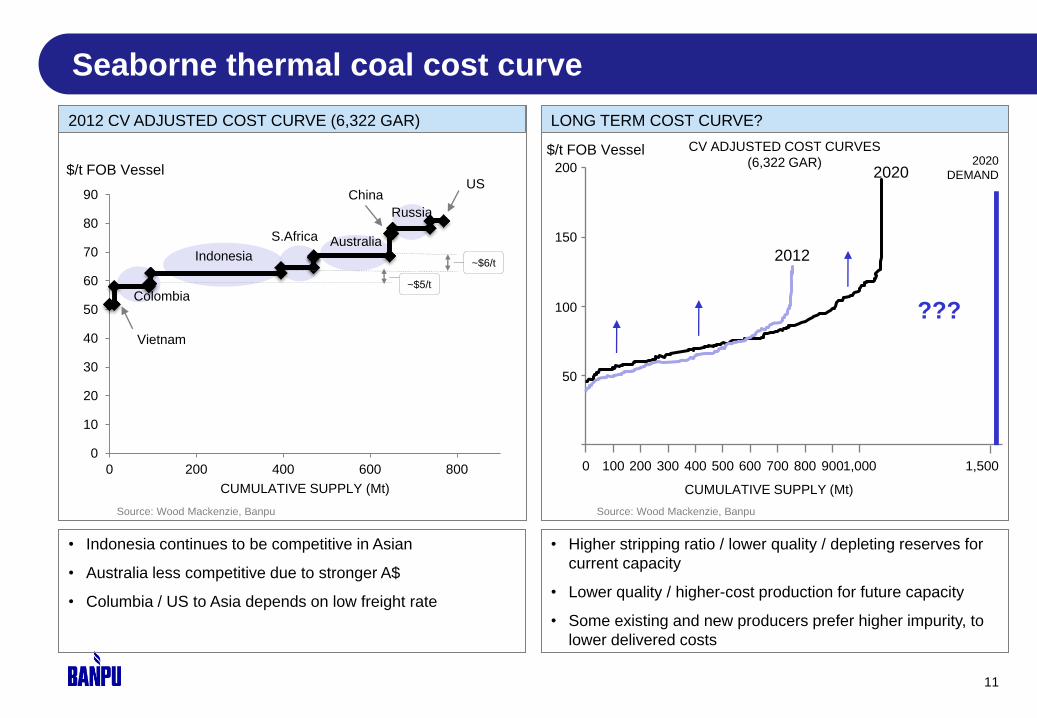
Seaborne thermal coal cost curve
2012 CV ADJUSTED COST CURVE (6,322 GAR) LONG TERM COST CURVE?
0
10
20
30
40
50
60
70
80
90
0 200 400 600 800
CUMULATIVE SUPPLY (Mt)
Vietnam
Indonesia
Colombia
S.Africa Australia
Russia
China US
Source: Wood Mackenzie, Banpu
• Higher stripping ratio / lower quality / depleting reserves for
current capacity
• Lower quality / higher-cost production for future capacity
• Some existing and new producers prefer higher impurity, to
lower delivered costs
• Indonesia continues to be competitive in Asian
• Australia less competitive due to stronger A$
• Columbia / US to Asia depends on low freight rate
CUMULATIVE SUPPLY (Mt)
0 100 200 300 400 500 600 700 800 900 1,000 1,500
50
100
150
200
2012
2020 2020
DEMAND
CV ADJUSTED COST CURVES
(6,322 GAR)
Source: Wood Mackenzie, Banpu
???
$/t FOB Vessel
$/t FOB Vessel
~$6/t
~$5/t
12
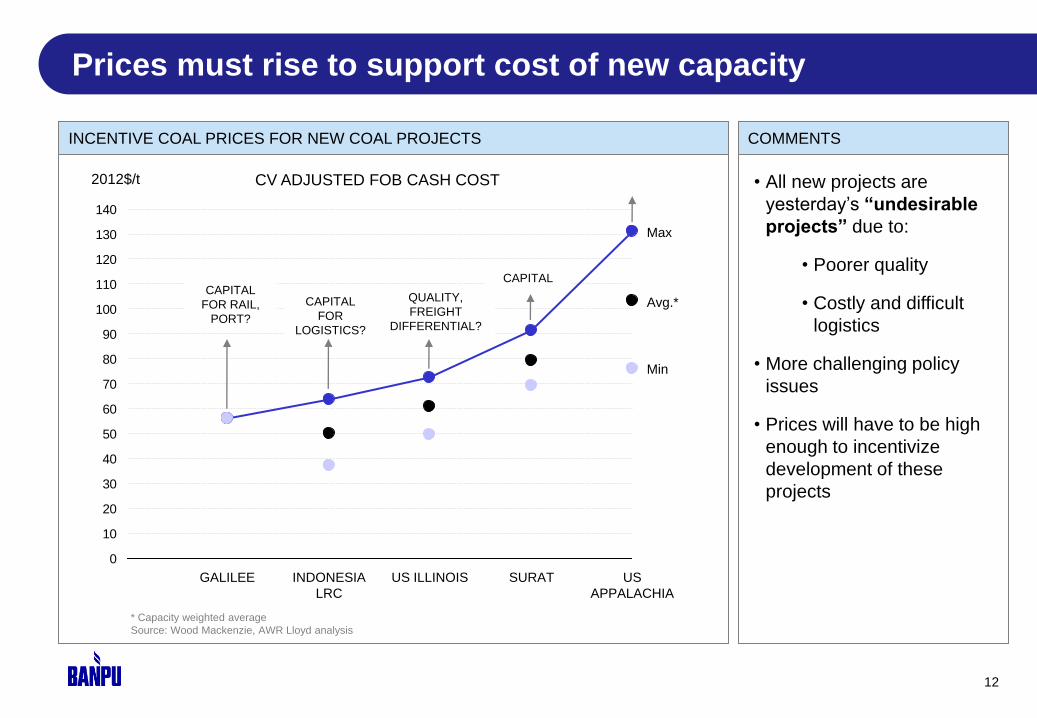
Prices must rise to support cost of new capacity
• All new projects are
yesterday’s “undesirable
projects” due to:
• Poorer quality
• Costly and difficult
logistics
• More challenging policy
issues
• Prices will have to be high
enough to incentivize
development of these
projects
ILLUSTRATIVE INCENTIVE PRICES FOR NEW COAL PROJECTS ($/t) INCENTIVE COAL PRICES FOR NEW COAL PROJECTS COMMENTS
* Capacity weighted average
Source: Wood Mackenzie, AWR Lloyd analysis
0
10
20
30
40
50
60
70
80
90
100
110
120
130
140
Min
Avg.*
Max
US
APPALACHIA
SURAT US ILLINOIS INDONESIA
LRC
GALILEE
CV ADJUSTED FOB CASH COST
CAPITAL
FOR RAIL,
PORT?
CAPITAL
FOR
LOGISTICS?
QUALITY,
FREIGHT
DIFFERENTIAL?
CAPITAL
2012$/t
13
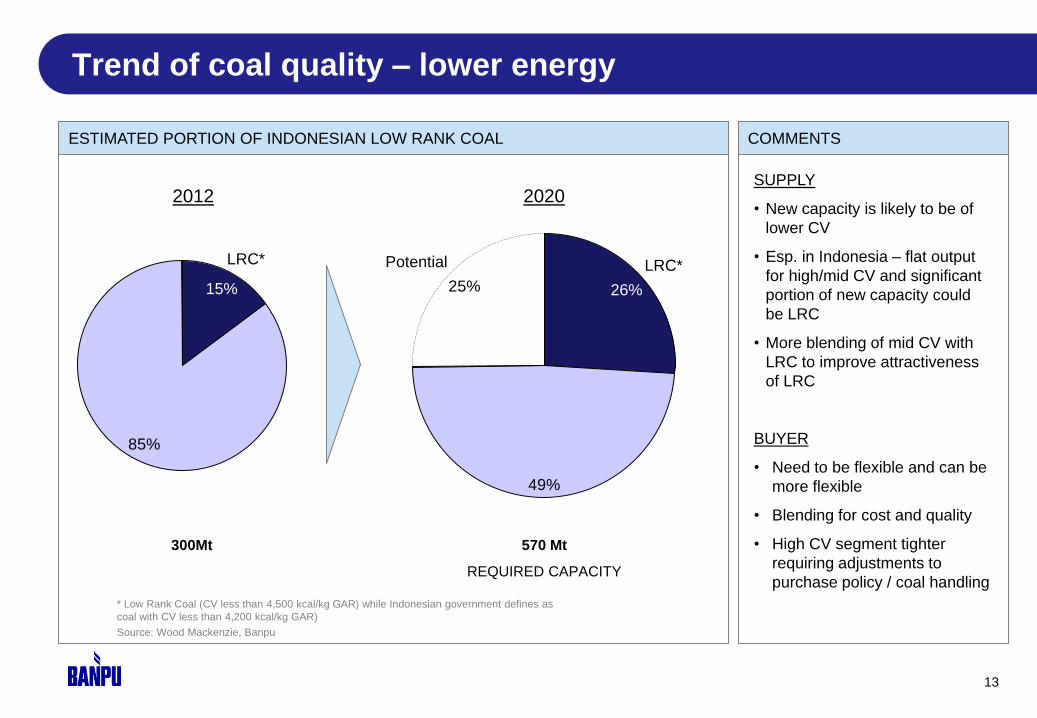
Trend of coal quality – lower energy
ESTIMATED PORTION OF INDONESIAN LOW RANK COAL COMMENTS
85%
LRC*
15% 25%
49%
Potential LRC*
26%
300Mt 570 Mt
REQUIRED CAPACITY
2012 2020
Source: Wood Mackenzie, Banpu
SUPPLY
• New capacity is likely to be of
lower CV
• Esp. in Indonesia – flat output
for high/mid CV and significant
portion of new capacity could
be LRC
• More blending of mid CV with
LRC to improve attractiveness
of LRC
BUYER
• Need to be flexible and can be
more flexible
• Blending for cost and quality
• High CV segment tighter
requiring adjustments to
purchase policy / coal handling
* Low Rank Coal (CV less than 4,500 kcal/kg GAR) while Indonesian government defines as
coal with CV less than 4,200 kcal/kg GAR)
14
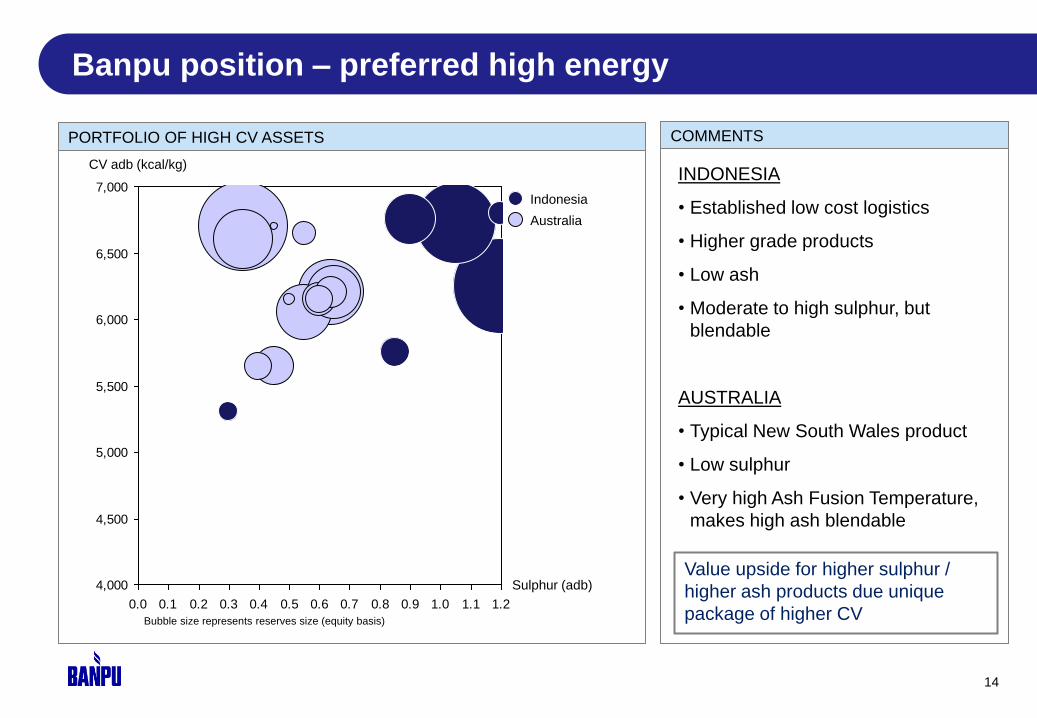
Banpu position – preferred high energy
PORTFOLIO OF HIGH CV ASSETS
4,000
4,500
5,000
5,500
6,000
6,500
7,000
0.0 0.1 0.2 0.3 0.4 0.5 0.6 0.7 0.8 0.9 1.0 1.1 1.2
Sulphur (adb)
CV adb (kcal/kg)
Australia
Indonesia
Bubble size represents reserves size (equity basis)
COMMENTS
INDONESIA
• Established low cost logistics
• Higher grade products
• Low ash
• Moderate to high sulphur, but
blendable
AUSTRALIA
• Typical New South Wales product
• Low sulphur
• Very high Ash Fusion Temperature,
makes high ash blendable
Value upside for higher sulphur /
higher ash products due unique
package of higher CV
15
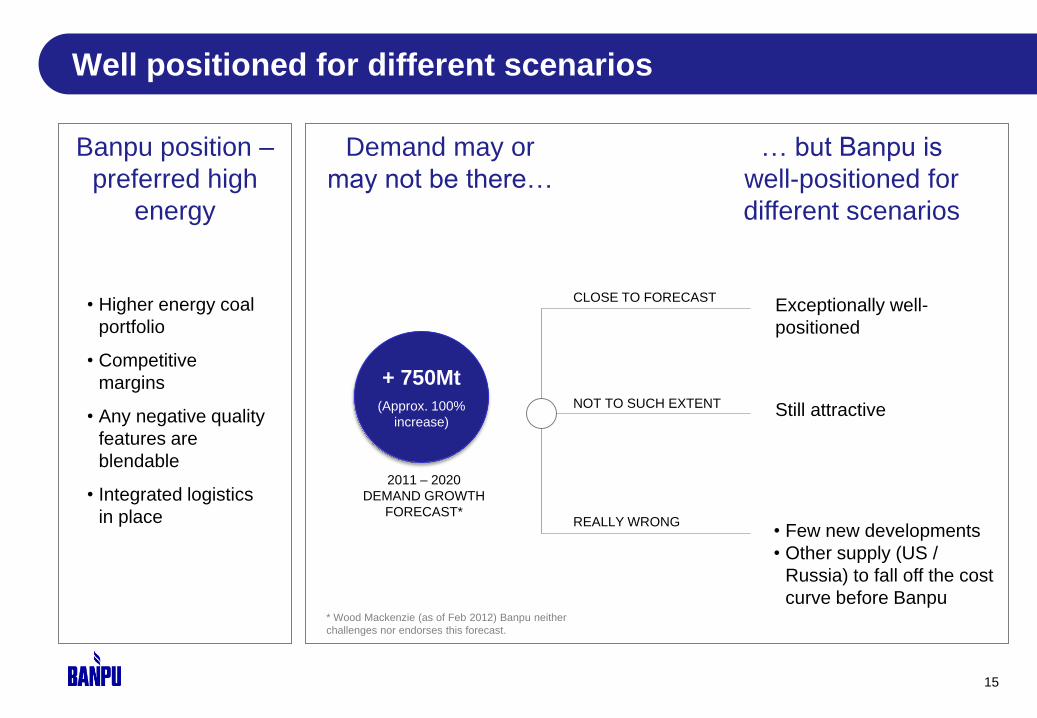
Well positioned for different scenarios
• Higher energy coal
portfolio
• Competitive
margins
• Any negative quality
features are
blendable
• Integrated logistics
in place
Demand may or
may not be there…
… but Banpu is
well-positioned for
different scenarios
CLOSE TO FORECAST
NOT TO SUCH EXTENT
REALLY WRONG
Exceptionally well-
positioned
Still attractive
• Few new developments
• Other supply (US /
Russia) to fall off the cost
curve before Banpu
Banpu position –
preferred high
energy
* Wood Mackenzie (as of Feb 2012) Banpu neither
challenges nor endorses this forecast.
+ 750Mt
(Approx. 100%
increase)
2011 – 2020
DEMAND GROWTH
FORECAST*
2. Coal operations
16
2. Coal divisions
(a) Australia Coal
(b) Indonesia Coal
(c) China Coal
(d) Mongolia Coal
2. Coal operations
17
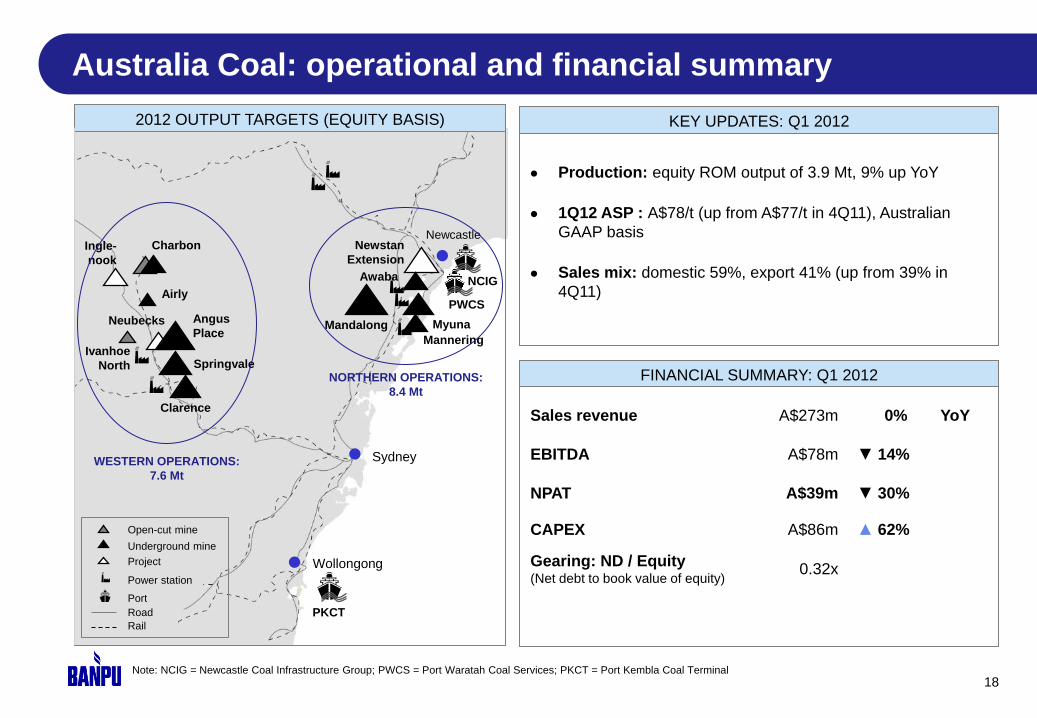
Australia Coal: operational and financial summary
18
Ivanhoe
North
Wollongong
PKCT
Charbon
Airly
Neubecks Angus
Place
Clarence
Springvale
Mandalong
Mannering
Myuna
Newstan
Extension
Awaba
Sydney
PWCS
Newcastle Ingle-
nook
Open-cut mine
Project
Underground mine
Port
Power station
Road
Rail
WESTERN OPERATIONS:
7.6 Mt
NORTHERN OPERATIONS:
8.4 Mt
2012 OUTPUT TARGETS (EQUITY BASIS)
NCIG
KEY UPDATES: Q1 2012
● Production: equity ROM output of 3.9 Mt, 9% up YoY
● 1Q12 ASP : A$78/t (up from A$77/t in 4Q11), Australian
GAAP basis
● Sales mix: domestic 59%, export 41% (up from 39% in
4Q11)
FINANCIAL SUMMARY: Q1 2012
Sales revenue A$273m 0% YoY
EBITDA A$78m ▼ 14%
NPAT A$39m ▼ 30%
CAPEX A$86m ▲ 62%
Gearing: ND / Equity (Net debt to book value of equity)
0.32x
Note: NCIG = Newcastle Coal Infrastructure Group; PWCS = Port Waratah Coal Services; PKCT = Port Kembla Coal Terminal
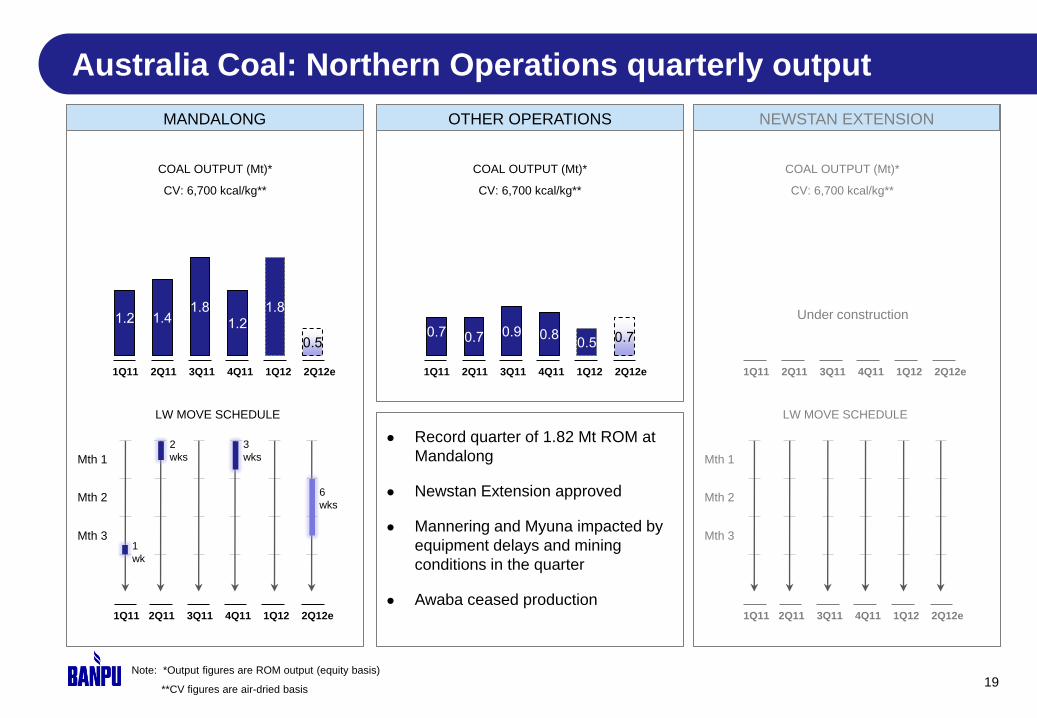
Australia Coal: Northern Operations quarterly output
19
OTHER OPERATIONS
● Record quarter of 1.82 Mt ROM at
Mandalong
● Newstan Extension approved
● Mannering and Myuna impacted by
equipment delays and mining
conditions in the quarter
● Awaba ceased production
MANDALONG
1.2 1.4 1.8
1.2
1.8
0.5
LW MOVE SCHEDULE
1
wk
2
wks
3
wks
6
wks
0.7 0.7 0.9 0.8 0.5 0.7
1Q11 2Q11 3Q11 4Q11 1Q12 2Q12e
NEWSTAN EXTENSION
LW MOVE SCHEDULE
Mth 1
Mth 2
Mth 3
1Q11 2Q11 3Q11 4Q11 1Q12 2Q12e
1Q11 2Q11 3Q11 4Q11 1Q12 2Q12e
Under construction
Note: *Output figures are ROM output (equity basis)
**CV figures are air-dried basis
COAL OUTPUT (Mt)*
CV: 6,700 kcal/kg**
COAL OUTPUT (Mt)*
CV: 6,700 kcal/kg**
COAL OUTPUT (Mt)*
CV: 6,700 kcal/kg**
Mth 1
Mth 2
Mth 3
1Q11 2Q11 3Q11 4Q11 1Q12 2Q12e
1Q11 2Q11 3Q11 4Q11 1Q12 2Q12e
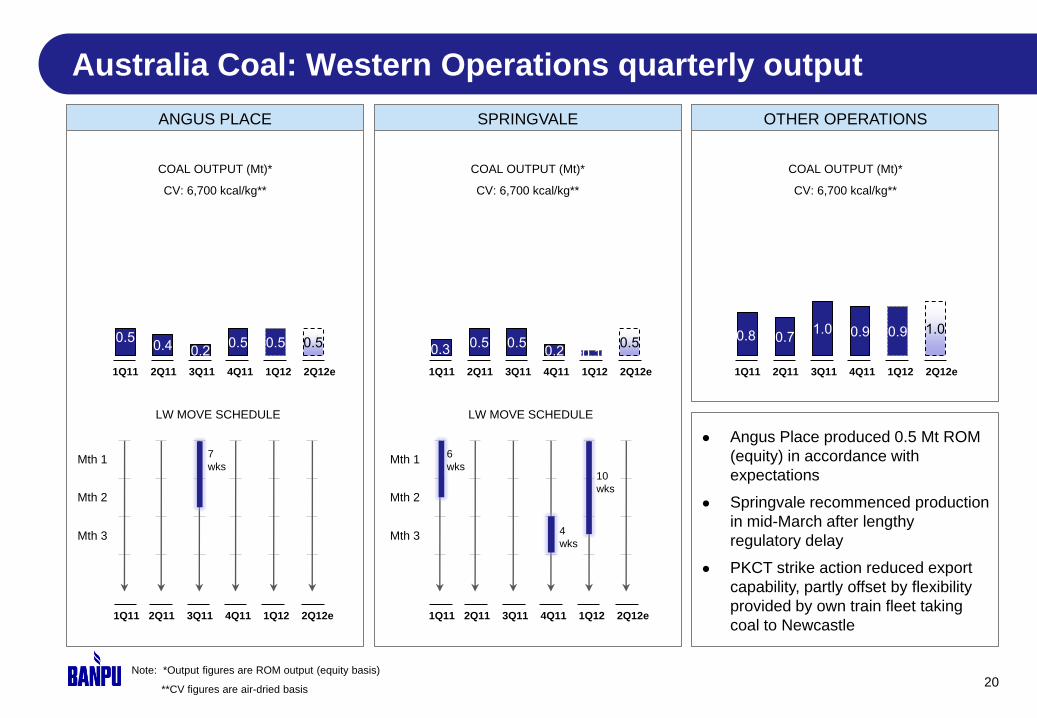
Australia Coal: Western Operations quarterly output
20
OTHER OPERATIONS
Note: *Output figures are ROM output (equity basis)
**CV figures are air-dried basis
● Angus Place produced 0.5 Mt ROM
(equity) in accordance with
expectations
● Springvale recommenced production
in mid-March after lengthy
regulatory delay
● PKCT strike action reduced export
capability, partly offset by flexibility
provided by own train fleet taking
coal to Newcastle
ANGUS PLACE SPRINGVALE
LW MOVE SCHEDULE
Mth 1
Mth 2
Mth 3
1Q11 2Q11 3Q11 4Q11 1Q12 2Q12e
6
wks 10
wks
0.3 0.5 0.5
0.2 0.1 0.5
1Q11 2Q11 3Q11 4Q11 1Q12 2Q12e
COAL OUTPUT (Mt)*
CV: 6,700 kcal/kg**
LW MOVE SCHEDULE
Mth 1
Mth 2
Mth 3
1Q11 2Q11 3Q11 4Q11 1Q12 2Q12e
0.5 0.4 0.2
0.5 0.5 0.5
1Q11 2Q11 3Q11 4Q11 1Q12 2Q12e
7
wks
4
wks
0.8 0.7 1.0 0.9 0.9 1.0
1Q11 2Q11 3Q11 4Q11 1Q12 2Q12e
COAL OUTPUT (Mt)*
CV: 6,700 kcal/kg**
COAL OUTPUT (Mt)*
CV: 6,700 kcal/kg**
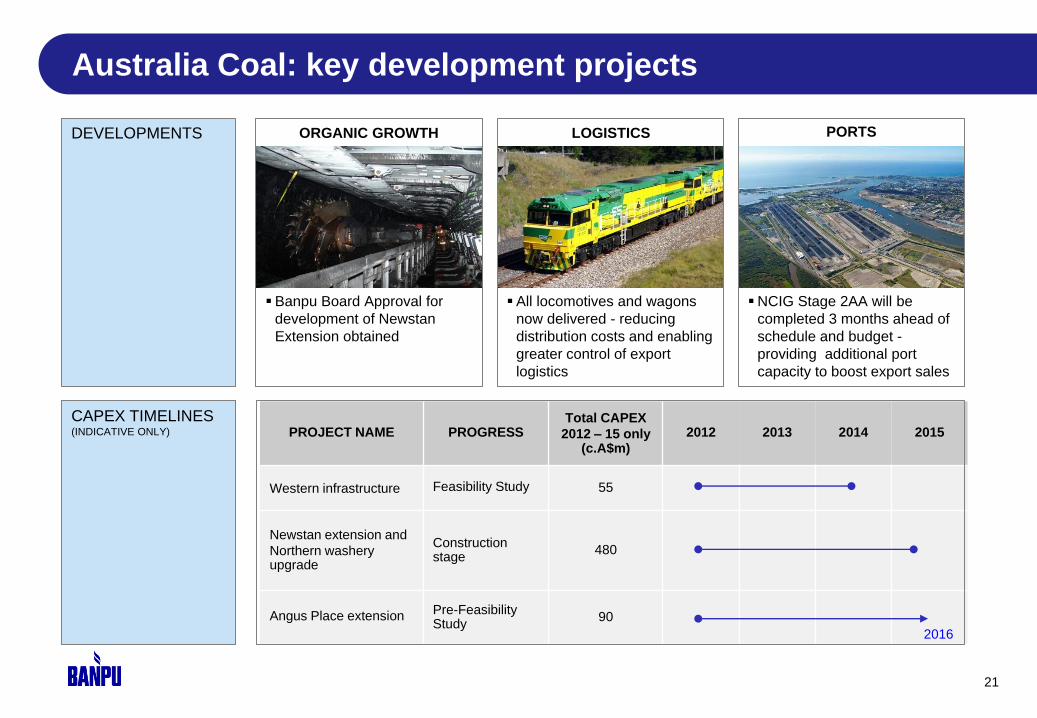
Australia Coal: key development projects
21
DEVELOPMENTS
CAPEX TIMELINES (INDICATIVE ONLY)
Banpu Board Approval for
development of Newstan
Extension obtained
All locomotives and wagons
now delivered - reducing
distribution costs and enabling
greater control of export
logistics
NCIG Stage 2AA will be
completed 3 months ahead of
schedule and budget -
providing additional port
capacity to boost export sales
ORGANIC GROWTH LOGISTICS PORTS
PROJECT NAME PROGRESS Total CAPEX
2012 – 15 only (c.A$m)
2012 2013 2014 2015
Western infrastructure Feasibility Study 55
Newstan extension and
Northern washery upgrade
Construction stage 480
Angus Place extension Pre-Feasibility Study 90
2016
2. Coal divisions
(a) Australia Coal
(b) Indonesia Coal
(c) China Coal
(d) Mongolia Coal
2. Coal operations
22
Indonesia Coal: operational and financial summary
23
East Kalimantan
Bunyut Port
Balikpapan
Palangkaraya
Banjarmasin
Central Kalimantan
South Kalimantan
KITADIN-
EMBALUT
0.7 Mt
INDOMINCO
15.0 Mt
TRUBAINDO
7.0 Mt
BHARINTO 0.7 Mt
JORONG
1.0 Mt
Samarinda
Jorong Port
Operation
Project
Operation
Project
POWER
COAL
Bontang Coal Terminal
Captive coal-
fired power project
KITADIN TANDUNG MAYANG
2.7 Mt
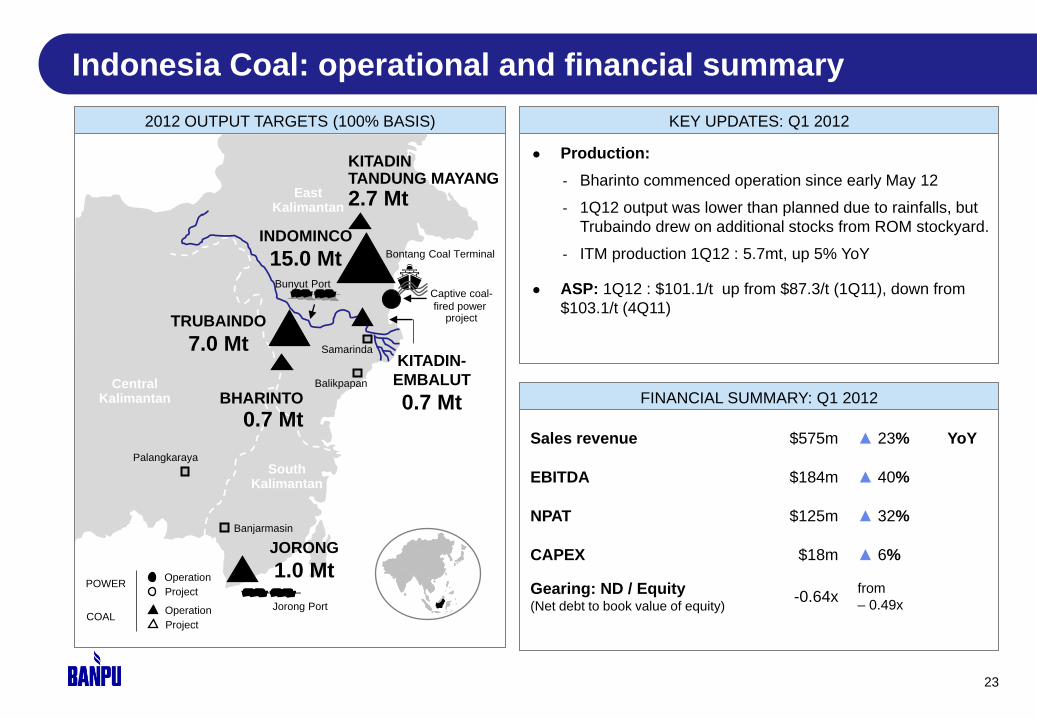
2012 OUTPUT TARGETS (100% BASIS) KEY UPDATES: Q1 2012
● Production:
- Bharinto commenced operation since early May 12
- 1Q12 output was lower than planned due to rainfalls, but
Trubaindo drew on additional stocks from ROM stockyard.
- ITM production 1Q12 : 5.7mt, up 5% YoY
● ASP: 1Q12 : $101.1/t up from $87.3/t (1Q11), down from
$103.1/t (4Q11)
FINANCIAL SUMMARY: Q1 2012
Sales revenue $575m ▲ 23% YoY
EBITDA $184m ▲ 40%
NPAT $125m ▲ 32%
CAPEX $18m ▲ 6%
Gearing: ND / Equity (Net debt to book value of equity)
-0.64x from
– 0.49x
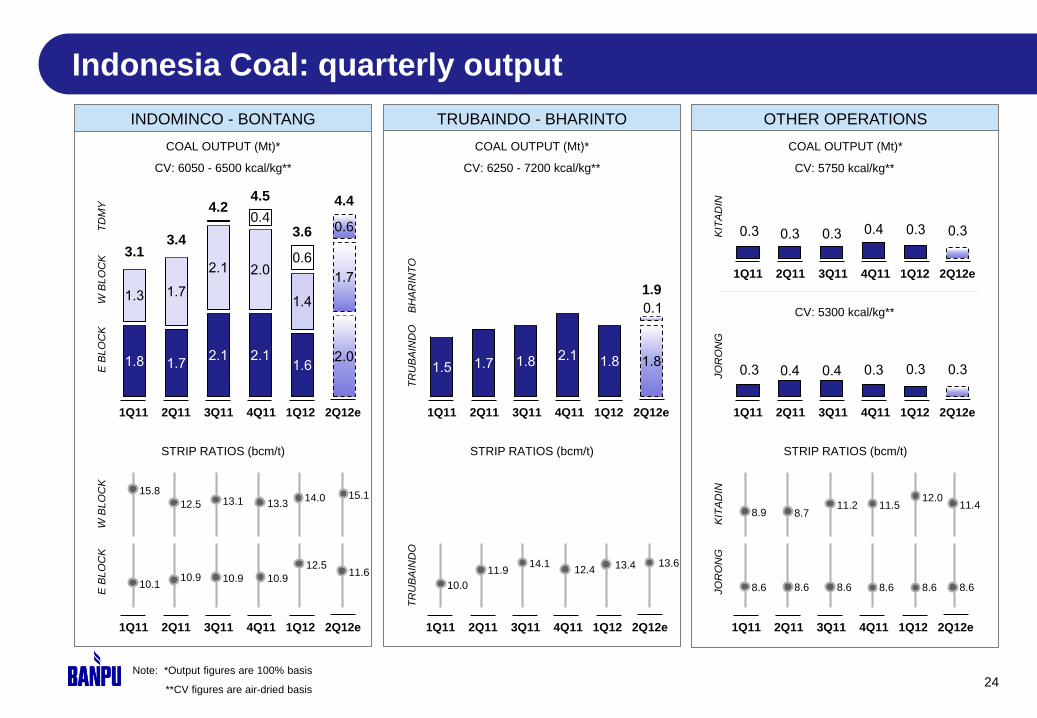
Indonesia Coal: quarterly output
24
TRUBAINDO - BHARINTO OTHER OPERATIONS INDOMINCO - BONTANG
COAL OUTPUT (Mt)*
CV: 6050 - 6500 kcal/kg**
COAL OUTPUT (Mt)*
CV: 6250 - 7200 kcal/kg**
COAL OUTPUT (Mt)*
CV: 5750 kcal/kg**
CV: 5300 kcal/kg**
1Q11 2Q11 3Q11 4Q11 1Q12 2Q12e
E B
LO
CK
T
DM
Y
W B
LO
CK
TR
UB
AIN
DO
B
HA
RIN
TO
JO
RO
NG
K
ITA
DIN
STRIP RATIOS (bcm/t) STRIP RATIOS (bcm/t) STRIP RATIOS (bcm/t)
10.9
13.1
10.9
13.3
10.1
15.8
10.9
12.5
E B
LO
CK
W
BLO
CK
TR
UB
AIN
DO
8.6
11.5
8.6
8.9
8.6
8.7
8.6
11.2
JO
RO
NG
K
ITA
DIN
Note: *Output figures are 100% basis
**CV figures are air-dried basis
1.8 1.7 2.1 2.1
1.6 2.0
1.3 1.7
2.1 2.0
1.4
1.7
0.4
0.6
0.6
3.1 3.4
4.2 4.5
3.6
4.4
1Q11 2Q11 3Q11 4Q11 1Q12 2Q12e
1Q11 2Q11 3Q11 4Q11 1Q12 2Q12e
1Q11 2Q11 3Q11 4Q11 1Q12 2Q12e
10.0
11.9 14.1
12.4
1Q11 2Q11 3Q11 4Q11 1Q12 2Q12e
0.3 0.4 0.4 0.3 0.3 0.3
1Q11 2Q11 3Q11 4Q11 1Q12 2Q12e
0.3 0.3 0.3 0.4 0.3 0.3
1Q11 2Q11 3Q11 4Q11 1Q12 2Q12e
13.4 13.6
8.6
12.0
8.6
11.4
12.5
14.0
1.5 1.7 1.8 2.1 1.8 1.8
0.1
1.9
15.1
11.6
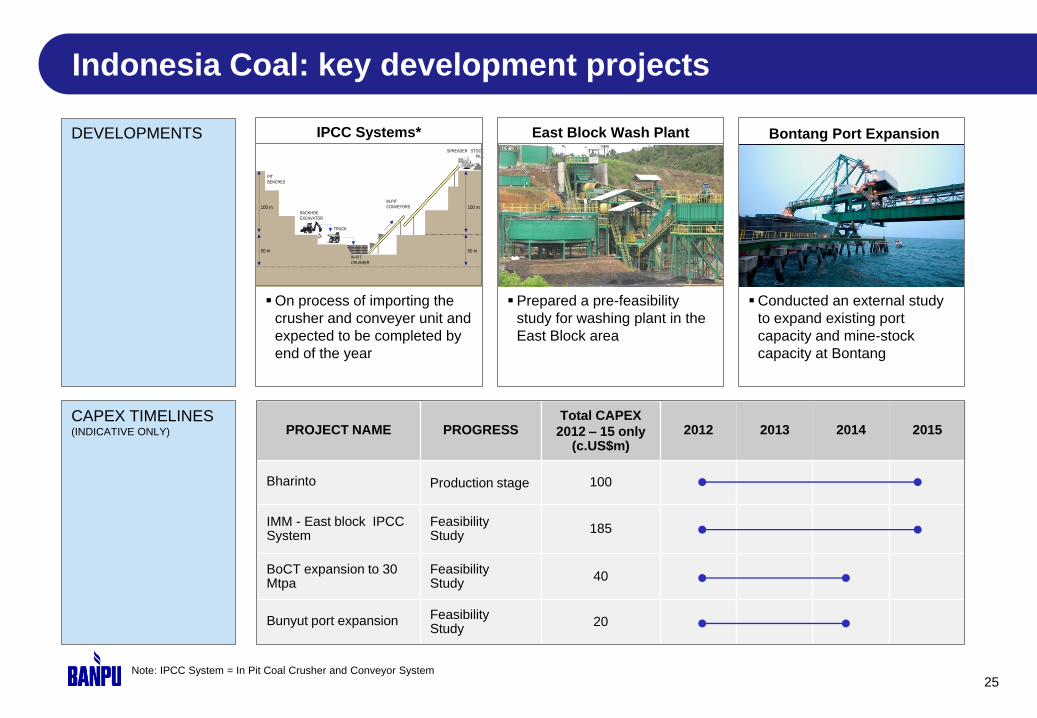
Indonesia Coal: key development projects
25
On process of importing the
crusher and conveyer unit and
expected to be completed by
end of the year
Conducted an external study
to expand existing port
capacity and mine-stock
capacity at Bontang
Prepared a pre-feasibility
study for washing plant in the
East Block area
IPCC Systems* Bontang Port Expansion East Block Wash Plant
Note: IPCC System = In Pit Coal Crusher and Conveyor System
100 m
50 m
PIT
BENCHES
BACKHOE
EXCAVATOR
TRUCK
IN-PIT
CRUSHER
IN-PIT
CONVEYORS
SPREADER STOCK
PILE
100 m
50 m
IPCC ILLUSTRATIONDEVELOPMENTS
CAPEX TIMELINES (INDICATIVE ONLY) PROJECT NAME PROGRESS
Total CAPEX
2012 – 15 only (c.US$m)
2012 2013 2014 2015
Bharinto Production stage 100
IMM - East block IPCC System
Feasibility Study 185
BoCT expansion to 30 Mtpa
Feasibility Study 40
Bunyut port expansion Feasibility Study 20
2. Coal divisions
(a) Australia Coal
(b) Indonesia Coal
(c) China Coal
(d) Mongolia Coal
2. Coal operations
26

27
CHINA COAL 2012 PRODUCTION TARGETS* OPERATIONAL UPDATES
GAOHE
● Six of eight required inspections passed at Gaohe in 1Q.
● Remaining inspections: Verification of Water and Soil
Conservation and Safety Facility Acceptance.
● Final acceptance inspection expected within Q2, then apply
for Production and Safety Licenses.
● Gaohe has finished the preliminary design of railway spur
about 8 km and worked on land acquisition.
● Gaohe began to build another 6 raw coal silos (Phase 2),
capacity of 10,000 tonnes each.
HEBI
● Hebi conducting 10 exploration drill holes in a new mining
area, to check geology and coal quality.
Gaohe
CV: 6500-8000 Kcal/kg**
Hebi
CV: 5300-6800 Kcal/kg**
Pre-production stage
2012 COAL OUTPUT (Mt ROM)
BEIJING
Hebi
(40%),
Henan
1.2 Mt
Gaohe
(45%),
Shanxi
3.8 Mt
Operation Project Operation Project
POWER
COAL
1Q11 2Q11 3Q11 4Q11 1Q12 2Q12
0.6
1.0 0.9
0.5
1Q11 2Q11 3Q11 4Q11 1Q12 2Q12
0.3 0.2
0.3 0.5
China Coal: operational and financial summary
Note: *Output figures are ROM output (equity basis)
**CV figures are air-dried basis
0.4 0.4 0.4 0.5

2. Coal divisions
(a) Australia Coal
(b) Indonesia Coal
(c) China Coal
(d) Mongolia Coal
2. Coal operations
28
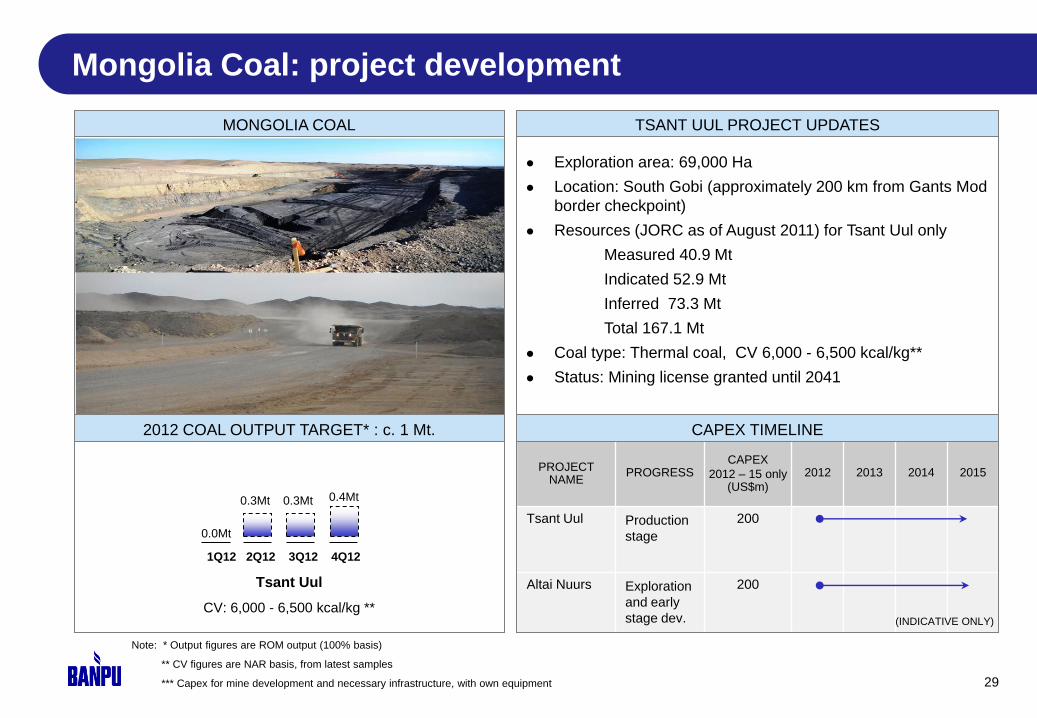
PROJECT NAME
PROGRESS CAPEX
2012 – 15 only (US$m)
2012 2013 2014 2015
Tsant Uul Production
stage
200
Altai Nuurs Exploration
and early
stage dev.
200
Mongolia Coal: project development
29
TSANT UUL PROJECT UPDATES
CAPEX TIMELINE
● Exploration area: 69,000 Ha
● Location: South Gobi (approximately 200 km from Gants Mod
border checkpoint)
● Resources (JORC as of August 2011) for Tsant Uul only
Measured 40.9 Mt
Indicated 52.9 Mt
Inferred 73.3 Mt
Total 167.1 Mt
● Coal type: Thermal coal, CV 6,000 - 6,500 kcal/kg**
● Status: Mining license granted until 2041
Tsant Uul
CV: 6,000 - 6,500 kcal/kg **
1Q12 2Q12 3Q12 4Q12
0.0Mt
0.3Mt 0.3Mt 0.4Mt
Note: * Output figures are ROM output (100% basis)
** CV figures are NAR basis, from latest samples
*** Capex for mine development and necessary infrastructure, with own equipment
2012 COAL OUTPUT TARGET* : c. 1 Mt.
MONGOLIA COAL
(INDICATIVE ONLY)
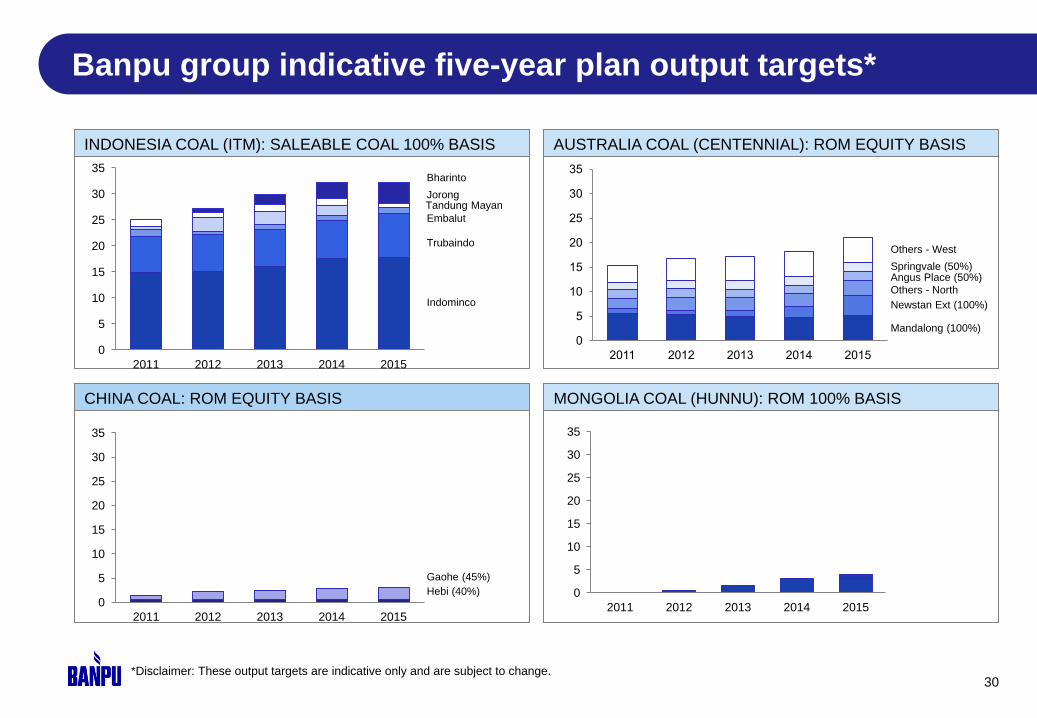
Banpu group indicative five-year plan output targets*
*Disclaimer: These output targets are indicative only and are subject to change.
INDONESIA COAL (ITM): SALEABLE COAL 100% BASIS AUSTRALIA COAL (CENTENNIAL): ROM EQUITY BASIS
0
5
10
15
20
25
30
35
2011 2012 2013 2014 2015
0
5
10
15
20
25
30
35
2011 2012 2013 2014 2015
30
0
5
10
15
20
25
30
35
2011 2012 2013 2014 2015
CHINA COAL: ROM EQUITY BASIS MONGOLIA COAL (HUNNU): ROM 100% BASIS
0
5
10
15
20
25
30
35
2011 2012 2013 2014 2015
Bharinto
Jorong
Embalut
Trubaindo
Indominco
Others - West
Springvale (50%) Angus Place (50%)
Others - North
Newstan Ext (100%)
Mandalong (100%)
Gaohe (45%)
Hebi (40%)
Tandung Mayan
2. Coal divisions
(a) Coal market
(b) Banpu coal sales
3. Coal marketing
31
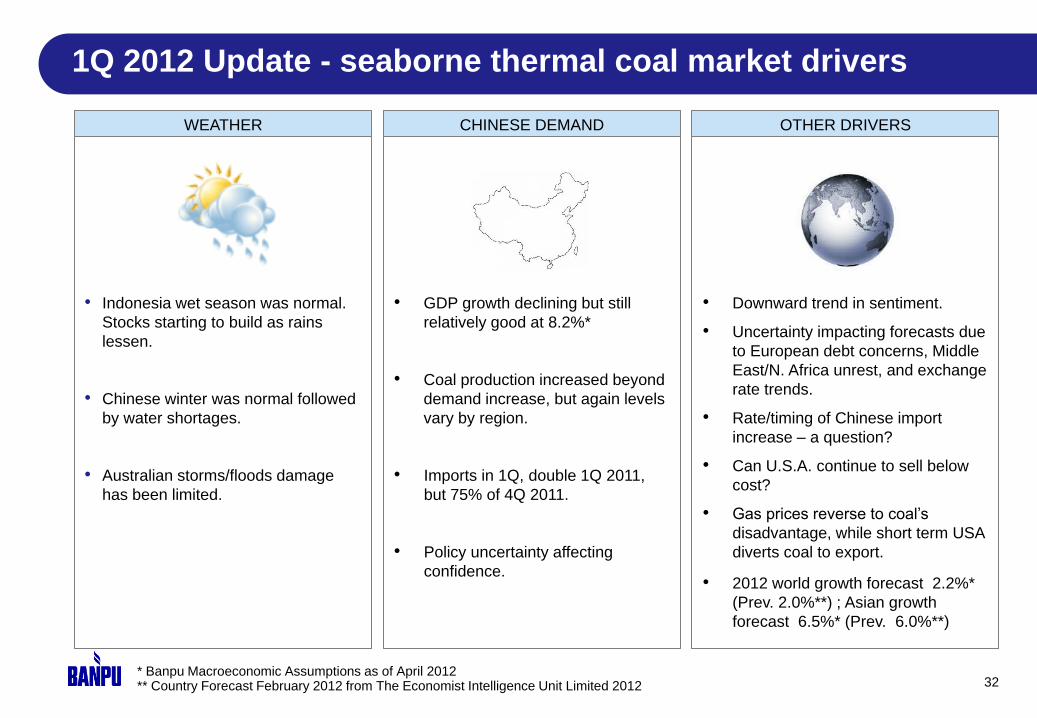
• Downward trend in sentiment.
• Uncertainty impacting forecasts due
to European debt concerns, Middle
East/N. Africa unrest, and exchange
rate trends.
• Rate/timing of Chinese import
increase – a question?
• Can U.S.A. continue to sell below
cost?
• Gas prices reverse to coal’s
disadvantage, while short term USA
diverts coal to export.
• 2012 world growth forecast 2.2%*
(Prev. 2.0%**) ; Asian growth
forecast 6.5%* (Prev. 6.0%**)
* Banpu Macroeconomic Assumptions as of April 2012 ** Country Forecast February 2012 from The Economist Intelligence Unit Limited 2012 32
• Indonesia wet season was normal.
Stocks starting to build as rains
lessen.
• Chinese winter was normal followed
by water shortages.
• Australian storms/floods damage
has been limited.
• GDP growth declining but still
relatively good at 8.2%*
• Coal production increased beyond
demand increase, but again levels
vary by region.
• Imports in 1Q, double 1Q 2011,
but 75% of 4Q 2011.
• Policy uncertainty affecting
confidence.
WEATHER CHINESE DEMAND OTHER DRIVERS
1Q 2012 Update - seaborne thermal coal market drivers
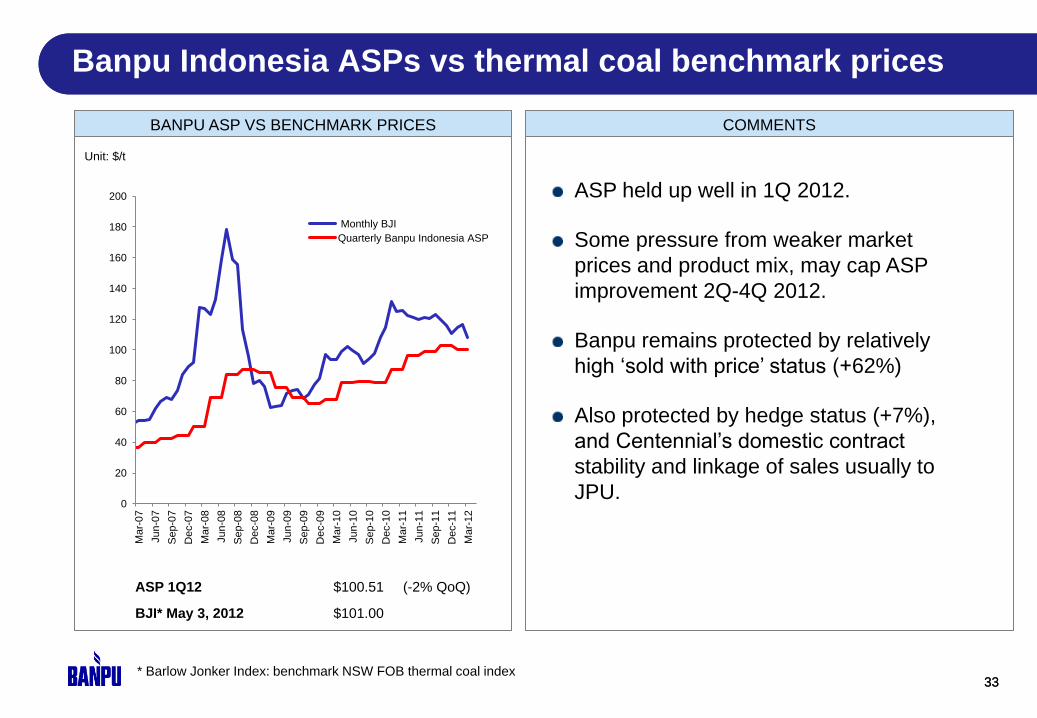
ASP 1Q12 $100.51 (-2% QoQ))
BJI* May 3, 2012 $101.00
33
Banpu average selling prices in 3Q10
ASP held up well in 1Q 2012.
Some pressure from weaker market
prices and product mix, may cap ASP
improvement 2Q-4Q 2012.
Banpu remains protected by relatively
high ‘sold with price’ status (+62%)
Also protected by hedge status (+7%),
and Centennial’s domestic contract
stability and linkage of sales usually to
JPU.
33
BANPU ASP VS BENCHMARK PRICES COMMENTS
0
20
40
60
80
100
120
140
160
180
200
Ma
r-0
7
Jun
-07
Sep
-07
Dec-0
7
Ma
r-0
8
Jun
-08
Sep
-08
Dec-0
8
Ma
r-0
9
Jun
-09
Sep
-09
Dec-0
9
Ma
r-1
0
Jun
-10
Sep
-10
Dec-1
0
Ma
r-1
1
Jun
-11
Sep
-11
Dec-1
1
Ma
r-1
2
Monthly BJI
Quarterly Banpu Indonesia ASP
Unit: $/t
Banpu Indonesia ASPs vs thermal coal benchmark prices
* Barlow Jonker Index: benchmark NSW FOB thermal coal index
400
500
600
700
800
900
1,000
785
65
73
128
143
116
1Q11 2Q11 3Q11 4Q11 1Q12 Act.
Import Export
58
93 103
18 14
7 5
2009 2010 2011 2012
Import Export
34
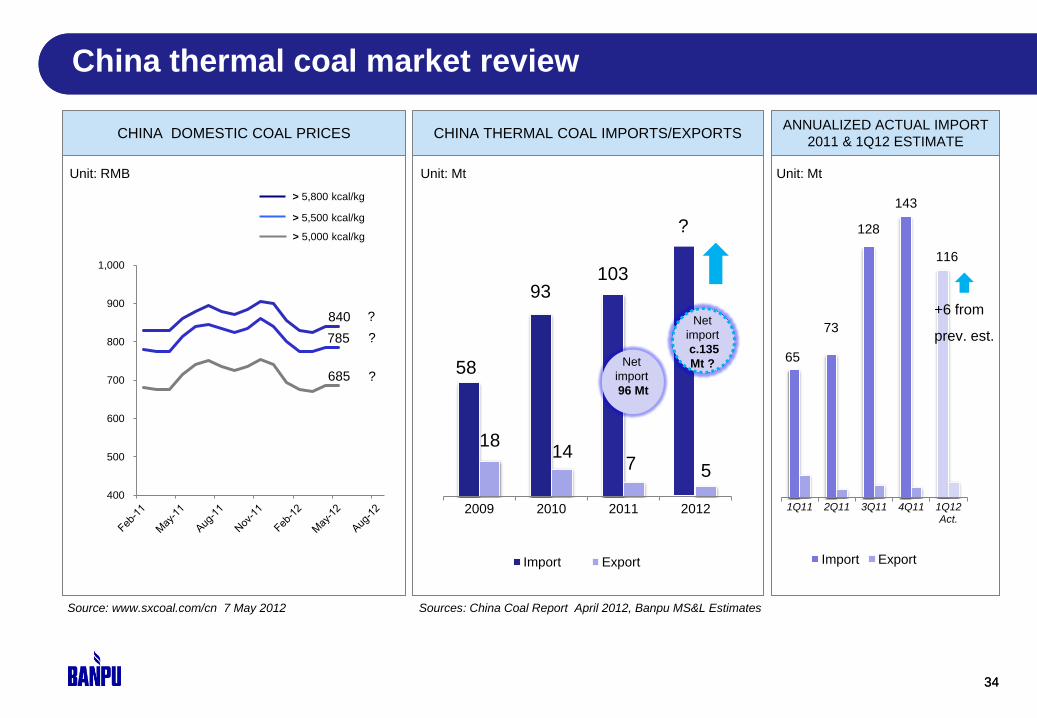
China thermal coal market review
Source: www.sxcoal.com/cn 7 May 2012
> 5,800 kcal/kg
> 5,500 kcal/kg
> 5,000 kcal/kg
Unit: RMB
Sources: China Coal Report April 2012, Banpu MS&L Estimates
Net
import
96 Mt
34
Net
import
c.135
Mt ?
CHINA DOMESTIC COAL PRICES CHINA THERMAL COAL IMPORTS/EXPORTS ANNUALIZED ACTUAL IMPORT
2011 & 1Q12 ESTIMATE
?
Unit: Mt Unit: Mt
840
685
China thermal coal market review
+6 from
prev. est.
?
?
?

2. Coal divisions
(a) Coal market
(b) Banpu coal sales
3. Coal marketing
35
36
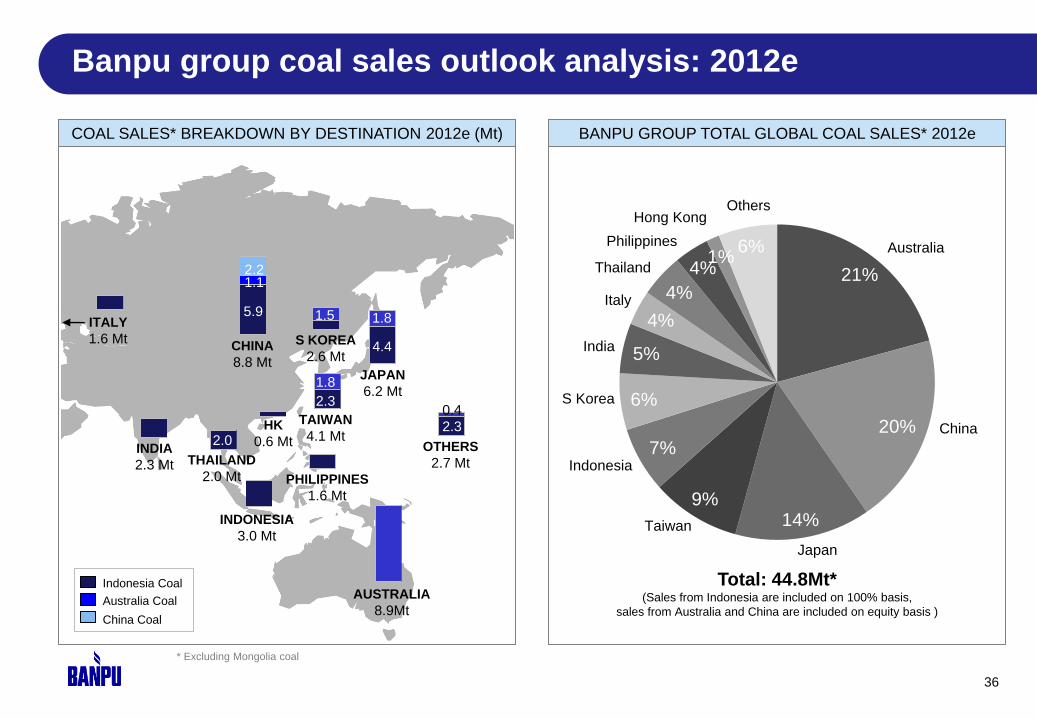
Banpu group coal sales outlook analysis: 2012e
Australia Coal
China Coal
Indonesia Coal
COAL SALES* BREAKDOWN BY DESTINATION 2012e (Mt) BANPU GROUP TOTAL GLOBAL COAL SALES* 2012e
Total: 44.8Mt* (Sales from Indonesia are included on 100% basis,
sales from Australia and China are included on equity basis )
JAPAN
6.2 Mt
PHILIPPINES
1.6 Mt
INDONESIA
3.0 Mt
THAILAND
2.0 Mt
INDIA
2.3 Mt
OTHERS
2.7 Mt
HK
0.6 Mt
S KOREA
2.6 Mt CHINA
8.8 Mt
TAIWAN
4.1 Mt
AUSTRALIA
8.9Mt
ITALY
1.6 Mt
2.2
1.8
4.4
1.8
5.9
2.0
1.5
1.1
2.3
0.4 2.3
21%
20%
14% 9%
7%
6%
5%
4%
4%
4% 1%
6% Australia
Japan
China
Taiwan
S Korea
Italy
Thailand
Philippines
Hong Kong
India
Indonesia
Others
* Excluding Mongolia coal
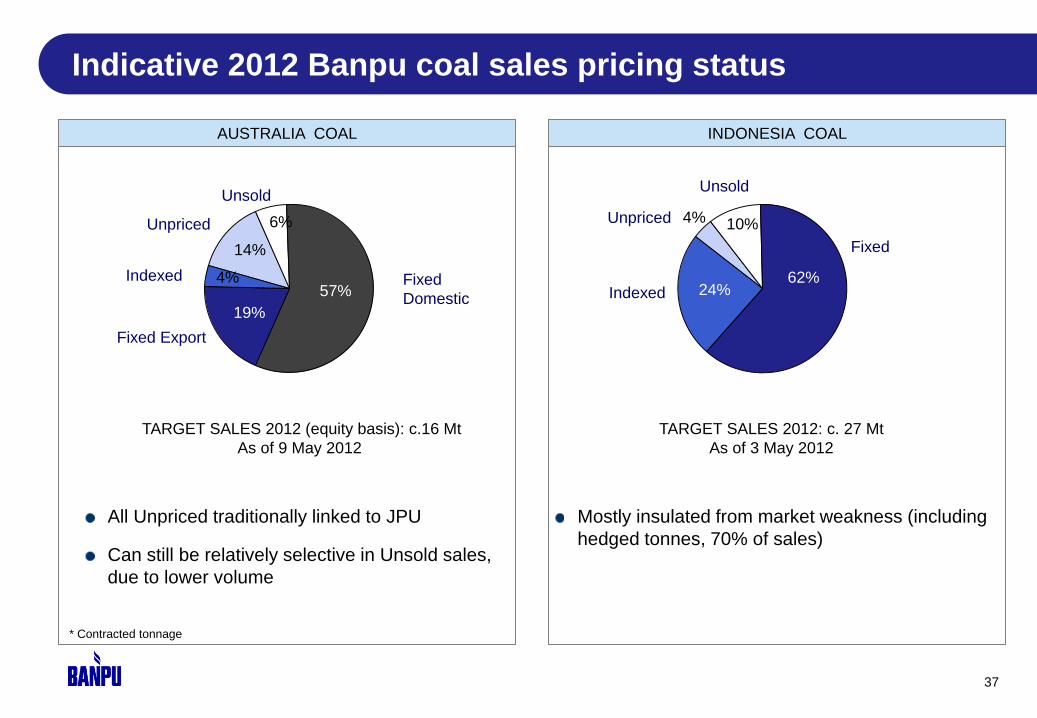
Indicative 2012 Banpu coal sales pricing status
37
TARGET SALES 2012 (equity basis): c.16 Mt
As of 9 May 2012
* Contracted tonnage
All Unpriced traditionally linked to JPU
Can still be relatively selective in Unsold sales,
due to lower volume
TARGET SALES 2012: c. 27 Mt
As of 3 May 2012
Mostly insulated from market weakness (including
hedged tonnes, 70% of sales)
Fixed
Indexed
Unpriced
Unsold
4% 10%
62% 24%
14%
6%
57%
19%
4% Indexed Fixed
Domestic
Unpriced
Unsold
Fixed Export
AUSTRALIA COAL INDONESIA COAL

4. Power business
38
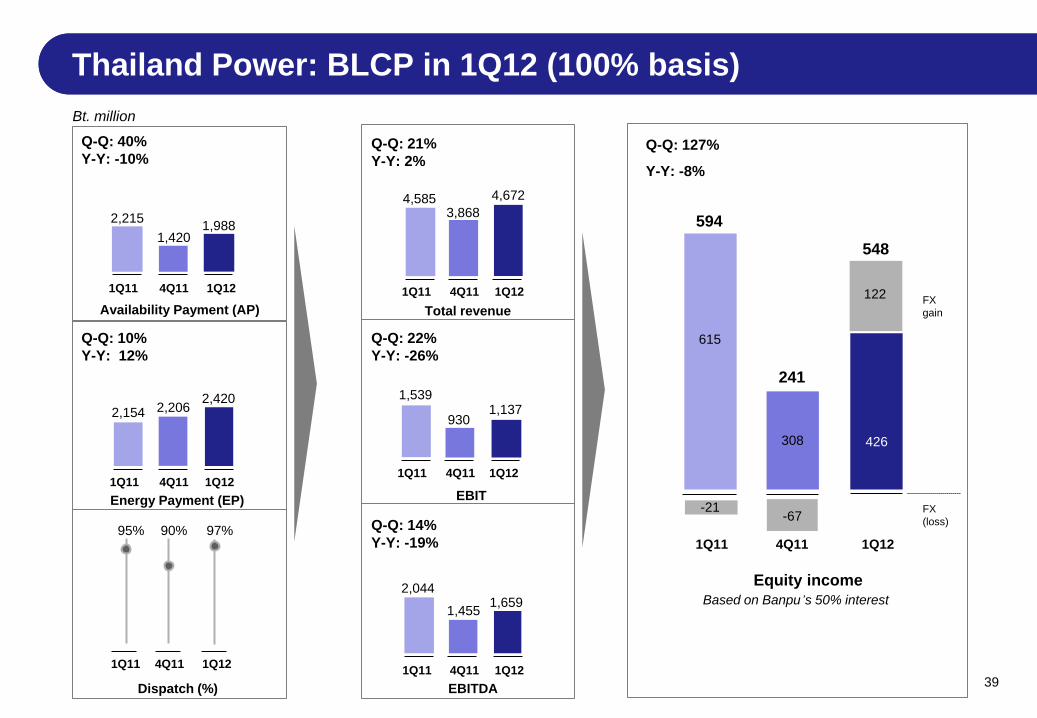
Bt. million
Q-Q: 40%
Y-Y: -10%
Q-Q: 10%
Y-Y: 12%
95% 90% 97%
2,215
1Q11 4Q11 1Q12
1Q11 4Q11 1Q12
Energy Payment (EP)
1Q11 4Q11 1Q12
Dispatch (%)
1,420 1,988
2,154 2,206 2,420
Availability Payment (AP)
Q-Q: 21%
Y-Y: 2%
Q-Q: 22%
Y-Y: -26%
Q-Q: 14%
Y-Y: -19%
1Q11 4Q11 1Q12
Total revenue
1Q11 4Q11 1Q12
EBIT
1Q11 4Q11 1Q12
EBITDA
4,585 3,868
4,672
1,539
930 1,137
2,044
1,455 1,659
39
Based on Banpu’s 50% interest
Q-Q: 127%
Y-Y: -8%
1Q11 4Q11 1Q12
Equity income
594
548
241
426 308
615
-67 FX
(loss)
-21
122 FX
gain
Thailand Power: BLCP in 1Q12 (100% basis)
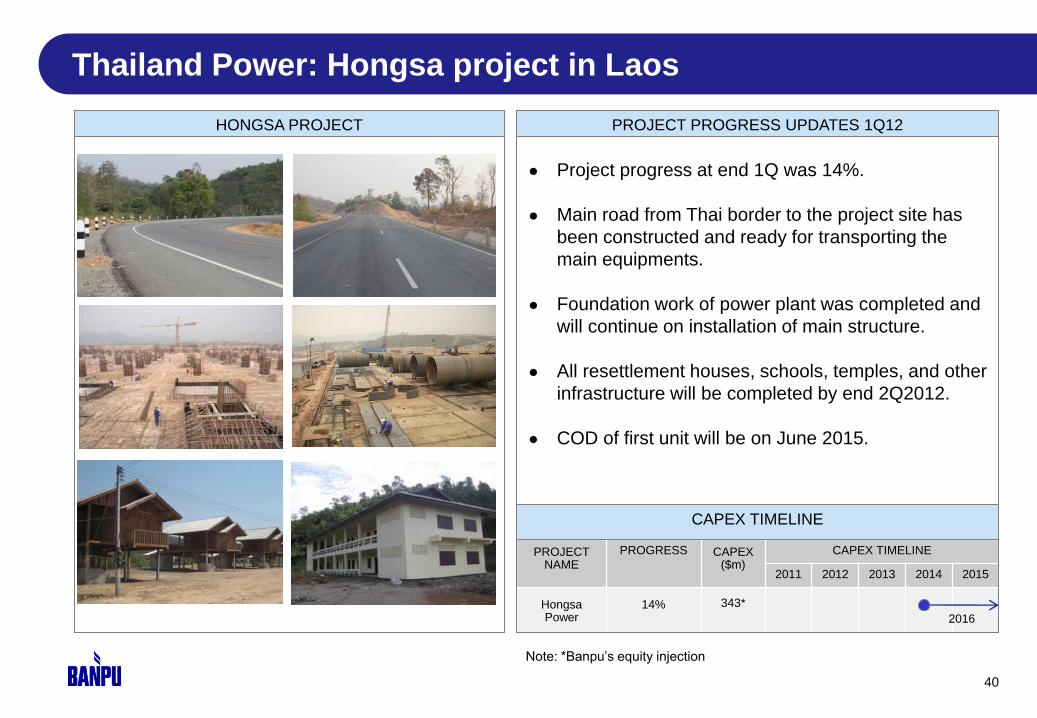
Thailand Power: Hongsa project in Laos
40
HONGSA PROJECT PROJECT PROGRESS UPDATES 1Q12
PROJECT NAME
PROGRESS CAPEX ($m)
CAPEX TIMELINE
2011 2012 2013 2014 2015
Hongsa Power
14% 343*
CAPEX TIMELINE
● Project progress at end 1Q was 14%.
● Main road from Thai border to the project site has
been constructed and ready for transporting the
main equipments.
● Foundation work of power plant was completed and
will continue on installation of main structure.
● All resettlement houses, schools, temples, and other
infrastructure will be completed by end 2Q2012.
● COD of first unit will be on June 2015.
Note: *Banpu’s equity injection
2016
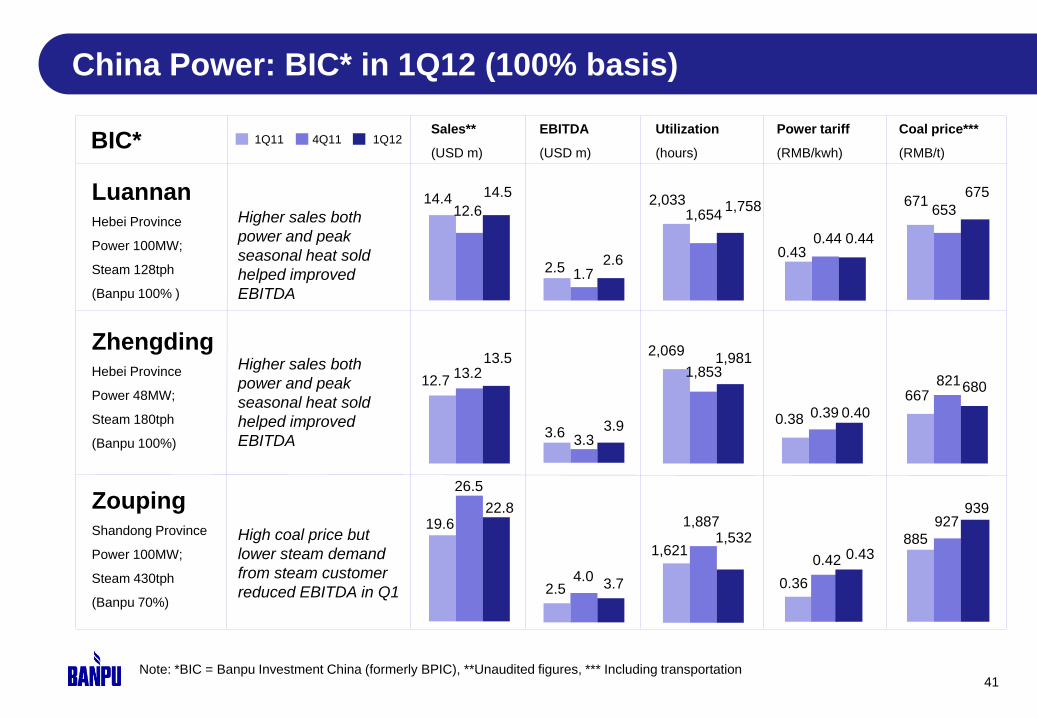
Note: *BIC = Banpu Investment China (formerly BPIC), **Unaudited figures, *** Including transportation
Luannan Hebei Province
Power 100MW;
Steam 128tph
(Banpu 100% )
China Power: BIC* in 1Q12 (100% basis)
41
Higher sales both
power and peak
seasonal heat sold
helped improved
EBITDA
Zhengding Hebei Province
Power 48MW;
Steam 180tph
(Banpu 100%)
Higher sales both
power and peak
seasonal heat sold
helped improved
EBITDA
Zouping Shandong Province
Power 100MW;
Steam 430tph
(Banpu 70%)
High coal price but
lower steam demand
from steam customer
reduced EBITDA in Q1
Sales**
(USD m)
EBITDA
(USD m)
Utilization
(hours)
Power tariff
(RMB/kwh)
Coal price***
(RMB/t)
2,069
1,853 1,981
0.38 0.39 0.40
12.7 13.2
13.5
3.6 3.3
3.9
667 821 680
19.6
26.5
22.8
2.5 4.0
3.7
1,621
1,887 1,532
0.36
885
927
939
0.43 0.44 0.44
671 653
675 2,033
1,654 1,758
14.4 12.6
14.5
2.5 1.7 2.6
0.42 0.43
BIC* 1Q11 4Q11 1Q12

5. Financial summary
42

Key external and corporate events
43
EX
TE
RN
AL
E
VE
NT
S
CO
RP
OR
AT
E E
VE
NT
S
Thai flood
crisis
Greece
referendum
Italy debt crisis?
Mahakam
Bridge
collapse
10 Nov
Banpu 3Q11
results
27 Oct
US$225M
private
placement
Downgrade 9
euro zone
nations
Ban
Iranian oil?
Completion of
Hunnu
acquisition
Announcement
of special Bt 3
dividend to be
paid on 10 Feb
BoT cuts
interest rate
to 3%
Greece passes
austerity plan
28 Dec
18 Jan
• Banpu 2011 results
• 2H11 Bt 9 dividend
to be paid on 30 Apr
• R&R upgrades
24 Feb
Indonesia
foreign
ownership
limit Aust Senate
passes MRRT
Banpu AGM 2012
Approved Annual Dividend 21
Baht/share (incl. special dividend 3
Baht/share)
Approved Bond issue
20,000 Mil Baht
11 May
Banpu 1Q12
results
4Q11
5 Apr
China’s
disappointing
Q1 GDP growth
Indonesia export
tax on minerals
May 12
European
elections sent
shockwave
Apr 12
Request for
contract review
DIR
EC
T
IND
IRE
CT
1Q12

Banpu group revenue analysis: coal operations
44
Indonesia Coal (ITM) Australia Coal (Centennial)
Note: ITM revenue is consolidated in Banpu income
statement.
Note: Centennial’s revenue is consolidated in Banpu
income statement.
SALES (Mt)
AVERAGE SELLING PRICE (US$/t)
REVENUE ($M)
SALES (Mt)
AVERAGE SELLING PRICE (A$/t)**
REVENUE (A$M)
468 502
678 733 578
1Q11 2Q11 3Q11 4Q11 1Q12
279 266 287 261 273
1Q11 2Q11 3Q11 4Q11 1Q12
NE
X*
AS
P
2.1 2.3 2.7 2.1 2.1
3.7 3.7 4.1 3.4 3.5
1Q11 2Q11 3Q11 4Q11 1Q12
Note: ‘$’ in this presentation denotes US dollar only, otherwise stated
*NEX = Newcastle Export Index (formerly Barlow Jonker Index or BJI)
It is relevant but not linked to China Coal’s ASP
**Australian GAAP
China Coal
Note: Hebi and Gaohe revenues are not consolidated in
Banpu income statement.
SALES (Mt)
AVERAGE SELLING PRICE (US$/t) excl. VAT
REVENUE ($M)
72 77 92 81 123
1Q11 2Q11 3Q11 4Q11 1Q12
0.3 0.4 0.4 0.4 0.5
1Q11 2Q11 3Q11 4Q11 1Q12
Domestic
Export
5.3 4.7 6.1 6.5
5.2
5.5 5.2
6.9 7.1 5.8
1Q11 2Q11 3Q11 4Q11 1Q12
125 118
122
110 110
87 97 98 103 101
1Q11 2Q11 3Q11 4Q11 1Q12
AS
P
75 73 70 77 78
1Q11 2Q11 3Q11 4Q11 1Q12
NE
X* 125
118 122
110 110
AS
P
90 91 96 92 107
1Q11 2Q11 3Q11 4Q11 1Q12
NE
X* 125
118 122
110 110
Equity basis Equity basis 100% basis
100% basis Equity basis 100% basis
Domestic
Export
Domestic
Export

45
Banpu consolidated sales revenues
14,606
23,306
18,385
8,145
7,858
8,352 1,427
1,489
1,573
1Q11 4Q11 1Q12
Bt. million
+17% Y –Y
Coal Indonesia
Power
+6% Q – Q
+10% Y - Y
-21% Q – Q
+26% Y - Y
Bt 24,178 M
Bt 32,653 M
Bt 28,310 M
USD
1,046 m USD
913 m
USD
791 m
Power
Coal Australia
Coal Indonesia
Note: USD exchange rate is the average exchange rate of the corresponding period, Revenue from other is included in Coal.
Coal Australia
+6% Q- Q
+3% Y - Y
*
* Under Thai GAAP, this is not included in the revenue.
Australian GAAP (AUD Million)
261 273
4Q11 1Q12
10 * Gain
from
forward
18
251 255
-13% Q – Q
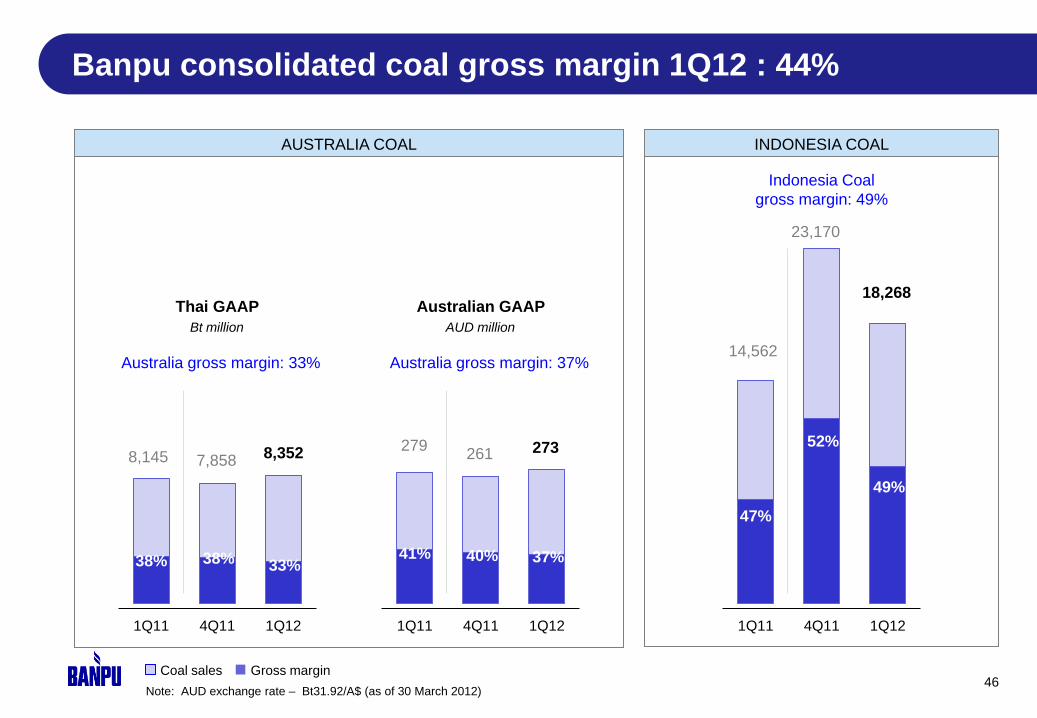
Banpu consolidated coal gross margin 1Q12 : 44%
46
Australia gross margin: 37%
Bt million
Australia gross margin: 33%
Thai GAAP
AUSTRALIA COAL
Australian GAAP
AUD million
1Q11 4Q11 1Q12
33% 38% 38%
8,145
8,352
7,858
1Q11 4Q11 1Q12
37% 40% 41%
279
273
261
Note: AUD exchange rate – Bt31.92/A$ (as of 30 March 2012)
INDONESIA COAL
Indonesia Coal
gross margin: 49%
1Q11 4Q11 1Q12
49%
52%
47%
18,268
23,170
14,562
Coal sales Gross margin
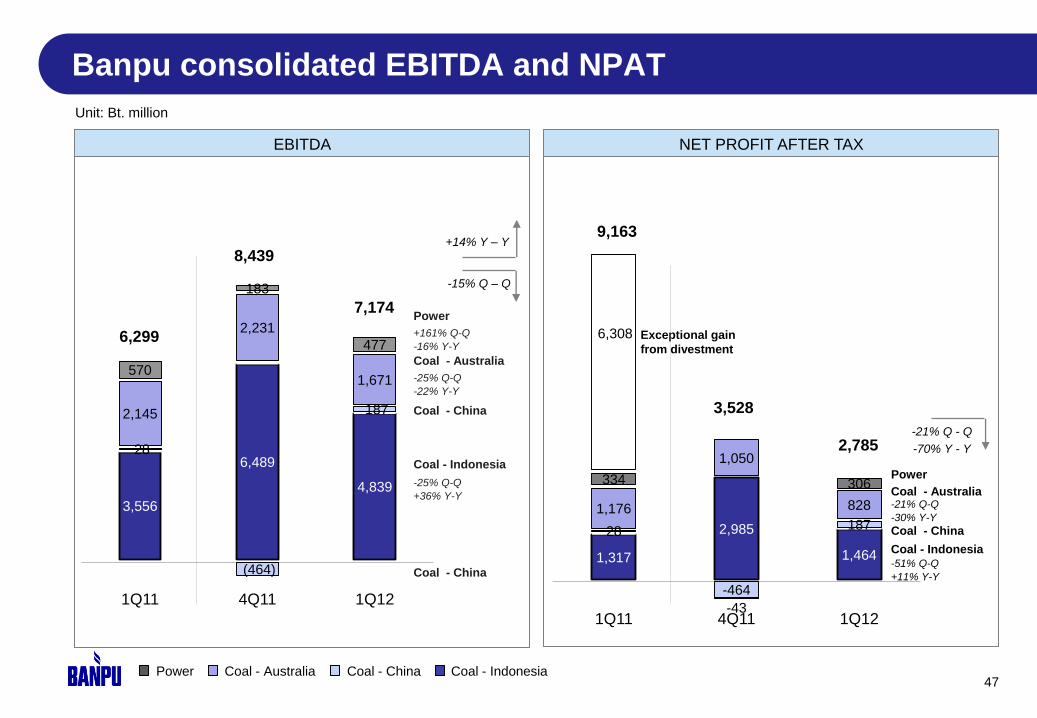
Banpu consolidated EBITDA and NPAT
47
Unit: Bt. million
1,317
2,985
1,464
28
-464
187 1,176
1,050
828
334
-43
306
6,308
1Q11 4Q11 1Q12
3,528
9,163
2,785
Coal - Indonesia
Exceptional gain
from divestment
-51% Q-Q
+11% Y-Y
Coal - Australia -21% Q-Q
-30% Y-Y 3,556
6,489
4,839
28
(464)
187 2,145
2,231
1,671 570
183
477
1Q11 4Q11 1Q12
6,299
8,439
7,174
Coal - Indonesia
Power
+161% Q-Q
-16% Y-Y
-25% Q-Q
+36% Y-Y
Coal - Australia
-25% Q-Q
-22% Y-Y
-15% Q – Q
Coal - China
Coal - China
-21% Q - Q
-70% Y - Y
Power
Power Coal - Australia Coal - China Coal - Indonesia
EBITDA NET PROFIT AFTER TAX
+14% Y – Y
Coal - China
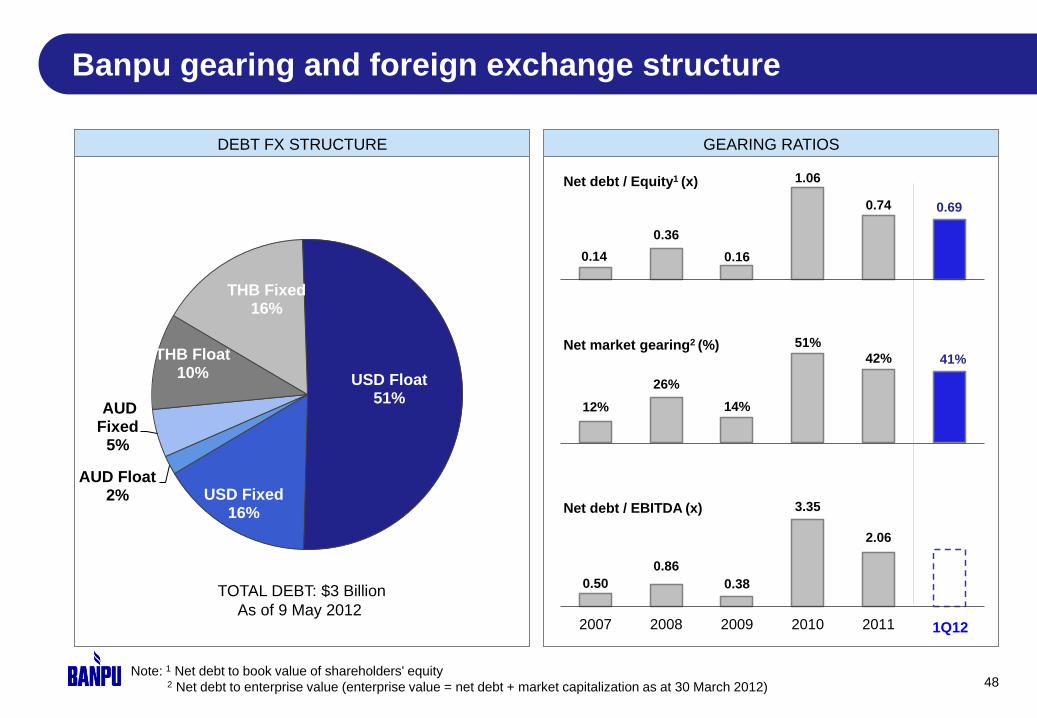
Banpu gearing and foreign exchange structure
48
DEBT FX STRUCTURE
USD Float 51%
USD Fixed 16%
AUD Float 2%
AUD Fixed
5%
THB Float 10%
THB Fixed 16%
GEARING RATIOS
0.14
0.36
0.16
1.06
0.74 0.69
2007 2008 2009 2010 2011 1Q12
Net debt / Equity1 (x)
Note: 1 Net debt to book value of shareholders' equity
2 Net debt to enterprise value (enterprise value = net debt + market capitalization as at 30 March 2012)
12%
26%
14%
51%
42% 41%
2007 2008 2009 2010 2011 1Q12
Net market gearing2 (%)
0.50
0.86
0.38
3.35
2.06
2007 2008 2009 2010 2011 1Q12
Net debt / EBITDA (x)
TOTAL DEBT: $3 Billion
As of 9 May 2012 1Q12
Appendices
49
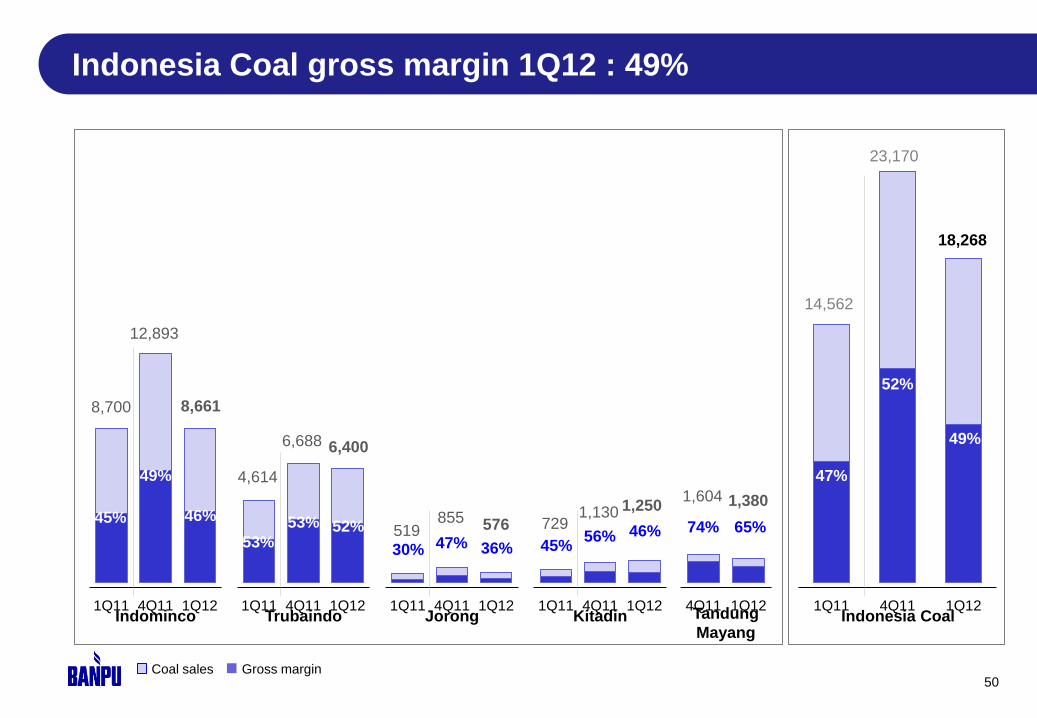
Indonesia Coal gross margin 1Q12 : 49%
50 Coal sales Gross margin
1Q11 4Q11 1Q12
49%
52%
47%
18,268
23,170
14,562
1Q11 4Q11 1Q12 Indonesia Coal Indominco
49%
45% 46%
8,700 8,661
12,893
1Q11 4Q11 1Q12
53%
53% 52%
4,614
6,400 6,688
Trubaindo 1Q11 4Q11 1Q12
53%
53% 52% 519
855
Jorong
576
30% 47% 36%
1Q11 4Q11 1Q12
53%
53% 52% 729
1,130 1,250
45% 56% 46%
Kitadin 4Q11 1Q12 Tandung
Mayang
1,604 1,380
74% 65%
51
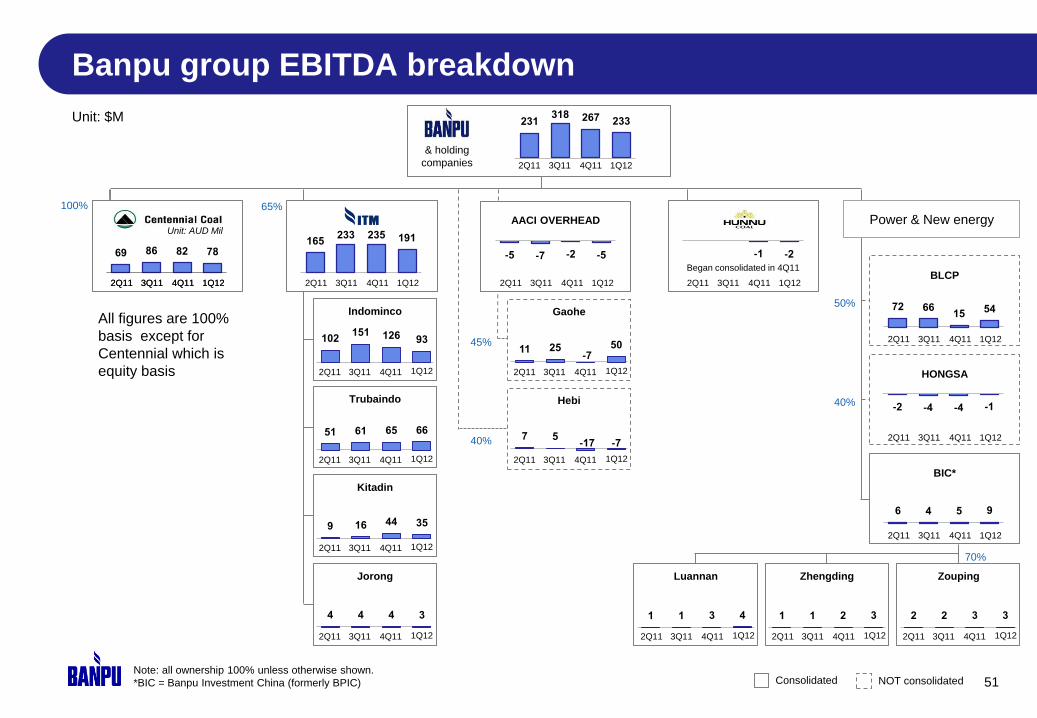
50%
40%
Power & New energy
40%
45%
70%
Note: all ownership 100% unless otherwise shown.
*BIC = Banpu Investment China (formerly BPIC)
Gaohe
Hebi
BLCP
HONGSA
BIC*
Zouping
2 2 3 3
Zhengding
1 1 2 3
Luannan
1 1 3 4
& holding
companies
65%
Indominco
Trubaindo
4Q11 Kitadin
Jorong
AACI OVERHEAD
-5 -7 -2 -5
Unit: $M
100%
69 86 82 78
Consolidated NOT consolidated
Banpu group EBITDA breakdown
2Q11 3Q11 4Q11 1Q12 2Q11 3Q11 4Q11 1Q12 2Q11 3Q11 4Q11 1Q12 2Q11 3Q11 4Q11 1Q12
2Q11 3Q11 4Q11 1Q12
2Q11 3Q11 4Q11 1Q12
2Q11 3Q11 4Q11 1Q12
2Q11 3Q11 4Q11 1Q12
2Q11 3Q11 4Q11 1Q12
2Q11 3Q11 4Q11 1Q12
2Q11 3Q11 4Q11 1Q12
2Q11 3Q11 4Q11 1Q12
2Q11 3Q11 4Q11 1Q12
2Q11 3Q11 4Q11 1Q12 2Q11 3Q11 4Q11 1Q12 2Q11 3Q11 4Q11 1Q12
2Q11 3Q11 4Q11 1Q12
165 233 235 191
102 151 126 93
51 61 65 66
9 16 44 35
4 4 4 3
11 25 -7
50
7 5 -17 -7
-1 -2
Began consolidated in 4Q11
72 66 15 54
-2 -4 -4 -1
6 4 5 9
Unit: AUD Mil
2Q11 3Q11 4Q11 1Q12
All figures are 100%
basis except for
Centennial which is
equity basis
231 318 267 233
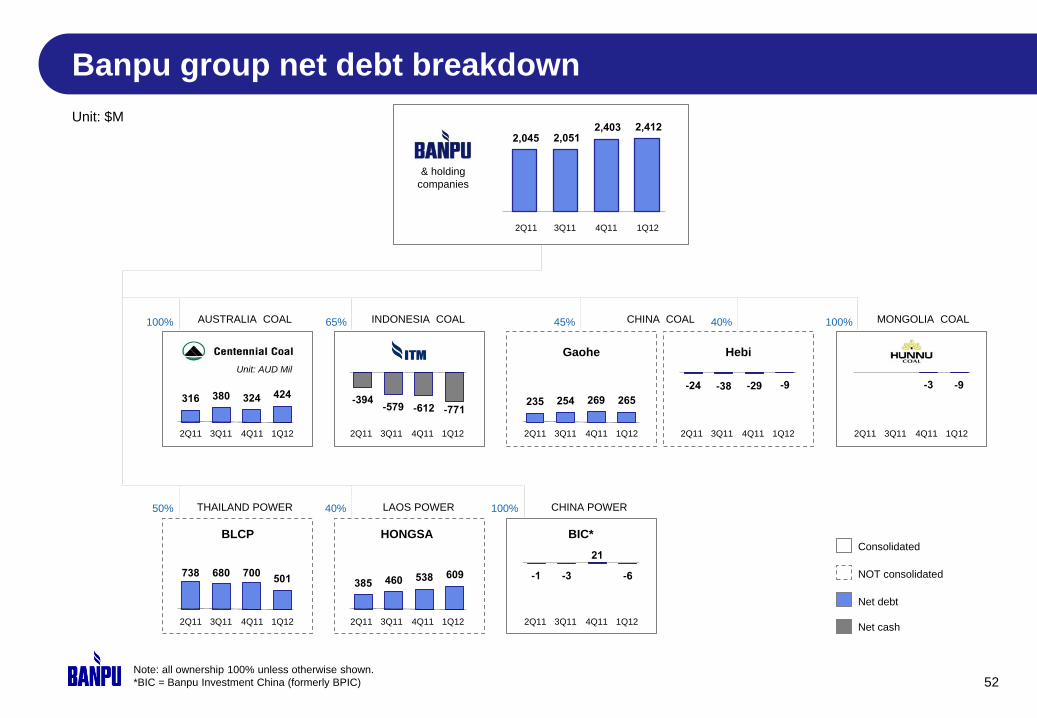
Banpu group net debt breakdown
52 Note: all ownership 100% unless otherwise shown.
*BIC = Banpu Investment China (formerly BPIC)
& holding
companies
2,045 2,051 2,403 2,412
2Q11 3Q11 4Q11 1Q12
2Q11 3Q11 4Q11 1Q12
AUSTRALIA COAL INDONESIA COAL CHINA COAL MONGOLIA COAL
THAILAND POWER LAOS POWER CHINA POWER
Gaohe Hebi
HONGSA BLCP BIC* Consolidated
NOT consolidated
100% 65% 45% 40% 100%
50% 40% 100%
Net debt
Net cash
2Q11 3Q11 4Q11 1Q12 2Q11 3Q11 4Q11 1Q12 2Q11 3Q11 4Q11 1Q12 2Q11 3Q11 4Q11 1Q12
2Q11 3Q11 4Q11 1Q12 2Q11 3Q11 4Q11 1Q12 2Q11 3Q11 4Q11 1Q12
316 380 324 424 -394
-579 -612 -771 235 254 269 265
-24 -38 -29 -9 -3 -9
738 680 700 501 385 460 538 609 -1 -3
21
-6
Unit: AUD Mil
Unit: $M
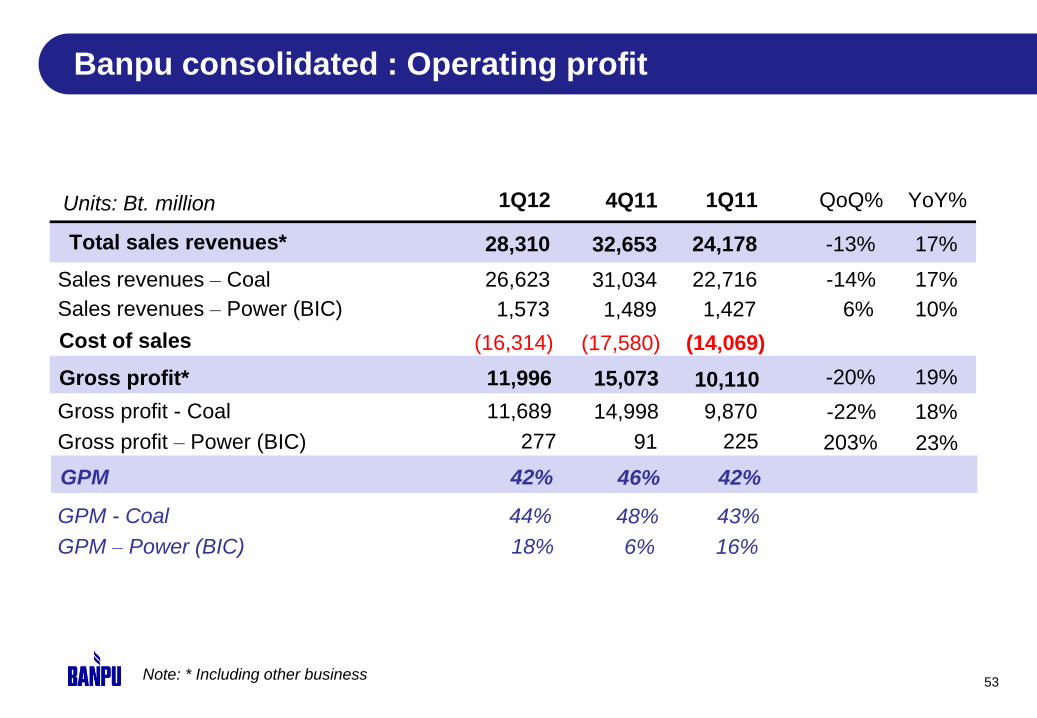
Banpu consolidated : Operating profit
Units: Bt. million
Sales revenues – Power (BIC) 1,573
Cost of sales (16,314)
Gross profit* 11,996 -20% 19%
GPM 42%
1Q12 QoQ% YoY%
28,310 -13% 17%
Note: * Including other business
Sales revenues – Coal
Total sales revenues*
26,623 -14% 17%
Gross profit - Coal 11,689 -22% 18%
Gross profit – Power (BIC) 277
GPM – Power (BIC) 18%
GPM - Coal 44%
6% 10%
203% 23%
53
1,489
(17,580)
15,073
46%
4Q11
32,653
31,034
14,998
91
6%
48%
1,427
(14,069)
10,110
42%
1Q11
24,178
22,716
9,870
225
16%
43%
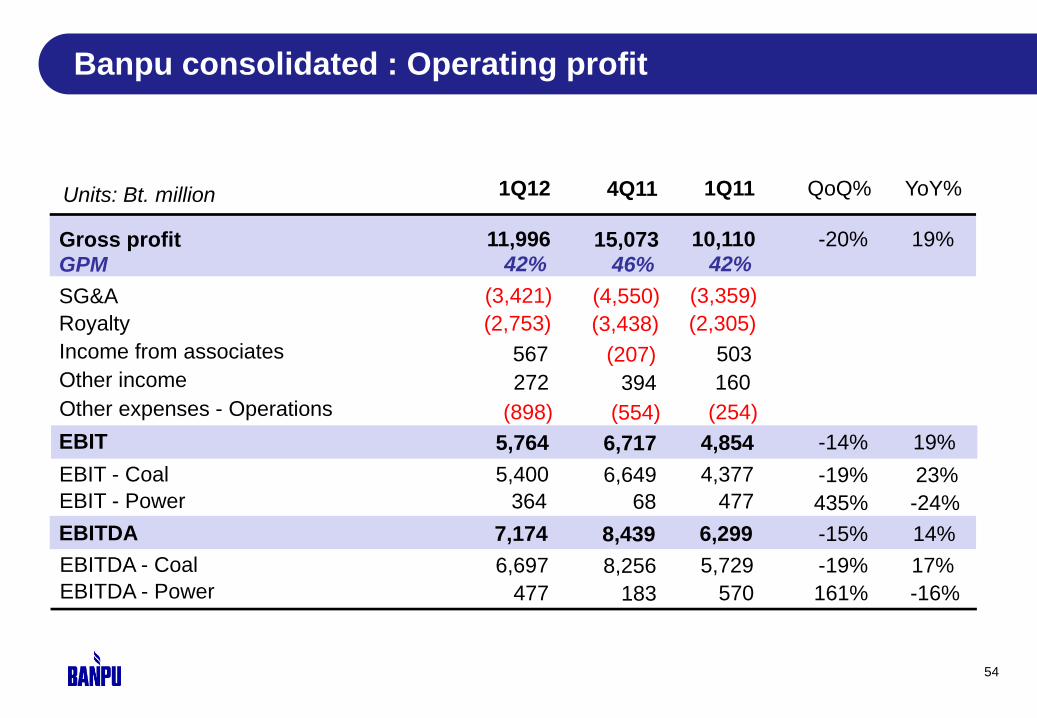
Units: Bt. million
Gross profit 11,996 -20% 19%
GPM 42%
SG&A (3,421)
Royalty (2,753)
Other income 272
EBIT 5,764 -14% 19%
EBITDA 7,174 -15% 14%
1Q12 QoQ% YoY%
EBIT - Coal 5,400 -19% 23%
EBIT - Power 364
Income from associates 567
435% -24%
EBITDA - Coal 6,697 -19% 17%
EBITDA - Power 477 161% -16%
Other expenses - Operations (898)
Banpu consolidated : Operating profit
54
15,073
46%
(4,550)
(3,438)
394
6,717
8,439
4Q11
6,649
68
(207)
8,256
183
(554)
10,110
42%
(3,359)
(2,305)
160
4,854
6,299
1Q11
4,377
477
503
5,729
570
(254)

Banpu consolidated : Net profit
Units: Bt. million
EBIT
Interest expenses (824)
Financial expenses (88)
Income tax (core business) (1,724)
Minorities (1,193)
Net profit before extra items 1,934
Non-recurring items* 282
Net profit before FX 2,216 -73%
FX translations 569
Net profit 2,785 -70%
EPS (Bt/share) 10.25
Note: * Income from non-core assets and other non-operating expenses
YoY% 1Q12
-5%
-13%
-21%
QoQ%
-12%
5,764 -14% 19%
55
(817)
(117)
(1,897)
(1,691)
2,194
347
2,540
988
3,528
12.98
4Q11
6,717
(698)
(71)
(1,247)
(810)
2,027
8,058
8,144
1,019
9,163
33.72
1Q11
4,854
(1,941) Income tax (non- core business)
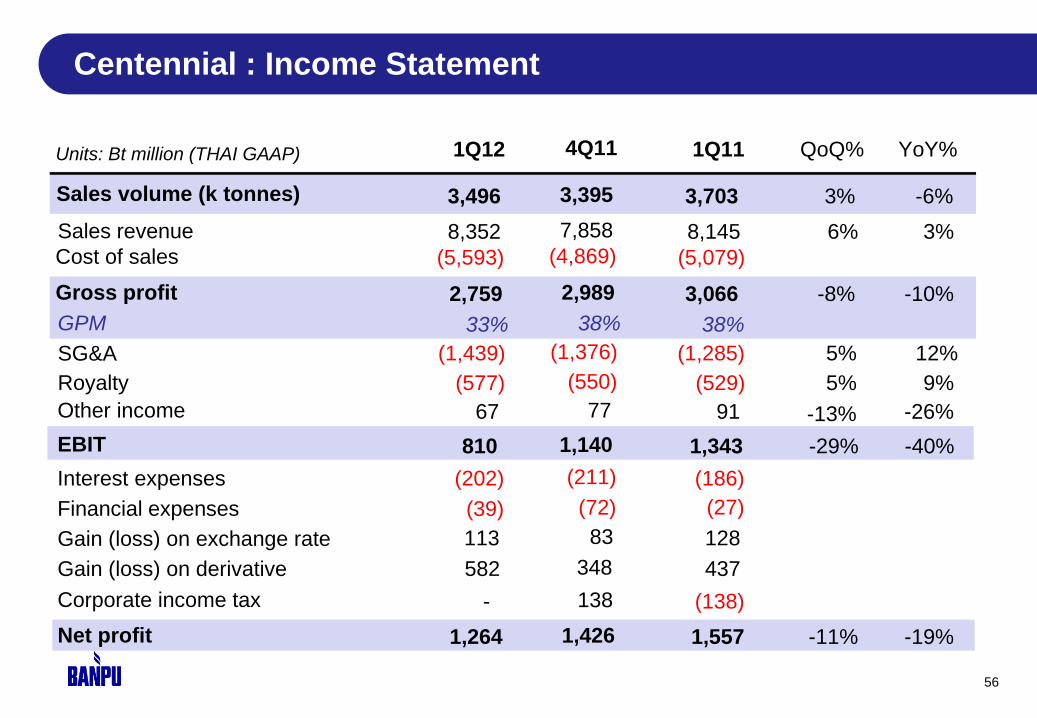
Centennial : Income Statement
Units: Bt million (THAI GAAP) 1Q12 QoQ% 1Q11
56
Cost of sales (5,593)
Gross profit 2,759 -8%
(5,079)
3,066
GPM 33% 38%
Royalty (577)
SG&A (1,439) 5%
5% (529)
(1,285)
810 -29% EBIT 1,343
3,496 3%
Sales revenue
Sales volume (k tonnes)
8,352 6%
3,703
8,145
Other income 67 -13% 91
Interest expenses (202)
Financial expenses (39)
Gain (loss) on exchange rate 113
Corporate income tax -
Net profit 1,264 -11%
(186)
(27)
128
(138)
1,557
Gain (loss) on derivative 582 437
YoY%
-10%
12%
9%
-40%
-6%
3%
-26%
-19%
4Q11
(4,869)
2,989
38%
(550)
(1,376)
1,140
3,395
7,858
77
(211)
(72)
83
138
1,426
348

57
Banpu group coal sales 1Q12
COAL SALES BREAKDOWN BY DESTINATION 1Q12 (Mt) BANPU GROUP TOTAL GLOBAL COAL SALES 1Q12
Total: 9.8Mt (Sales from Indonesia are included on 100% basis,
sales from Australia and China are included on equity basis ) Australia Coal
China Coal
Indonesia Coal
21%
24%
14%
9%
7%
6%
6%
4% 3%
2% 2% 2%
Australia
Japan
China
Taiwan
S Korea
Italy
Thailand
Philippines
Hong Kong
India
Indonesia
Others
JAPAN
1.4 Mt
PHILIPPINES
0.4 Mt
THAILAND
0.6 Mt
INDIA
0.1 Mt
OTHERS
0.2 Mt
HK
0.2 Mt
S KOREA
0.7 Mt
CHINA
2.3 Mt
TAIWAN
0.9 Mt
AUSTRALIA
2.1 Mt
ITALY
0.3 Mt
0.5
0.9
1.8
INDONESIA
0.6 Mt
0.4 0.3
0.5
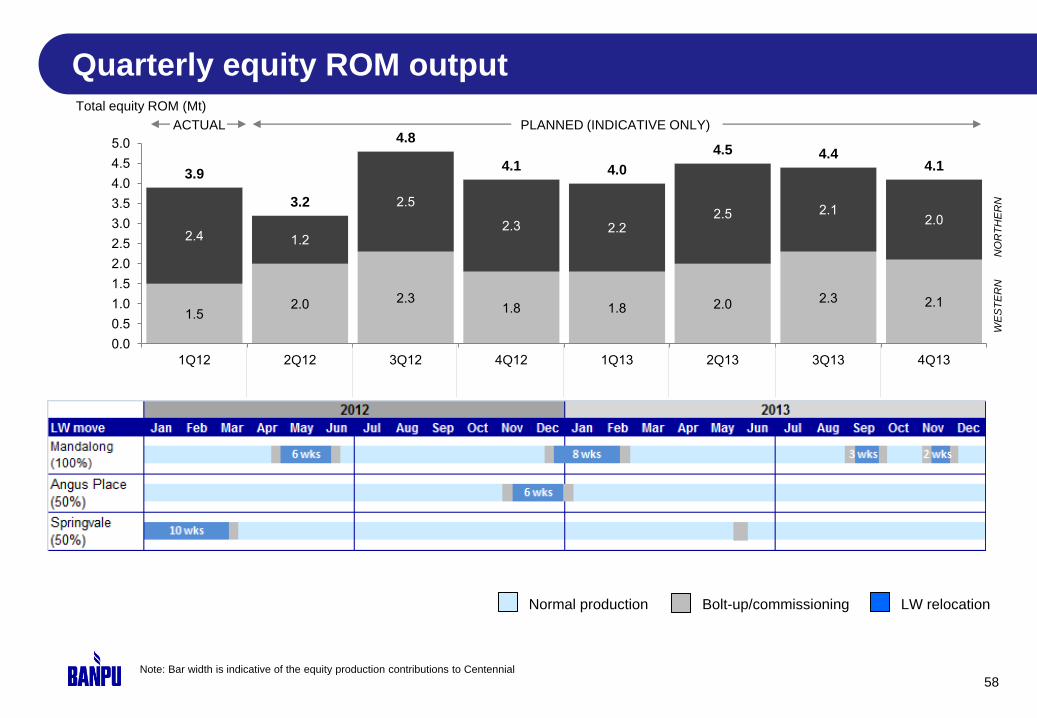
58
Quarterly equity ROM output
Normal production Bolt-up/commissioning LW relocation
Note: Bar width is indicative of the equity production contributions to Centennial
1.5 2.0 2.3
1.8 1.8 2.0 2.3 2.1
2.4 1.2
2.5
2.3 2.2 2.5 2.1
2.0
3.9
3.2
4.8
4.1 4.0
4.5 4.4 4.1
0.0
0.5
1.0
1.5
2.0
2.5
3.0
3.5
4.0
4.5
5.0
1Q12 2Q12 3Q12 4Q12 1Q13 2Q13 3Q13 4Q13
Total equity ROM (Mt)
ACTUAL PLANNED (INDICATIVE ONLY)
WE
ST
ER
N
NO
RT
HE
RN