investor presence and competition in major european
TRANSCRIPT
Investor Presence and Competition
in Major European Football Leagues
Stephan Birkhäuser1, Christoph Kaserer2, and Daniel Urban3
Abstract
Based on a hand-collected dataset on investor cash flows to more than 300
football clubs, we examine the impact of investor presence on competition in
major European football leagues. By spending investor cash flows on more
valuable players, clubs with investors on average become more successful.
Thereby, increased investor presence results in reduced competition within
national football leagues in Europe. However, investor presence also leads to
greater international success of the respective football leagues as approximated
by UEFA prize money and annual UEFA country coefficients. Softened UEFA
fair play regulations to attract more investors are thus likely to reduce
competition within national football leagues.
Keywords: Football, competition, investors, inequality
1 Stephan Birkhäuser is a student at Technische Universität München (TUM).
2 Christoph Kaserer is co-director of the Center for Entrepreneurial and Financial Studies (CEFS) and Full Professor of Finance at the Department of Financial Management and Capital Markets at the TUM School of Management.
3 Daniel Urban is a postdoctoral researcher at the Department of Financial Management and Capital Markets at the TUM School of Management.
Investor Presence and Competition in Major European Football Leagues 2
1 Introduction
Ever since Roman Abramovich became owner of Chelsea F.C. in June 2003, investor presence at
European football clubs has extensively been discussed among UEFA officials, the media, and fans.
On the one hand, large-scale investor payments could threaten the existence of traditional football
clubs that only rely on classical sources of financing such as ticket revenues, the sale of television
rights, merchandising, prize money, or sponsoring. On the other hand, similar to venture capital,
investors might break up established structures and increase competition. Following this reasoning, the
UEFA recently softened its financial fair play regulation.1 Furthermore, investor payments might even
be necessary for football clubs to succeed in increasingly important international tournaments such as
the UEFA Champions League.
This far, however, empirical evidence on the implications of investors, be it individuals such as
Roman Abramovich or Dietmar Hopp (TSG 1899 Hoffenheim) as well as corporations such as Red
Bull GmbH (RB Leipzig) or Qatar Sports Investment (Paris Saint-Germain F.C.), is limited. In this
paper, we examine whether investor payments to football clubs distort competition and hence reduce
suspense within European football leagues.
To this end, we hand-collect a novel dataset that covers investor payments to more than 300 football
clubs in the first and second football leagues in five European countries (England, France, Germany,
Italy, and Spain) throughout the 2004/2005 to 2013/2014 seasons. In our setting, investor payments
are defined as payments of either a high-profile natural person or legal entity that holds a significant
share of the club’s capital as well as payments of all other high-profile natural persons or legal entities
with no shareholdings in the club and no direct or indirect relationship to a sponsor of the club, credit
or public sector institution.
Based on this dataset, we first show that investor payments increased during the sample period while
competition in major European football leagues decreased simultaneously. We use three variables to
measure competition: the disparity of betting quotas in a given season, a Herfindahl-Index based on
the distribution of points in the football table after the last game of each season as well as the
1 See for example http://www.theguardian.com/football/2015/jun/29/uefa-financial-fair-play-investors.
Investor Presence and Competition in Major European Football Leagues 3
dominance of the five best teams per season. The main finding remains robust to controlling for
several other variables such as player market value heterogeneity and season fixed effects as well as
lagging the independent variables by one season to mitigate concerns about reverse causality. We also
show results on the underlying mechanism. We find that investor cash flows enable football clubs to
increase the market values of their teams. Thereby, they become on average more successful than
teams without investors: Teams with investors arrive at more points per match and a higher win
probability. Thus, the main finding is in line with the notion that investor presence distorts competition
and may hence decrease suspense within national football leagues. However, investor presence also
results in greater international success of the respective football leagues as approximated by UEFA
prize money and annual UEFA country coefficients.
Our paper adds to the literature along several dimensions. First, we provide descriptive statistics on
investor payments for a representative sample of European football clubs. Second, based on that
dataset, we show that investor payments reduce competition within European football leagues. At the
same time, however, investor payments foster international success in terms of UEFA prize money
and annual UEFA country coefficients.
The remainder of this paper is organized as follows. Section 2 provides an overview of the relevant
literature. In Section 3, we elaborate on recent developments in European football leagues. In Section
4, we describe the data as well as the main variables for investor presence and competition. Section 5
presents the empirical results. Section 6 summarizes the main findings and discusses some
implications.
2 Literature review
League inequality has been a popular topic in sports science and economics. Goossens (2006)
examines the competitive balance of eleven football leagues in Europe from the 1960s up to 2005 to
determine similarities between different nations, thus concluding whether common regulatory
standards should be put in place by the UEFA. Goossens also discusses whether a pan-European
league represents a remedy to increasing football league inequality as a result of a few dominant clubs.

Investor Presence and Competition in Major European Football Leagues 4
Furthermore, Bloching and Pawlowski (2013) analyze the trends in competitive balance throughout
Europe’s top five football leagues from 1991 to 2011. They argue that the top leagues in Germany and
France are likely to be the most exciting ones even though there is decreasing competition throughout
all the football leagues in the sample. They further hypothesize that high Champions League payouts
might also foster this development.
The presence of football investors has also been widely discussed in academic research. Based on
seven case studies, Hassan and Hamil (2013) focus their analysis on the implications of different
management styles of football clubs. For example, they discuss recent developments such as the
increasing commercialization and the growing presence of foreign third-party owners of English
football clubs.
Fort and Quirk (2004) differentiate between leagues composed of owners who wish to maximize the
percentage of wins (e.g., lower tier European football leagues) versus those with clubs that wish to
maximize profits (e.g., the Premier League). Based on a theoretical model, they argue that the level of
competitive balance does not differ in both types of leagues. In addition, Pawlowski (2013) conducts a
survey among 1,700 football fans in Central Europe and finds that the majority of fans think that
investors reduce the audience’s excitement for the sport.
This far, however, there is no study that combines data on investor cash flows to European football
clubs irrespective of the investor’s ownership status in the club and data on football league inequality.
In doing so, we are able to provide empirical evidence on the effects of investor presence on
competition.
3 Recent developments in European football leagues
During the 1990s, the first European football leagues had been generating annual revenues of about
several hundred million Euros. At the turn of the millennium, however, major changes such as
increasing investor presence, internationalization and changes in consumer behavior affected the core
business model, which resulted in an extraordinary growth in sales in the football industry. Over the
last years, the first English football league, the Premier League, was able to position itself as a market
Investor Presence and Competition in Major European Football Leagues 5
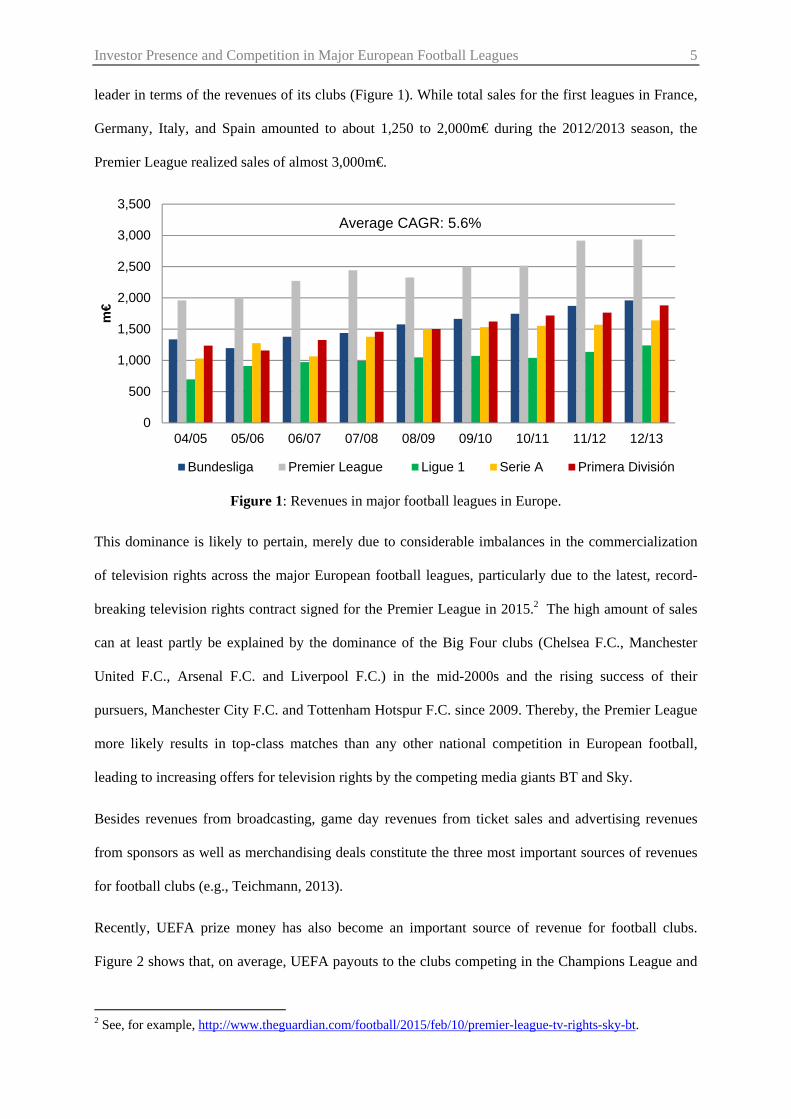
leader in terms of the revenues of its clubs (Figure 1). While total sales for the first leagues in France,
Germany, Italy, and Spain amounted to about 1,250 to 2,000m€ during the 2012/2013 season, the
Premier League realized sales of almost 3,000m€.
Figure 1: Revenues in major football leagues in Europe.
This dominance is likely to pertain, merely due to considerable imbalances in the commercialization
of television rights across the major European football leagues, particularly due to the latest, record-
breaking television rights contract signed for the Premier League in 2015.2 The high amount of sales
can at least partly be explained by the dominance of the Big Four clubs (Chelsea F.C., Manchester
United F.C., Arsenal F.C. and Liverpool F.C.) in the mid-2000s and the rising success of their
pursuers, Manchester City F.C. and Tottenham Hotspur F.C. since 2009. Thereby, the Premier League
more likely results in top-class matches than any other national competition in European football,
leading to increasing offers for television rights by the competing media giants BT and Sky.
Besides revenues from broadcasting, game day revenues from ticket sales and advertising revenues
from sponsors as well as merchandising deals constitute the three most important sources of revenues
for football clubs (e.g., Teichmann, 2013).
Recently, UEFA prize money has also become an important source of revenue for football clubs.
Figure 2 shows that, on average, UEFA payouts to the clubs competing in the Champions League and
2 See, for example, http://www.theguardian.com/football/2015/feb/10/premier-league-tv-rights-sky-bt.
0
500
1,000
1,500
2,000
2,500
3,000
3,500
04/05 05/06 06/07 07/08 08/09 09/10 10/11 11/12 12/13
m€
Bundesliga Premier League Ligue 1 Serie A Primera División
Average CAGR: 5.6%

Investor Presence and Competition in Major European Football Leagues 6
Europa League have doubled throughout the last decade. Thereby, more and more clubs feel obliged
to qualify for these two European tournaments as failure leads to a drop in prize money, fewer
merchandising sales, and deterioration in the value of the club brand. Lower amounts of UEFA prize
money may even lead to budget cuts and the sale of players. The increasing importance of
international football tournaments might thus be likely to split football clubs into two segments: major
clubs with strong international brands and local or regional clubs forced to focus on their regional
identity.
Figure 2: UEFA prize money paid to major European football leagues.
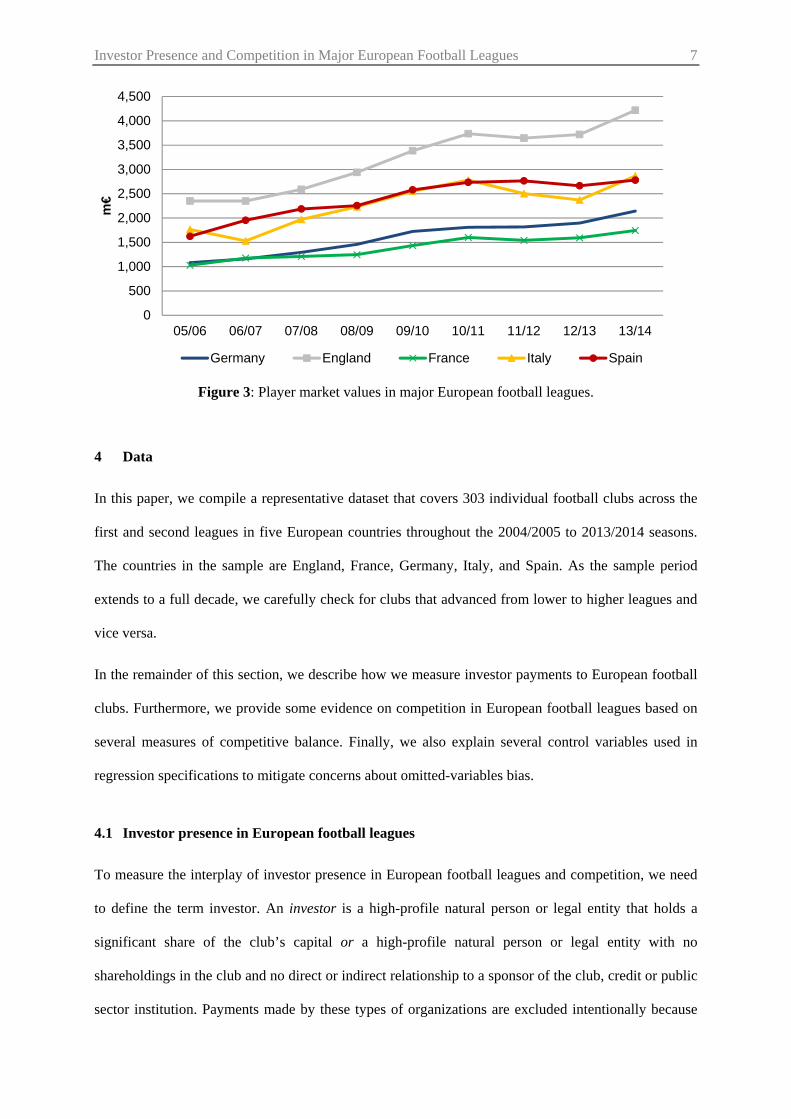
The increasing importance of international success is also accompanied by higher expenditures for
players (Figure 3). Throughout the last decade, player market values increased by about 100%. This
effect is consistent across all major European football nationalities. Not surprisingly, player market
values are highest in the first two English football leagues. It is likely that external financing by
investors such as Roman Abramovich (Chelsea F.C.) and Sheikh Mansour (Manchester City F.C.)
may have amplified the development of higher player market values and thereby increasing costs to
English football clubs. For example, the two clubs mentioned above received investor payments of
about of 1,500m€ during the sample period. In the following sections, we thus shed new light on the
presence of investors in major European football leagues and their implications on competition in
national football leagues.
0
50
100
150
200
250
04/05 05/06 06/07 07/08 08/09 09/10 10/11 11/12 12/13 13/14
m€
Germany England France Italy Spain
Average CAGR: 11.4%
Investor Presence and Competition in Major European Football Leagues 7
Figure 3: Player market values in major European football leagues.
4 Data
In this paper, we compile a representative dataset that covers 303 individual football clubs across the
first and second leagues in five European countries throughout the 2004/2005 to 2013/2014 seasons.
The countries in the sample are England, France, Germany, Italy, and Spain. As the sample period
extends to a full decade, we carefully check for clubs that advanced from lower to higher leagues and
vice versa.
In the remainder of this section, we describe how we measure investor payments to European football
clubs. Furthermore, we provide some evidence on competition in European football leagues based on
several measures of competitive balance. Finally, we also explain several control variables used in
regression specifications to mitigate concerns about omitted-variables bias.
4.1 Investor presence in European football leagues
To measure the interplay of investor presence in European football leagues and competition, we need
to define the term investor. An investor is a high-profile natural person or legal entity that holds a
significant share of the club’s capital or a high-profile natural person or legal entity with no
shareholdings in the club and no direct or indirect relationship to a sponsor of the club, credit or public
sector institution. Payments made by these types of organizations are excluded intentionally because
0
500
1,000
1,500
2,000
2,500
3,000
3,500
4,000
4,500
05/06 06/07 07/08 08/09 09/10 10/11 11/12 12/13 13/14
m€
Germany England France Italy Spain
Investor Presence and Competition in Major European Football Leagues 8
traditional sources of football club financing such as state-level subsidies, bank loans, or sponsorship
payments are typically not regarded as investor payments. As a result, only sponsorship payments by
direct shareholders (e.g., Adidas AG, Allianz SE, and Audi AG at FC Bayern München) as well as
sponsoring payments with unusual conditions in case they can be linked indirectly to a club’s
shareholder (Manchester City F.C., Paris Saint-Germain F.C.) are considered. We further exclude
investments from anonymous or small investors (e.g., small loans by fans). In our setting, investor
payments are mostly either loans by external parties, donations, or the investor’s share in
recapitalizations. In addition, we include purchases of equity stakes that have previously been owned
by the football club itself.
Unfortunately, information on investor payments to football clubs is not readily available, particularly
due to low or non-existent disclosure requirements. Nevertheless, we extensively screen financial
reports, press releases as well as newspaper articles (in the original language versions) to obtain data
on investors, their ties to the clubs as well as their payments. In this regard, we benefit from the high
significance of football in the media and among fans as there are many articles on investor presence as
well as their (oftentimes suspected) payments to football clubs. When there is no official information
on investor transactions available, we validate the data based on different sources.
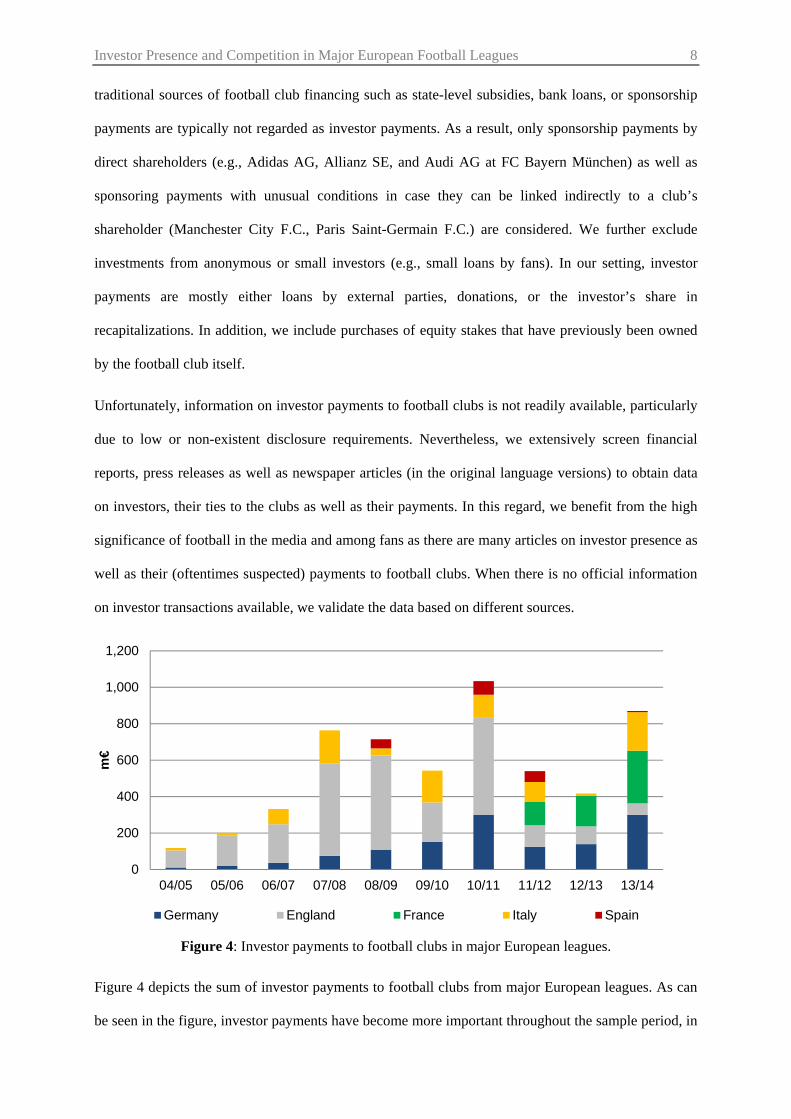
Figure 4: Investor payments to football clubs in major European leagues.
Figure 4 depicts the sum of investor payments to football clubs from major European leagues. As can
be seen in the figure, investor payments have become more important throughout the sample period, in
0
200
400
600
800
1,000
1,200
04/05 05/06 06/07 07/08 08/09 09/10 10/11 11/12 12/13 13/14
m€
Germany England France Italy Spain
Investor Presence and Competition in Major European Football Leagues 9
particular outside England. While investor payments amounted to about 94m€ in 2004/2005 with the
bulk of it being paid to English football clubs, they amounted to more than 800m€ in the 2013/2014
season with about equal parts going to French, German, and Italian clubs. This trend is likely to
continue as the UEFA has changed its financial fair play regulation so that football clubs may now
attract investors more easily. Not surprisingly, 95% of the payments are made to clubs from the first
leagues (not shown in the figure), potentially because these clubs appear more interesting to investors,
for example because the brand of the club is more renowned. Finally, due to the so-called “50+1” rule,
German clubs usually must not be controlled by third parties and hence, have been less attractive to
investors in the past.3
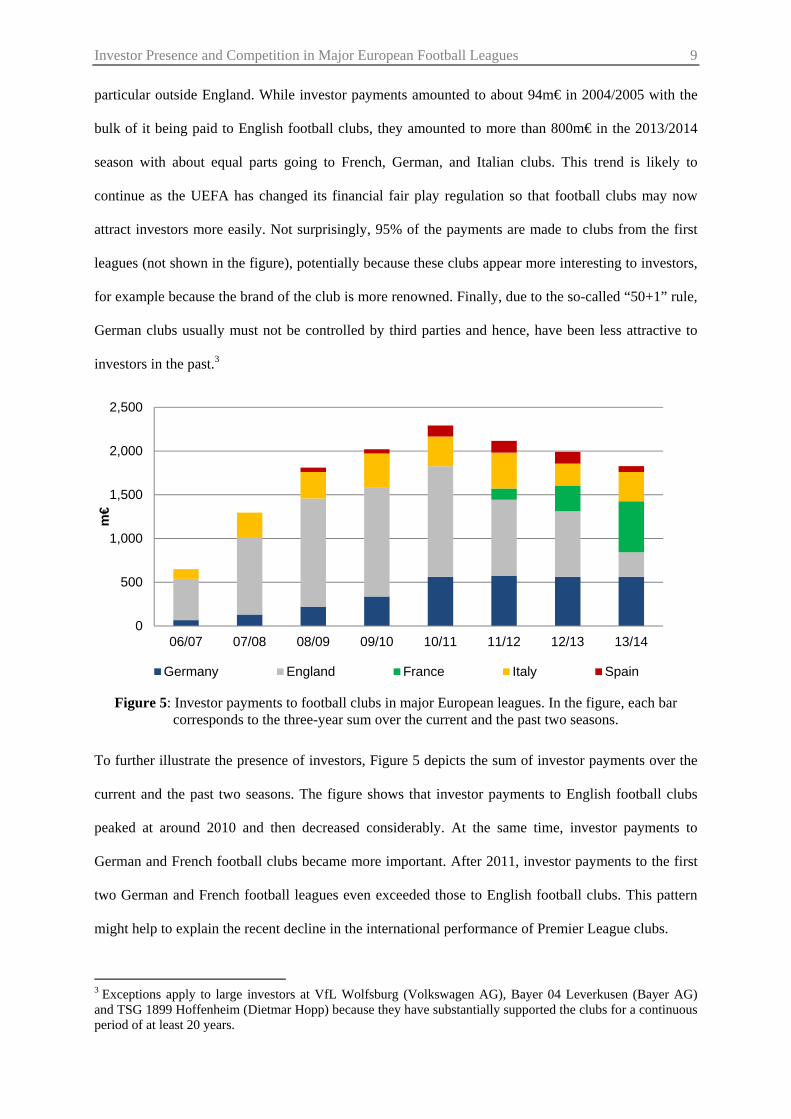
Figure 5: Investor payments to football clubs in major European leagues. In the figure, each bar corresponds to the three-year sum over the current and the past two seasons.
To further illustrate the presence of investors, Figure 5 depicts the sum of investor payments over the
current and the past two seasons. The figure shows that investor payments to English football clubs
peaked at around 2010 and then decreased considerably. At the same time, investor payments to
German and French football clubs became more important. After 2011, investor payments to the first
two German and French football leagues even exceeded those to English football clubs. This pattern
might help to explain the recent decline in the international performance of Premier League clubs.
3 Exceptions apply to large investors at VfL Wolfsburg (Volkswagen AG), Bayer 04 Leverkusen (Bayer AG) and TSG 1899 Hoffenheim (Dietmar Hopp) because they have substantially supported the clubs for a continuous period of at least 20 years.
0
500
1,000
1,500
2,000
2,500
06/07 07/08 08/09 09/10 10/11 11/12 12/13 13/14
m€
Germany England France Italy Spain
Investor Presence and Competition in Major European Football Leagues 10
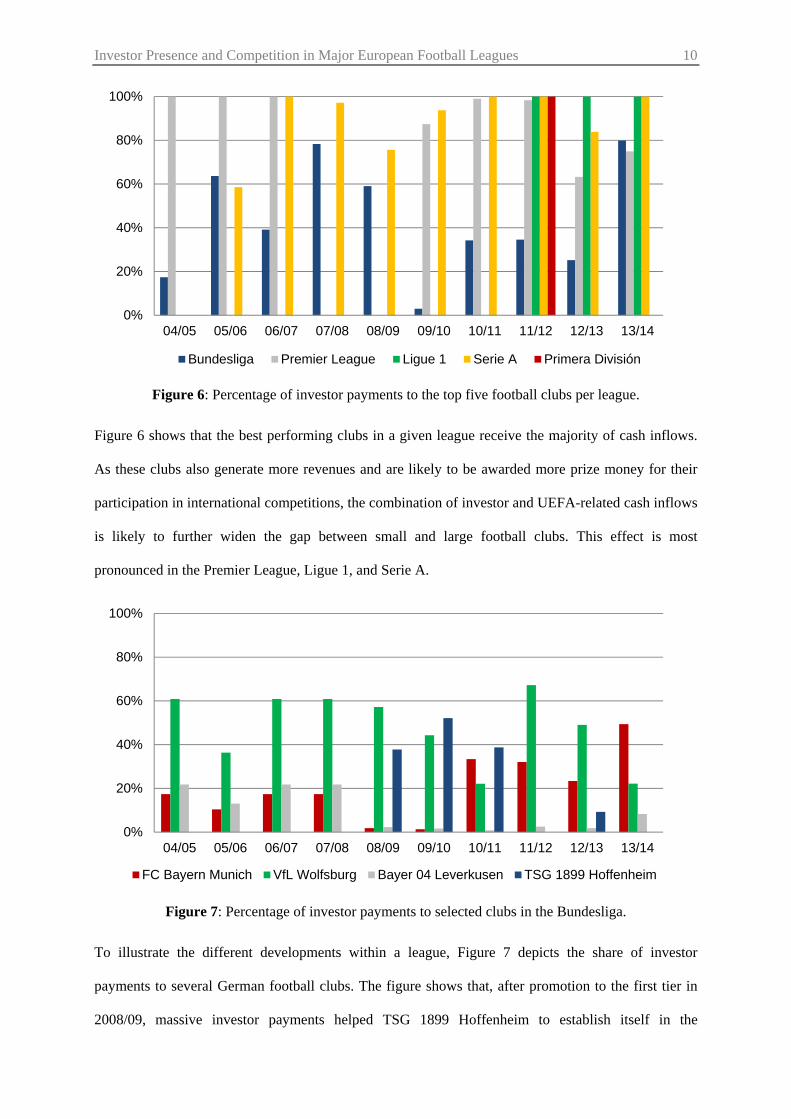
Figure 6: Percentage of investor payments to the top five football clubs per league.
Figure 6 shows that the best performing clubs in a given league receive the majority of cash inflows.
As these clubs also generate more revenues and are likely to be awarded more prize money for their
participation in international competitions, the combination of investor and UEFA-related cash inflows
is likely to further widen the gap between small and large football clubs. This effect is most
pronounced in the Premier League, Ligue 1, and Serie A.
Figure 7: Percentage of investor payments to selected clubs in the Bundesliga.
To illustrate the different developments within a league, Figure 7 depicts the share of investor
payments to several German football clubs. The figure shows that, after promotion to the first tier in
2008/09, massive investor payments helped TSG 1899 Hoffenheim to establish itself in the
0%
20%
40%
60%
80%
100%
04/05 05/06 06/07 07/08 08/09 09/10 10/11 11/12 12/13 13/14
Bundesliga Premier League Ligue 1 Serie A Primera División
0%
20%
40%
60%
80%
100%
04/05 05/06 06/07 07/08 08/09 09/10 10/11 11/12 12/13 13/14
FC Bayern Munich VfL Wolfsburg Bayer 04 Leverkusen TSG 1899 Hoffenheim

Investor Presence and Competition in Major European Football Leagues 11
Bundesliga. However, the club was not able to position itself among the five best teams at the end of a
season. German record champion Bayern München received new investor payments as a result of the
purchase of additional equity stakes by long-term sponsors Adidas AG, Audi AG, and Allianz SE in
2002, 2010, and 2014 respectively. 4 Finally, investor payments to VfL Wolfsburg by its parent
company Volkswagen AG are considerably higher than payments to its counterpart in Leverkusen (by
Bayer AG).
4.2 Competition in European football leagues
To assess the level of competition in European football leagues, this study examines both long-term
and short-term aspects of competitive balance. The first measure, the so-called Theil index, analyses
betting odds for individual matches to compare the uncertainty of the match outcome (home victory,
draw, or away victory). The other two measures capture league inequality on a long-term basis. The
Herfindahl-index of competitive balance (HICB) and the C5 index of competitive balance (C5ICB)
refer to the distribution of final points of all competing teams (HICB) or the share of the five most
successful ones (C5ICB) in a given season. Besides the two time dimensions, two different data sets -
betting odds and final points - enable us to draw robust conclusions irrespective of the measure for the
level of competition.
The Theil index, originally developed by Theil (1967), is based on betting odds. Betting odds
comprise all historic and current information regarding the possible outcome of a match such as the
players’ conditions, injuries, or home field advantage. Thus, according to Pope and Peel (1989),
betting odds represent an efficient measure for the uncertainty and therefore for the short-term
competitive balance of a football league. In line with Czarnitzki and Statmann (1999), the Theil index
can be calculated as
Theilindex ∑∑
log∑
, (1)
where refers to the probabilities of the three possible outcomes of each match (win, loss, draw). The
arithmetic mean of all Theil indexes over all the matches in a given season results in the Theil index
4 Similarly, Borussia 09 e.V. Dortmund received investor payments from Evonik Industries AG, Signal Iduna VVaG, and Puma SE during the 2014/15 season.

Investor Presence and Competition in Major European Football Leagues 12
for that season. The Theil index increases with a higher (a priori) uncertainty of the match outcome.
Thus, the higher the Theil index, the more equal a given football league. To obtain the probabilities
for the different match outcomes, we calculate the inverse of the (decimal) betting odds retrieved for
3,000 matches from www.football-data.co.uk. In doing so, we also take the margins of the
bookmakers into account.
The Herfindahl-index of competitive balance (HICB) is a modified version of the Herfindahl
(Hirschman) index. The original Herfindahl (Hirschman) index (HI or HHI) is a statistical
concentration measure (Hirschman, 1964). The HI of competitive balance (HICB) compares the
proportion of the observed HI to the HI of a perfectly balanced league and is measured, according to
Depken (1999) and Michie and Oughton (2004) as
HICB∑ ,
/∗ 100, (2)
where , denotes the share of points of team at the end of season , and the total number of clubs
in a league. As the HICB decreases with a higher level of competitive balance, we employ the
negative HICB so that the Theil index and HICB are positively correlated.
Finally, we calculate the five-club concentration ratio (C5), which relates the points of the best five
clubs in a given season to the points scored by all clubs in that season. We further adjust the five-club
concentration ratio by differences in league size ) to arrive at the C5 index of competitive balance
(C5ICB), defined by Michie and Oughton (2004):
C5ICB∑ , ∗ 100, (3)
where , denotes the shares of points of team relative to the league as a whole.
Similarly to the HICB, the C5ICB decreases with a higher level of competitive balance. Thus, we also
use the negative C5ICB to measure football league inequality.

Investor Presence and Competition in Major European Football Leagues 13
Figure 8: Theil index for the highest European football leagues.
The developments of the three competition measures over time are displayed in Figures 8 to 11. In line
with recent evidence by Bloching and Pawlowski (2013), we find that competition has on average
decreased throughout the sample period. For example, the average share of points of the five best
clubs (not normalized by league size) across all the first leagues increased from about 0.35
(2004/2005) to about 0.38 (2013/2014) or by about 9% (Figure 12), which corresponds to a decrease
in the average negative C5ICB from -136 to -148 (Figure 11). This effect, however, does not pertain to
the second leagues, as indicated by Figure 9, which shows that the Theil index has remained relatively
constant during the sample period. Similar conclusions can be drawn based on the other two
competition measures. Thus, it could be that the decrease in competition stems from investor presence
as most of the investors’ money was paid to clubs in the first leagues. In the next section, we examine
this relation more formally.
0.92
0.94
0.96
0.98
1.00
1.02
1.04
1.06
04/05 05/06 06/07 07/08 08/09 09/10 10/11 11/12 12/13 13/14
Bundesliga Premier League Ligue 1 Primera División Serie A

Investor Presence and Competition in Major European Football Leagues 14
Figure 9: Theil index for the second-highest European football leagues.
Furthermore, the first French football league (Ligue 1) is generally the most balanced one (where
investor payments have been negligible until 2011). Compared to the other European football leagues,
competition is modest in the German Bundesliga, where investors became more prevalent around
2008. Finally, competition is lowest in the English Premier League, where large-scale investor
presence became increasingly popular with Roman Abramovich as of 2003.
Figure 10: Negative HICB for the highest European football leagues.
1.00
1.01
1.02
1.03
1.04
1.05
1.06
1.07
04/05 05/06 06/07 07/08 08/09 09/10 10/11 11/12 12/13 13/14
2. Bundesliga Championship Ligue 2 Segunda División Serie B
-116
-114
-112
-110
-108
-106
-104
-10204/05 05/06 06/07 07/08 08/09 09/10 10/11 11/12 12/13 13/14
Bundesliga Premier League Ligue 1 Primera División Serie A

Investor Presence and Competition in Major European Football Leagues 15
Figure 11: Negative C5ICB for the highest European football leagues.
Figure 12: Share of points of the five best clubs across the five first European football leagues in the sample.
4.3 Other variables
We employ several control variables to mitigate concerns about unobserved heterogeneity in our
regressions. UEFA prize money, taken from official UEFA press releases, is the amount of money (in
m€) a club is awarded due to its participation and success in international tournaments. Player market
values is the average of all players’ market values (in m€) of a given club in a given season. To
calculate this variable, we obtain data for more than 50,000 players from www.tm.de, a website that
-155
-150
-145
-140
-135
-130
-125
-12004/05 05/06 06/07 07/08 08/09 09/10 10/11 11/12 12/13 13/14
Bundesliga Premier League Ligue 1 Primera División Serie A
0.25
0.30
0.35
0.40
0.45
04/05 05/06 06/07 07/08 08/09 09/10 10/11 11/12 12/13 13/14
Bundesliga Premier League Ligue 1 Primera División Serie A

Investor Presence and Competition in Major European Football Leagues 16
provides extensive information on football clubs as well as their squads.5 On this webpage, player
market values are estimated by experts and long-standing users. In doing so, www.tm.de arrives at
relatively precise estimates of a player’s market value.6 In case there are missing market values for a
given player in a given season, we set missing market values to the lowest available market value for
that club. Transfer balance is the sum (in m€) of all cash inflows (due to the sale of players) and
outflows (due to acquisition of players) in a given season. Data is again retrieved from www.tm.de.
Squad size and Squad age, obtained from www.tm.de, refer to the number and the average age of all
players in a given squad and season. Top4 league is a dummy variable which is set to one if a league’s
underlying national team was among the four best teams at the preceding world or European
championships, and zero otherwise. First league is dummy variable which is set to one if the
respective league is the first league in a given country, and zero otherwise. Finally, we also add a set
of season dummies to all regression specifications to control for unobserved heterogeneity over time.
5 Investor presence and competition in European football leagues
5.1 Investor presence and individual club performance
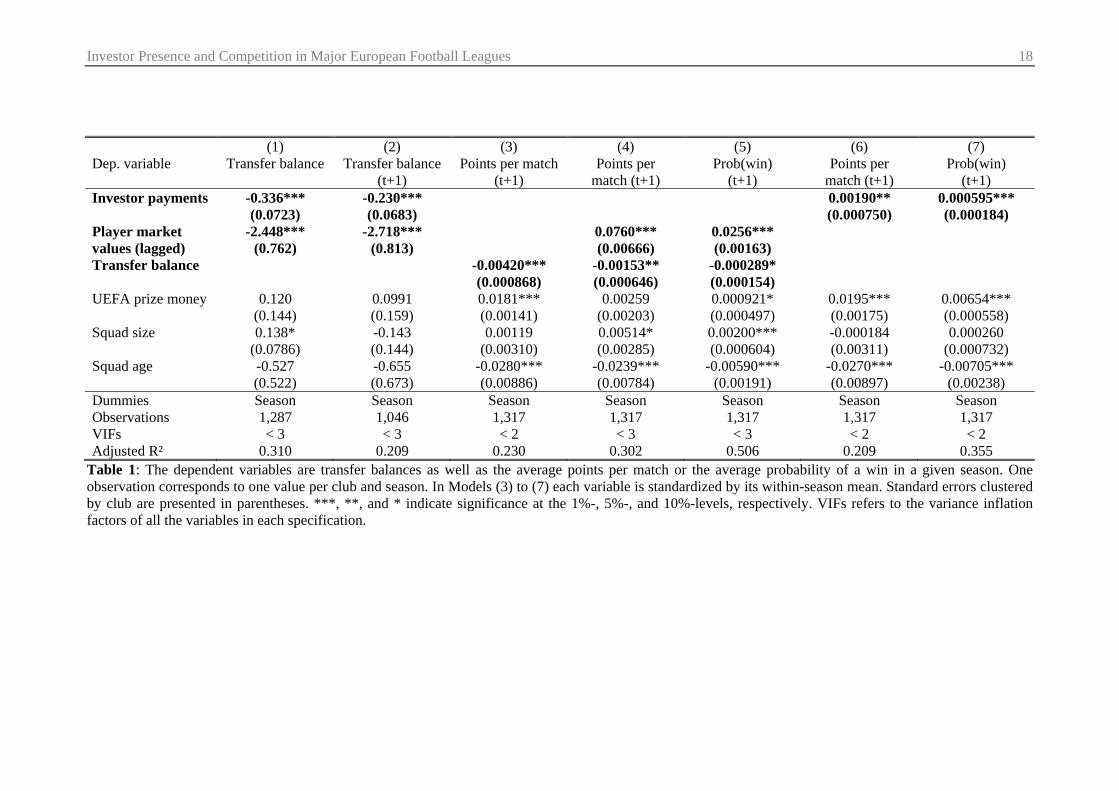
In Table 1, we examine whether investor payments are associated with greater success within national
football leagues. To this end, we proceed in two steps. First, we examine whether clubs that receive
investor payments increase the market values of their players through the purchase of additional
players. Therefore, we regress transfer balances on the amount of investor payments. The results can
be found in Models (1) and (2) of Table 1. In the table, one observation corresponds to one value per
club and season. Standard errors clustered by club are presented in parentheses. Based on more than
1,000 observations, we find that greater investor cash inflows are associated with more negative
transfer balances. In other words, the more money investors contribute to a given club, the more the
club invests into its players. The coefficient in Model (1) suggests that an increase in investor
payments by 1m€ is accompanied by a decrease in the transfer balance by 0.336m€. In unreported
results, we also find that an increase in investor payments by 1m€ is accompanied by an increase in
5 The English equivalent is www.transfermarkt.co.uk. 6 Gerhard, Mutz and Wagner (2014), for instance, show based on a sample 563 transfers during the 2012/2013 season that the correlation coefficient between player market values and actual transfer fees was 0.93.

Investor Presence and Competition in Major European Football Leagues 17
the average market value per player by 0.013m€. Thus, for an average squad size of 30 in the sample,
overall market value increases by 0.39m€, which is less than 50% of the original cash inflow. It hence
appears that not all cash inflows are invested into new players.7
Second, in Models (3) to (5), we regress Points per match and Prob(win), on the average player
market values (in m€) of a given club in a given season. Points per match is the average number of
points scored in a given season. Prob(win) is a team’s share of wins in a given season. As we are
interested in the abnormal performance of clubs with more valuable players and higher transfer
balances, we subtract within-season averages from each variable.8
The results in the table suggest that both (net) investments into new players and player market values
are positively related to team performance. In Model (3), the coefficient for Transfer balance is
statistically different from zero at the 1%-level. In addition, an (net) investment into new players by
about 20m€ (relative to the other teams in the league) results into 0.08 additional points per match or
about three points per season. The coefficients for abnormal player market values are statistically
different from zero at the 1%-level in Models (4) and (5). In terms of the magnitude of the
coefficients, an increase in the average player market value by 1m€ relative to the other teams in a
given league is associated with an increase in 0.08 points per match (Model (4) or about three points
per season, which is about 4% of the average number of points scored by the clubs in the dataset
(which is about 50). In addition, the acquisition of players also results in more points and wins per
season, as indicated by the negative coefficient for Transfer balance. The results are also robust to
lagging all independent variables by one period.
7 An alternative explanation could be that firms with investors spend money on underperforming players, resulting in lower market values compared to the original transfer fees. 8 The results remain qualitatively unchanged if we do not de-mean all the variables in the model.
Investor Presence and Competition in Major European Football Leagues 18
(1) (2) (3) (4) (5) (6) (7) Dep. variable Transfer balance Transfer balance
(t+1) Points per match
(t+1) Points per
match (t+1) Prob(win)
(t+1) Points per
match (t+1) Prob(win)
(t+1) Investor payments -0.336*** -0.230*** 0.00190** 0.000595*** (0.0723) (0.0683) (0.000750) (0.000184) Player market -2.448*** -2.718*** 0.0760*** 0.0256*** values (lagged) (0.762) (0.813) (0.00666) (0.00163) Transfer balance -0.00420*** -0.00153** -0.000289* (0.000868) (0.000646) (0.000154) UEFA prize money 0.120 0.0991 0.0181*** 0.00259 0.000921* 0.0195*** 0.00654*** (0.144) (0.159) (0.00141) (0.00203) (0.000497) (0.00175) (0.000558) Squad size 0.138* -0.143 0.00119 0.00514* 0.00200*** -0.000184 0.000260 (0.0786) (0.144) (0.00310) (0.00285) (0.000604) (0.00311) (0.000732) Squad age -0.527 -0.655 -0.0280*** -0.0239*** -0.00590*** -0.0270*** -0.00705*** (0.522) (0.673) (0.00886) (0.00784) (0.00191) (0.00897) (0.00238) Dummies Season Season Season Season Season Season Season Observations 1,287 1,046 1,317 1,317 1,317 1,317 1,317 VIFs < 3 < 3 < 2 < 3 < 3 < 2 < 2 Adjusted R² 0.310 0.209 0.230 0.302 0.506 0.209 0.355
Table 1: The dependent variables are transfer balances as well as the average points per match or the average probability of a win in a given season. One observation corresponds to one value per club and season. In Models (3) to (7) each variable is standardized by its within-season mean. Standard errors clustered by club are presented in parentheses. ***, **, and * indicate significance at the 1%-, 5%-, and 10%-levels, respectively. VIFs refers to the variance inflation factors of all the variables in each specification.

Investor Presence and Competition in Major European Football Leagues 19
Finally, in Models (6) and (7), we directly regress Points per match and Prob(win) on the amount of
(abnormal) investor payments. In doing so, we show that investor payments increase the success of the
football club. The coefficients in both models are statistically different from zero at the 5%- and 1%-
levels, respectively. The effect is also large in absolute terms. An increase in the investor cash flow by
100m€ relative to the other clubs in a given league is associated with an increase of about 7 points.
The table also reveals that clubs that received more UEFA prize money score more points per match
or are more likely to win. In contrast, teams with older players are less successful. Overall, we
conclude that clubs that receive investor payments are able to transform their cash inflows into more
points per match and a higher win probability. Thus, clubs with investor are on average more
successful than those without an investor. This, in turn, could affect within-league competition.
5.2 Investor presence and competition
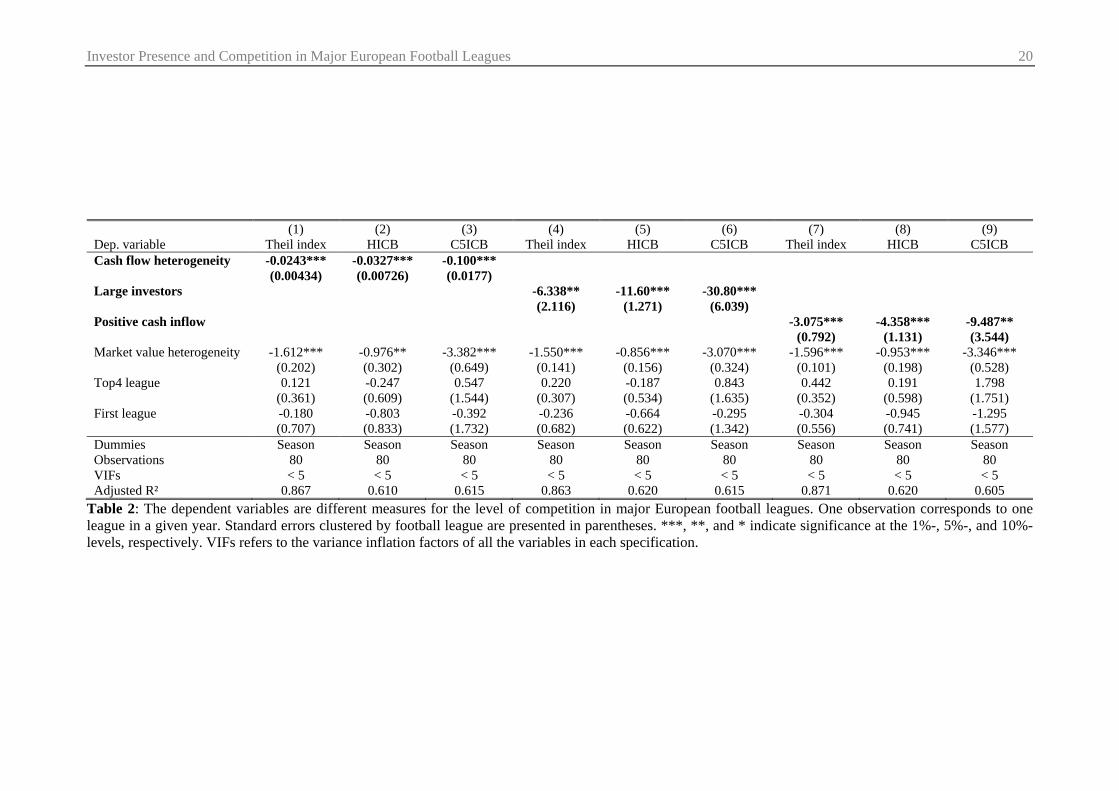
In Table 2, we examine whether investor presence is detrimental to competition in national football
leagues. To this end, we regress the three measures of competition on three measures of investor
presence. First, we employ Cash flow heterogeneity, defined as the standard deviation of investor cash
flows in a given league and season (in m€).9 Second, we calculate Large investors as the share of clubs
in a given league and season with an investor who cumulatively contributed more than 100m€ in the
past. Third, we rely on Positive cash inflow, which denotes the fraction of clubs with at least one
investor with an overall positive cash contribution to the club.
9 Due to inflation, the standard deviation of investor cash flows naturally rises over time. However, inflation rates are on average less than 2% during the sample period.
Investor Presence and Competition in Major European Football Leagues 20
(1) (2) (3) (4) (5) (6) (7) (8) (9) Dep. variable Theil index HICB C5ICB Theil index HICB C5ICB Theil index HICB C5ICB Cash flow heterogeneity -0.0243*** -0.0327*** -0.100*** (0.00434) (0.00726) (0.0177) Large investors -6.338** -11.60*** -30.80*** (2.116) (1.271) (6.039) Positive cash inflow -3.075*** -4.358*** -9.487** (0.792) (1.131) (3.544) Market value heterogeneity -1.612*** -0.976** -3.382*** -1.550*** -0.856*** -3.070*** -1.596*** -0.953*** -3.346*** (0.202) (0.302) (0.649) (0.141) (0.156) (0.324) (0.101) (0.198) (0.528) Top4 league 0.121 -0.247 0.547 0.220 -0.187 0.843 0.442 0.191 1.798 (0.361) (0.609) (1.544) (0.307) (0.534) (1.635) (0.352) (0.598) (1.751) First league -0.180 -0.803 -0.392 -0.236 -0.664 -0.295 -0.304 -0.945 -1.295 (0.707) (0.833) (1.732) (0.682) (0.622) (1.342) (0.556) (0.741) (1.577) Dummies Season Season Season Season Season Season Season Season Season Observations 80 80 80 80 80 80 80 80 80 VIFs < 5 < 5 < 5 < 5 < 5 < 5 < 5 < 5 < 5 Adjusted R² 0.867 0.610 0.615 0.863 0.620 0.615 0.871 0.620 0.605
Table 2: The dependent variables are different measures for the level of competition in major European football leagues. One observation corresponds to one league in a given year. Standard errors clustered by football league are presented in parentheses. ***, **, and * indicate significance at the 1%-, 5%-, and 10%-levels, respectively. VIFs refers to the variance inflation factors of all the variables in each specification.

Investor Presence and Competition in Major European Football Leagues 21
Overall, we find a strong negative relation between the three measures of investor presence and
competition. Most of the coefficients for the three investor measures are negative and statistically
different from zero at the 1%-level. In terms of economic significance, an increase in the share of
clubs with a large investor from 10 to 20% results in an increase in the relative share of the points of
best five clubs (C5ICB) by 2%.10 The results are also robust to lagging all independent variables by
one period, which might at least partly mitigate concerns about reverse causality.
In addition to that, we also observe a strong negative relation between player market values and
competition. Competition also seems to be lower in the first football leagues, although this association
is not statistically distinguishable from zero. When we drop both the investor variables and Market
value heterogeneity from the models (not shown in the table), the first league indicator variable turns
highly significant. Thus, it appears that the first leagues are more competitive, presumably due to more
unequal investor cash flows.
The results in Tables 1 and 2 suggest that investor payments can be interpreted as some sort of
exogenous competitive advantage that allows clubs to invest into players more heavily, thereby
improving their club performance and hence reducing competition. In contrast, traditional football
clubs that rely on classical sources of financing such as ticket revenues, the sale of television rights,
merchandising, prize money, or sponsoring are likely to fall behind.
5.3 Investor presence and international success
The results in the previous section suggest that investor payments to football clubs are likely to reduce
national competition. In this section, we examine whether investors also come along with some
benefits for national football associations. To this end, we regress measures of international success on
all our measures of competition and investor presence. We employ two empirical proxies for
international success: UEFA prize money, the amount of prize money awarded to all clubs in a given
10 Note that 2% likely corresponds to a lower bound for the effect of investor presence on competition because investor cash flow heterogeneity is also captured by player market value heterogeneity. This is because investor cash flows are used to invest into the squads (Table 1).

Investor Presence and Competition in Major European Football Leagues 22
league11 and season (in m€) as well as annual UEFA country coefficients, which denote annual country
coefficients as calculated by the UEFA. They capture the success of national football clubs in the
UEFA Champions League and the UEFA Europa League in a given season. The sum of the annual
coefficients over the last five years (the so-called UEFA coefficient) determines the number of clubs
that are allowed to participate in the UEFA Champions League and the UEFA Europa League in the
following year.
The results can be found in Tables 3 (dependent variable: UEFA prize money) and 4 (dependent
variable: UEFA country coefficient). In the tables, we restrict the sample to observations from the first
leagues, because clubs from the second leagues rarely compete internationally.
Overall, we find that reduced within-league competition, possibly due to investor presence, is strongly
negatively associated with both prize money awarded by the UEFA as well as annual UEFA
coefficients as most of the coefficients for the competition measures are statistically distinguishable
from zero. Furthermore, in the last three columns of both tables, we also show that investor presence
fosters international success. Again, the results are robust to lagging all independent variables by one
period. In terms of economic significance, for a decrease in the standardized relative share of the
points of best five clubs (C5ICB) by 5%, UEFA prize money decreases by 3m€ or 6% of the average
prize money per season (50m€). Alternatively, an increase in the share of clubs with a large investor
from 10 to 20% results in an increase in the annual UEFA prize money by 20%.
Thus, it appears that, although investors may be detrimental to national football league competition,
national football associations as well as their leagues can at least partly benefit from investor presence.
For example, higher UEFA scores will eventually result in a higher number of admittances to
international football tournaments. In addition, international success is likely to increase the overall
attractiveness of national football leagues, attracting more fans as well as better players and renowned
coaches.
11 Note that value the UEFA prize money also reflects partially the commercial value of the football club in the respective national television market. When FC Bayern München won the UEFA Champions League in 2013, the UEFA payouts to each of the two quarter finalists Juventus F.C. (Turin, Italy) and Paris Saint-Germain F.C. exceeded the amount paid to the champion from Germany.

Investor Presence and Competition in Major European Football Leagues 23
(1) (2) (3) (4) (5) (6) Dep. variable UEFA prize money UEFA prize money UEFA prize money UEFA prize money UEFA prize money UEFA prize money Theil index -8.602* (3.791) HICB -5.053** (1.517) C5ICB -1.883** (0.602) Cash flow heterogeneity 0.784*** (0.0733) Large investors 213.0*** (39.24) Positive cash inflow 84.00** (21.76) Market value 6.285 14.46* 13.37* 17.27*** 17.50*** 19.83*** heterogeneity (3.909) (5.470) (5.875) (3.242) (1.856) (3.632) Top4 league -4.263 -7.025 -3.665 4.066 2.089 -6.781 (8.628) (10.78) (9.008) (3.733) (7.547) (9.194) Dummies Season Season Season Season Season Season Observations 40 40 40 40 40 40 VIFs < 4 < 2 < 2 < 2 < 2 < 2 Adjusted R² 0.824 0.801 0.804 0.911 0.877 0.856
Table 3: The dependent variable is the amount of prize money awarded to a given league. One observation corresponds to one league in a given year. Only observations for highest leagues in a given country are considered in the regressions. Standard errors clustered by football league are presented in parentheses. ***, **, and * indicate significance at the 1%-, 5%-, and 10%-levels, respectively. VIFs refers to the variance inflation factors of all the variables in each specification.

Investor Presence and Competition in Major European Football Leagues 24
(1) (2) (3) (4) (5) (6) Dep. variable UEFA country
coefficient UEFA country
coefficient UEFA country
coefficient UEFA country
coefficient UEFA country
coefficient UEFA country
coefficient Theil index -0.803** (0.208) HICB -0.314 (0.197) C5ICB -0.0675 (0.0929) Cash flow heterogeneity 0.0225 (0.0209) Large investors 4.007 (5.784) Positive cash inflow 2.093 (2.444) Market value 1.040 2.045*** 2.122*** 2.327*** 2.306*** 2.328*** heterogeneity (0.566) (0.403) (0.367) (0.351) (0.349) (0.333) Top4 league -0.373 -0.585 -0.416 -0.212 -0.335 -0.509 (1.192) (1.339) (1.443) (1.505) (1.462) (1.276) Dummies Season Season Season Season Season Season Observations 45 45 45 45 45 45 VIFs < 4 < 2 < 3 < 2 < 2 < 2 Adjusted R² 0.681 0.634 0.619 0.627 0.616 0.620
Table 4: The dependent variable is the annual UEFA country coefficient. One observation corresponds to one league in a given year. Only observations for highest leagues in a given country are considered in the regressions. Standard errors clustered by football league are presented in parentheses. ***, **, and * indicate significance at the 1%-, 5%-, and 10%-levels, respectively. VIFs refers to the variance inflation factors of all the variables in each specification.

Investor Presence and Competition in Major European Football Leagues 25
6 Conclusion
In this paper, we present a hand-collected dataset on investor cash flows to more than 300 football
clubs in the first and second football leagues in five European countries (England, France, Germany,
Italy, and Spain) throughout the 2004/2005 to 2013/2014 seasons. We find that football clubs that
receive investor cash flows are able to increase the market values of their squads and thereby arrive at
more points per match and a higher win probability. Thus, clubs with investor are on average more
successful than those without an investor. Thereby, they reduce competition within national football
leagues. The main finding remains robust to controlling for several other variables such as player
market value heterogeneity and season fixed effects as well as lagging the independent variables by
one season. However, investor presence also results in greater international success of the respective
football leagues as approximated by UEFA prize money and UEFA country coefficients.
The findings of this paper suggest that there is a trade-off between national competition and
international success of major European football leagues. While investor presence is detrimental to
competition within national football leagues on the one hand, it also results in greater international
success on the other hand. Due to the increasing importance of the Champions League (and the UEFA
Europa League), it may well be that investor cash flows to football clubs become even more prevalent
in the future, since without having an investor, it might be increasingly difficult to compete
internationally. In addition, just recently, the UEFA changed its financial fair play regulation so that
footballs clubs may now attract investors more easily. UEFA officials argue that this step will actually
foster competition, because previous financial fair play legislation is deemed to protect large clubs
with high sales (e.g., Manchester United FC or FC Bayern München). Thereby, financial fair play
rules may have also beenviolating European Union antitrust laws (e.g., Kaplan, 2015). However, our
findings suggest that softened UEFA fair play regulations are likely to reduce competition within
national football leagues.
In light of these developments, national football associations may be well advised to search for
alternative ways of maintaining or improving both the attractiveness as well as the international
competitiveness of their respective leagues. For example, they could try to increase the overall value

Investor Presence and Competition in Major European Football Leagues 26
of television rights by spreading football games over more match days (e.g., as it is done in the
Premier League). Thereby, national football clubs could benefit from additional cash inflows, which
would make them more competitive internationally. At the same time, national football associations
could impose restrictions on investor cash flows or redesign the distribution of money (e.g., television
rights) within national leagues, thereby increasing competition at the national level. In addition,
football clubs might want to look for additional sources of revenue, for example by entering new
markets. For instance, during these days, some of the most prominent European football clubs are
touring Asia or the US. In a similar vein, clubs might also participate in additional tournaments
organized by sponsors such as the Audi Cup hosted by FC Bayern München or the Emirates Cup
hosted by Arsenal F.C.
Investor Presence and Competition in Major European Football Leagues 27
References
Bloching, B., Pawlowski, T., 2013. How exciting are the major European football leagues? Roland Berger Strategy Consultants Studien.
Czarnitzki, D., Stadtmann, G., 1999. Uncertainty of outcome versus reputation: Empirical evidence for the first German football division. ZEW Diskussionspapiere.
Depken, C. A., 1999. Free agency and the competitiveness of Major League Baseball. Review of Industrial Organization, 14, p. 205-217.
Fort, R., Quirk, J., 2004. Owner objectives and competitive balance. Journal of Sports Economics 5, p. 20-32.
Gerhards, J., Mutz, M., Wagner, G., 2014. Die Berechnung des Siegers: Marktwert, Ungleichheit, Diversität und Routine als Einflussfaktoren auf die Leistung professioneller Fußballteams. Zeitschrift für Soziologie 42, p. 231-250.
Goossens, K., 2006. Competitive balance in European football: Comparison by adapting measures: National measure of seasonal imbalance and Top 3. Rivista di Diritto ed Economia dello Sport 2, p. 77-122.
Hassan, D., Hamil, S., 2013. Who owns Football? Models of football governance and management in international sport. Routledge Chapman & Hall, Abingdon, Oxfordshire.
Hirschman, A. O., 1964. The paternity of an index. American Economic Review, 54, 761.
Kaplan, V., 2015. UEFA financial fairplay regulations and European Union antitrust law complications 29, p. 799-857.
Michie, J., Oughton, C., 2004. Competitive balance in football: Trends and effects. Working Paper.
Pawlowski, T., 2013. Wettbewerbsintensität im Fußball: Eine empirische Untersuchung zur Bedeutung für die Zuschauer. Springer Fachmedien, Wiesbaden.
Pope, P., Peel, D., 1989. Information, prices and efficiency in a fixed-odds betting market. Economica 56, p. 323-341.
Teichmann, K., 2007. Strategie und Erfolg von Fußballunternehmen. Deutscher Universitäts-Verlag, Wiesbaden.
Theil, H., 1967. Economics and information theory. North Holland, Amsterdam.