investor presentation 31 march 2016 results - adibadib.ae/en/siteassets/2016...
TRANSCRIPT
ADIB © 2010
Investor Presentation
31 March 2016 results
Abu Dhabi: April 2016
adib.ae

2
Agenda
Introduction
Financial Review
Business Review
Appendix
3
ADIB at a glance
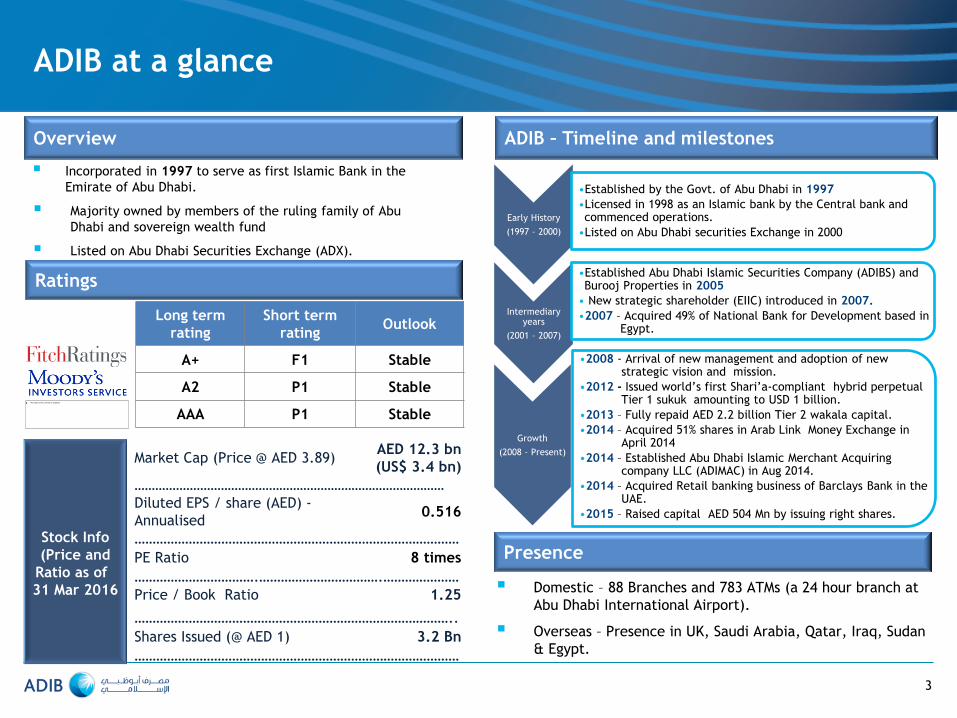
Incorporated in 1997 to serve as first Islamic Bank in the
Emirate of Abu Dhabi.
Majority owned by members of the ruling family of Abu
Dhabi and sovereign wealth fund
Listed on Abu Dhabi Securities Exchange (ADX).
Overview
Ratings
Long term
rating
Short term
rating Outlook
A+ F1 Stable
A2 P1 Stable
AAA P1 Stable
ADIB – Timeline and milestones
Stock Info
(Price and
Ratio as of
31 Mar 2016
Market Cap (Price @ AED 3.89) AED 12.3 bn
(US$ 3.4 bn)
………………………………………………………………………………
Diluted EPS / share (AED) -
Annualised 0.516
………………………………………………………………………………
PE Ratio 8 times
…………………………….…………………………….…………………
Price / Book Ratio 1.25
……………………………………………………………………………..
Shares Issued (@ AED 1) 3.2 Bn
………………………………………………………………………………
Presence
Domestic – 88 Branches and 783 ATMs (a 24 hour branch at
Abu Dhabi International Airport).
Overseas – Presence in UK, Saudi Arabia, Qatar, Iraq, Sudan
& Egypt.
Early History
(1997 – 2000)
•Established by the Govt. of Abu Dhabi in 1997
•Licensed in 1998 as an Islamic bank by the Central bank and commenced operations.
•Listed on Abu Dhabi securities Exchange in 2000
Intermediary years
(2001 – 2007)
•Established Abu Dhabi Islamic Securities Company (ADIBS) and Burooj Properties in 2005
• New strategic shareholder (EIIC) introduced in 2007.
•2007 – Acquired 49% of National Bank for Development based in Egypt.
Growth
(2008 – Present)
•2008 - Arrival of new management and adoption of new strategic vision and mission.
•2012 - Issued world’s first Shari’a-compliant hybrid perpetual Tier 1 sukuk amounting to USD 1 billion.
•2013 – Fully repaid AED 2.2 billion Tier 2 wakala capital.
•2014 – Acquired 51% shares in Arab Link Money Exchange in April 2014
•2014 – Established Abu Dhabi Islamic Merchant Acquiring company LLC (ADIMAC) in Aug 2014.
•2014 – Acquired Retail banking business of Barclays Bank in the UAE.
•2015 – Raised capital AED 504 Mn by issuing right shares.

ADIB Ownership
ADIB is mainly owned by over 46,000 UAE nationals and
companies.
The Bank’s main shareholder is National Holding via EIIC, which is
a private holding company, wholly-owned by members of the Abu
Dhabi Royal Family.
ADIB enjoys strong Abu Dhabi support in the form of royal family,
sovereign wealth fund, Pension and Government shareholding and
capital participants.
EIIC: 40.4%
Abu Dhabi Investment Council: 7.6%
General Pension and Social Security: 1.2%
Others: 41.6%
Other members and associates of the Abu Dhabi Royal family:
9.2%
4
Ownership & Corporate Structure
Subsidiaries Associates and Joint ventures
ADIB UK Limited (100%) was established to offer
banking services to HNWI established in 2012.
Abu Dhabi Islamic Securities Company (95%) is a
brokerage firm established in 2005.
MPM Properties LLC (100%) is a property
management firm established in 2005.
Burooj Properties (100%) is a real estate company
established in 2005.
Kawader Services Company (100%) is a recruitment
company, dedicated solely to ADIB.
ADIB Egypt (49%) provides banking services in Egypt.
Saudi Finance Company (SFC) (51%) is a retail finance
company working in Saudi Arabia, acquired in 2012.
Abu Dhabi Islamic Merchant Acquiring Company LLC
(51%) is a merchant acquiring company established in
2014.
Arab link (51%) is a Currency exchange house, acquired
in 2014.
Bosna Bank International (27%) is an Islamic bank based
in Bosnia.
Abu Dhabi National Takaful (42%) offers insurance
services.

Strong and Influential
Shareholder Robust
Financial Health and Liquidity
Steady Growth
Strong and Established
Brand
Customer Service
Extensive Distribution
Network Experienced Management
Innovative Products and
Services
Independent Risk
Management
Conservative Provisioning
Policies
Transparency &
Best Practice
4th Largest Islamic Bank Globally by
Assets
5
Key Strengths
Fastest growing major Islamic Bank
A leader in governance
& disclosure
Strong customer solution orientation
Inline with global banks
Global best practice in
regard to NPA policy
Extensive international experience with leading regional and global banks
88 branches, 783 ATMs, 890,000+ customers
Ranked 1st in UAE in terms of
service quality, 4th year in a row
Growth from Mar 2012 to Mar
2016: 56% in total assets,
58% in customer financing
and 67% in deposits
Sustained growth in profits; consistently
one of the most liquid banks in UAE
Majority owned by members of the ruling family of Abu Dhabi and
sovereign wealth fund
We represent “Banking
as it should be”
2,243
ADIB Other Banks
Assets 2,362 119
Deposits 1,471 96 1,375
Financing 1,403 78 1,325
80
74
187
305
588
675
6
UAE Banking Sector
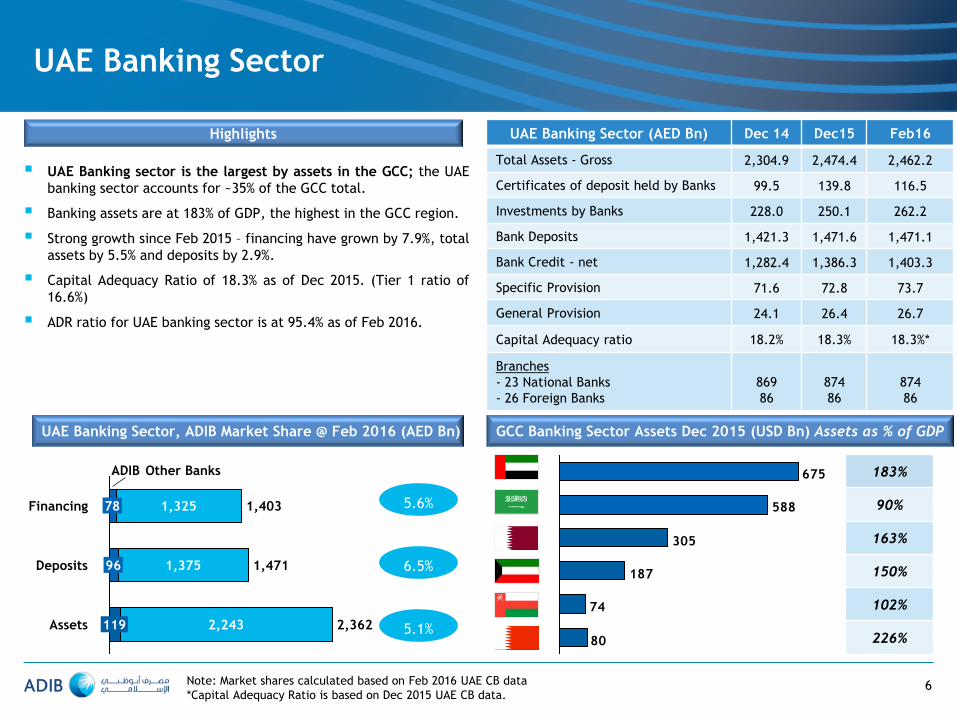
UAE Banking sector is the largest by assets in the GCC; the UAE
banking sector accounts for ~35% of the GCC total.
Banking assets are at 183% of GDP, the highest in the GCC region.
Strong growth since Feb 2015 – financing have grown by 7.9%, total
assets by 5.5% and deposits by 2.9%.
Capital Adequacy Ratio of 18.3% as of Dec 2015. (Tier 1 ratio of
16.6%)
ADR ratio for UAE banking sector is at 95.4% as of Feb 2016.
Highlights
UAE Banking Sector, ADIB Market Share @ Feb 2016 (AED Bn) GCC Banking Sector Assets Dec 2015 (USD Bn) Assets as % of GDP
UAE Banking Sector (AED Bn) Dec 14 Dec15 Feb16
Total Assets - Gross 2,304.9 2,474.4 2,462.2
Certificates of deposit held by Banks 99.5 139.8 116.5
Investments by Banks 228.0 250.1 262.2
Bank Deposits 1,421.3 1,471.6 1,471.1
Bank Credit - net 1,282.4 1,386.3 1,403.3
Specific Provision 71.6 72.8 73.7
General Provision 24.1 26.4 26.7
Capital Adequacy ratio 18.2% 18.3% 18.3%*
Branches
- 23 National Banks
- 26 Foreign Banks
869
86
874
86
874
86
183%
90%
163%
150%
102%
226%
5.6%
6.5%
5.1%
Note: Market shares calculated based on Feb 2016 UAE CB data
*Capital Adequacy Ratio is based on Dec 2015 UAE CB data.

Financial Snapshot (1/2)
7
Total Assets (AED Bn)
118.4111.9103.2
86.174.3
+12%
2015 2014 2013 2012 2011
Net Customer Financing (AED Bn)
78.473.0
61.751.248.8
+13%
2015 2014 2013 2012 2011
Customer Deposits (AED Bn)
94.984.8
75.561.355.2
2012 2011
+15%
2015 2014 2013
Equity (AED Bn)
15.113.713.112.7
8.6
+15%
2015 2014 2013 2012 2011
Revenues (AED Mn)
+11%
2015
5,134.8
2014
4,583.0
2013
3,931.3
2012
3,565.6
2011
3,425.8
Net Profit (AED Mn)
1,934.01,750.7
1,450.2
1,201.21,155.1
2013 2012 2011
+14%
2015 2014

2011 2012 2013 2014 2015
18.7% 18.4%
15.5% 15.6% 16.3%
2011 2012 2013 2014 2015
82.6% 86.1%
81.8%
83.5%
88.5%
2011 2012 2013 2014 2015
84.6% 86.5%
77.9%
75.7%
83.4%
2011 2012 2013 2014 2015
111.4%
95.6%
79.8%
69.6% 66.8%
Total Provision coverage ratio - Impaired only *
2011 2012 2013 2014 2015
14.6%
15.1%
13.9%
14.4% 16.4%
16.9%
18.4%
21.4%
13.5%
17.4%
Total CAR Tier 1
2011 2012 2013 2014 2015
3.9% 4.4%
8.3%
10.4%
11.5%
Total Non performing ratio
Financial Snapshot (2/2)
8
Return on Avg Shareholders’ Equity (%) Financing to Deposits Ratio (%) Advances to Stable Funds Ratio (%)
CAR (%) Provision Coverage (%) Non – Performing Ratio (%)
• Total Provision coverage ratio is defined as “total provision / impaired NPAs”.
• Return on Average shareholders’ equity calculation excludes Tier 1 payments from net income and non-controlling interest &Tier 1 sukuk
from equity balance.

9
Agenda
Introduction
Financial Review
Business Review
Appendix
482477451
+7%
Q1 16 Q4 15 Q1 15
Net Profit
1,3171,372
1,224
+8%
Q1 16 Q4 15 Q1 15
Revenues
4.4%
Q1 16 Q4 15
4.4%
Q3 15
4.3%
Q2 15
4.2% 4.3%
Q1 15
Net profit margin
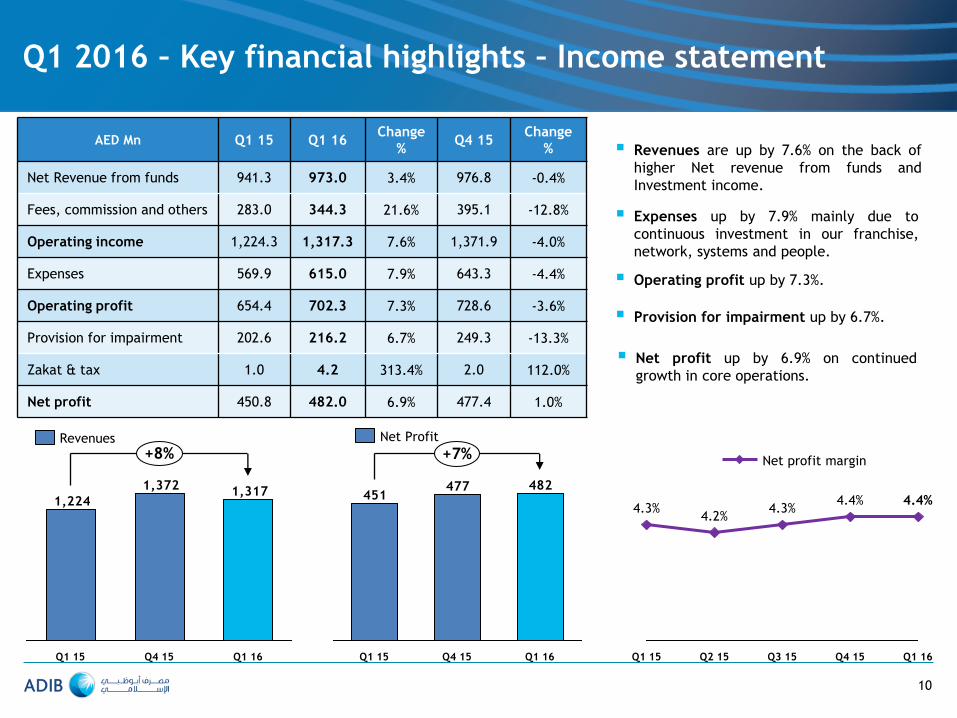
Q1 2016 – Key financial highlights – Income statement
AED Mn Q1 15 Q1 16 Change
% Q4 15
Change
%
Net Revenue from funds 941.3 973.0 3.4% 976.8 -0.4%
Fees, commission and others 283.0 344.3 21.6% 395.1 -12.8%
Operating income 1,224.3 1,317.3 7.6% 1,371.9 -4.0%
Expenses 569.9 615.0 7.9% 643.3 -4.4%
Operating profit 654.4 702.3 7.3% 728.6 -3.6%
Provision for impairment 202.6 216.2 6.7% 249.3 -13.3%
Zakat & tax 1.0 4.2 313.4% 2.0 112.0%
Net profit 450.8 482.0 6.9% 477.4 1.0%
Revenues are up by 7.6% on the back of
higher Net revenue from funds and
Investment income.
Expenses up by 7.9% mainly due to
continuous investment in our franchise,
network, systems and people.
Provision for impairment up by 6.7%.
Net profit up by 6.9% on continued
growth in core operations.
Operating profit up by 7.3%.
10
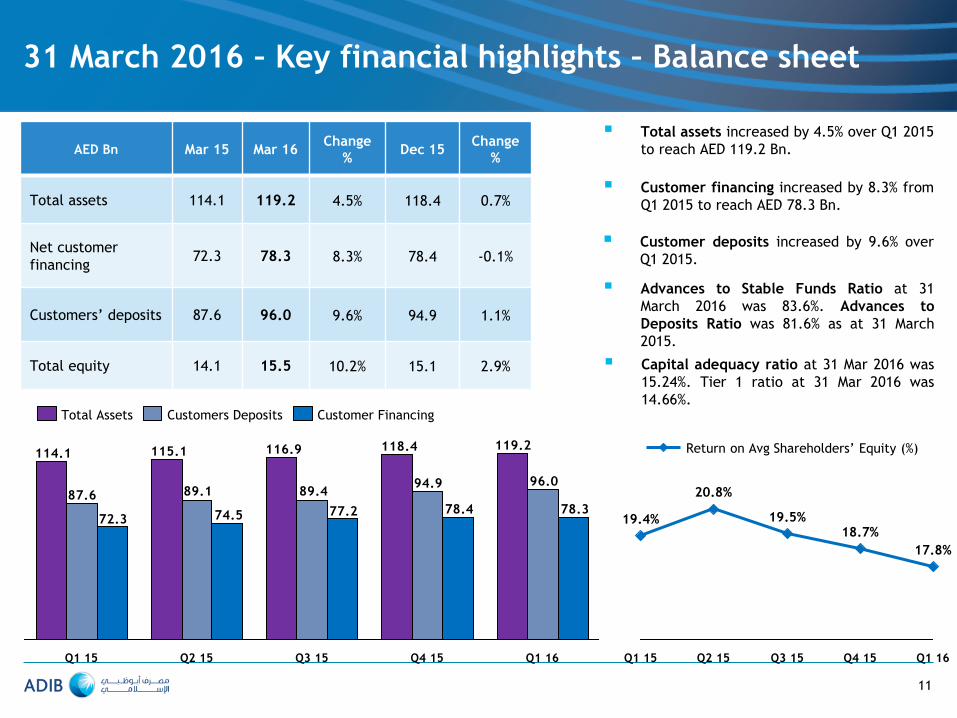
31 March 2016 – Key financial highlights – Balance sheet
Total assets increased by 4.5% over Q1 2015
to reach AED 119.2 Bn.
Customer financing increased by 8.3% from
Q1 2015 to reach AED 78.3 Bn.
Capital adequacy ratio at 31 Mar 2016 was
15.24%. Tier 1 ratio at 31 Mar 2016 was
14.66%.
Customer deposits increased by 9.6% over
Q1 2015.
11
119.2118.4116.9115.1114.1
96.094.989.489.187.6
78.378.477.274.572.3
Q1 16 Q4 15 Q3 15 Q2 15 Q1 15
Customers Deposits Total Assets Customer Financing
17.8%
18.7%
Q4 15 Q3 15 Q1 16
19.5%
Q2 15
20.8%
Q1 15
19.4%
Return on Avg Shareholders’ Equity (%)
Advances to Stable Funds Ratio at 31
March 2016 was 83.6%. Advances to
Deposits Ratio was 81.6% as at 31 March
2015.
AED Bn Mar 15 Mar 16 Change
% Dec 15
Change
%
Total assets 114.1 119.2 4.5% 118.4 0.7%
Net customer
financing 72.3 78.3 8.3% 78.4 -0.1%
Customers’ deposits 87.6 96.0 9.6% 94.9 1.1%
Total equity 14.1 15.5 10.2% 15.1 2.9%

12
Key ratios
Ratios Mar 2015 Mar 2016
Efficiency
Diluted Earnings per share (EPS in AED) 0.147 0.152
Return on Average Shareholders’ Equity
(excluding - Tier 1 capital) 19.4% 17.8%
Net profit margin (%) 4.3% 4.4%
Cost / income ratio 46.5% 46.7%
Liquidity
Percentage lent (Financing / Total Assets) 63.4% 65.7%
Financing to Deposits ratio 82.6% 81.6%
Advances to Stable funds ratio 82.2% 83.6%
Liquid Assets to Total Assets ratio 23.6% 19.3%
Solvency
Capital Adequacy 14.7% 15.2%
Tier -1 ratio 14.2% 14.7%
Leverage ratio (Assets / Equity) 810% 768%
Asset Quality
Non – performing ratio (Impaired NPA / Gross Financing) 3.7% 3.4%
Total provision coverage (Total provisions / Impaired NPA) 102.0% 112.6%
Specific provision coverage (Specific provisions / Impaired NPA) 38.3% 38.0%
Total provisions / Gross Customer Financing 3.7% 3.8%

0.9%
5.1%
Q4 15
4.4%
1.0%
5.1%
Q3 15
4.3%
1.0%
5.0%
Q2 15
4.2%
0.9%
4.9%
Q1 15
4.3%
0.9%
5.0%
Q1 16
4.4%
Net profit margin
Yield on profit bearing liabilities
Yield on profit earning assets
+8%
Q1 16
1,317
74%
26%
Q4 15
1,372
71%
29%
Q1 15
1,224
77%
23%
Net revenue from funds
Fees, commission and others
Operating Performance – Net profit income
Evolution of Yields (%)
Revenues (AED Mn) Highlights (Q1 2016 vs. Q1 2015)
Revenues, up by 8% at AED 1,317
Mn.
Net revenue from Funds (NRFF) 3%
higher, primarily driven by 2.3%
increase in customer financing
revenues and drop in funding cost
by 4.3%.
Net profit margin increased to 4.4%
in Q1 2016 from 4.3% in Q1 2015.
Non –NRFF income up by 21%.
Non-NRFF based income constitute
26% of total revenue vs. 23% last
year.
13
+3%
Q1 16
973
-151
1,124
Q4 15
977
-151
1,128
Q1 16
941
-158
1,099
Net Revenue from Funds (AED Mn)
32 -5 1,317
82
1,224
Inv.
Income
& others
NRRF Fees &
Comm
Q1 16
-15
Q1 15 FX
Key movements in Revenues (AED Mn)
Profit paid on funds Revenue from funds
Q1 16
344
207
160
-24
Q4 15
395
244
115
36
Q1 15
283
223
79
-18
+21%
Fees & Commission
Investment income & others
FX
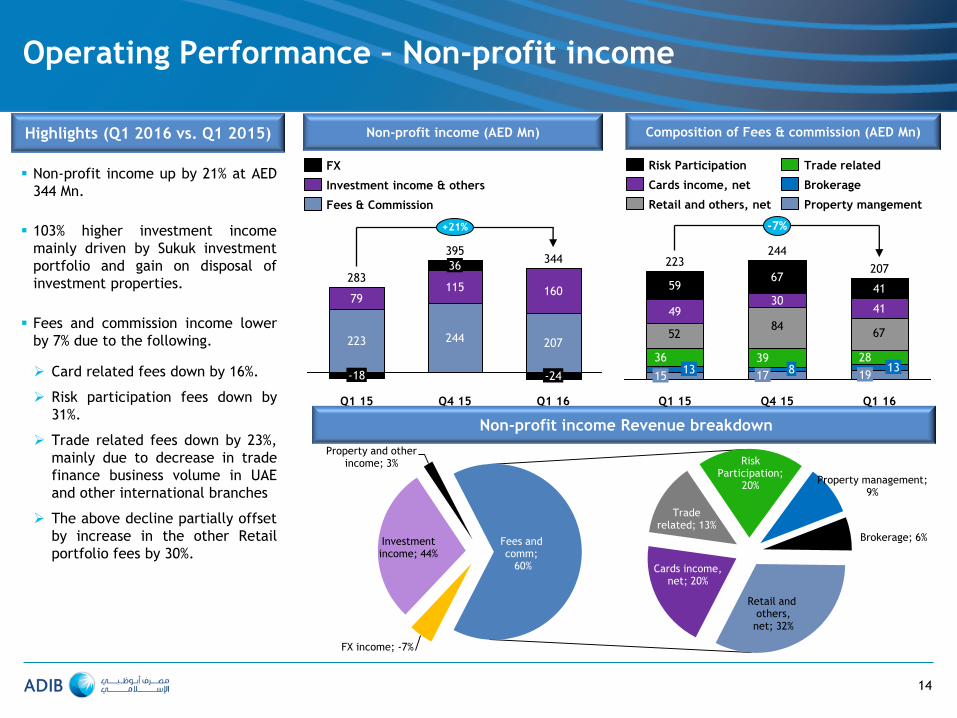
Operating Performance – Non-profit income
Non-profit income (AED Mn)
Non-profit income Revenue breakdown
Highlights (Q1 2016 vs. Q1 2015)
Non-profit income up by 21% at AED
344 Mn.
103% higher investment income
mainly driven by Sukuk investment
portfolio and gain on disposal of
investment properties.
Fees and commission income lower
by 7% due to the following.
Card related fees down by 16%.
Risk participation fees down by
31%.
Trade related fees down by 23%,
mainly due to decrease in trade
finance business volume in UAE
and other international branches
The above decline partially offset
by increase in the other Retail
portfolio fees by 30%.
14
FX income; -7%
Investment income; 44%
Property and other income; 3%
Cards income, net; 20%
Trade related; 13%
Risk Participation;
20% Property management;
9%
Brokerage; 6%
Retail and others, net; 32%
Fees and comm; 60%
5284
67
207
19
Q1 16
-7%
13 39 28
223
30
13
41
8
41
67
Q4 15
244
17
Q1 15
36
15
49
59
Brokerage
Property mangement
Risk Participation Trade related
Retail and others, net
Cards income, net
Composition of Fees & commission (AED Mn)
Cash & bal with
central banks: 16.1%
Due from FIs: 3.2%
Customer financing:
65.7%
Investments:
8.2% Fixed assets & Other Assets: 6.7%
31 Mar 2016 – AED 119.2 Bn
15
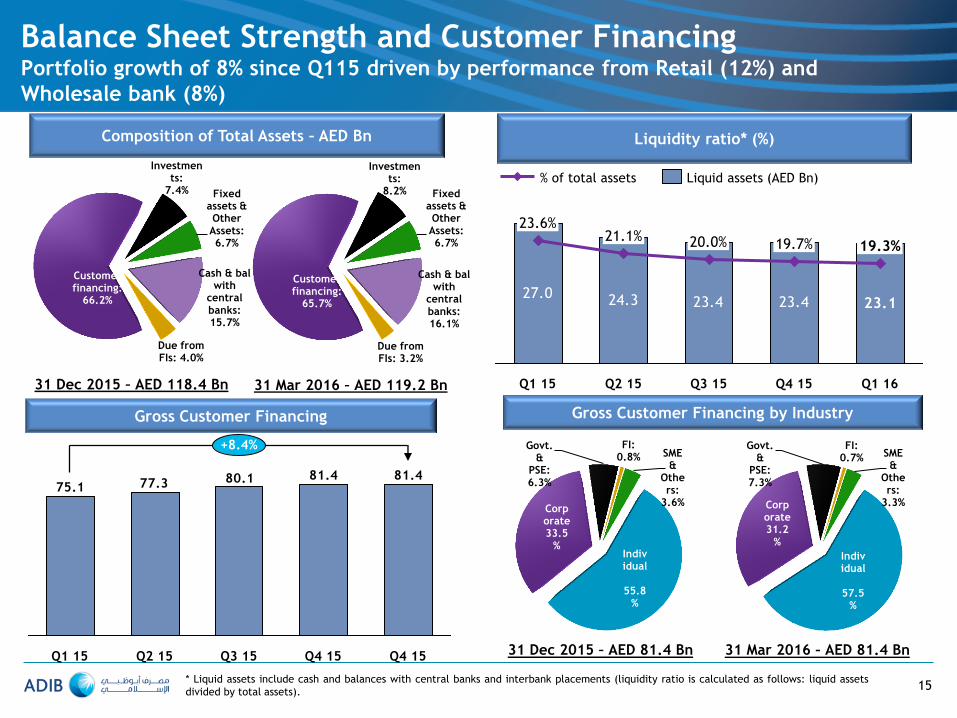
Balance Sheet Strength and Customer Financing Portfolio growth of 8% since Q115 driven by performance from Retail (12%) and
Wholesale bank (8%)
Composition of Total Assets – AED Bn Liquidity ratio* (%)
Gross Customer Financing Gross Customer Financing by Industry
Individual
55.8
%
Corporate 33.5
%
Govt. &
PSE: 6.3%
FI: 0.8% SME
& Others:
3.6%
31 Dec 2015 – AED 81.4 Bn
27.0 24.3 23.4 23.4 23.1
23.6%
Q1 16
19.3%
Q4 15
19.7%
Q3 15
20.0%
Q2 15
21.1%
Q1 15
% of total assets Liquid assets (AED Bn)
81.481.480.177.375.1
Q4 15 Q4 15 Q3 15 Q2 15 Q1 15
+8.4%
* Liquid assets include cash and balances with central banks and interbank placements (liquidity ratio is calculated as follows: liquid assets
divided by total assets).
Cash & bal with
central banks: 15.7%
Due from FIs: 4.0%
Customer financing:
66.2%
Investments:
7.4% Fixed assets & Other Assets: 6.7%
31 Dec 2015 – AED 118.4 Bn
31 Mar 2016 – AED 81.4 Bn
Individual
57.5
%
Corporate 31.2
%
Govt. &
PSE: 7.3%
FI: 0.7% SME
& Others:
3.3%

16
Funding Profile Strong ADR ratio of 81.6% on the back of 10% growth in Deposits
Customers’ Deposits by Segment (AED Bn) Customers’ Deposits by Type (AED Bn)
Composition of Liabilities (AED Bn)
Q1 16
96.0
59.2%
33.0%
7.8%
Q4 15
94.9
56.6%
35.7%
7.7%
Q3 15
89.4
58.0%
33.3%
8.7%
Q2 15
89.1
57.6%
33.1%
9.2%
Q1 15
87.6
54.8%
36.2%
9.0%
+9.6%
Retail Wholesale Private
7.3
33.9
53.7
7.5
31.9
45.4
Net Customer Financing & Customers’ Deposits (AED Bn)
2.53.1
4.63.94.3
1.81.8
4.64.6
4.6
3.4
3.63.73.5
3.3
Q1 16
103.7
96.0
Q4 15
103.3
94.9
Q3 15
102.2
89.4
Q2 15
101.4
89.1
Q1 15
100.0
87.6
Depositors’ accounts
Due to FI
Sukuk
Other Liabilities
58.9 57.7 60.2 64.4
28.7 31.4 29.230.5 31.0
65.0
Q1 16
96.0
Q4 15
94.9
Q3 15
89.4
Q2 15
89.1
Q1 15
87.6
Investment Deposits Current account
78.378.477.274.572.3
96.094.989.489.187.6
Q1 16
83.6%
81.6%
Q4 15
84.6%
82.6%
Q3 15
88.3%
86.4%
Q2 15
87.0%
83.7%
Q1 15
82.2%
82.6%
Adavnces to Stable funds ratio Customers Deposits
Fin to Dep ratio Customer Financing

Total NPAs increased by AED 88 Mn during Q1 2016 to reach AED 3,223
Mn (31 Dec 15: AED 3,135 Mn).
Impaired NPAs ratio at 3.4% as at 31 Mar 2016 (3.3% at end Q4 2015)
with coverage improving to 112.6% (31 Dec 2015: 111.4%).
Collective provisions of AED 2,053 Mn at end of Q1 2016 represents
2.30% of total Credit RWAs (31 Dec 2015: 2.30%).
Individual provisions of AED 1,044 Mn at 38.0% of impaired NPAs at
end of Q1 2016 (31 Dec 2015: 36.5%).
Total provisions of AED 3,097 Mn (net of write-off of AED 2,691 Mn),
represents 3.80% (31 Dec 2015: 3.68%) of Gross Financing portfolio.
17
Asset quality – Customer financing only Total Impaired NPAs now represent 3.4% of gross customer financing with coverage ratio
of 112.6%
Key points Impairment charge – Customer financing (AED Mn)
Provisions and NPAs – Customer financing (AED Mn) NPA ratio and provision coverage ratio
Q1 16
4.0%
112.6%
3.4%
0.6%
Q4 15
3.9%
111.4%
3.3%
0.5%
Q1 15
4.2%
102.0%
3.7% 0.5%
Q4 14
4.4%
95.6%
3.8% 0.6%
Q4 13
8.3%
79.8%
6.5%
1.8%
Q4 12
10.4%
69.6%
8.2%
2.2%
Total Provision coverage ratio - Impaired only *
NPA ratio - Impaired
NPA ratio - Not Impaired
• Note: Total Provision coverage ratio is defined as “total provision / impaired NPAs”.
2,7532,882
4,2094,4533,2233,1353,1433,309
5,3795,665
2,688
Q1 15
5,011
1,754
Q1 16
5,788
2,053
1,044
2,691
2,750
Q4 15
5,581
2,014
981
2,586
1,055
2,203
Q4 14
4,811
1,676
1,078
2,057
Q4 13
4,179
924
2,437
818
Q4 12
3,615
816
2,282
517
Collective / General
Individual / Specific
Write-off
NPAs - Total
NPAs - impaired
78
122
207
Q1 16
169
38
Q4 15
211
47
163
Q3 15
184
139
45
Q2 15
176
123
52
Q1 15
200
Collective / General Individual / Specific

18
Capital
Basel II Total Capital Adequacy ratio at end of Mar
2016 at 15.24% well above the regulatory
requirement of 12% (31 Mar 15: 14.74%).
Basel II Tier I ratio at 14.66% at the end of Mar 2016
well above the regulatory requirement of 8%
(31 Mar 15: 14.25%).
During Q3 2015, raised AED 504 million of new
common equity capital via right issue of 168 million
ordinary shares @ AED 3 per share.
Capital Adequacy (%) Capital base – CET, Tier 1 and Tier 2 - AED Bn
Q4 15
14.6%
15.1%
Q3 15
14.1%
14.7%
Q2 15
13.5%
14.0%
Q1 15
14.3%
14.7%
Q1 16
15.2%
14.7%
Tier 1 Total CAR
Highlights Total CAR and RWA
7.57.5
7.5 7.58.5
2.42.4
Q4 15
97.5
87.7
2.2
15.1%
Q3 15
98.1
88.2
14.7%
Q2 15
95.4
85.4
14.0%
Q1 15
92.7
83.0
2.2
14.7%
Q1 16
15.2%
100.2
89.1
2.5
Credit risk Operational risk Market risk Total CAR
7.8 7.4 8.4 8.8 9.2
5.4 5.45.4 5.5 5.5
Q4 15
14.8
0.5
Q3 15
14.4
0.6
Q2 15
13.4
0.5
Q1 15
13.7
0.5
Q1 16
15.3
0.6
CET Tier 1 Tier 2

19
Agenda
Introduction
Financial Review
Business Review
Appendix

20
ADIB Strategy
Build Market Leadership within the UAE
• The key customer service sectors are
Personal Banking, Business Banking,
Wholesale Banking, Private Banking and
Community Banking supported by
Cards, Treasury, Corporate Finance and
Investment Banking, Wealth
Management and Transaction Banking.
• ADIB’s retail presence will continue to
build towards market leadership.
• At the heart of ADIB’s customer-centric
approach is a Bank-wide focus on
customer service excellence.
Create an Integrated Financial Services Group
• ADIB continues to build a diversified
Islamic financial services model.
• Currently ADIB provides customers
access to brokerage (through ADIB
Securities),Takaful insurance (through
Abu Dhabi National Takaful Company)
and Real Estate Management (through
MPM) and is building its merchant
acquiring and foreign exchange business
propositions.
Pursue International Growth Opportunities
• With the growing acceptance of Islamic
banking worldwide, ADIB is increasingly
turning its attention to replicating its
business model through systematic
geographic expansion.
• ADIB’s international expansion began in
Egypt with the acquisition via a joint
venture structure of National Bank of
Development followed by the
establishment of Iraq, UK, Saudi Arabia
operations and will continue with the
new operations in Qatar and Sudan.
• ADIB is also in the process of applying
for banking licenses in a range of other
countries.
To become a top tier regional bank
Providing Islamic financial solutions for everyone
by
Simple & Sensible Transparency Mutual Benefit Hospitality &
Tolerance Shari’a Inspired

Retail; 42%
Wholesale; 28%
Private; 2%
Capital Markets;
17%
Real Estate;
2%
Others; 9%
Retail; 49%
Wholesale; 30%
Private; 3%
Capital Markets; 14%
Real Estate;
0% Others;
4%
21
Business unit contribution
Composition of Total Assets – AED Bn Composition of Total Liabilities – AED Bn
Composition of Net profit – AED Mn Composition of Revenues – AED Mn
31 Mar 2015 – AED 100.0 Bn
Retail; 56%
Wholesale; 25%
Private; 3%
Capital Markets; 12%
Real Estate;
0%
Others; 4%
31 Mar 2016 – AED 103.7 Bn
Retail; 45%
Wholesale; 29%
Private; 3%
Capital Markets;
14%
Real Estate;
2%
Others; 7%
31 Mar 2015 – AED 114.1 Bn 31 Mar 2016 – AED 119.2 Bn
Retail; 61%
Wholesale; 27%
Private; 2%
Capital Markets
;7%
Real Estate;
2%
Others; 1%
Retail; 62% Wholesal
e; 23%
Private; 2%
Capital Markets;
14%
Real Estate;
2%
Others; -3%
Q1 2015 – AED 1,224.3 Mn Q1 2016 – AED 1,317.3 Mn
Retail; 61%
Wholesale; 55%
Private;2%
Capital Markets
;17%
Real Estate;
0%
Others; -35%
Retail; 55%
Wholesale;27%
-Private; 4%
Capital Markets; -
36%
Real Estate;
2%
Others; -24%
Q1 2015– AED 450.8 Mn Q1 2016 – AED 482.0 Mn

22
Global Retail Banking overview
Liabilities (AED Bn) Assets (AED Bn)
Revenues (AED Mn)
Global Retail Banking contributes 62% of Net
Revenues:
Personal Banking Division provides services for
individuals clients, while the Business Banking Division
services the needs of SMEs.
These services include a variety of Shari’a compliant
financing.
Gross Retail Financing Portfolio
31 Dec 2015 – AED 43.0 Bn 31 Mar 2016 – AED 43.8 Bn
57.8
48.7
+19%
Q1 16 Q1 15
53.947.5
+13%
Q1 16 Q1 15
811742
+9%
Q1 16 Q1 15
Net Profit (AED Mn)
263274
-4%
Q1 16 Q1 15
15.6%
7.0
6.7%
3.0
2.2%
1.0
40.0%
18.0
4.4%
2.0
17.8%
8.0
13.3%
6.0
Personal Finance
Car Finance SME Mortgage
Others
Covered Cards
Home Finance
14.9%
6.5
5.5%
2.4
1.5%
0.7
42.3%
18.5
4.7%
2.0
18.7%
8.2
12.5%
5.5

23
26.429.9
Q1 16
-12%
Q1 15
34.632.2
+7%
Q1 16 Q1 15
305335
Q1 15
-9%
Q1 16
132
250
Q1 15
-47%
Q1 16
50.3%
15.2
24.2%
7.3
2.0%
0.6
17.2%
5.2
6.3%
1.9
Corporate- Dubai & Others
FI
International
Government and Public sector Corporate- AUH
Global Wholesale Banking overview
Global Wholesale Banking contributes 23% of Net
Revenues:
Wholesale Banking encompasses the large corporates,
emerging corporates and financial institutions divisions
of the Bank. The array of services includes Transaction
Banking and Corporate Finance and Investment Banking.
Liabilities (AED Bn) Assets (AED Bn)
Revenues (AED Mn) Net Profit (AED Mn)
Gross Wholesale Financing Portfolio
31 Dec 2015 – AED 30.2 Bn 31 Mar 2016 – AED 29.9 Bn
47.2%
14.1
25.2%
7.5
1.8%
0.5
19.9%
5.9
5.9%
1.8

24
Private Banking overview
Private Banking contributes 2% of Net Revenues
Private Banking focuses on high and ultra high net
worth individuals.
Wealth Management concentrates on developing,
marketing and servicing a wide range of wealth
management products (including third party and ADIB
proprietary funds) for high net worth, affluent and mass
market.
Liabilities (AED Bn) Assets (AED Bn)
Revenues (AED Mn)
2.72.7
Q1 15
0%
Q1 16
3.0
2.5
+20%
Q1 16 Q1 15
33
24
+37%
Q1 16 Q1 15
Net Profit (AED Mn)
21
11
Q1 15 Q1 16
+99%
Personal Banking
71.9%
183.1
Business Banking 3.1%
7.8
Private Banking
25.0%
(63.8)
Wealth Management AuM – AED 254.8 Mn
25
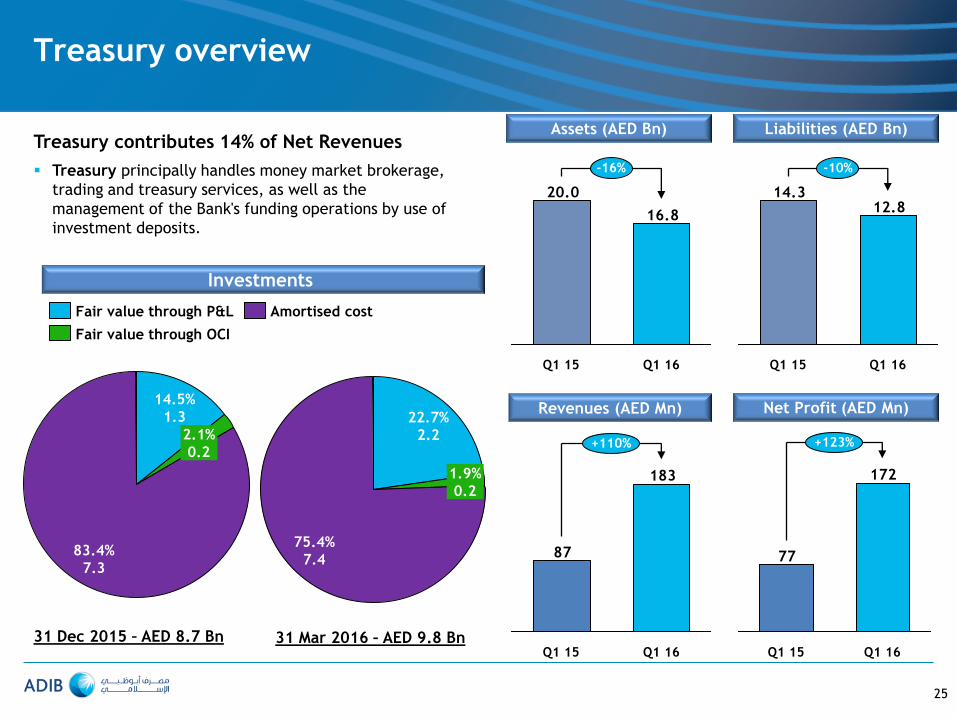
14.5%
1.3
83.4%
7.3
2.1%
0.2
Amortised cost
Fair value through OCI
Fair value through P&L
Treasury overview
Treasury contributes 14% of Net Revenues
Treasury principally handles money market brokerage,
trading and treasury services, as well as the
management of the Bank's funding operations by use of
investment deposits.
Investments
31 Dec 2015 – AED 8.7 Bn 31 Mar 2016 – AED 9.8 Bn
Revenues (AED Mn)
183
87
Q1 16
+110%
Q1 15
Net Profit (AED Mn)
172
77
Q1 16
+123%
Q1 15
Liabilities (AED Bn) Assets (AED Bn)
12.814.3
-10%
Q1 16 Q1 15
16.8
20.0
Q1 15
-16%
Q1 16
75.4%
7.4
1.9%
0.2
22.7%
2.2
26
Agenda
Introduction
Financial Review
Business Review
Appendix

27
Consolidated Statement of Income
AED Mn
Q1 15 Q4 15 Q1 16 % chg Q1 16
vs Q1 15
% chg Q1 16
vs Q4 15
Revenues 1,224.3 1,371.9 1,317.3 7.6% -4.0%
Net Revenue from Funds 941.3 976.8 973.0 3.4% -0.4%
Fees & commission 222.5 244.3 207.4 -6.8% -15.1%
Investment income 78.2 107.4 159.7 104.2% 48.8%
Foreign Exchange (18.5) 35.8 (23.6) -27.8% -165.9%
Other income 0.8 7.6 0.8 6.0% -89.3%
Expenses 569.9 643.2 614.9 7.9% -4.4%
Employee cost 349.5 366.7 363.9 4.1% -0.8%
Premises 53.6 55.4 58.4 8.9% 5.5%
Depreciation & amortisation 49.9 50.8 50.7 1.5% -0.2%
Other Operating expenses 116.9 170.3 141.9 21.5% -16.7%
Operating Profit - Margin 654.4 728.7 702.4 7.3% -3.6%
Provision for impairment 202.6 249.3 216.2 6.7% -13.3%
- Individual / Specific 148.0 47.1 168.8 14.1% 258.2%
- Collective / General 52.3 163.5 38.1 -27.1% -76.7%
- Others 2.3 38.7 9.3 292.5% -76.1%
Net Profit before Zakat & Tax 451.8 479.4 486.2 7.6% 1.4%
Zakat & Tax 1.0 2.0 4.2 313.4% 112.0%
Net Profit after Zakat & Tax 450.8 477.4 482.0 6.9% 1.0%

28
Consolidated Balance Sheet
AED Mn% 31 Mar 2015 31 Dec 2015 31 Mar 2016
% chg 31 Mar
2016 vs 31 Mar
2015
% chg 31 Mar
2016 vs 31 Dec
2015
Cash and balances with Central Banks 21,163 18,629 19,215 -9.2% 3.1%
Due from financial institutions 5,839 4,742 3,849 -34.1% -18.8%
Net Customer financing 72,324 78,403 78,311 8.3% -0.1%
Investments 7,052 8,736 9,767 38.5% 11.8%
Investment in associates 781 799 750 -4.0% -6.2%
Investment and development properties 1,147 1,084 1,779 55.1% 64.2%
Other assets / fixed assets / intangibles 5,755 5,984 5,507 -4.3% -8.0%
TOTAL ASSETS 114,061 118,378 119,179 4.5% 0.7%
Due to financial institutions 4,274 3,106 2,505 -41.4% -19.3%
Customers' deposits 87,602 94,927 95,994 9.6% 1.1%
Other liabilities 3,521 3,433 3,333 -5.3% -2.9%
Sukuk payable 4,589 1,836 1,836 -60.0% -
TOTAL LIABILITIES 99,986 103,302 103,668 3.7% 0.4%
Share capital 3,000 3,168 3,168 5.6% -
Tier 1 sukuk 5,611 5,672 5,673 1.1% 0.01%
Proposed dividend 700 769 769 9.8% -
Reserves 4,764 5,466 5,901 23.9% 8.0%
TOTAL EQUITY 14,075 15,075 15,510 10.2% 2.9%
TOTAL LIABILITIES AND EQUITY 114,061 118,378 119,179 4.5% 0.7%
29
Dividend Distribution History
2008 2009 2010 2011 2012 2013 2014 2015
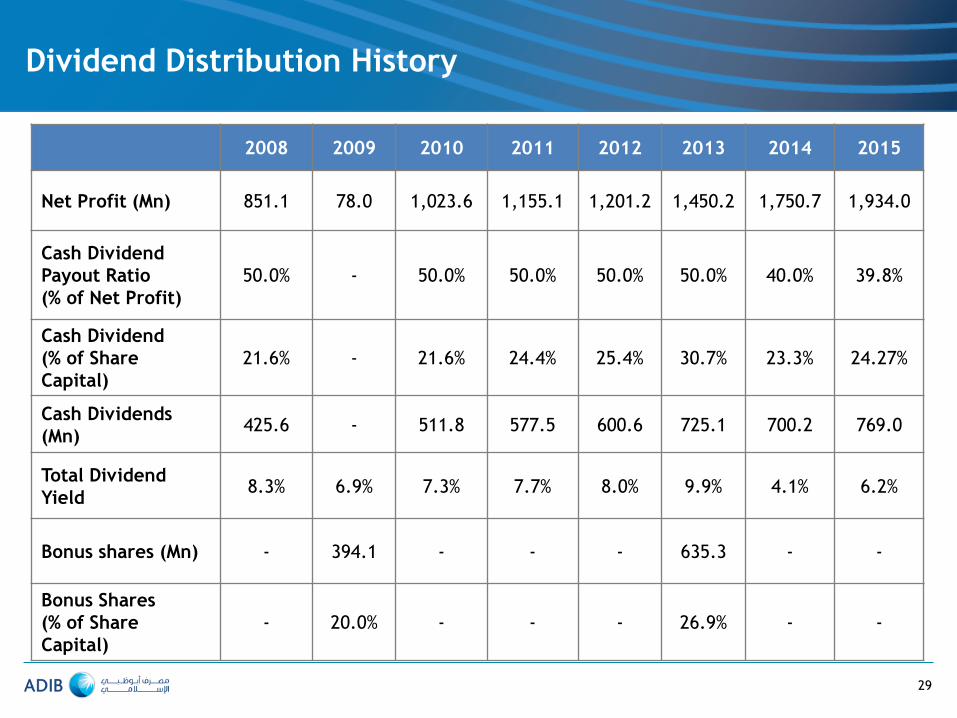
Net Profit (Mn) 851.1 78.0 1,023.6 1,155.1 1,201.2 1,450.2 1,750.7 1,934.0
Cash Dividend
Payout Ratio
(% of Net Profit)
50.0% - 50.0% 50.0% 50.0% 50.0% 40.0% 39.8%
Cash Dividend
(% of Share
Capital)
21.6% - 21.6% 24.4% 25.4% 30.7% 23.3% 24.27%
Cash Dividends
(Mn) 425.6 - 511.8 577.5 600.6 725.1 700.2 769.0
Total Dividend
Yield 8.3% 6.9% 7.3% 7.7% 8.0% 9.9% 4.1% 6.2%
Bonus shares (Mn) - 394.1 - - - 635.3 - -
Bonus Shares
(% of Share
Capital)
- 20.0% - - - 26.9% - -

30
Shareholders’ Return
31 Mar 2016 share price was AED 3.89 per share (31 Dec 2015: AED 3.94 per share).
Cash dividend of 39.8% of net profit, 24.27% of share capital (2014: 23.34% of share capital).
Total dividend yield of ADIB share – 6.2%. (2014: 4.1% Cash dividend only).
2,000
2,500
3,000
3,500
4,000
4,500
5,000
5,500
-
0.50
1.00
1.50
2.00
2.50
3.00
3.50
4.00
4.50
5.00
5.50
6.00
6.50
7.00
7.50
Dec
-08
Jan-
09Fe
b-09
Mar
-09
Apr
-09
May
-09
Jun-
09Ju
l-09
Aug
-09
Sep-
09O
ct-0
9N
ov-0
9D
ec-0
9Ja
n-10
Feb-
10M
ar-1
0A
pr-1
0M
ay-1
0Ju
n-10
Jul-1
0A
ug-1
0Se
p-10
Oct
-10
Nov
-10
Dec
-10
Jan-
11Fe
b-11
Mar
-11
Apr
-11
May
-11
Jun-
11Ju
l-11
Aug
-11
Sep-
11O
ct-1
1N
ov-1
1D
ec-1
1Ja
n-12
Feb-
12M
ar-1
2A
pr-1
2M
ay-1
2Ju
n-12
Jul-1
2A
ug-1
2Se
p-12
Oct
-12
Nov
-12
Dec
-12
Jan-
13Fe
b-13
Mar
-13
Apr
-13
May
-13
Jun-
13Ju
l-13
Aug
-13
Sep-
13O
ct-1
3N
ov-1
3D
ec-1
3Ja
n-14
Feb-
14M
ar-1
4A
pr-1
4M
ay-1
4Ju
n-14
Jul-1
4A
ug-1
4Se
p-14
Oct
-14
Nov
-14
Dec
-14
Jan-
15Fe
b-15
Mar
-15
Apr
-15
May
-15
Jun-
15Ju
l-15
Aug
-15
Sep-
15O
ct-1
5N
ov-1
5D
ec-1
5Ja
n-16
Feb-
16M
ar-1
6
AD
IB P
rice
(AED
)
ADIB vs ADX
ADIB ADX
AD
XP
oin
ts

An award winning Bank (1/2)
To be confirmed in February
2015
“Best Islamic Bank in the
Middle East and the UAE”
- by Euromomey
“SKEA – Gold category”
Sheikh Khalifa Excellence award
“Best Bank of the year in the
UAE”- Banker Magazine by Financial
Times
“Best Overall Bank in Customer
Service” for 4 consecutive years in the UAE by Ethos consultancy
Mohammed Bin Rashid Business
award for 2 consecutive years
“Best Overall Bank in Customer
Service” in the GCC
by Ethos consultancy
Best Premium Banking Service-
by Banker Middle East
“Most Innovative Bank in the
Middle East”- by EMEA Finance
31

An award winning Bank (2/2)
“Best Islamic Bank in the UAE”
by Islamic Finance News
“Best Private Bank UAE” by Global Finance
“Best Branch Award in the
UAE” by Ethos Consultancy
“Best Private Bank in the
Middle East for Islamic
Finance” by Private Banker
International
Best Islamic Bank of the year in
the Middle east and UAE - Banker Magazine by Financial Times
“The Leading Arab Islamic Bank
for 2015”- by Union of Arab Banks
32 “Best Overall Islamic Bank “
International Financial Law Review
Magazine
32
33
Disclaimer
The information contained herein has been prepared by Abu Dhabi Islamic Bank PJSC (ADIB). ADIB relies on information obtained from sources believed to be reliable but does not guarantee its accuracy or completeness.
This presentation has been prepared for information purposes only and is not and does not form part of any offer for sale or solicitation of any offer to subscribe for or purchase or sell nay securities nor shall it part of it form the basis of or be relied on in connection with any contract or commitment whatever.
Some of this information in this presentation may contain projections or other forward-looking statements regarding future events or the future financial performance of ADIB. These forward-looking statements include all matters that are not historical facts. The inclusion of such forward-looking information shall not be regarded as representation by ADIB or any other person that the objectives or plans of ADIB will be achieved. ADIB undertakes no obligation to publicly update or publicly revise any forward-looking statement, whatever as a result of new information, future events or otherwise.