investor presentation - annual results 2009 final 2009 annual results cost initiatives • reduced...
TRANSCRIPT

2009 ANNUAL RESULTS1
ANNUAL RESULTS2009

2009 ANNUAL RESULTS2
HIGHLIGHTS
• Normalised earnings* $145m
• Net cash position of $1.6bn
• Gearing improved 0.3 pts to 45.0%
• Effective capacity management
• Award-winning innovations
• Positive employee engagement
• Strong non-airline revenue growth
* Normalised earnings before taxation after excluding the net impact of derivatives that hedge exposures in other financial periods

2009 ANNUAL RESULTS3
MAIN DRIVERS
• Volatile foreign exchange rates and fuel prices
• Deterioration of demand for air travel
• Capacity reduction of 7.2% in response
• Increased competitor capacity on trans Tasman and trans Pacific

2009 ANNUAL RESULTS4
KEY INFLUENCES ON PROFITABILITY
$NZ (m)
145(17)272
2551
(9)370
(48)
(59)
197
-200
-100
0
100
200
300
400
2008Normalised
Earningsbefore
Taxation
Yield Traffic Freight,Contract
Services &Other
Revenue
Labour Fuel Priceand Volume
Maintenance,Aircraft
Operationsand
PassengerServices
Sales & Marketing
Depreciationand Lease
Costs
Impact ofFuel Hedging
Impact of FX(IncludingHedging)
Other 2009Normalised
Earningsbefore
Taxation
HedgeTiming
Adjustment
ReportedNPBT 2009
(280)18
(375)
(138)
7

2009 ANNUAL RESULTS5
COST INITIATIVES
• Reduced aircraft operations
• Fuel efficiency initiatives
• FTE reduced by 467*
• Reduced hours working week offered
• Leave without pay initiative introduced
• Board, executive and management pay freeze
• Continuous cost management
*excluding acquired businesses

2009 ANNUAL RESULTS6
YEAR TO DATE YIELD MOVEMENTS
0%
1%
2%
3%
4%
5%
6%
7%
8%
9%
Jul 0
8
Aug
08
Sep
08
Oct
08
Nov
08
Dec
08
Jan
09
Feb
09
Mar
09
Apr
09
May
09
Jun
09
Cha
nge
in Y
ield
Yield MovementYield Movement FX Adjusted

2009 ANNUAL RESULTS7
LONG HAUL PERFORMANCE
• RPKs down 8.8%
• Capacity reduced by 9.4%
• Load factor up 0.6 percentage points to 81.6%
• Yield up 12.1%
• Weaker NZD increased revenues
• Influenza A (H1N1) impact
• Pacific Premium Economy expanded on the 777-200 fleet

2009 ANNUAL RESULTS8
LONG HAUL CAPACITY MANAGEMENT
• Capacity forecast for 2010 is 9% lower than 2009
Long Haul Y.O.Y Capacity Change & Load Factor Y.O.Y Percentage Point Movement
-20%
-15%
-10%
-5%
0%
5%
Jul 0
8
Aug
08
Sep
08
Oct
08
Nov
08
Dec
08
Jan
09
Feb
09
Mar
09
Apr 0
9
May
09
Jun
09
Cha
nge
in c
apac
ity
-20 ppt
-15 ppt
-10 ppt
-5 ppt
0 ppt
5 ppt
Load
fact
or m
ovem
ent
Load Factor ppt Movement
ASK Change

2009 ANNUAL RESULTS9
DOMESTIC PERFORMANCE
• Difficult economic conditions in regional New Zealand
• Decreased capacity by 4.1%
• Load factor up 0.4 of a percentage point
• RPKs down 3.7%
• Final two Q300 turbo props introduced to fleet
• Award-winning airport innovations
• Launched Masterton and Westport services
• Changing competitive dynamics

2009 ANNUAL RESULTS10
TASMAN & PACIFIC ISLAND PERFORMANCE
• Reduced capacity by 3.9%
• Load factor down 2.4 percentage points
• RPKs down 6.8%
• IFE* upgrade programme completed
• Trans-Tasman services from Hamilton ceased and Dunedin reduced
• Rotorua/Sydney service announced
* Inflight entertainment

2009 ANNUAL RESULTS11
SHORT HAUL CAPACITY MANAGEMENT
• Capacity forecast for 2010 is 7% lower than 2009
Short Haul Y.O.Y Capacity Change & Load Factor Y.O.Y Percentage Point Movement
-20%
-15%
-10%
-5%
0%
5%
Jul 0
8
Aug
08
Sep
08
Oct
08
Nov
08
Dec
08
Jan
09
Feb
09
Mar
09
Apr
09
May
09
Jun
09
Cha
nge
in c
apac
ity
-20 ppt
-15 ppt
-10 ppt
-5 ppt
0 ppt
5 ppt
Load
fact
or m
ovem
ent
Load Factor ppt Movement
ASK Change

2009 ANNUAL RESULTS12
STRATEGIC PRIORITIES
• Optimising network and refreshing product offering
• Aligning supply to demand
• Developing long haul product for B777-300ER
• Evaluating narrow body fleet replacement options
• Maintaining our environmental leadership position
• Further development of Airpoints programme
• Increase focus on new media within marketing

2009 ANNUAL RESULTS13
ENGINEERING
• Hangars remain full
• Gas Turbines profitable business
• Altitude Aerospace Interiors
• TAE, Masling and Tenix Aviation smoothly integrated

2009 ANNUAL RESULTS14
ENVIRONMENT
• Biofuels development focus continues
• Retrofitting winglets and zonal dryers
• Fuel efficient flight planning
• Environmental management system

2009 ANNUAL RESULTS15
FINANCIAL MANAGEMENT
• $1.6bn cash on balance sheet at year end
• Gearing 45.0%, 0.3 percentage point improvement
• Average fleet age of 7.4 years
• Moody’s rating – Ba1 stable
• Final dividend at 3.5 cents per share

2009 ANNUAL RESULTS16
AIRCRAFT CAPEX COMMITMENTS
1. Includes progress payments on aircraft and is net of sale and lease back agreements
2. Assumes NZD/USD = 0.65
3. Assumption of 6 month delay for 787-9 aircraft
4. Excludes capitalised maintenance of approximately $55m per annum and non aircraft capex
$NZm
0
100
200
300
400
500
600
700
FY09 FY10 FY11 FY12

2009 ANNUAL RESULTS17
FLEET FLEXIBILITY
• Two B747 aircraft sold and leased back
• RFP for narrow body fleet replacement issued
• Seven ATR72-500s to be purchased on expiry of lease
• First 777-300ERs begin arriving in November 2010
• Fleet flexibility maintained
FLEET FLEXIBILITY
• Assumes 6 month delay on Boeing 787-9 aircraft
3,000
4,000
5,000
6,000
7,000
8,000
9,000
10,000
2009 2010 2011 2012 2013 2014 2015 2016 2017
Wid
e bo
dy s
eat c
ount
High Med Low 5% -5%

2009 ANNUAL RESULTS18
FUEL HEDGING*
• The first half of FY10 is 80% hedged. The average ceiling price of the Singapore Jet hedge is US$70.78 per barrel. The average ceiling price of the WTI crude oil hedge is US$65.08 per barrel.
• The second half of FY10 is 54% hedged with the average ceiling at US$73.16 per barrel of WTI crude oil
* Fuel hedge position as at 21 August 2009. Refer to separate fuel hedge disclosure.

2009 ANNUAL RESULTS19
CURRENCY HEDGING
• 2010 US dollar operating cash flow exposure is approx. 88% hedged at an average NZ$/US$ rate of 0.69
• US$322m of future capex commitments are hedged at NZ$/US$ rate of 0.73 (spot)

2009 ANNUAL RESULTS20
OUTLOOK
• While demand is stabilising, yields remain under significant pressure, fuel prices have resumed an upward trend and we are unlikely to achieve the same level of net hedging gains
• The same agility displayed in the 2009 financial year will be imperative throughout the next year
2009 ANNUAL RESULTS21
SUPPLEMENTARY INFORMATION
• Financial overview• Normalised Earnings• Group operating statistics• Long haul operating statistics• Short haul operating statistics• New aircraft arrivals• Current operating fleet

2009 ANNUAL RESULTS22
FINANCIAL OVERVIEW
* Normalised earnings before taxation after excluding the net impact of derivatives that hedge exposures in other financial periods
(23.5%)(2.0)cps8.5 cps6.5 cpsAnnual dividend
0.3 ptsN/A45.3%45.0%Gearing
22.0%$284m$1,289m$1,573mNet cash
(46.4%)$(307)m$662m$355mAdjusted operating cash flow
(90.4%)$(197)m$218m$21mNet profit after tax
(26.4%)$(52)m$197m$145mNormalised earnings*
(1.2%)$(58)m$4,667m$4,609mOperating revenue
Percentage movement
Dollar movementJune 2008June 2009

2009 ANNUAL RESULTS23
$197m$145mNormalised Earnings before Taxation
$2m$(1)mInterest rate derivatives
$20m$9mForeign exchange derivatives
$(129)m$130mFuel derivatives
Reverse net (gains) / losses on derivatives that hedge exposures in other financial periods:
$304m$7mEarnings before Taxation
June 2008June 2009
NORMALISED EARNINGS

2009 ANNUAL RESULTS24
GROUP OPERATING STATISTICS
6.2%13.013.8Yield (cents per RPK)
(0.3)pts79.3%79.0%Load factor
(7.2%)36,991m34,316mAvailable seat kilometres (ASKs)
(6.1%)13.2m12.4mPassengers carried
Movement*June 2008June 2009
* Calculations based on numbers before rounding

2009 ANNUAL RESULTS25
LONG HAUL OPERATING STATISTICS
0.6 pts81.0%81.6%Load factor
(8.8%)18,015m16,432mRPKs
(9.4%)22,243m20,150mASKs
(9.8%)2.0m1.8mPassengers carried
Movement*June 2008June 2009
* Calculations based on numbers before rounding
2009 ANNUAL RESULTS26
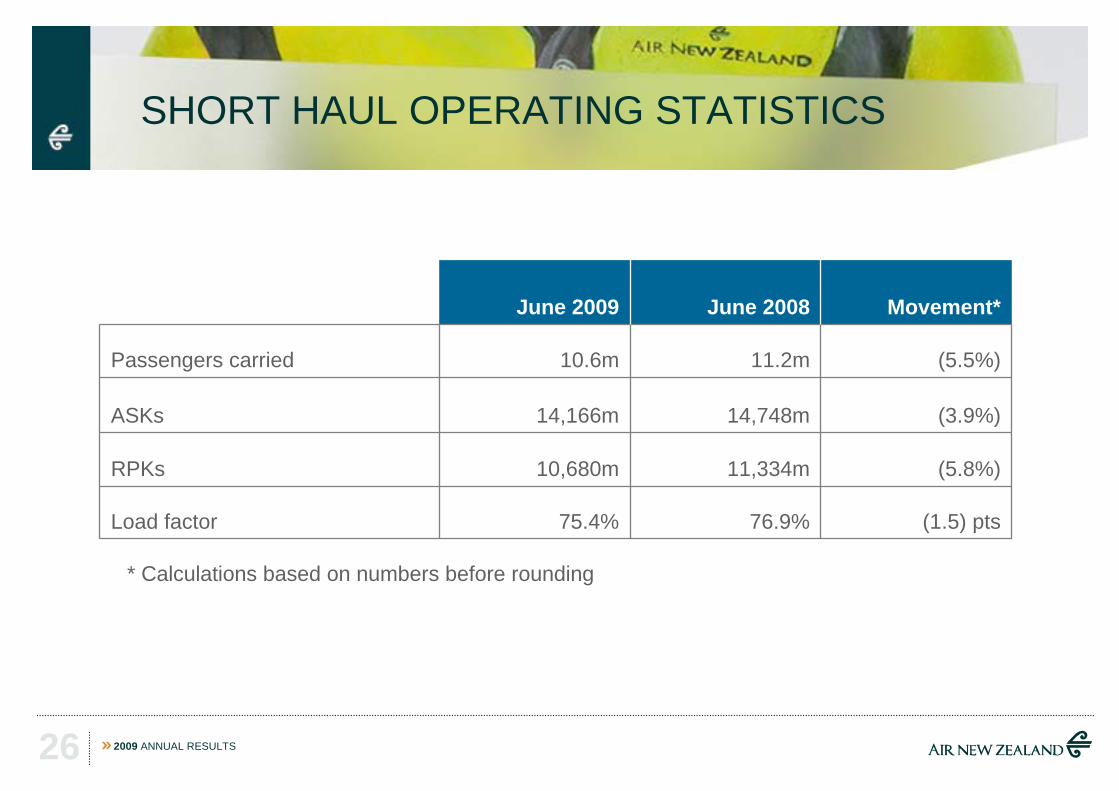
SHORT HAUL OPERATING STATISTICS
(1.5) pts76.9%75.4%Load factor
(5.8%)11,334m10,680mRPKs
(3.9%)14,748m14,166mASKs
(5.5%)11.2m10.6mPassengers carried
Movement*June 2008June 2009
* Calculations based on numbers before rounding

2009 ANNUAL RESULTS27
NEW AIRCRAFT ARRIVALS
4----Boeing 787-9 *
--23-Boeing 777-300ER
FY14FY13FY12FY11FY10Aircraft Type
* Assumed 6 month delay on Boeing 787-9 aircraft

2009 ANNUAL RESULTS28
CURRENT OPERATING FLEET
---(3)3Saab 340A
100298395Total operating fleet18117-17Beech 1900D
23221516Bombardier Q300
11-11-11ATR 72-500
16-16214Boeing 737-300
12-12-12Airbus A320-200
5-5(1)6Boeing 767-300ER
8-8-8Boeing 777-200ER
7(1)8-8Boeing 747-400
June 2009
2009 movement
June 2008
2008 movement
June 2007
Aircraft Type

2009 ANNUAL RESULTS29