investor presentation - jefferies · investor presentation . safe harbor statement ... •six...
TRANSCRIPT
1
August 2014
INVESTOR
PRESENTATION
Safe Harbor Statement
Statements contained in this presentation that are not
historical facts are forward-looking statements, which
involve risks and uncertainties that could cause actual
results to differ materially from those expressed in the
forward-looking statements. Such forward-looking
statements are made pursuant to the safe harbor
provisions of the Private Securities Litigation Reform Act
of 1995. Please refer to the Company’s Securities and
Exchange Commission filings for further information,
including its most recent reports on Form 10-K and its
quarterly reports on Form 10-Q.
2

Company Overview
• Olympic Steel founded in 1954
• Original service center business entailed
break bulk, warehousing and distribution
• Tubular & Pipe product segment founded
in 1914 (acquired in 2011)
• Growth initiatives included expansions into:
• Value-added processing
• Diversified product categories
• New geographies
• Nasdaq symbol: ZEUS
3

Experienced & Engaged Management
4
Years in
Steel Industry
Years with
ZEUS
Michael D. Siegal Chairman and Chief Executive Officer 40 40
David A. Wolfort President and Chief Operating Officer 40 30
Richard T. Marabito Chief Financial Officer 20 20
Esther M. Potash Chief Information Officer 16 16
Donald R. McNeeley, Ph.D. President and Chief Executive Officer, Chicago Tube & Iron 42 3
Raymond Walker President and Chief Operating Officer - Flat Rolled 45 28
Andrew Greiff President - Specialty Metals 29 5
Andy Markowitz President - Integrity Stainless 20 4
Richard A. Manson Vice President and Treasurer 18 18
John W. Brieck Vice President - Southern Region 38 15
Steve Mallory Vice President - Central Region 34 22
John J. Mooney Vice President - Eastern Region 25 25
Stephen Reyes Vice President, Sales and Marketing - Flat Rolled 31 15
Frank Ruane Vice President - Purchasing 29 16
Clayton Treska Vice President - New Business Development and Director - International Trade 52 30
John Howard Director - Operational Excellence 25 1
AVERAGE 32 18
18% of shares held by insiders

A Century of Service
5
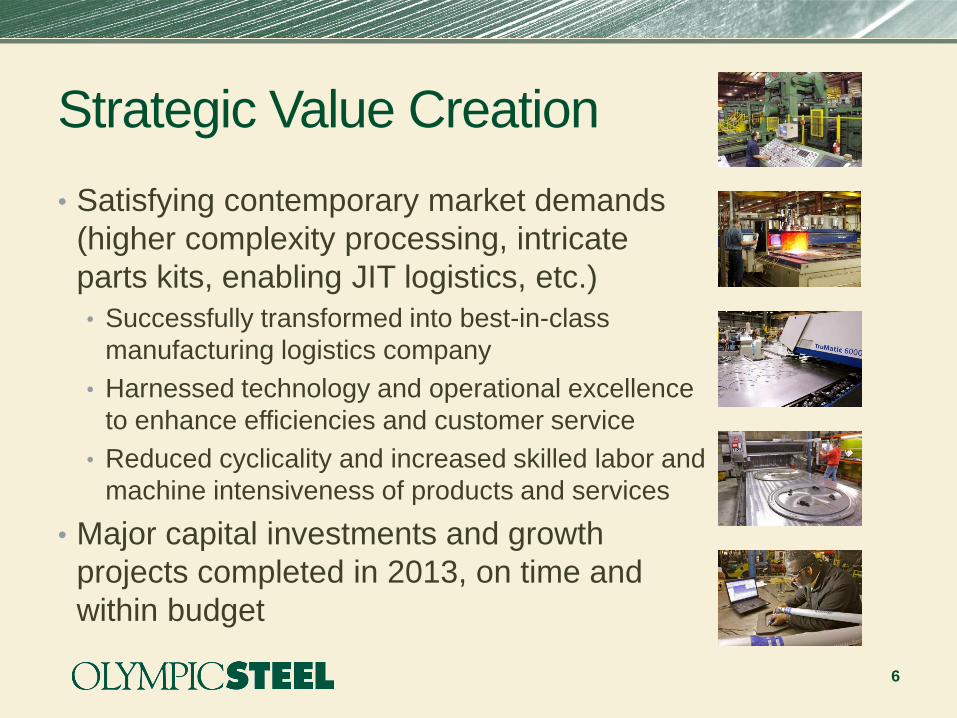
Strategic Value Creation
• Satisfying contemporary market demands
(higher complexity processing, intricate
parts kits, enabling JIT logistics, etc.)
• Successfully transformed into best-in-class
manufacturing logistics company
• Harnessed technology and operational excellence
to enhance efficiencies and customer service
• Reduced cyclicality and increased skilled labor and
machine intensiveness of products and services
• Major capital investments and growth
projects completed in 2013, on time and
within budget
6
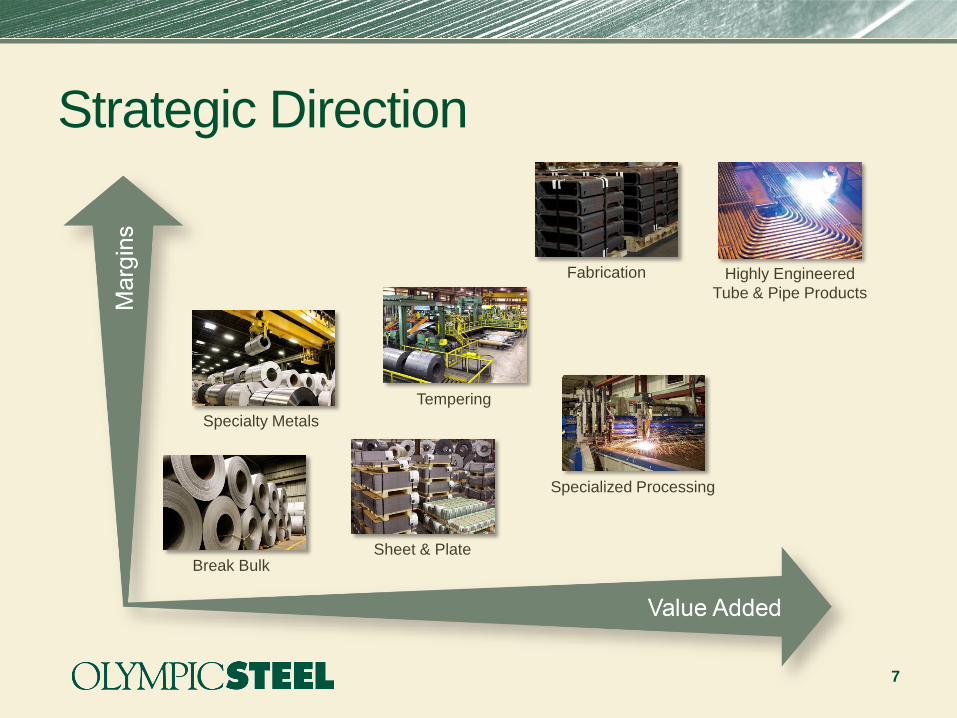
Strategic Direction
7
Break Bulk
Tempering
Specialized Processing
Sheet & Plate
Specialty Metals
Fabrication Highly Engineered
Tube & Pipe Products
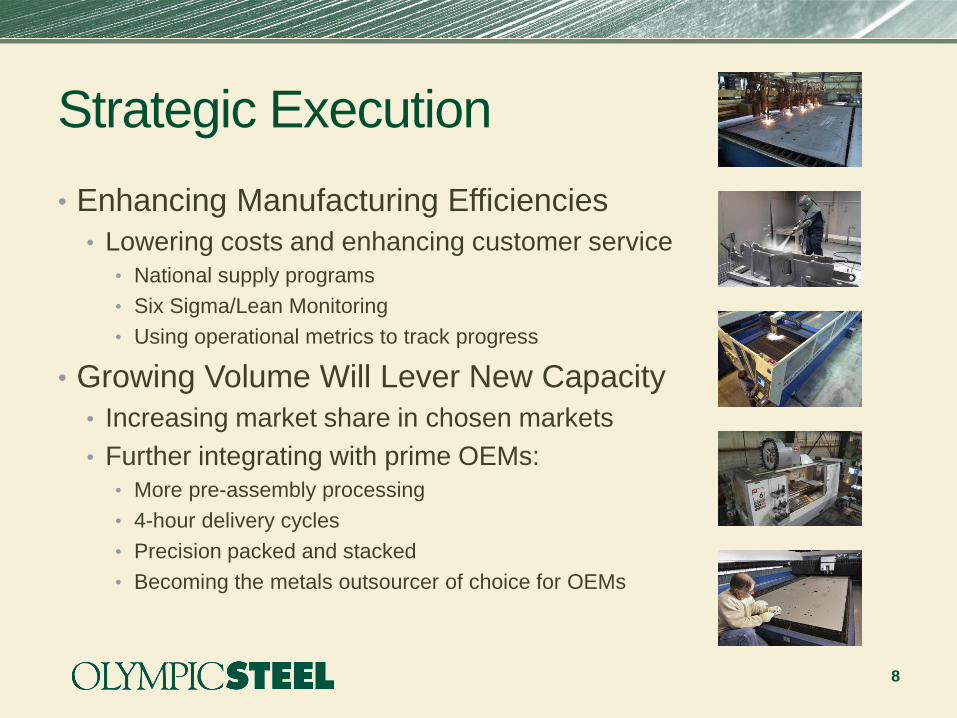
Strategic Execution
• Enhancing Manufacturing Efficiencies
• Lowering costs and enhancing customer service
• National supply programs
• Six Sigma/Lean Monitoring
• Using operational metrics to track progress
• Growing Volume Will Lever New Capacity
• Increasing market share in chosen markets
• Further integrating with prime OEMs:
• More pre-assembly processing
• 4-hour delivery cycles
• Precision packed and stacked
• Becoming the metals outsourcer of choice for OEMs
8

Value-Added Services
Flat Products:
• Custom tempering
heavy gauge cut-to-
length capabilities
• Plate processing
• Precision machining
• Laser cutting
• O2 & plasma cutting
• Welding
• Painting
• Blanking
Tubular and Pipe
Products:
• Tubing fabrication
• Bending
• Valves
• Fittings
• Pressure parts
• Hydraulic tubing
• Stainless tubing
• Aluminum pipe
• Threading & grooving
9
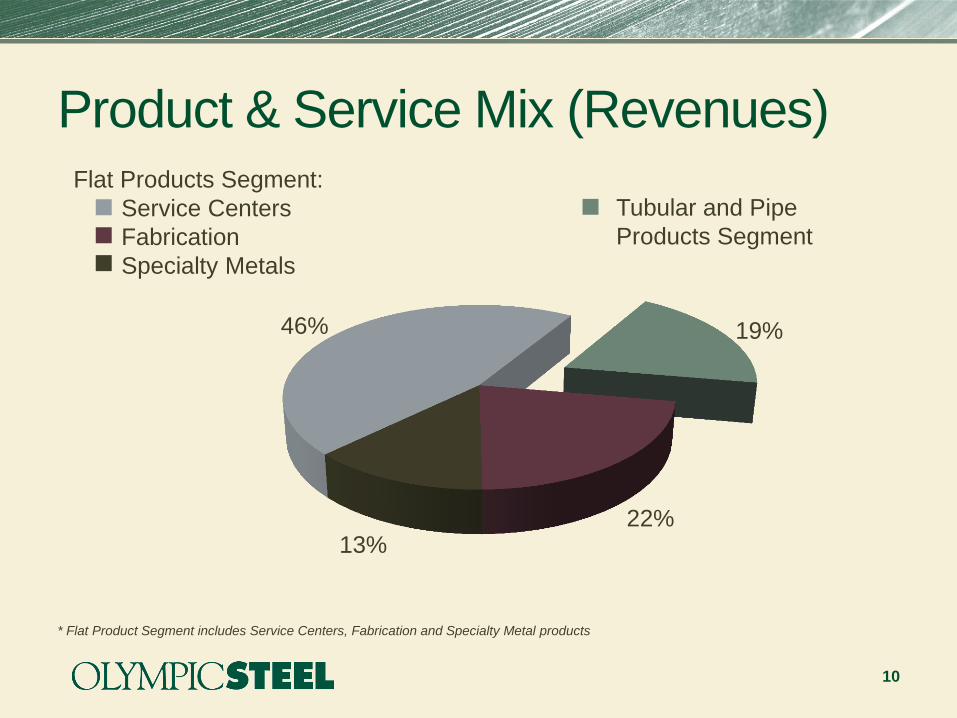
46% 19%
22% 13%
Product & Service Mix (Revenues)
10
* Flat Product Segment includes Service Centers, Fabrication and Specialty Metal products
Flat Products Segment:
Service Centers
Fabrication
Specialty Metals
Tubular and Pipe
Products Segment

Carbon Flat Products
• Olympic Steel’s core business
• 68% of consolidated sales
• Representing more than 3% of the U.S. carbon
flat rolled market and 5% of the plate market
• Three temper mills with heavy gauge
cut-to-length lines
• Increasing production to feed growing
fabrication business
• Satisfying OEMs that are outsourcing
more multi-stage metal processing
11

Tubular & Pipe Products
• Currently 19% of
consolidated sales
• Highly engineered and
labor intensive
• Less cyclical and higher margins vs.
traditional carbon markets
• CT&I growth outpacing industry
• St. Paul facility expansion
• Integration into Ohio, Kentucky, Georgia
and Mexico flat rolled facilities
12
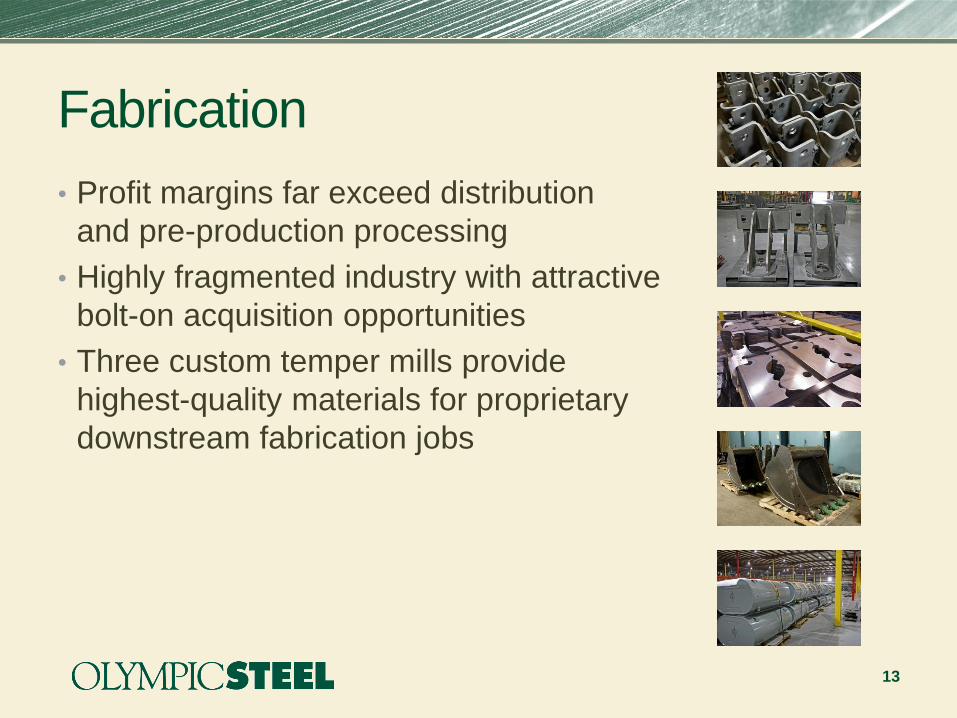
Fabrication
• Profit margins far exceed distribution
and pre-production processing
• Highly fragmented industry with attractive
bolt-on acquisition opportunities
• Three custom temper mills provide
highest-quality materials for proprietary
downstream fabrication jobs
13

Specialty Metals
• Currently 13% of consolidated sales
• Significantly higher revenue orders and
gross profits vs. distribution and
warehousing business
• Growing aluminum sales to auto sector
• Strong and growing presence in
stainless steel markets
• Food and beverage
• Appliances/White goods
• Medical, chemical and pharmaceutical vessels
• Transportation/Tankers
14
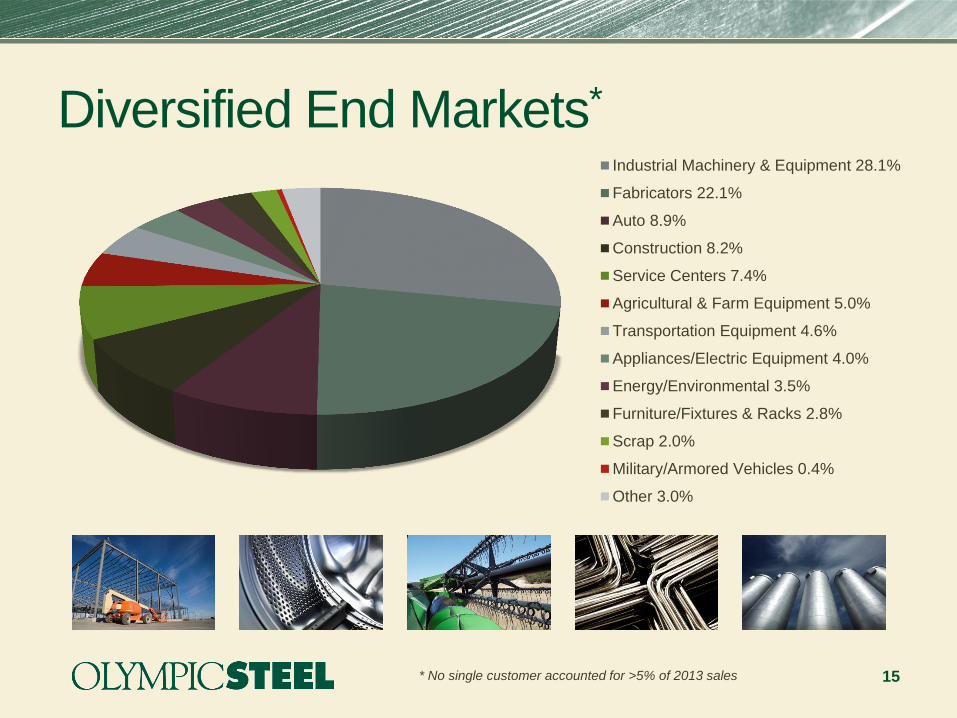
Diversified End Markets*
Industrial Machinery & Equipment 28.1%
Fabricators 22.1%
Auto 8.9%
Construction 8.2%
Service Centers 7.4%
Agricultural & Farm Equipment 5.0%
Transportation Equipment 4.6%
Appliances/Electric Equipment 4.0%
Energy/Environmental 3.5%
Furniture/Fixtures & Racks 2.8%
Scrap 2.0%
Military/Armored Vehicles 0.4%
Other 3.0%
15 * No single customer accounted for >5% of 2013 sales
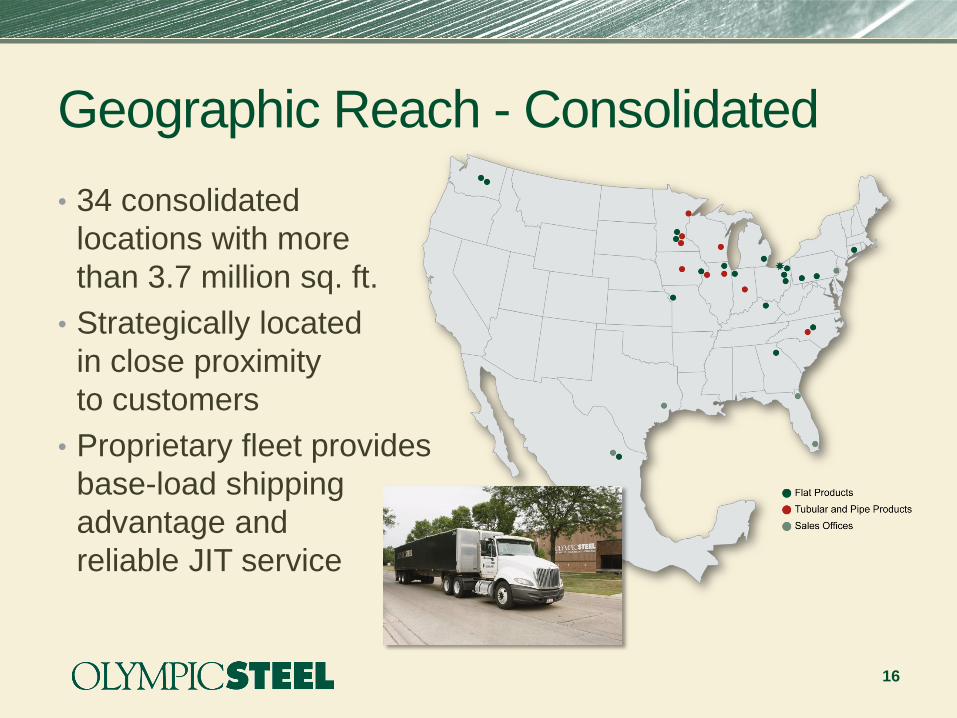
Geographic Reach - Consolidated
• 34 consolidated
locations with more
than 3.7 million sq. ft.
• Strategically located
in close proximity
to customers
• Proprietary fleet provides
base-load shipping
advantage and
reliable JIT service
16
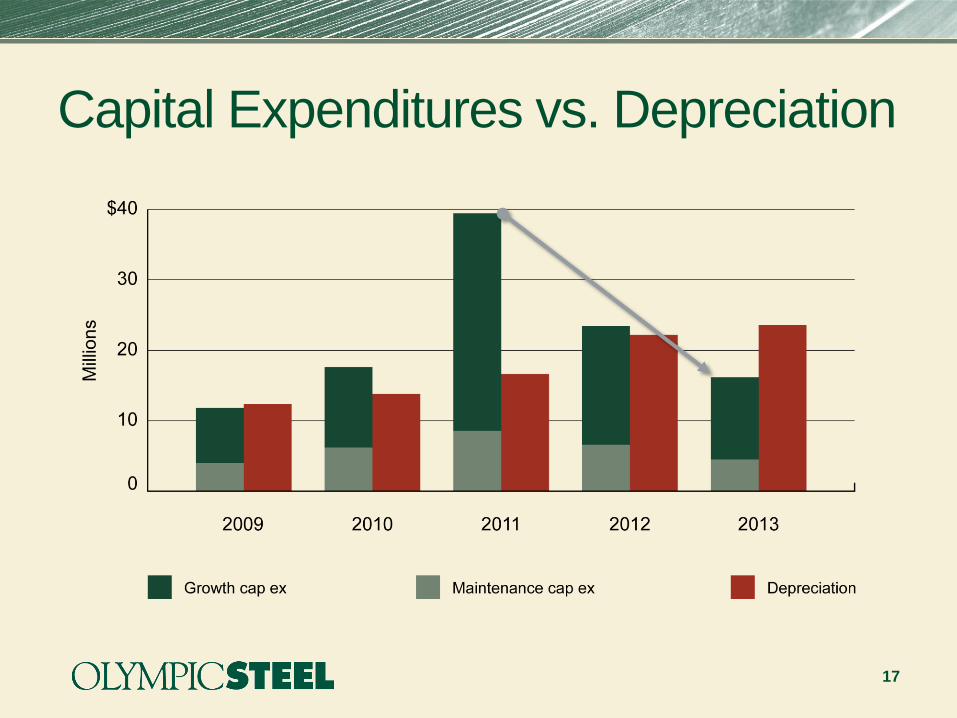
Capital Expenditures vs. Depreciation
17

Investment Highlights
• Concluded 5-year strategic expansion plan
• $143M cap ex (‘08-‘13) and $149M for the highly accretive
CT&I acquisition
• Poised for higher returns on investments
• Doubled normalized earnings capacity
• Ongoing debt reduction
• Cap ex < Depreciation is driving higher free cash flow
• Goal to reduce debt/EBITDA by 50%
• Low cost (<3%), flexible asset-based credit facility
• Opportunistic acquisitions
• Higher margin and less cyclical assets
18

19
INVESTOR Q&A

20
APPENDICES

Sales Mix Evolution by Product Group
21
2013 Carbon flat products ~68%
Hot Rolled 35.5% Plate 19.8%
Cold Rolled 6.4% Coated 6.0%
Tolling 0.3% Other 0.1%
Specialty Metals 12.8% Tube and Pipe 19.1%
2005 Carbon flat products ~95%
Hot Rolled 49.3% Plate 29.2%
Cold Rolled 8.3% Coated 7.3%
Tolling 0.9% Other 0.5%
Specialty Metals 4.5%

Fundamentals
22
$0
$500
$1,000
$1,500
2005 2006 2007 2008 2009 2010 2011 2012 2013
Revenue (in millions)
-$100
-$50
$0
$50
$100
$150
2005 2006 2007 2008 2009 2010 2011 2012 2013
Operating Income (in millions)
($6.00)
($4.00)
($2.00)
$0.00
$2.00
$4.00
$6.00
$8.00
2005 2006 2007 2008 2009 2010 2011 2012 2013
Earnings per Share
$0
$10
$20
$30
2005 2006 2007 2008 2009 2010 2011 2012 2013
Tangible BV per Share