investor presentation - v1.hdfcbank.comtracking the india growth story private consumption •...
TRANSCRIPT

Investor Presentation
Tracking the India Growth Story
Meeting Diverse Customers’ Needs
Unique Franchise in the Indian Banking Sector
Key Business Initiatives
Financial Highlights
Value Proposition
1
Contents
Tracking the India Growth Story
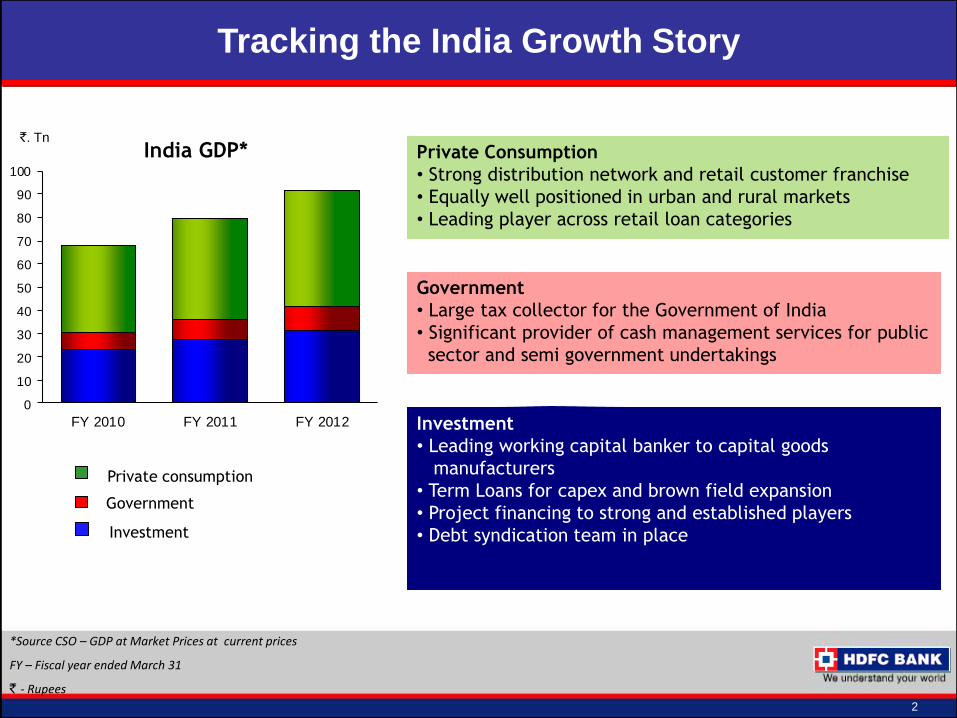
Private Consumption
• Strong distribution network and retail customer franchise
• Equally well positioned in urban and rural markets
• Leading player across retail loan categories
Government
• Large tax collector for the Government of India
• Significant provider of cash management services for public
sector and semi government undertakings
Investment
• Leading working capital banker to capital goods
manufacturers
• Term Loans for capex and brown field expansion
• Project financing to strong and established players
• Debt syndication team in place
India GDP*
2
*Source CSO – GDP at Market Prices at current prices
FY – Fiscal year ended March 31
` - Rupees
`. Tn
Investment
Government
Private consumption
0
10
20
30
40
50
60
70
80
90
100
FY 2010 FY 2011 FY 2012
Tracking the India Growth Story
Meeting Diverse Customers’ Needs
Unique Franchise in the Indian Banking Sector
Key Business Initiatives
Financial Highlights
Value Proposition
3
Contents
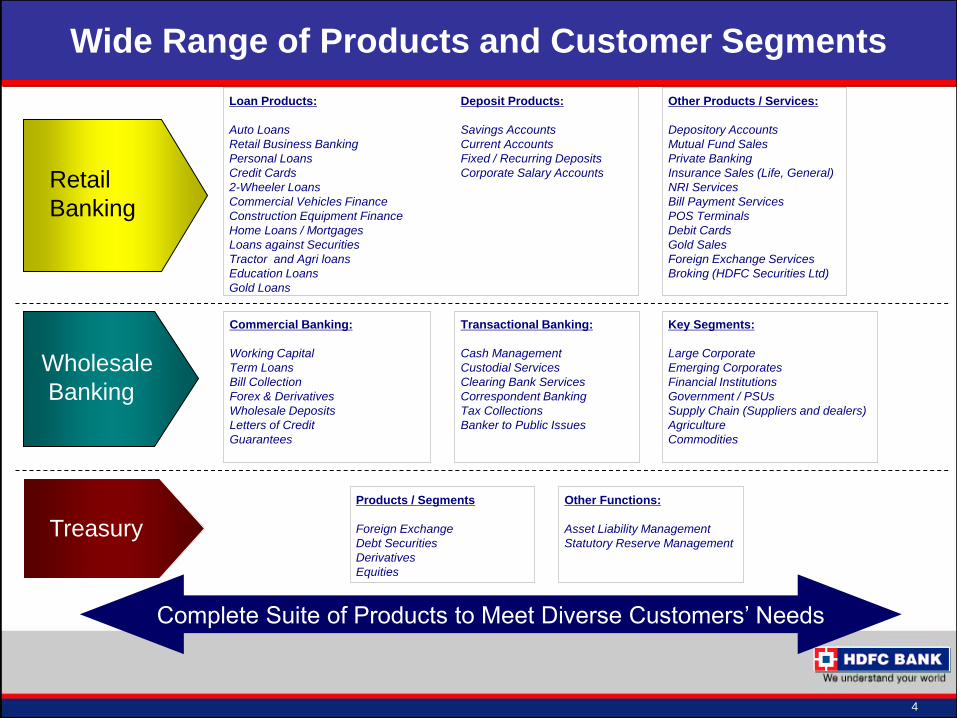
Wide Range of Products and Customer Segments
Loan Products:
Auto Loans
Retail Business Banking
Personal Loans
Credit Cards
2-Wheeler Loans
Commercial Vehicles Finance
Construction Equipment Finance
Home Loans / Mortgages
Loans against Securities
Tractor and Agri loans
Education Loans
Gold Loans
Other Products / Services:
Depository Accounts
Mutual Fund Sales
Private Banking
Insurance Sales (Life, General)
NRI Services
Bill Payment Services
POS Terminals
Debit Cards
Gold Sales
Foreign Exchange Services
Broking (HDFC Securities Ltd)
Deposit Products:
Savings Accounts
Current Accounts
Fixed / Recurring Deposits
Corporate Salary Accounts
Commercial Banking:
Working Capital
Term Loans
Bill Collection
Forex & Derivatives
Wholesale Deposits
Letters of Credit
Guarantees
Transactional Banking:
Cash Management
Custodial Services
Clearing Bank Services
Correspondent Banking
Tax Collections
Banker to Public Issues
Key Segments:
Large Corporate
Emerging Corporates
Financial Institutions
Government / PSUs
Supply Chain (Suppliers and dealers)
Agriculture
Commodities
Products / Segments
Foreign Exchange
Debt Securities
Derivatives
Equities
Other Functions:
Asset Liability Management
Statutory Reserve Management
Complete Suite of Products to Meet Diverse Customers’ Needs
Treasury
Wholesale
Banking
Retail
Banking
4
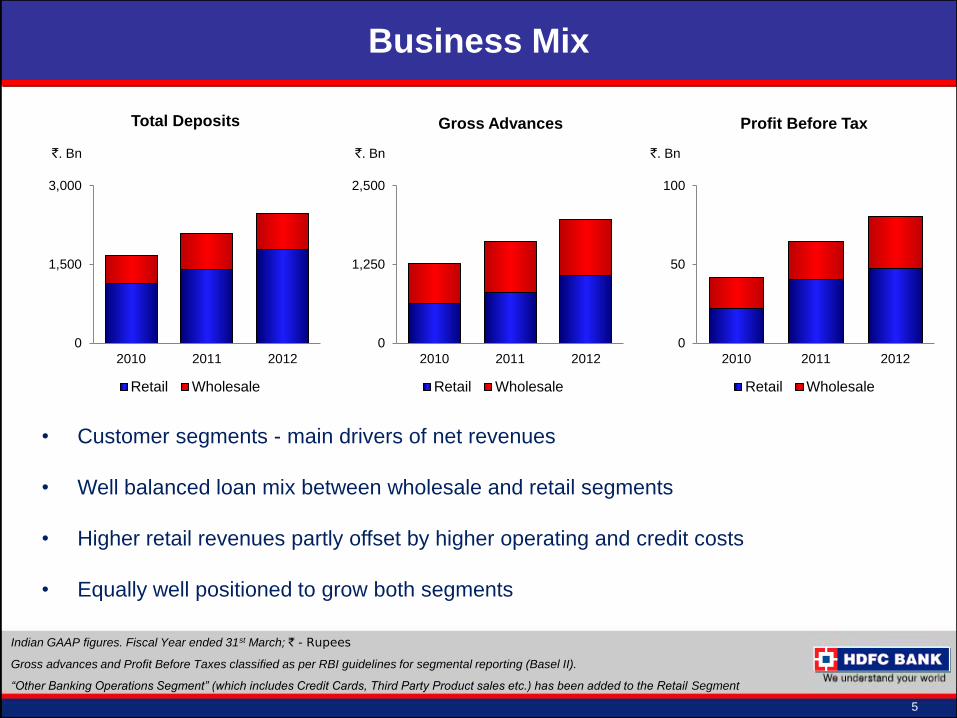
Total Deposits
Gross Advances
Profit Before Tax
5
Indian GAAP figures. Fiscal Year ended 31st March; ` - Rupees
Gross advances and Profit Before Taxes classified as per RBI guidelines for segmental reporting (Basel II).
“Other Banking Operations Segment” (which includes Credit Cards, Third Party Product sales etc.) has been added to the Retail Segment
Business Mix
• Customer segments - main drivers of net revenues
• Well balanced loan mix between wholesale and retail segments
• Higher retail revenues partly offset by higher operating and credit costs
• Equally well positioned to grow both segments
`. Bn
`. Bn
`. Bn
0
1,500
3,000
2010 2011 2012
Retail Wholesale
0
1,250
2,500
2010 2011 2012
Retail Wholesale
0
50
100
2010 2011 2012
Retail Wholesale
Tracking the India Growth Story
Meeting Diverse Customers’ Needs
Unique Franchise in the Indian Banking Sector
Key Business Initiatives
Financial Highlights
Value Proposition
6
Contents
7
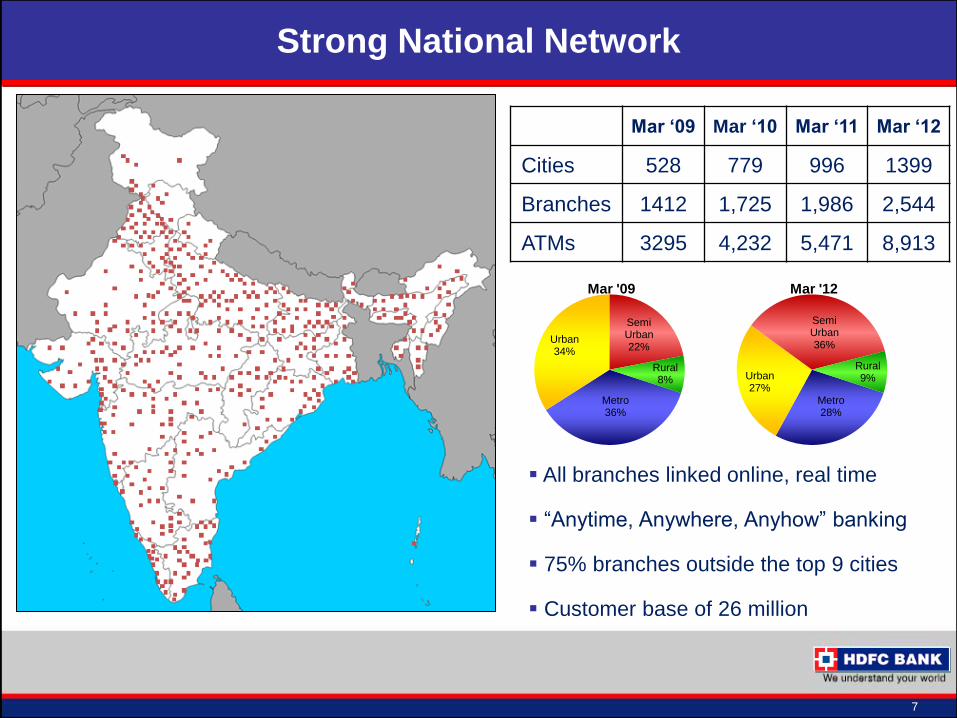
Strong National Network
All branches linked online, real time
“Anytime, Anywhere, Anyhow” banking
75% branches outside the top 9 cities
Customer base of 26 million
Branch classification
Mar ‘09 Mar ‘10 Mar ‘11 Mar ‘12
Cities 528 779 996 1399
Branches 1412 1,725 1,986 2,544
ATMs 3295 4,232 5,471 8,913
Metro 36%
Urban 34%
Semi Urban 22%
Rural 8%
Mar '09
Metro 28%
Urban 27%
Semi Urban 36%
Rural 9%
Mar '12
0
1500
3000
2010 2011 2012
Time Savings Current
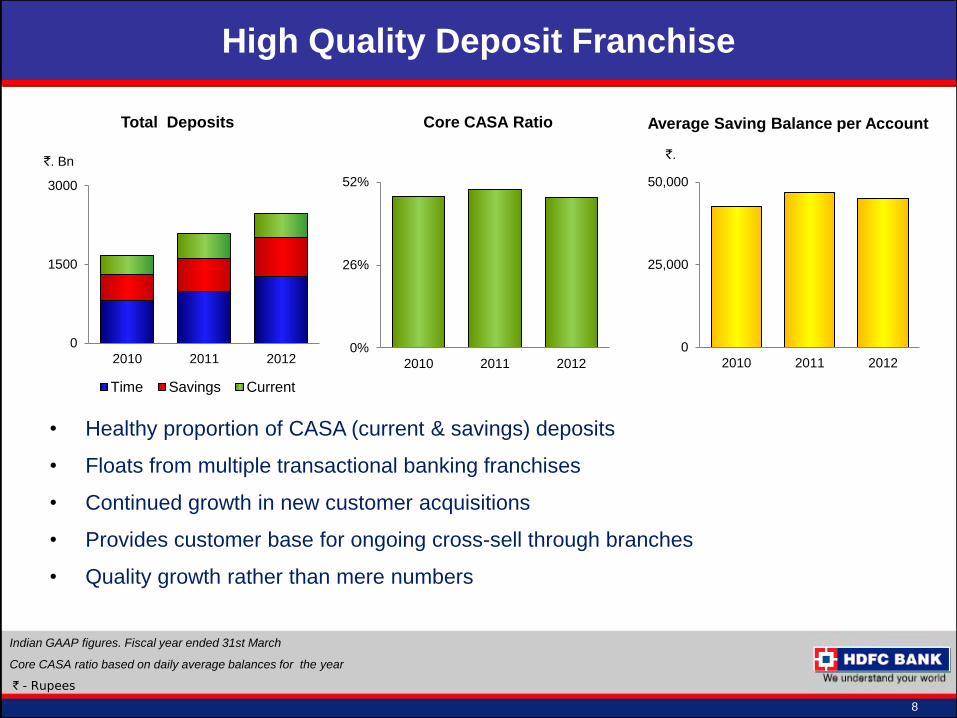
Total Deposits
Core CASA Ratio
Average Saving Balance per Account
• Healthy proportion of CASA (current & savings) deposits
• Floats from multiple transactional banking franchises
• Continued growth in new customer acquisitions
• Provides customer base for ongoing cross-sell through branches
• Quality growth rather than mere numbers
`. Bn
Indian GAAP figures. Fiscal year ended 31st March
Core CASA ratio based on daily average balances for the year
` - Rupees
8
`.
High Quality Deposit Franchise
0%
26%
52%
2010 2011 2012
0
25,000
50,000
2010 2011 2012
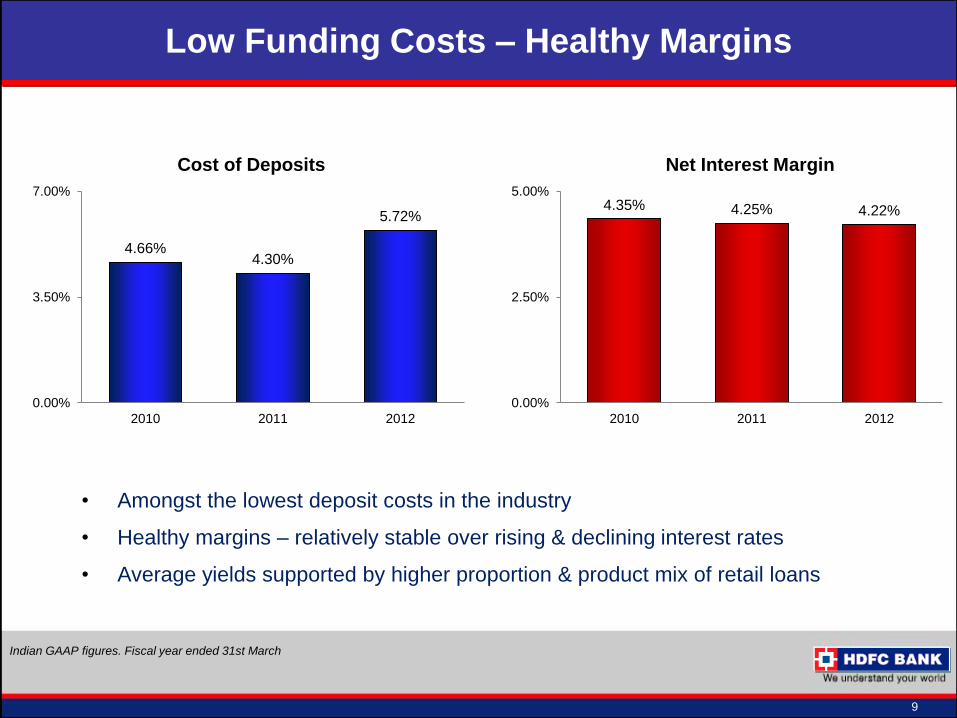
• Amongst the lowest deposit costs in the industry
• Healthy margins – relatively stable over rising & declining interest rates
• Average yields supported by higher proportion & product mix of retail loans
Indian GAAP figures. Fiscal year ended 31st March
9
Low Funding Costs – Healthy Margins
4.35% 4.25% 4.22%
0.00%
2.50%
5.00%
2010 2011 2012
Net Interest Margin
4.66% 4.30%
5.72%
0.00%
3.50%
7.00%
2010 2011 2012
Cost of Deposits
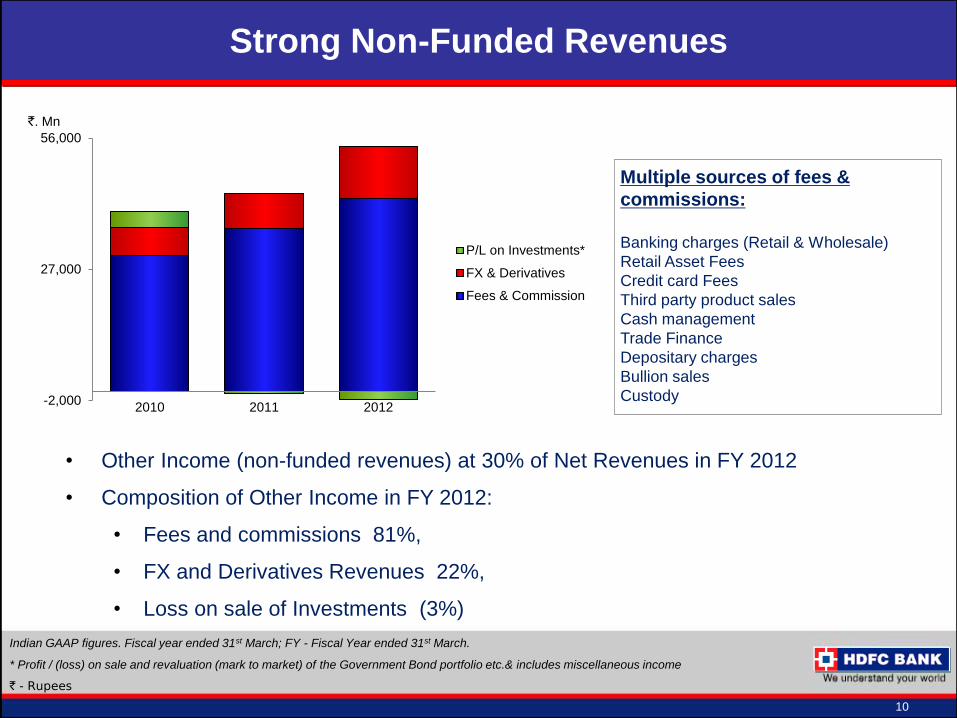
Indian GAAP figures. Fiscal year ended 31st March; FY - Fiscal Year ended 31st March.
* Profit / (loss) on sale and revaluation (mark to market) of the Government Bond portfolio etc.& includes miscellaneous income
` - Rupees
10
Strong Non-Funded Revenues
• Other Income (non-funded revenues) at 30% of Net Revenues in FY 2012
• Composition of Other Income in FY 2012:
• Fees and commissions 81%,
• FX and Derivatives Revenues 22%,
• Loss on sale of Investments (3%)
Multiple sources of fees &
commissions:
Banking charges (Retail & Wholesale)
Retail Asset Fees
Credit card Fees
Third party product sales
Cash management
Trade Finance
Depositary charges
Bullion sales
Custody
`. Mn
-2,000
27,000
56,000
2010 2011 2012
P/L on Investments*
FX & Derivatives
Fees & Commission
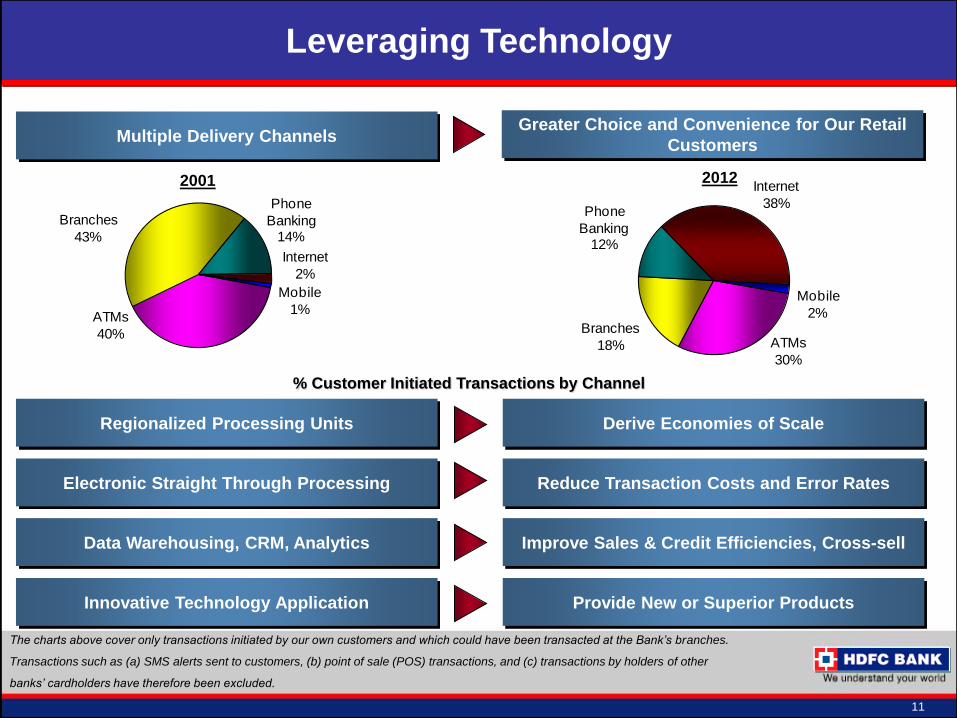
The charts above cover only transactions initiated by our own customers and which could have been transacted at the Bank‟s branches.
Transactions such as (a) SMS alerts sent to customers, (b) point of sale (POS) transactions, and (c) transactions by holders of other
banks‟ cardholders have therefore been excluded.
% Customer Initiated Transactions by Channel
ATMs
40%
Branches
43%
Phone
Banking14%
Internet
2%
Mobile
1%
2001
Multiple Delivery Channels Greater Choice and Convenience for Our Retail
Customers
Regionalized Processing Units Derive Economies of Scale
Electronic Straight Through Processing Reduce Transaction Costs and Error Rates
Data Warehousing, CRM, Analytics Improve Sales & Credit Efficiencies, Cross-sell
Innovative Technology Application Provide New or Superior Products
2012
11
Leveraging Technology
ATMs
30%
Branches
18%
Phone
Banking12%
Internet
38%
Mobile
2%
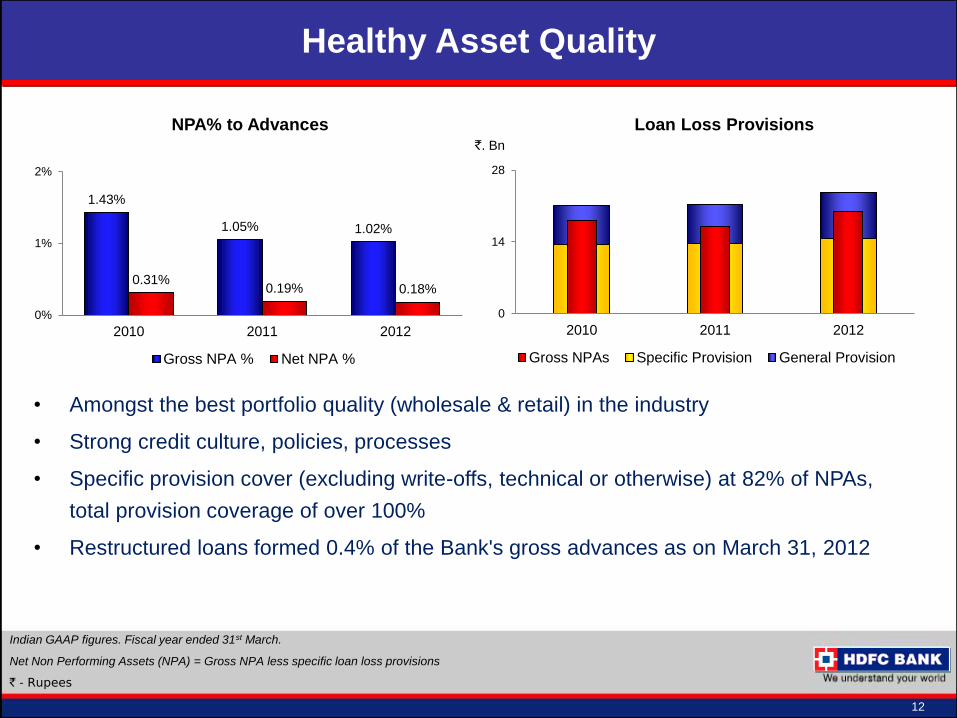
NPA% to Advances Loan Loss Provisions
`. Bn
• Amongst the best portfolio quality (wholesale & retail) in the industry
• Strong credit culture, policies, processes
• Specific provision cover (excluding write-offs, technical or otherwise) at 82% of NPAs,
total provision coverage of over 100%
• Restructured loans formed 0.4% of the Bank's gross advances as on March 31, 2012
Indian GAAP figures. Fiscal year ended 31st March.
Net Non Performing Assets (NPA) = Gross NPA less specific loan loss provisions
` - Rupees
12
Healthy Asset Quality
0
14
28
2010 2011 2012
Gross NPAs Specific Provision General Provision
1.43%
1.05% 1.02%
0.31% 0.19% 0.18%
0%
1%
2%
2010 2011 2012
Gross NPA % Net NPA %
0
26,000
52,000
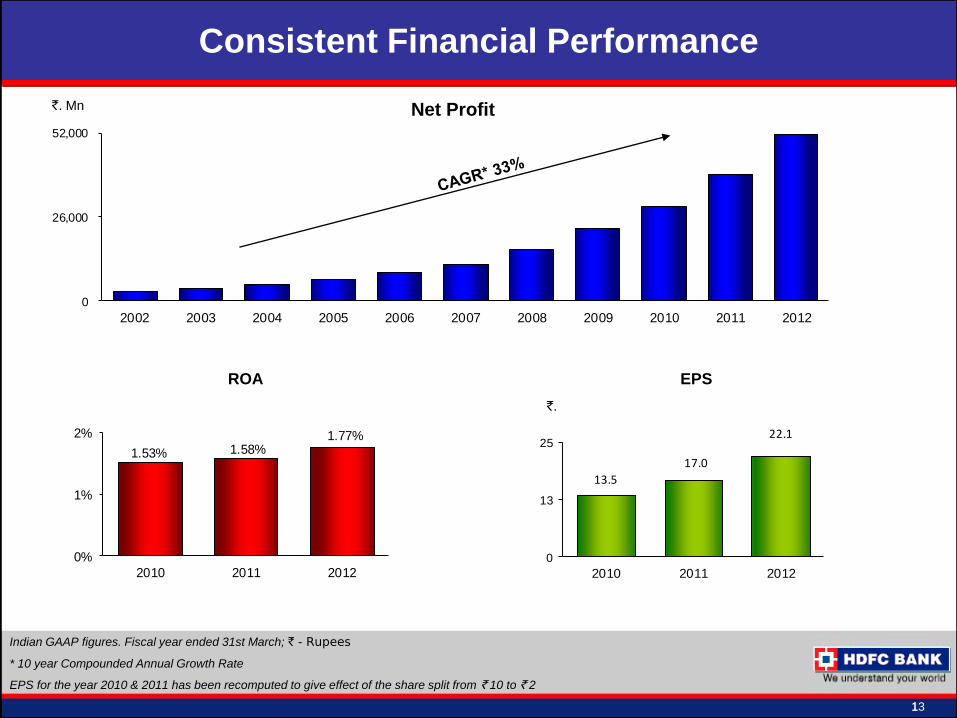
2002 2003 2004 2005 2006 2007 2008 2009 2010 2011 2012
Net Profit
13.5
17.0
22.1
0
13
25
2010 2011 2012
ROA
`. Mn
EPS
1.53% 1.58%1.77%
0%
1%
2%
2010 2011 2012
Indian GAAP figures. Fiscal year ended 31st March; ` - Rupees
* 10 year Compounded Annual Growth Rate
EPS for the year 2010 & 2011 has been recomputed to give effect of the share split from ` 10 to ` 2
1 13
Consistent Financial Performance
`.
Tracking the India Growth Story
Meeting Diverse Customers’ Needs
Unique Franchise in the Indian Banking Sector
Key Business Initiatives
Financial Highlights
Value Proposition
14
Contents
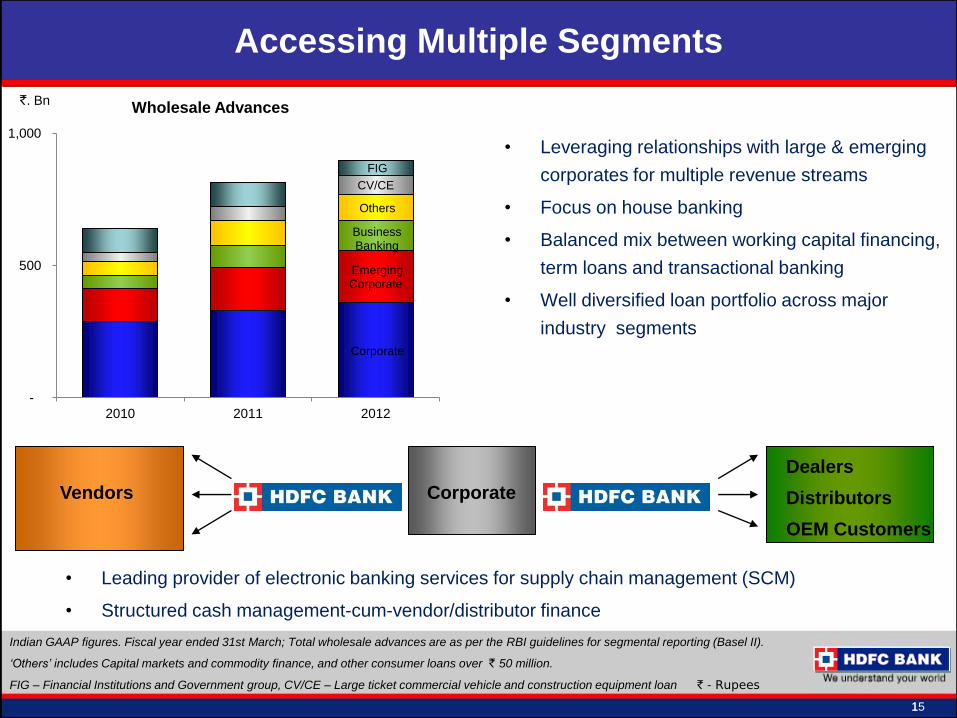
• Leading provider of electronic banking services for supply chain management (SCM)
• Structured cash management-cum-vendor/distributor finance
Corporate
Dealers
Distributors
OEM Customers
Vendors
`. Bn
Wholesale Advances
Indian GAAP figures. Fiscal year ended 31st March; Total wholesale advances are as per the RBI guidelines for segmental reporting (Basel II).
„Others‟ includes Capital markets and commodity finance, and other consumer loans over ` 50 million.
FIG – Financial Institutions and Government group, CV/CE – Large ticket commercial vehicle and construction equipment loan ` - Rupees
1 15
Accessing Multiple Segments
• Leveraging relationships with large & emerging
corporates for multiple revenue streams
• Focus on house banking
• Balanced mix between working capital financing,
term loans and transactional banking
• Well diversified loan portfolio across major
industry segments
Corporate
Emerging Corporate
Business Banking
Others
CV/CE
FIG
-
500
1,000
2010 2011 2012
0
850
1,700
2010 2011 2012
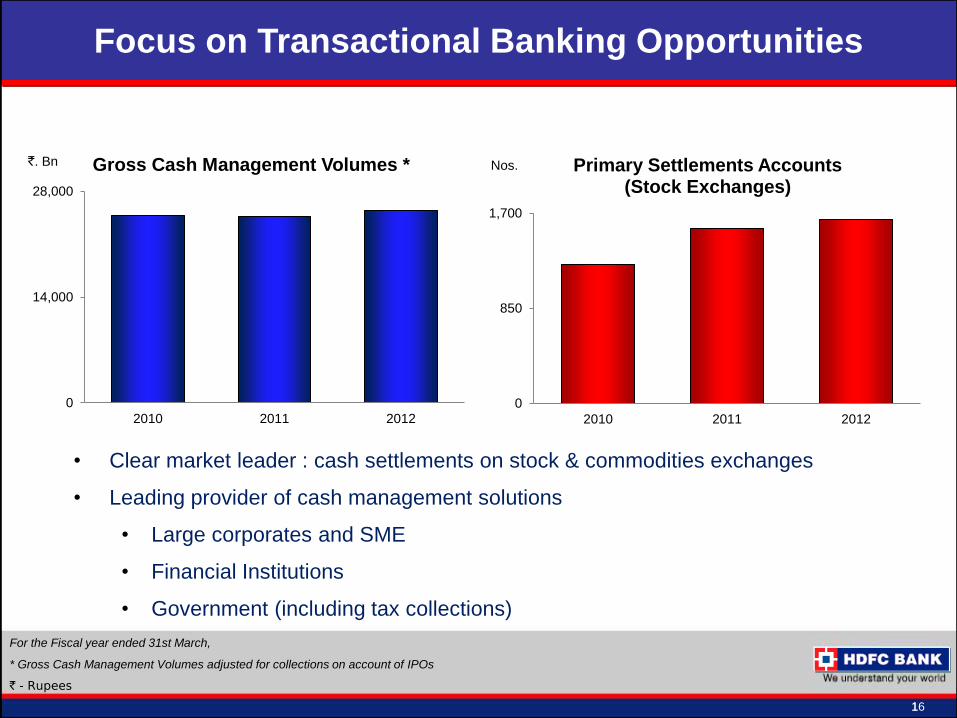
Primary Settlements Accounts (Stock Exchanges)
0
14,000
28,000
2010 2011 2012
Gross Cash Management Volumes * Nos.
• Clear market leader : cash settlements on stock & commodities exchanges
• Leading provider of cash management solutions
• Large corporates and SME
• Financial Institutions
• Government (including tax collections)
For the Fiscal year ended 31st March,
* Gross Cash Management Volumes adjusted for collections on account of IPOs
` - Rupees
`. Bn
1 16
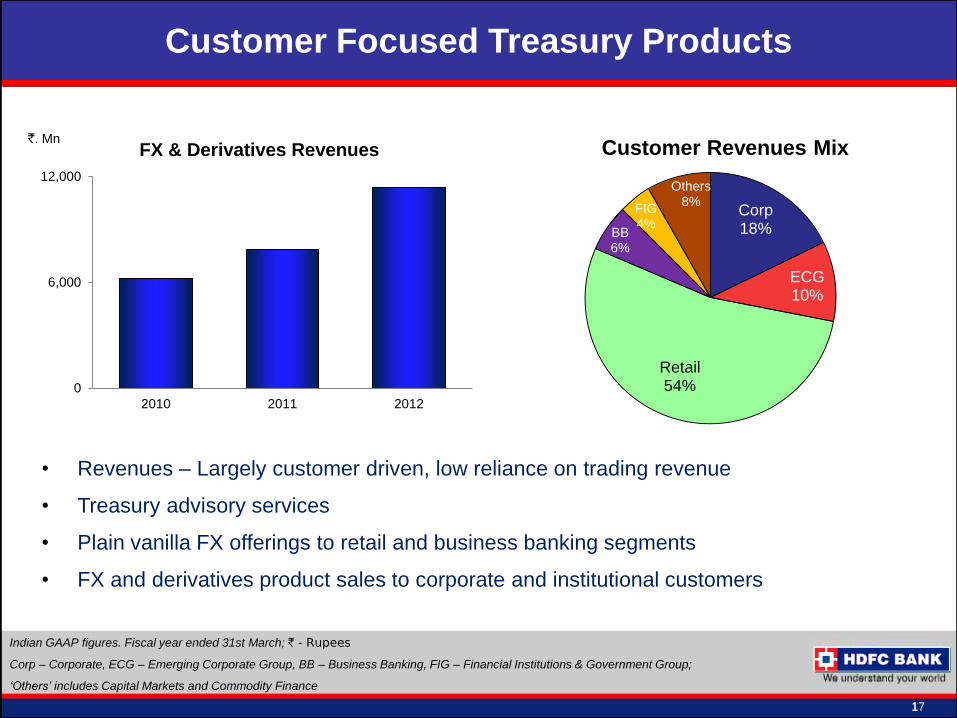
Focus on Transactional Banking Opportunities
0
6,000
12,000
2010 2011 2012
FX & Derivatives Revenues
• Revenues – Largely customer driven, low reliance on trading revenue
• Treasury advisory services
• Plain vanilla FX offerings to retail and business banking segments
• FX and derivatives product sales to corporate and institutional customers
Indian GAAP figures. Fiscal year ended 31st March; ` - Rupees
Corp – Corporate, ECG – Emerging Corporate Group, BB – Business Banking, FIG – Financial Institutions & Government Group;
„Others‟ includes Capital Markets and Commodity Finance
`. Mn
1 17
Customer Focused Treasury Products
Corp 18%
ECG 10%
Retail 54%
BB 6%
FIG 4%
Others 8%
Customer Revenues Mix
• Well diversified product mix
• Balancing volumes and market
share with margins and risk
• Home Loans* (Mortgage) offering
– origination (loan sanctions) now
around ` 8 Bn per month
• Loan losses within product pricing
parameters
`. Bn
Retail loans are net of loans sold and include loan assignments. Retail loans are classified as per RBI guidelines for segmental reporting (Basel II).
* In arrangement with HDFC Ltd., Others‟ includes Tractor Loans, Loans to Self Help Group, Retail overdrafts, Loans against Securities, etc
Indian GAAP figures. Fiscal year ended 31st March; ` - Rupees
1 18
Retail Loans – Profitable Growth
Auto Loans
Business Banking
Commercial Vehicles
Personal Loans
Home Loans
Others
Credit Cards
Gold Loans
Two Wheelers
0
600
1,200
2010 2011 2012
0
35
70
2010 2011 2012
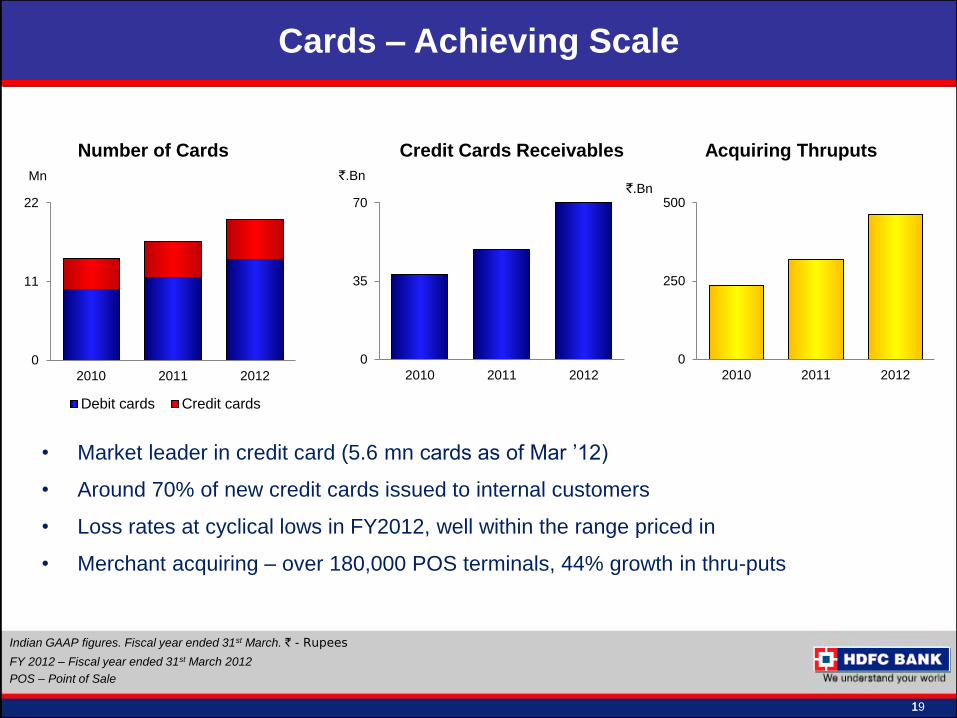
• Market leader in credit card (5.6 mn cards as of Mar ’12)
• Around 70% of new credit cards issued to internal customers
• Loss rates at cyclical lows in FY2012, well within the range priced in
• Merchant acquiring – over 180,000 POS terminals, 44% growth in thru-puts
Number of Cards Credit Cards Receivables Acquiring Thruputs
Indian GAAP figures. Fiscal year ended 31st March. ` - Rupees
FY 2012 – Fiscal year ended 31st March 2012
POS – Point of Sale
`.Bn `.Bn
Mn
1 19
Cards – Achieving Scale
0
11
22
2010 2011 2012
Debit cards Credit cards
0
250
500
2010 2011 2012
0
13
26
2010 2011 2012
Insurance Premium
Life General
0
600
1,200
2010 2011 2012
Mutual Fund Sales
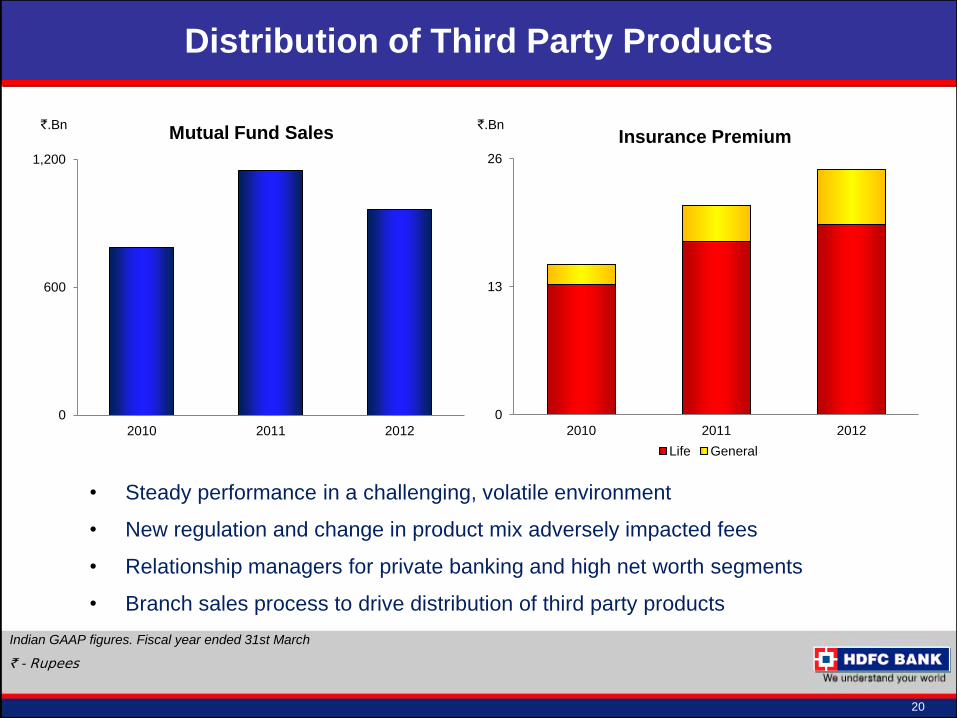
• Steady performance in a challenging, volatile environment
• New regulation and change in product mix adversely impacted fees
• Relationship managers for private banking and high net worth segments
• Branch sales process to drive distribution of third party products
Indian GAAP figures. Fiscal year ended 31st March
` - Rupees
20
Distribution of Third Party Products
`.Bn `.Bn
21
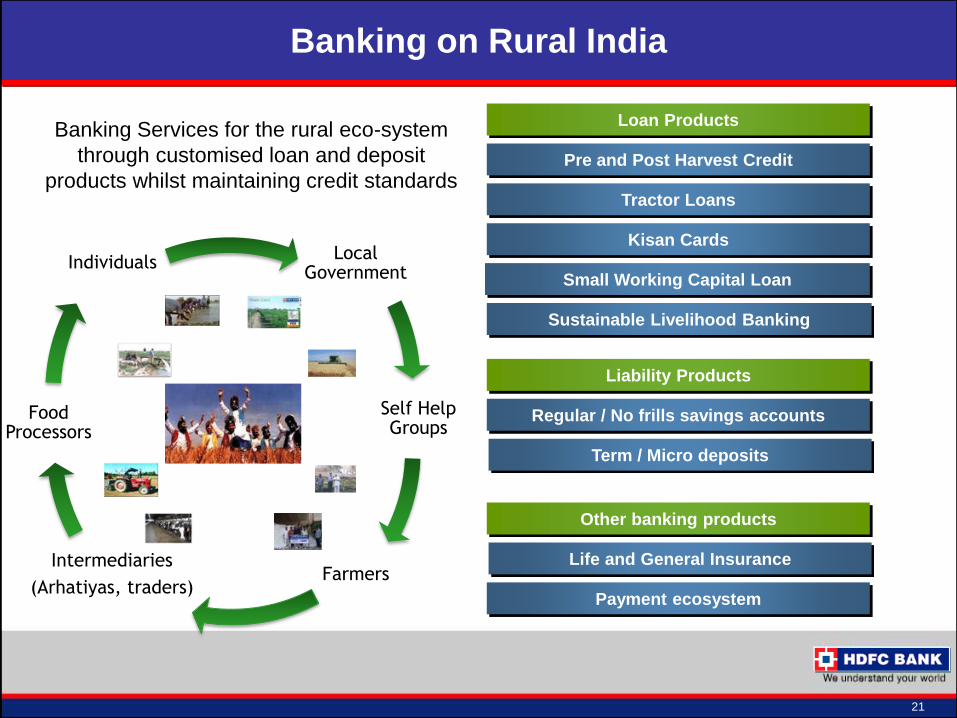
Banking on Rural India
Local Government
Self Help Groups
Farmers Intermediaries
(Arhatiyas, traders)
Food Processors
Individuals
Pre and Post Harvest Credit
Tractor Loans
Kisan Cards
Small Working Capital Loan
Regular / No frills savings accounts
Term / Micro deposits
Life and General Insurance
Payment ecosystem
Banking Services for the rural eco-system
through customised loan and deposit
products whilst maintaining credit standards
Other banking products
Liability Products
Sustainable Livelihood Banking
Loan Products
HDFC Securities Limited
• Amongst the top retail equity brokerages in the country
• Over 180 branches and 1.4 million customers
• Revenues from brokerage as well as distribution of financial products
• FY 2012 - Net Profit : ` 541 million
HDB Financial Services
• NBFC catering to certain customer segments not served by the Bank
• Inherently lower cost structure
• Network size of 180 branches
• FY 2012 - Loan book : ` 39,641 million, Net Profit : ` 511 million
22
Subsidiary Companies
` - Rupees
FY 2012 – Fiscal year ended March 31, 2012
Tracking the India Growth Story
Meeting Diverse Customers’ Needs
Unique Franchise in the Indian Banking Sector
Key Business Initiatives
Financial Highlights
Value Proposition
23
Contents
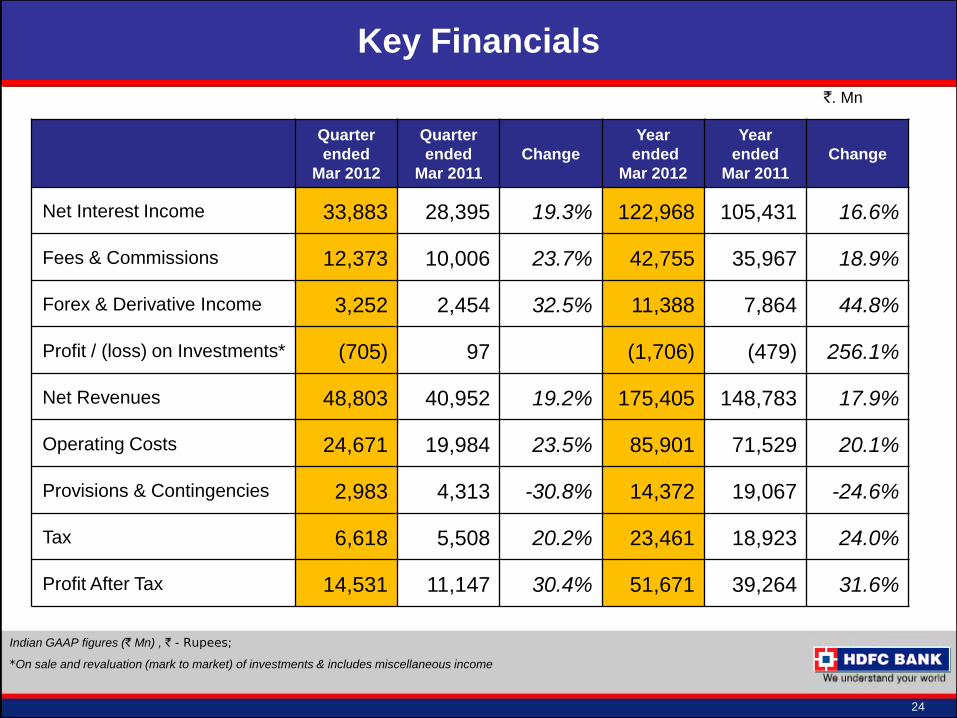
Indian GAAP figures (` Mn) , ` - Rupees;
*On sale and revaluation (mark to market) of investments & includes miscellaneous income
24
Key Financials
`. Mn
Quarter
ended
Mar 2012
Quarter
ended
Mar 2011
Change
Year
ended
Mar 2012
Year
ended
Mar 2011
Change
Net Interest Income 33,883 28,395 19.3% 122,968 105,431 16.6%
Fees & Commissions 12,373 10,006 23.7% 42,755 35,967 18.9%
Forex & Derivative Income 3,252 2,454 32.5% 11,388 7,864 44.8%
Profit / (loss) on Investments* (705) 97 (1,706) (479) 256.1%
Net Revenues 48,803 40,952 19.2% 175,405 148,783 17.9%
Operating Costs 24,671 19,984 23.5% 85,901 71,529 20.1%
Provisions & Contingencies 2,983 4,313 -30.8% 14,372 19,067 -24.6%
Tax 6,618 5,508 20.2% 23,461 18,923 24.0%
Profit After Tax 14,531 11,147 30.4% 51,671 39,264 31.6%
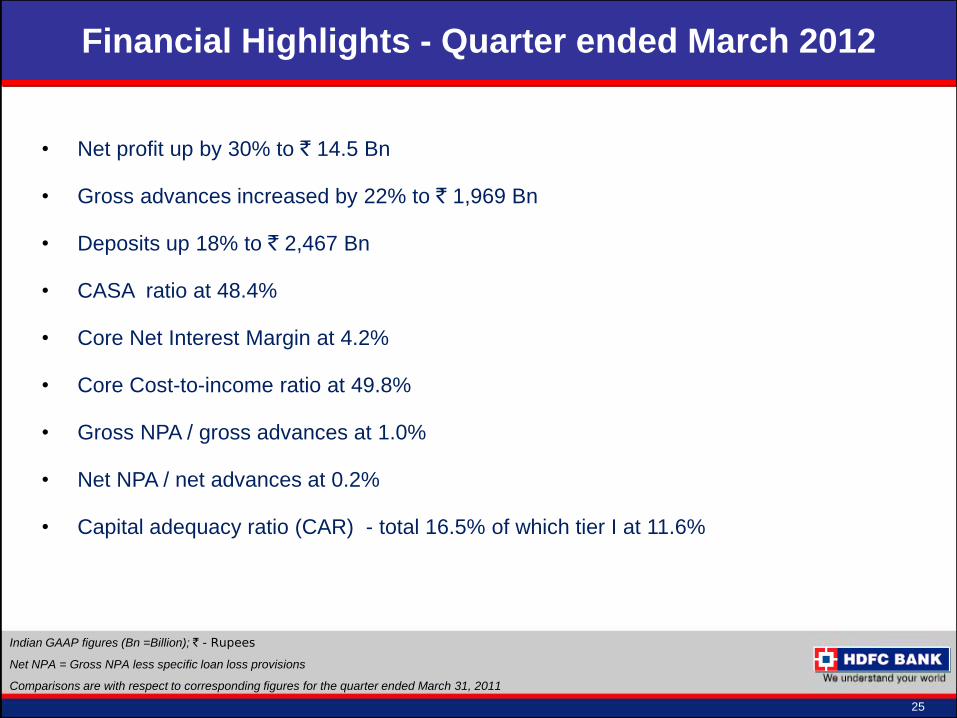
• Net profit up by 30% to ` 14.5 Bn
• Gross advances increased by 22% to ` 1,969 Bn
• Deposits up 18% to ` 2,467 Bn
• CASA ratio at 48.4%
• Core Net Interest Margin at 4.2%
• Core Cost-to-income ratio at 49.8%
• Gross NPA / gross advances at 1.0%
• Net NPA / net advances at 0.2%
• Capital adequacy ratio (CAR) - total 16.5% of which tier I at 11.6%
25
Indian GAAP figures (Bn =Billion); ` - Rupees
Net NPA = Gross NPA less specific loan loss provisions
Comparisons are with respect to corresponding figures for the quarter ended March 31, 2011
Financial Highlights - Quarter ended March 2012
Tracking the India Growth Story
Meeting Diverse Customers’ Needs
Unique Franchise in the Indian Banking Sector
Key Business Initiatives
Financial Highlights
Value Proposition
26
Contents
27
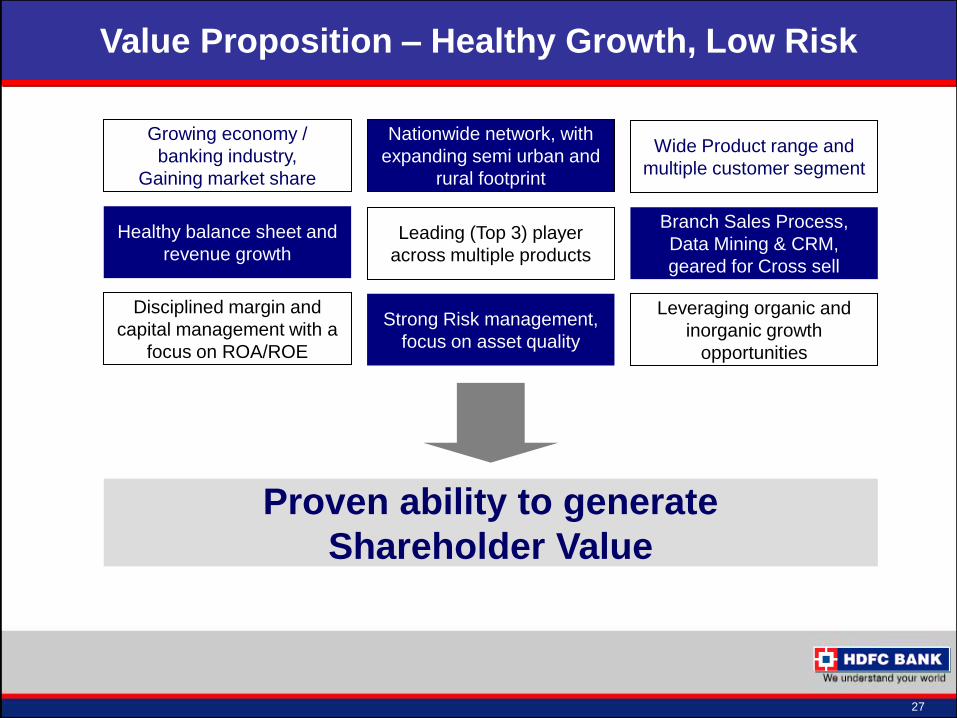
Value Proposition – Healthy Growth, Low Risk
Healthy balance sheet and
revenue growth
Leveraging organic and
inorganic growth
opportunities
Proven ability to generate
Shareholder Value
Branch Sales Process,
Data Mining & CRM,
geared for Cross sell
Strong Risk management,
focus on asset quality
Disciplined margin and
capital management with a
focus on ROA/ROE
Nationwide network, with
expanding semi urban and
rural footprint
Growing economy /
banking industry,
Gaining market share
Leading (Top 3) player
across multiple products
Wide Product range and
multiple customer segment
Certain statements are included in this release which contain words or phrases such as “will,” “aim,” “will likely
result,” “believe,” “expect,” “will continue,” “anticipate,” “estimate,” “intend,” “plan,” “contemplate,” “seek to,”
“future,” “objective,” “goal,” “project,” “should,” “will pursue” and similar expressions or variations of these
expressions that are “forward-looking statements.” Actual results may differ materially from those suggested by
the forward-looking statements due to certain risks or uncertainties associated with our expectations with respect
to, but not limited to, our ability to implement our strategy successfully, the market acceptance of and demand for
various banking services, future levels of our non-performing loans, our growth and expansion, the adequacy of
our allowance for credit and investment losses, technological changes, volatility in investment income, our ability
to market new products ,cash flow projections, our outcome of any legal, tax or regulatory proceedings in India
and in other jurisdictions we are or become a party to, the future impact of new accounting standards, our ability
to pay dividends, the impact of changes in banking regulations and other regulatory changes in India and other
jurisdictions on us, our ability to roll over our short-term funding sources and our exposure to market and
operational risks. By their nature, certain of the market risk disclosures are only estimates and could be materially
different from what may actually occur in the future. As a result, actual future gains, losses or impact on net
income could materially differ from those that have been estimated.
In addition, other factors that could cause actual results to differ materially from those estimated by the forward-
looking statements contained in this document include, but are not limited to: general economic and political
conditions in India and the other countries which have an impact on our business activities or investments; the
monetary and interest rate policies of the government of India; inflation, deflation, unanticipated turbulence in
interest rates, foreign exchange rates, equity prices or other rates or prices; the performance of the financial
markets in India and globally; changes in Indian and foreign laws and regulations, including tax, accounting and
banking regulations; changes in competition and the pricing environment in India; and regional or general
changes in asset valuations.