investor roadshow | february 28,...
TRANSCRIPT
Investor Roadshow | February 28, 2018
Investor Roadshow | February 28, 2018
Investor Roadshow | February 28, 2018
Forward-Looking Statements
2
Certain statements in these slides and made during this presentation may be considered forward-looking
statements. These statements reflect management’s current views and are subject to risks and uncertainties
that could cause actual results to differ materially from those expressed or implied in these statements.
Factors which could cause actual results to differ include but are not limited to: (i) the level of our
indebtedness and changes in interest rates; (ii) industry conditions, including but not limited to changes in
the cost or availability of raw materials, energy and transportation costs, competition we face, cyclicality and
changes in consumer preferences, demand and pricing for our products; (iii) global economic conditions and
political changes, including but not limited to the impairment of financial institutions, changes in currency
exchange rates, credit ratings issued by recognized credit rating organizations, the amount of our future
pension funding obligation, changes in tax laws and pension and health care costs; (iv) unanticipated
expenditures related to the cost of compliance with existing and new environmental and other governmental
regulations and to actual or potential litigation; (v) whether we experience a material disruption at one of our
manufacturing facilities; (vi) risks inherent in conducting business through joint ventures; and (vii) our ability
to achieve the benefits we expect from strategic acquisitions, divestitures and restructurings. These and
other factors that could cause or contribute to actual results differing materially from such forward-looking
statements are discussed in greater detail in the Company’s Securities and Exchange Commission filings.
We undertake no obligation to publicly update any forward-looking statements, whether as a result of new
information, future events or otherwise.
Investor Roadshow | February 28, 2018
Statements Relating to Non-GAAP Financial Measures
3
During the course of this presentation, certain non U.S. GAAP financial measures
will be presented, such as Adjusted Operating EPS, Adjusted EBIT, Adjusted
EBITDA, Adjusted EBITDA Margin, Free Cash Flow, Cash Conversion and Adjusted
ROIC.
A reconciliation of all presented non-GAAP measures (and their components) to
U.S. GAAP financial measures is available on the company’s website at
internationalpaper.com under Performance/Investors.
Investor Roadshow | February 28, 2018
Ilim JV and GPK Investment Information
4
All financial information and statistical measures regarding our 50/50 Ilim joint
venture in Russia (“Ilim”) and our 20.5% ownership interest in a subsidiary of
Graphic Packaging Holding Company (“GPK”), other than historical International
Paper Equity Earnings and dividends received by International Paper, have been
prepared by the management of Ilim and GPK, respectively. Any projected
financial information and statistical measures reflect the current views of Ilim and
GPK management and are subject to risks and uncertainties that could cause
actual results to differ materially from those expressed or implied by such
projections. See “Forward-Looking Statements.”
Investor Roadshow | February 28, 2018
Investment Thesis
Investor Roadshow | February 28, 2018
IP Investment Thesis
6
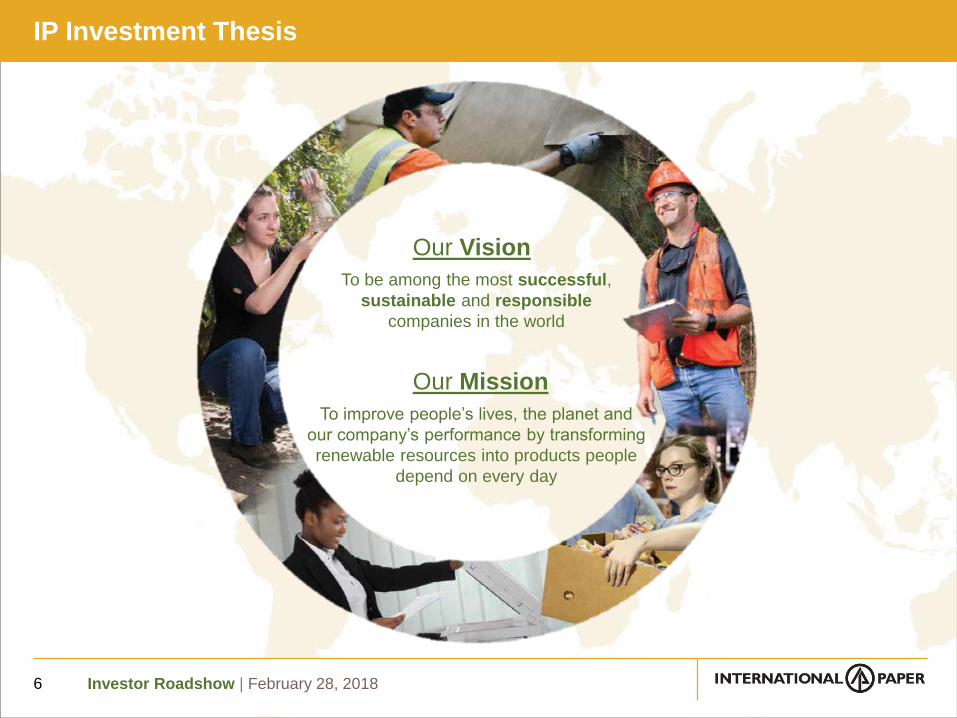
Our Vision
To be among the most successful,
sustainable and responsible
companies in the world
Our Mission
To improve people’s lives, the planet and
our company’s performance by transforming
renewable resources into products people
depend on every day

Investor Roadshow | February 28, 2018
IP Investment Thesis | About Us
7
We are one of the world’s leading producers of fiber-
based packaging, pulp and paper
We transform renewable resources into recyclable
products people depend on every day
We do the right things, in the right ways,
for the right reasons, all of the time.
Who We
Are
What
We Do
How We
Do It
Investor Roadshow | February 28, 2018
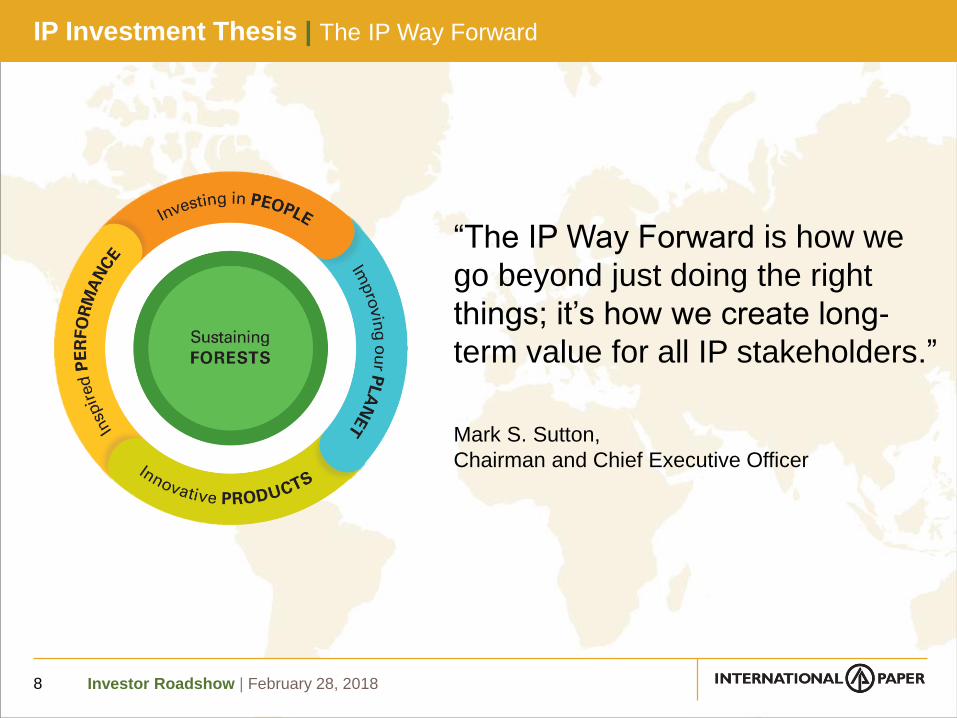
IP Investment Thesis | The IP Way Forward
8
“The IP Way Forward is how we
go beyond just doing the right
things; it’s how we create long-
term value for all IP stakeholders.”
Mark S. Sutton,
Chairman and Chief Executive Officer

Investor Roadshow | February 28, 2018
IP Investment Thesis | Leveraging Selective Choices
9
Cost Positions
• Low-cost asset base
− Mill footprint on cost curve
− Disciplined capital
investment
• Sustained low-cost
positions through
operational excellence
and optimization
• Fiber-based Packaging, Pulp and Paper
• Advantaged positions in Attractive markets
Strategy
Renewable
Natural Resources
Availability and access to
low-cost, sustainable fiber
in key manufacturing
regions
Channels to Market
• Strong market positions
• Sell products in markets
where they are valued
• Winning with the right
customers and segments
Investor Roadshow | February 28, 2018
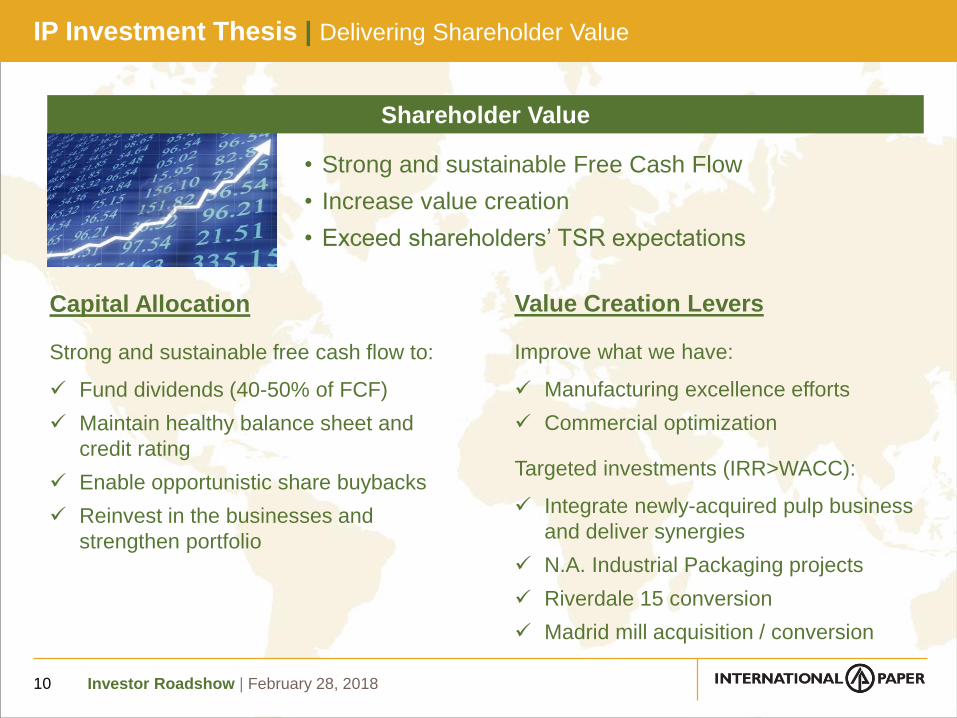
IP Investment Thesis | Delivering Shareholder Value
10
Capital Allocation
Strong and sustainable free cash flow to:
Fund dividends (40-50% of FCF)
Maintain healthy balance sheet and
credit rating
Enable opportunistic share buybacks
Reinvest in the businesses and
strengthen portfolio
• Strong and sustainable Free Cash Flow
• Increase value creation
• Exceed shareholders’ TSR expectations
Shareholder Value
Value Creation Levers
Improve what we have:
Manufacturing excellence efforts
Commercial optimization
Targeted investments (IRR>WACC):
Integrate newly-acquired pulp business
and deliver synergies
N.A. Industrial Packaging projects
Riverdale 15 conversion
Madrid mill acquisition / conversion
Investor Roadshow | February 28, 2018
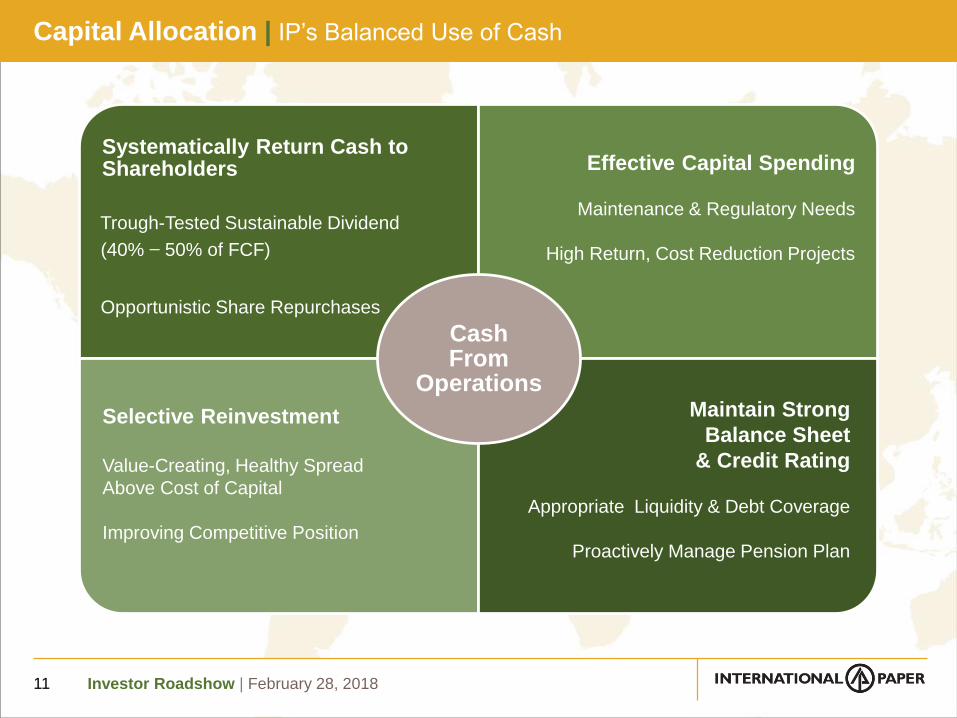
Capital Allocation | IP’s Balanced Use of Cash
11
Systematically Return Cash to Shareholders
Trough-Tested Sustainable Dividend
(40% − 50% of FCF)
Opportunistic Share Repurchases
CashFrom
OperationsMaintain Strong
Balance Sheet
& Credit Rating
Appropriate Liquidity & Debt Coverage
Proactively Manage Pension Plan
Selective Reinvestment
Value-Creating, Healthy Spread
Above Cost of Capital
Improving Competitive Position
Effective Capital Spending
Maintenance & Regulatory Needs
High Return, Cost Reduction Projects
Investor Roadshow | February 28, 2018
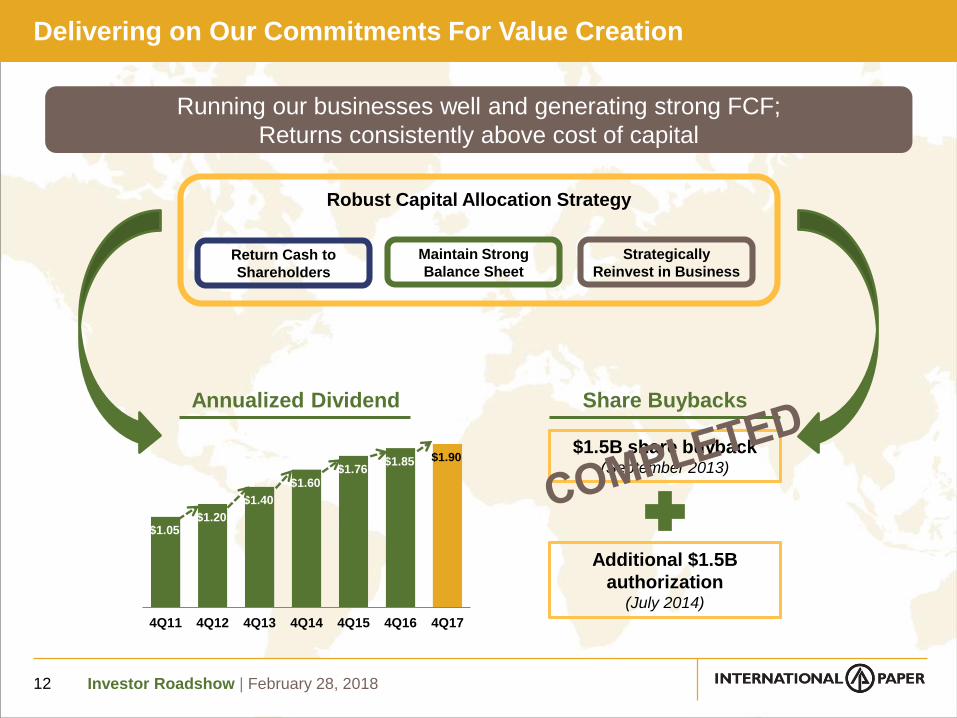
Delivering on Our Commitments For Value Creation
12
Strategically
Reinvest in BusinessReturn Cash to
Shareholders
Maintain Strong
Balance Sheet
Robust Capital Allocation Strategy
Annualized Dividend Share Buybacks
$1.5B share buyback (September 2013)
Additional $1.5B
authorization(July 2014)
Running our businesses well and generating strong FCF;
Returns consistently above cost of capital
$1.05 $1.20
$1.40
$1.60 $1.76
$1.85 $1.90
4Q11 4Q12 4Q13 4Q14 4Q15 4Q16 4Q17
Investor Roadshow | February 28, 2018
Global Economic
Recession
$1.8
$2.1
$1.8 $1.9$2.0
$0.0
$0.5
$1.0
$1.5
$2.0
$2.5
2005 2006 2007 2008 2009 2010 2011 2012 2013 2014 2015 2016 2017
$ B
illi
on
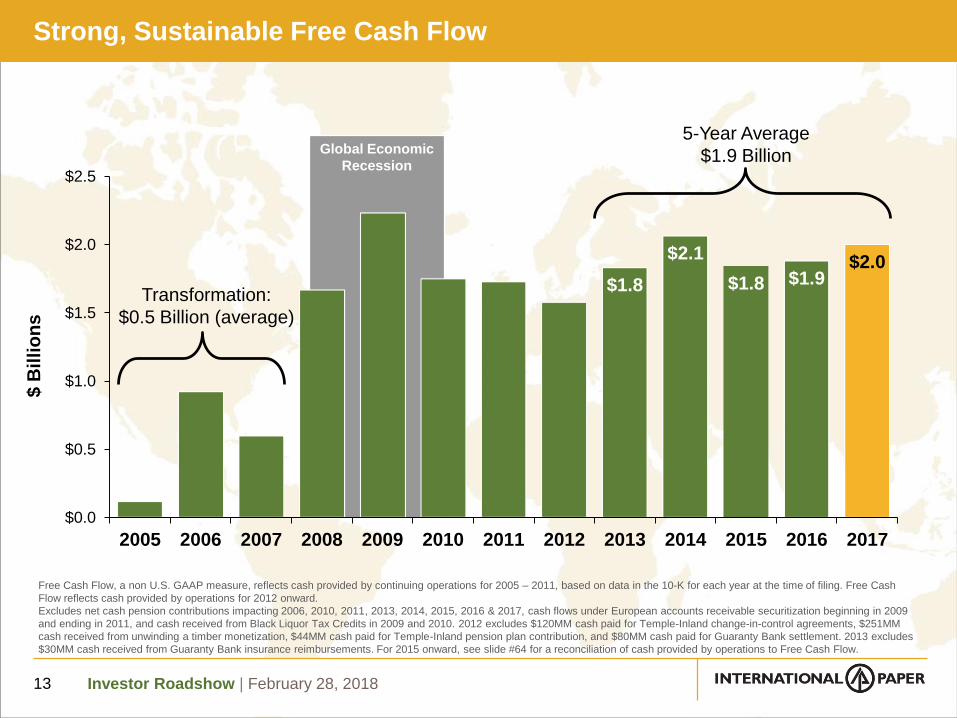
sStrong, Sustainable Free Cash Flow
13
Free Cash Flow, a non U.S. GAAP measure, reflects cash provided by continuing operations for 2005 – 2011, based on data in the 10-K for each year at the time of filing. Free Cash
Flow reflects cash provided by operations for 2012 onward.
Excludes net cash pension contributions impacting 2006, 2010, 2011, 2013, 2014, 2015, 2016 & 2017, cash flows under European accounts receivable securitization beginning in 2009
and ending in 2011, and cash received from Black Liquor Tax Credits in 2009 and 2010. 2012 excludes $120MM cash paid for Temple-Inland change-in-control agreements, $251MM
cash received from unwinding a timber monetization, $44MM cash paid for Temple-Inland pension plan contribution, and $80MM cash paid for Guaranty Bank settlement. 2013 excludes
$30MM cash received from Guaranty Bank insurance reimbursements. For 2015 onward, see slide #64 for a reconciliation of cash provided by operations to Free Cash Flow.
Transformation:
$0.5 Billion (average)
5-Year Average
$1.9 Billion
Investor Roadshow | February 28, 2018
Global
Economic
Recession
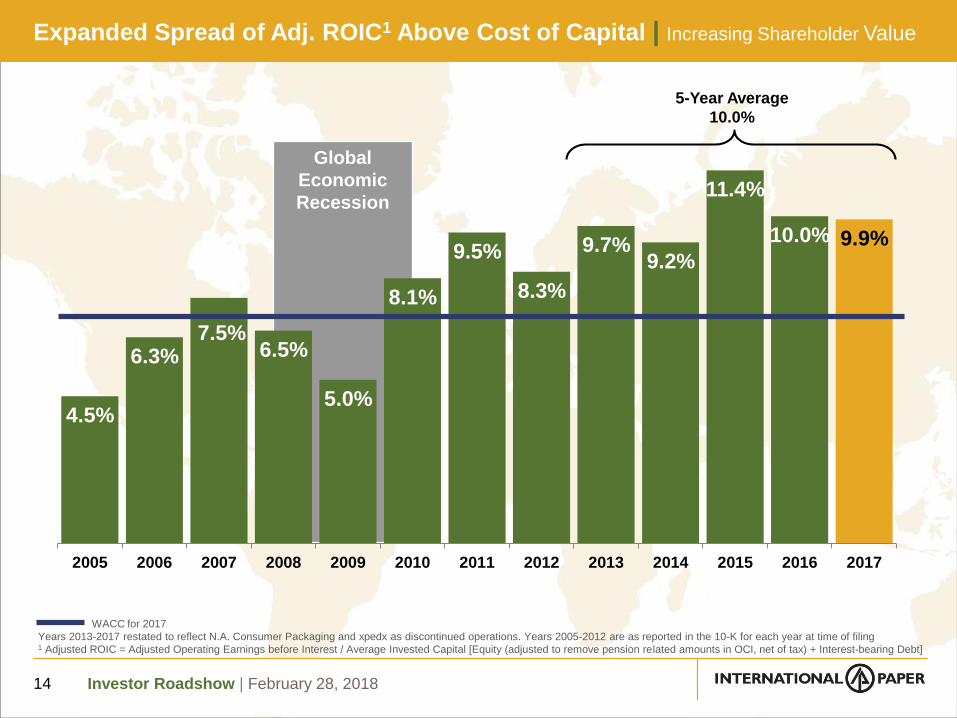
4.5%
6.3%7.5%
6.5%
5.0%
8.1%
9.5%
8.3%
9.7%9.2%
11.4%
10.0% 9.9%
2005 2006 2007 2008 2009 2010 2011 2012 2013 2014 2015 2016 2017
Expanded Spread of Adj. ROIC1 Above Cost of Capital | Increasing Shareholder Value
14
5-Year Average
10.0%
WACC for 2017
Years 2013-2017 restated to reflect N.A. Consumer Packaging and xpedx as discontinued operations. Years 2005-2012 are as reported in the 10-K for each year at time of filing1 Adjusted ROIC = Adjusted Operating Earnings before Interest / Average Invested Capital [Equity (adjusted to remove pension related amounts in OCI, net of tax) + Interest-bearing Debt]
Investor Roadshow | February 28, 2018
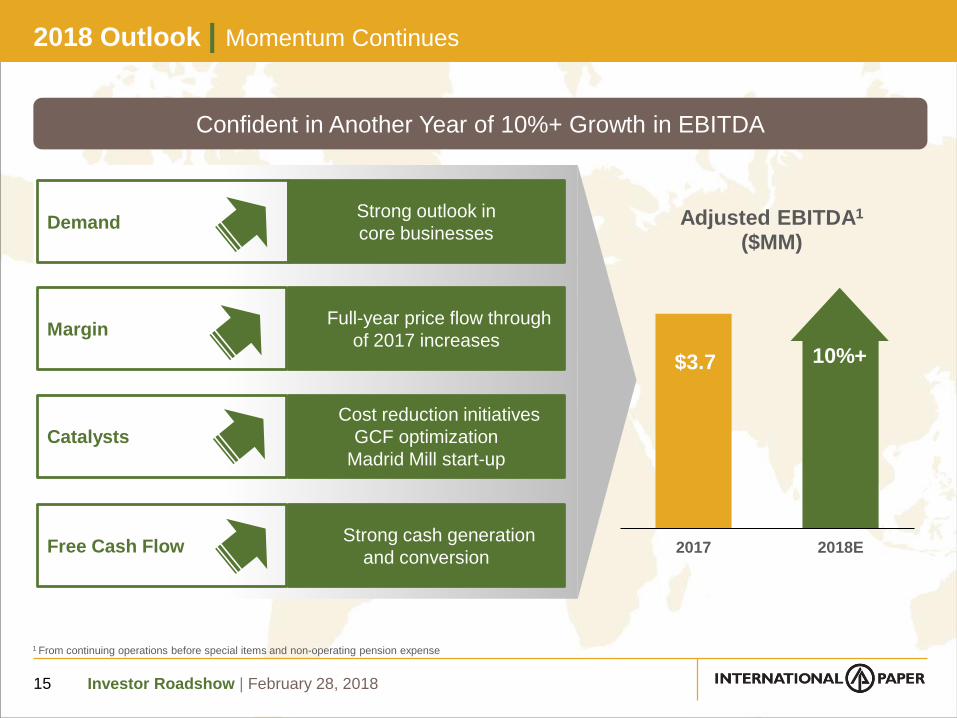
2018 Outlook | Momentum Continues
15
Confident in Another Year of 10%+ Growth in EBITDA
Free Cash FlowStrong cash generation
and conversion
Strong outlook in
core businessesDemand
Catalysts
Cost reduction initiatives
GCF optimization
Madrid Mill start-up
MarginFull-year price flow through
of 2017 increases
$3.7
2017 2018E
Adjusted EBITDA1
($MM)
10%+
1 From continuing operations before special items and non-operating pension expense

Investor Roadshow | February 28, 2018
Business Overview

Investor Roadshow | February 28, 2018
2005 - 2007 2008 - 2010 2011+
IP Transformation Timeline/Plan
Transformation Plan
Divestitures & Strategic
Reinvestment
Global Recession IP Achieves Cost of Capital Returns
N.A. Weyco Pkg.
Acquisition
Russia
Ilim JV
India APPM
AcquisitionChina
Sun JV
Brazil
VCP Land / Mill Swap
Coated Papers
Wood Products
Forestland
Kraft Paper
Chemicals
Beverage Pkg.
$11B
Asset Sales
China
SCA Pkg.
Brazil
Grupo Orsa Pkg.
N.A. TIN
Acquisition
Turkey
Olmuksan Pkg.
17
Franklin Fluff
Pulp
Conversion
TIN Bldg.
Products
Sale
xpedx
Spin-Off
Riegelwood
Fluff Pulp
ConversionValliant
PM3
Sun JV
& Asia
Box Sale
Madrid mill
Acquisition
Weyco Pulp
Business
Acquisition
N.A. Consumer
Pkg Transfer

Investor Roadshow | February 28, 201818
NorthAmerica
Brazil
EMEA &Russia
India
Positioned in attractive markets with low-cost assets that generate strong free cash flow and returns that exceed our cost-of-capital
$17.6BNet Sales
$1.2BNet Sales
$3.0BNet Sales
$0.2BNet Sales
Full-year 2017 net sales data1 Ilim JV total sales are not consolidated (IP owns 50% of JV)
International Paper | 2017 Global Portfolio in Packaging, Pulp and Paper
$2.2B1
Ilim JV
Total Sales
Investor Roadshow | February 28, 201819
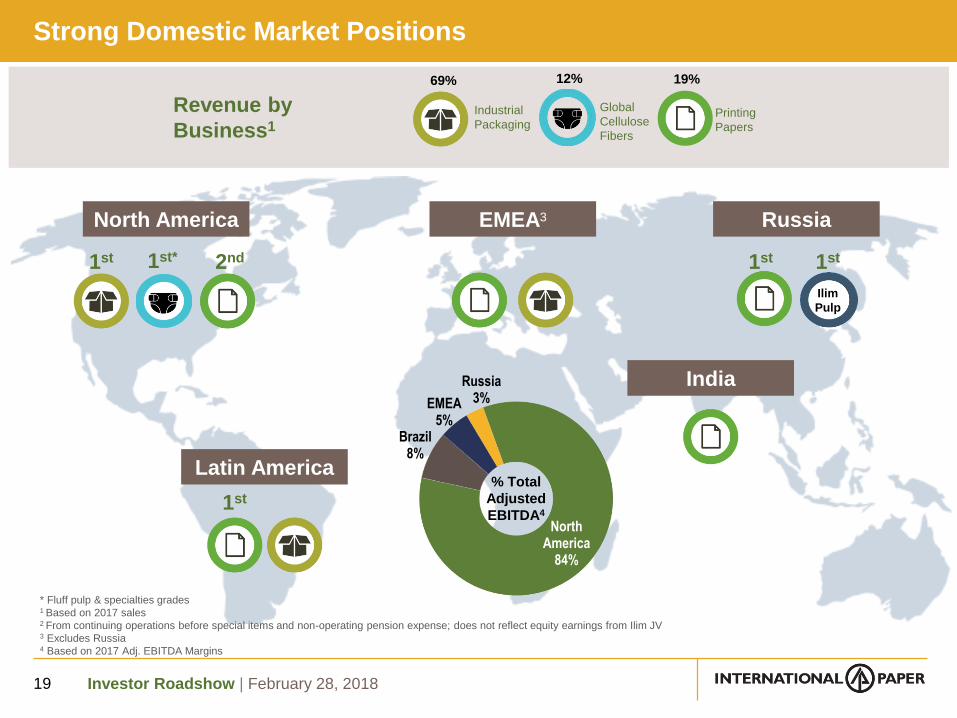
Strong Domestic Market Positions
1st
1st
North America
Latin America
EMEA3
NorthAmerica
84%
Brazil8%
EMEA5%
Russia3%
% Total
Adjusted
EBITDA4
2nd
India
Industrial
Packaging
Revenue by
Business1Printing
Papers
69% 19%
Russia
1st 1st
Ilim
Pulp
* Fluff pulp & specialties grades1 Based on 2017 sales2 From continuing operations before special items and non-operating pension expense; does not reflect equity earnings from Ilim JV3 Excludes Russia4 Based on 2017 Adj. EBITDA Margins
Global
Cellulose
Fibers
12%
1st*

Investor Roadshow | February 28, 2018
N.A. Exports | Leveraging Strategic Export Opportunities
20
Fluff Pulp(~90% of N.A. production)
Containerboard(~10% of N.A. production)
EMEA
Asia
Latin America
~50%~40%
~15%
~45%
~40%~10%
% of export volume shipped to select regions
Investor Roadshow | February 28, 201821
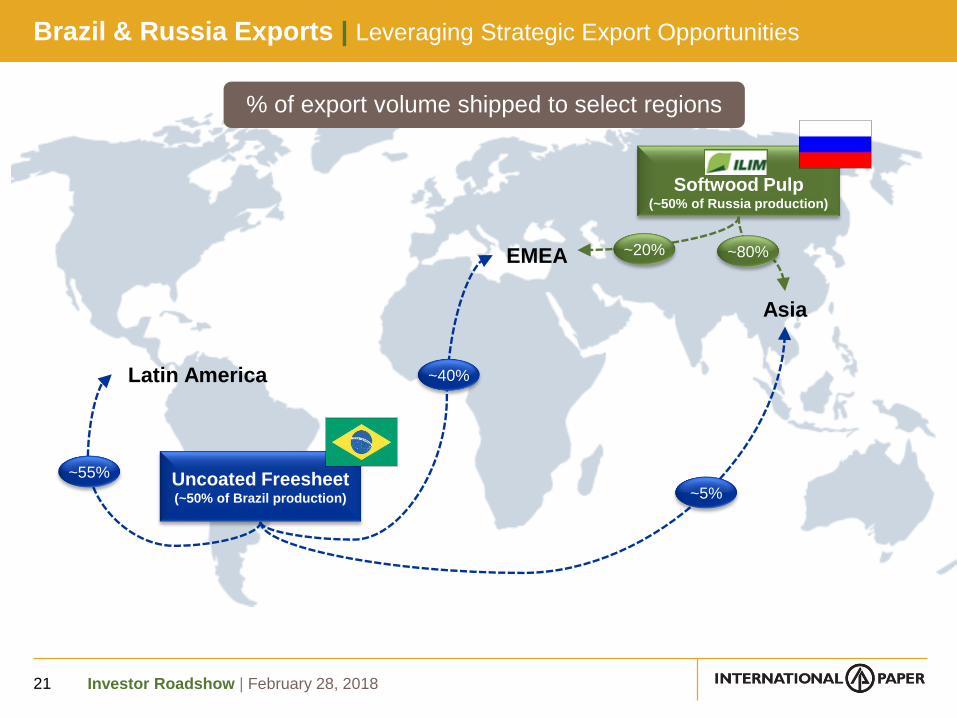
Brazil & Russia Exports | Leveraging Strategic Export Opportunities
Softwood Pulp(~50% of Russia production)
Uncoated Freesheet(~50% of Brazil production)
EMEA
Asia
Latin America ~40%
~55%
~5%
~80%~20%
% of export volume shipped to select regions

Investor Roadshow | February 28, 2018
Global
Recession
N.A. Industrial Packaging | Track Record of Success
22
Bu
sin
ess
Ad
j. EB
ITD
A ($
B)
Weyco Packaging
Acquisition & IntegrationAdj.
EBITDA %
IP Adjusted EBITDA margins based on North American Industrial Packaging operating profit before special items
Excludes the Recycling Business and revenue from trade volumes
0.3 0.4 0.5
0.8
1.3 1.31.6
2.0
2.52.7 2.7
2.42.6
9%
13%15% 15%
19%18%
20%19%
22%24% 24%
22% 22%
0%
5%
10%
15%
20%
25%
2005 2006 2007 2008 2009 2010 2011 2012 2013 2014 2015 2016 2017
Th
ou
san
ds
TIN Acquisition
& Integration
Growth and Margin Expansion through Strategic Acquisitions
and Successful Integrations
Investor Roadshow | February 28, 2018
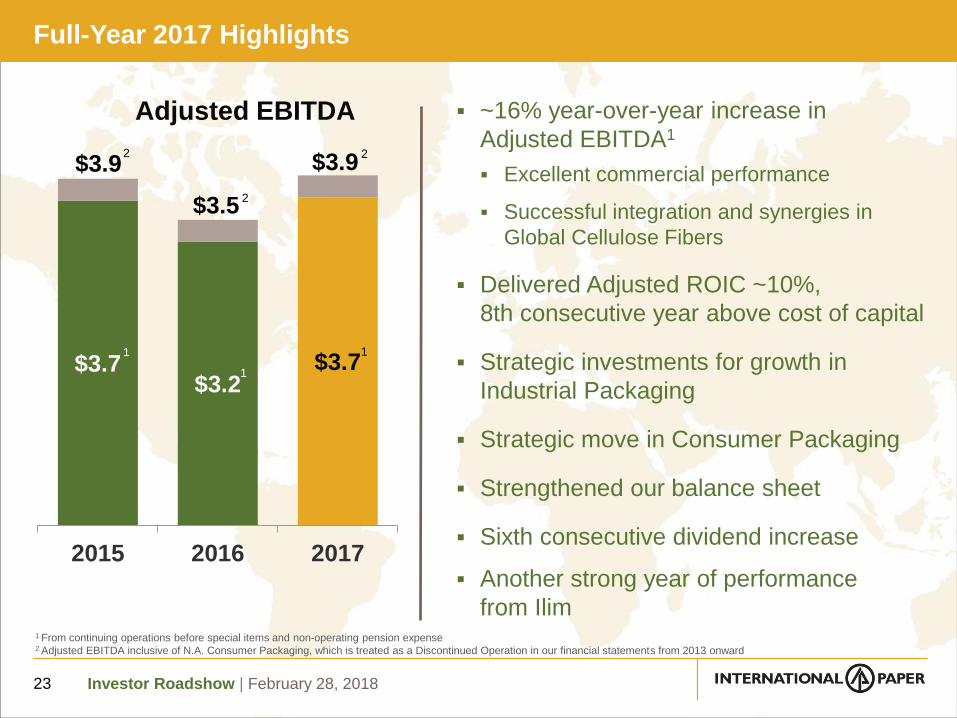
$3.7$3.2
$3.7
2015 2016 2017
Adjusted EBITDA
$3.9
Full-Year 2017 Highlights
~16% year-over-year increase in
Adjusted EBITDA1
Excellent commercial performance
Successful integration and synergies in
Global Cellulose Fibers
Delivered Adjusted ROIC ~10%,
8th consecutive year above cost of capital
Strategic investments for growth in
Industrial Packaging
Strategic move in Consumer Packaging
Strengthened our balance sheet
Sixth consecutive dividend increase
Another strong year of performance
from Ilim
23
1 From continuing operations before special items and non-operating pension expense2 Adjusted EBITDA inclusive of N.A. Consumer Packaging, which is treated as a Discontinued Operation in our financial statements from 2013 onward
1
1
1
$3.5
$3.92
2
2

Investor Roadshow | February 28, 2018
Full-Year 2017 Financial Results
24
$ Billion(Except as noted)
2015 2016 2017
Sales $20.7 $19.5 $21.7
Adj. EBIT1 $2.5 $2.1 $2.4
Adj. Operating EPS2 $3.44 $3.09 $3.49
Adj. Operating EPS with Discontinued Operations3 $3.65 $3.35 $3.66
Operating EPS impact of IlimF/X4 – IP Share ($0.18) $0.06 $0.04
Adj. EBITDA1 $3.7 $3.2 $3.7
Adj. EBITDA Margin 17.7% 16.6% 17.2%
Equity Earnings ($MM) $117 $198 $177
FCF5 $1.8 $1.9 $2.0
Year-End Debt $9.3 $11.3 $11.2
All financials, with the exception of Free Cash Flow, have been restated to reflect N.A. Consumer Packaging as a Discontinued Operation from 2013 onward1 From continuing operations before special items and non-operating pension expense2 Adjusted operating EPS based on Adjusted Operating Earnings (defined as Net Earnings (GAAP) from continuing operations before special items and non-operating pension expense3 Excluding non-operating pension expense and special items related to discontinued operations of ($0.07) and ($0.02), respectively in 2017 (2016 includes ($0.01) related to xpedx)4 Represents F/X impact including that related to Ilim JV USD-denominated net debt (balance of ~$0.9B at year end 2017)5 See slide #64 for a reconciliation of cash provided by operations to Free Cash Flow
$1.8 $1.9 $2.0
2015 2016 2017
FCF5
($MM)

Investor Roadshow | February 28, 2018
4Q17 Financial Results
25
4Q16 3Q17 4Q17
Sales ($B) $5.0 $5.5 $5.7
Adj. EBIT1 ($MM) $461 $665 $831
Adj. Operating EPS2 $0.67 $1.01 $1.27
Adj. Operating EPS with Discontinued Operations3 $0.73 $1.08 $1.34
Operating EPS impact of Ilim F/X4 – IP Share
$0.01 $0.02 $0.01
Adj. EBITDA1 ($MM) $0.8 $1.0 $1.2
Adj. EBITDA Margin1 15.3% 18.2% 20.5%
Equity Earnings ($MM) $47 $45 $64
Free Cash Flow5 ($MM) $467 $624 $732
All financials, with the exception of Free Cash Flow, have been restated to reflect N.A. Consumer Packaging as a Discontinued Operation from 2013 onward1 From continuing operations before special items and non-operating pension expense2 Adjusted operating EPS based on Adjusted Operating Earnings (defined as Net Earnings (GAAP) from continuing operations before special items and non-operating pension expense3 Excluding non-operating pension expense and special items related to discontinued operations of $0.00, $0.00 and $0.09 for 4Q16, 3Q17 and 4Q17, respectively4 Represents F/X impact including that related to Ilim JV USD-denominated net debt (balance of ~$0.9B at end of 4Q17)5 See slide #64 for a reconciliation of cash provided by operations to free cash flow
Record Operating EPS in 4Q17
Healthy industry conditions
Record volume in N.A. Industrial
Packaging and Global Cellulose
Fibers
Full realization of first half 2017
price increases
Successful realization of
Global Cellulose Fibers synergies
Strong performance from Ilim;
IP equity earnings of $64MM
Investor Roadshow | February 28, 2018
Appendix

Investor Roadshow | February 28, 2018
Appendix - Table of Contents
Industrial Packaging……………….………………………………….…..28-39
Global Cellulose Fibers………………………………………………......40-46
Printing Papers..……….…………………………………………………..47-57
IP Russia & Ilim Group.………….….……………………………….……58-61
Graphic Packaging Investment…………………………………….……62
Other Financial Information…..………………………………….….......63-81
Global Citizenship………….…..………………………………….….......82-84
Contact Information……………….………………………………….……85
Slides
27
Investor Roadshow | February 28, 2018
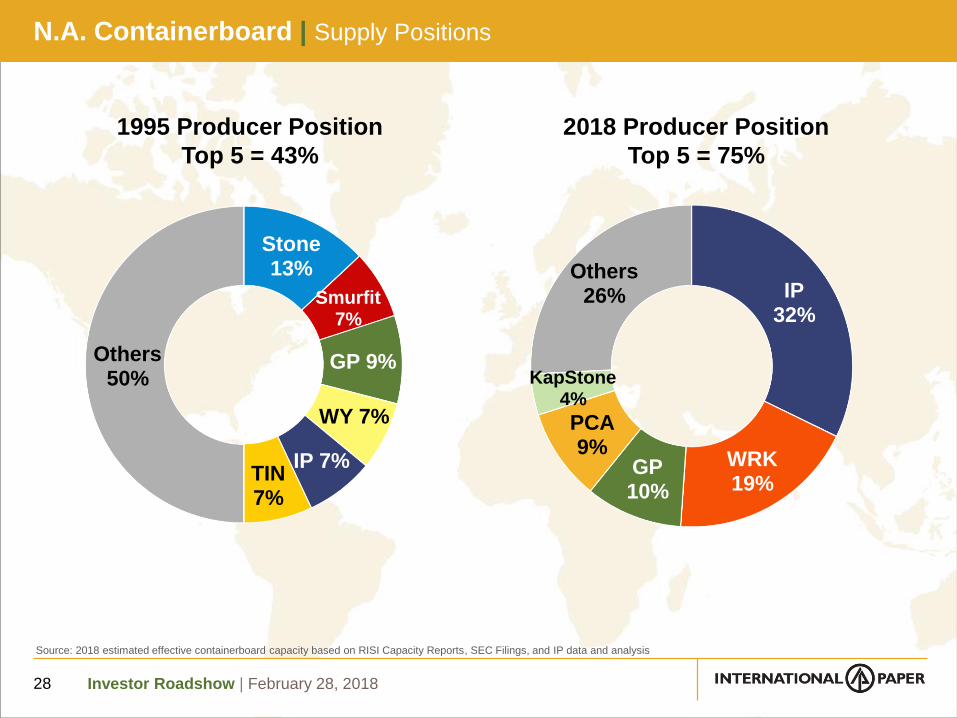
N.A. Containerboard | Supply Positions
28
Source: 2018 estimated effective containerboard capacity based on RISI Capacity Reports, SEC Filings, and IP data and analysis
2018 Producer Position
Top 5 = 75%
IP32%
WRK19%
GP10%
PCA9%
KapStone4%
Others26%
Stone13%
Smurfit7%
GP 9%
WY 7%
IP 7%TIN7%
Others 50%
1995 Producer Position
Top 5 = 43%
Investor Roadshow | February 28, 2018
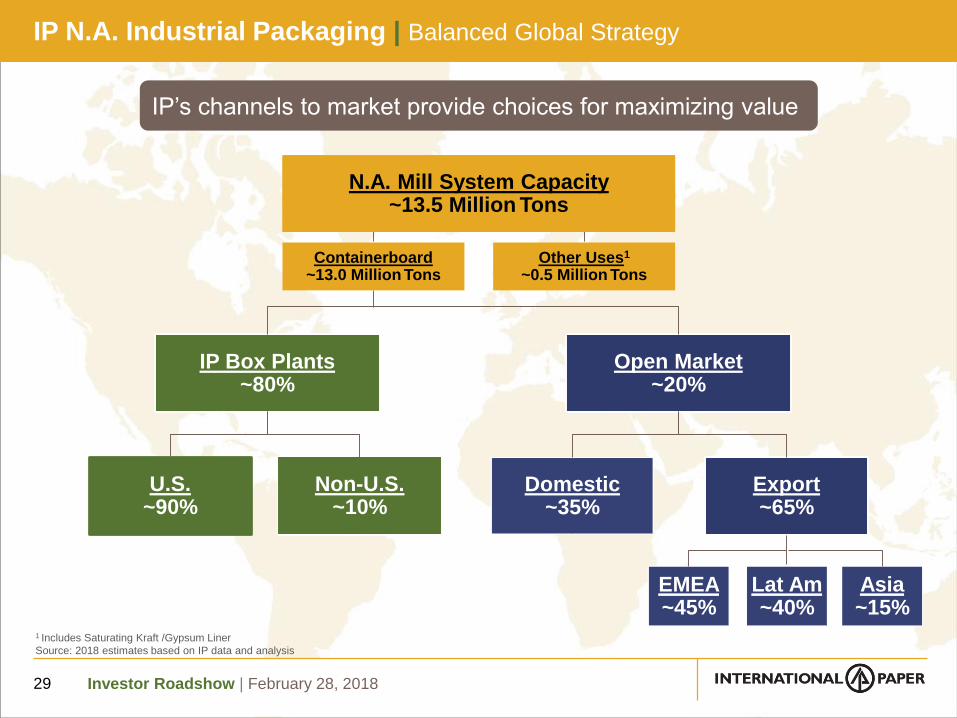
IP N.A. Industrial Packaging | Balanced Global Strategy
29
1 Includes Saturating Kraft /Gypsum Liner
Source: 2018 estimates based on IP data and analysis
IP Box Plants~80%
Open Market~20%
U.S.~90%
Non-U.S.~10%
Export~65%
Domestic~35%
EMEA~45%
Lat Am~40%
Asia~15%
N.A. Mill System Capacity~13.5 Million Tons
Containerboard~13.0 Million Tons
Other Uses1
~0.5 Million Tons
IP’s channels to market provide choices for maximizing value
Investor Roadshow | February 28, 2018
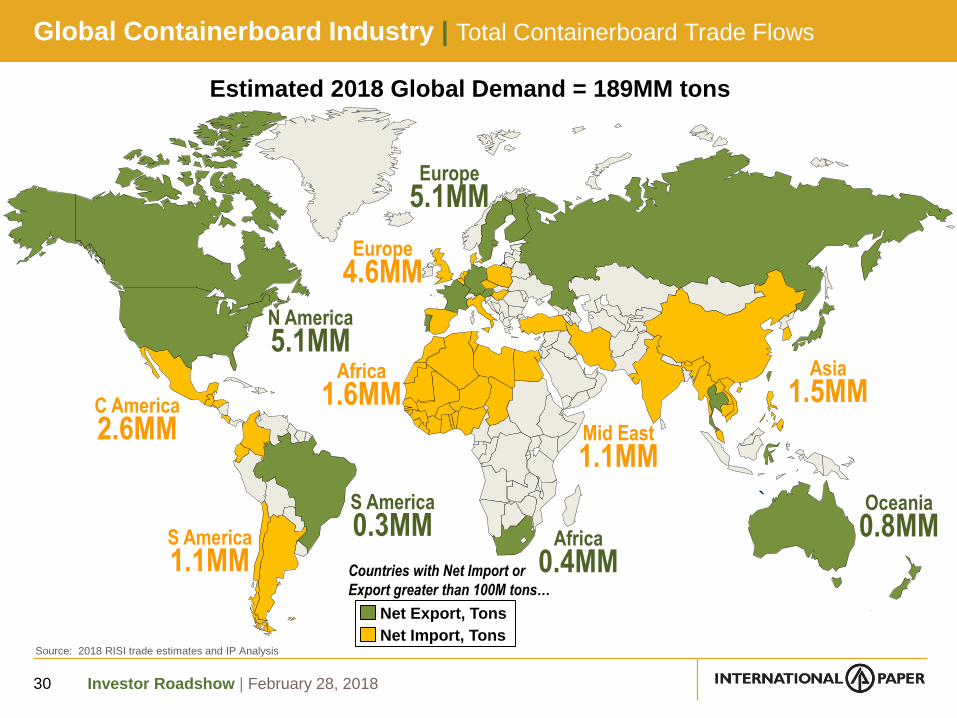
Global Containerboard Industry | Total Containerboard Trade Flows
Estimated 2018 Global Demand = 189MM tons
30
Net Export, Tons
Net Import, Tons
Countries with Net Import or
Export greater than 100M tons…
Source: 2018 RISI trade estimates and IP Analysis
`
Europe
5.1MM
Europe
4.6MM
N America
5.1MMAfrica
1.6MM
S America
0.3MMS America
1.1MM
C America
2.6MM
Africa
0.4MM
Mid East
1.1MM
Asia
1.5MM
Oceania
0.8MM
Investor Roadshow | February 28, 2018
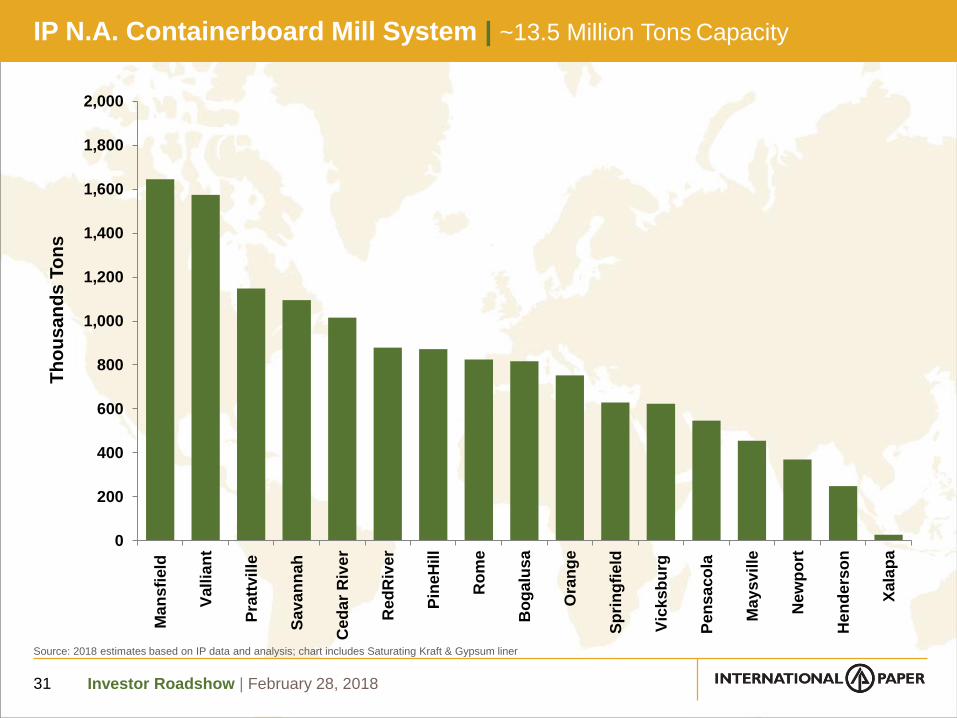
IP N.A. Containerboard Mill System | ~13.5 Million Tons Capacity
31
Source: 2018 estimates based on IP data and analysis; chart includes Saturating Kraft & Gypsum liner
0
200
400
600
800
1,000
1,200
1,400
1,600
1,800
2,000
Ma
ns
field
Vall
ian
t
Pra
ttvil
le
Sav
an
nah
Ced
ar
Riv
er
Red
Riv
er
Pin
eH
ill
Ro
me
Bo
ga
lus
a
Ora
ng
e
Sp
rin
gfi
eld
Vic
ksb
urg
Pen
sa
co
la
Ma
ysv
ille
New
po
rt
He
nd
ers
on
Xala
pa
Th
ou
sa
nd
s T
on
s
Investor Roadshow | February 28, 2018
$0
$200
$400
$600
$800
$1,000
$1,200
0 20,000 40,000 60,000 80,000 100,000
Ma
nu
fac
turi
ng
Co
sts
($
/To
n)
Cumulative Annual Production (Thousand Tons)
Cash Costs + Delivery to Chicago
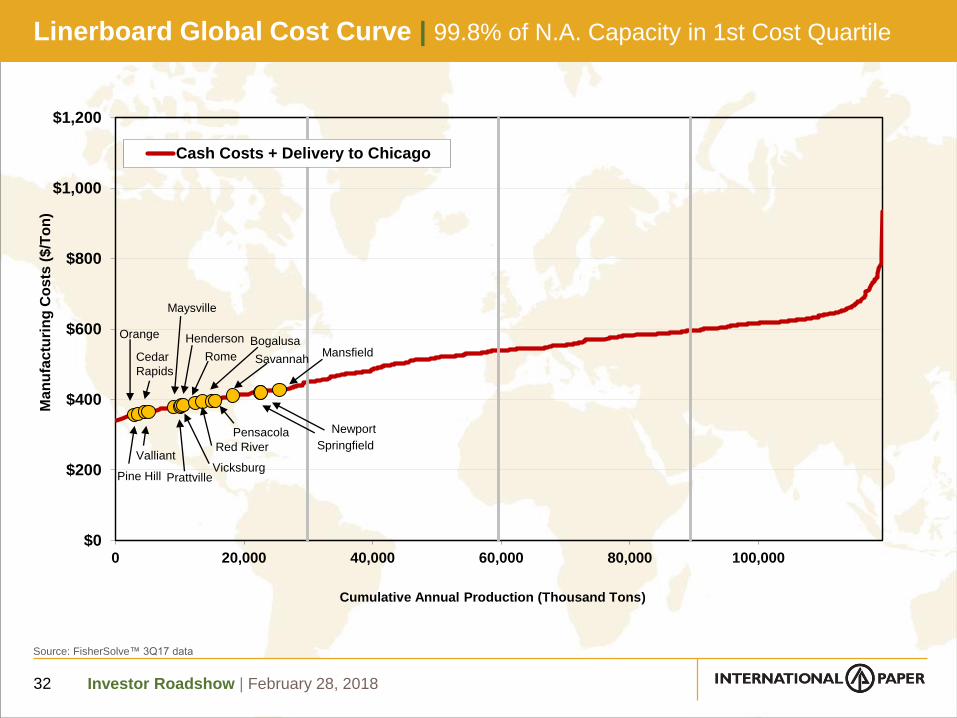
Linerboard Global Cost Curve | 99.8% of N.A. Capacity in 1st Cost Quartile
32
Source: FisherSolve™ 3Q17 data
Orange
Pine Hill
Valliant
Cedar
Rapids
Maysville
Prattville
Henderson
Vicksburg
Rome
Red River
Bogalusa
Pensacola
Savannah
Springfield
Newport
Mansfield
Investor Roadshow | February 28, 2018
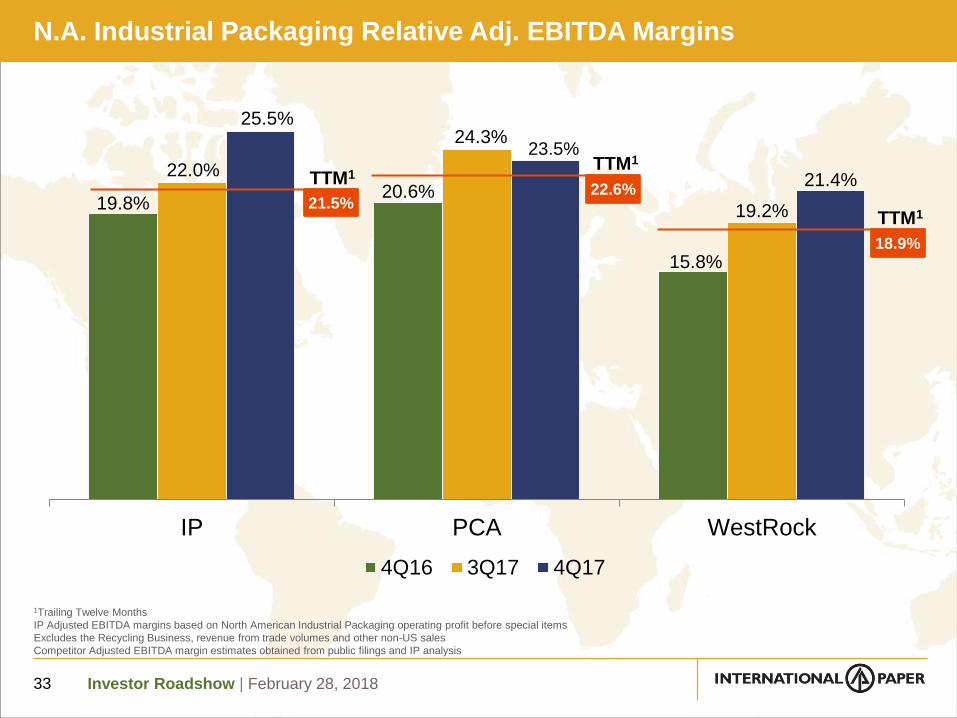
N.A. Industrial Packaging Relative Adj. EBITDA Margins
33
19.8%20.6%
15.8%
22.0%
24.3%
19.2%
25.5%
23.5%
21.4%
IP PCA WestRock
4Q16 3Q17 4Q17
1Trailing Twelve Months
IP Adjusted EBITDA margins based on North American Industrial Packaging operating profit before special items
Excludes the Recycling Business, revenue from trade volumes and other non-US sales
Competitor Adjusted EBITDA margin estimates obtained from public filings and IP analysis
TTM1
21.5%22.6%
TTM1
18.9%
TTM1
Investor Roadshow | February 28, 2018
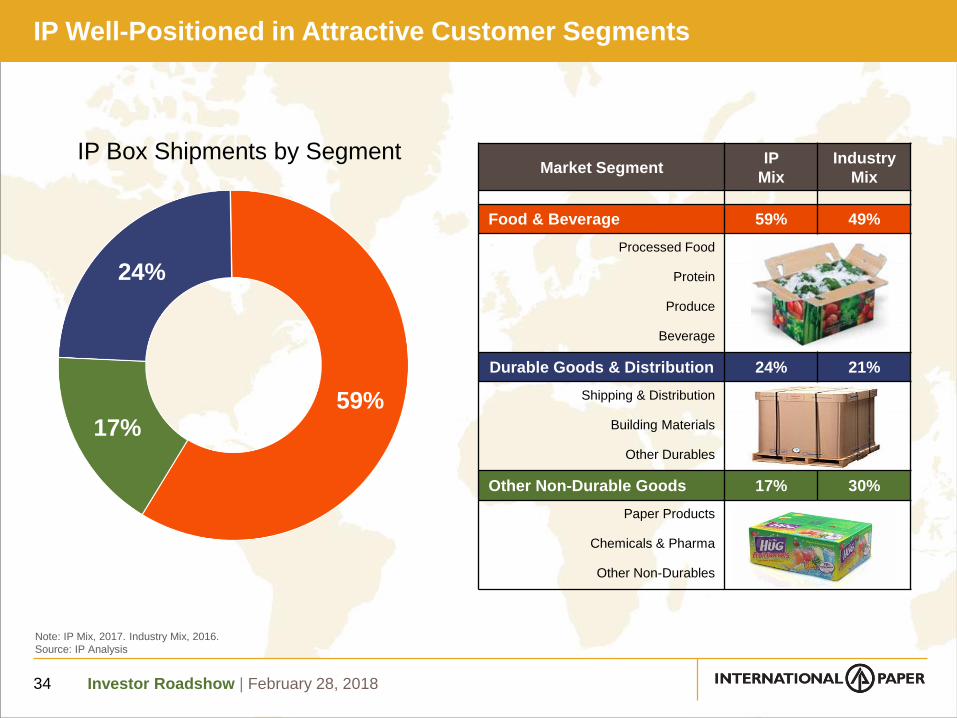
Note: IP Mix, 2017. Industry Mix, 2016.
Source: IP Analysis
IP Well-Positioned in Attractive Customer Segments
34
59%17%
24%
IP Box Shipments by SegmentMarket Segment
IP
Mix
Industry
Mix
Food & Beverage 59% 49%
Processed Food
Protein
Produce
Beverage
Durable Goods & Distribution 24% 21%
Shipping & Distribution
Building Materials
Other Durables
Other Non-Durable Goods 17% 30%
Paper Products
Chemicals & Pharma
Other Non-Durables

Investor Roadshow | February 28, 2018
Riverdale Mill Conversion | Investment Overview
35
Strategic Rationale:
Supports growth in our strategic markets
Enhances world-class mill system and significantly improves our whitetop linerboard cost
Improves system flexibility
Improves our whitetop linerboard product offering
Investment: $300MM to convert No. 15 paper machine from uncoated freesheet to high quality whitetop virgin containerboard; will add 450k tons of capacity
Timing: Targeting to complete conversion mid-2019
N.A. Containerboard Mill System

Investor Roadshow | February 28, 2018
U.S. Containerboard | Industry Statistics
36
200
300
400
500
600
700
800
200
300
400
500
600
700
800
Jan
-05
Ap
r-05
Jul-0
5
Oct-
05
Jan
-06
Ap
r-06
Jul-0
6
Oct-
06
Jan
-07
Ap
r-07
Jul-0
7
Oct-
07
Jan
-08
Ap
r-08
Jul-0
8
Oct-
08
Jan
-09
Ap
r-09
Jul-0
9
Oct-
09
Jan
-10
Ap
r-10
Jul-1
0
Oct-
10
Jan
-11
Ap
r-11
Jul-1
1
Oct-
11
Jan
-12
Ap
r-12
Jul-1
2
Oct-
12
Jan
-13
Ap
r-13
Jul-1
3
Oct-
13
Jan
-14
Ap
r-14
Jul-1
4
Oct-
14
Jan
-15
Ap
r-15
Jul-1
5
Oct-
15
Jan
-16
Ap
r-16
Jul-1
6
Oct-
16
Jan
-17
Ap
r-17
Jul-1
7
Oct-
17
$/short ton$/short ton
Containerboard Pricing
Linerboard (List Price) Medium (List Price) Linerboard (OMP) Medium (OMP)
Source: RISI
As of Jan 2015, RISI only reports OMP = Open Market Price
$200
$300
$400
$500
$600
$700
$800
Jan-90 Jan-95 Jan-00 Jan-05 Jan-10 Jan-15
Investor Roadshow | February 28, 2018
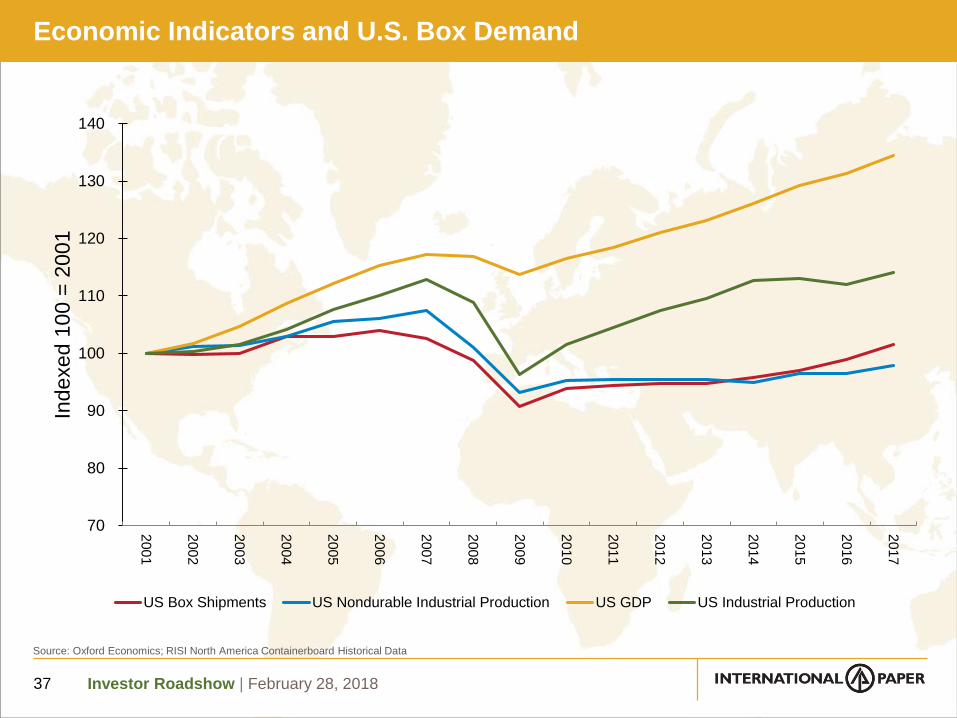
Economic Indicators and U.S. Box Demand
37
Source: Oxford Economics; RISI North America Containerboard Historical Data
70
80
90
100
110
120
130
140
200
1
200
2
200
3
200
4
200
5
200
6
200
7
200
8
200
9
201
0
201
1
201
2
201
3
201
4
201
5
201
6
201
7In
dexed 1
00 =
2001
US Box Shipments US Nondurable Industrial Production US GDP US Industrial Production
Investor Roadshow | February 28, 2018
373378
390396
405401
380379380
391391395390
374
345
357359360 360364
369376
386395
405411
420425
1995
1996
1997
1998
1999
2000
2001
2002
2003
2004
2005
2006
2007
2008
2009
2010
2011
2012
2013
2014
2015
2016
2017
2018
2019
2020
2021
2022
Sh
ipm
en
ts (
BS
F)
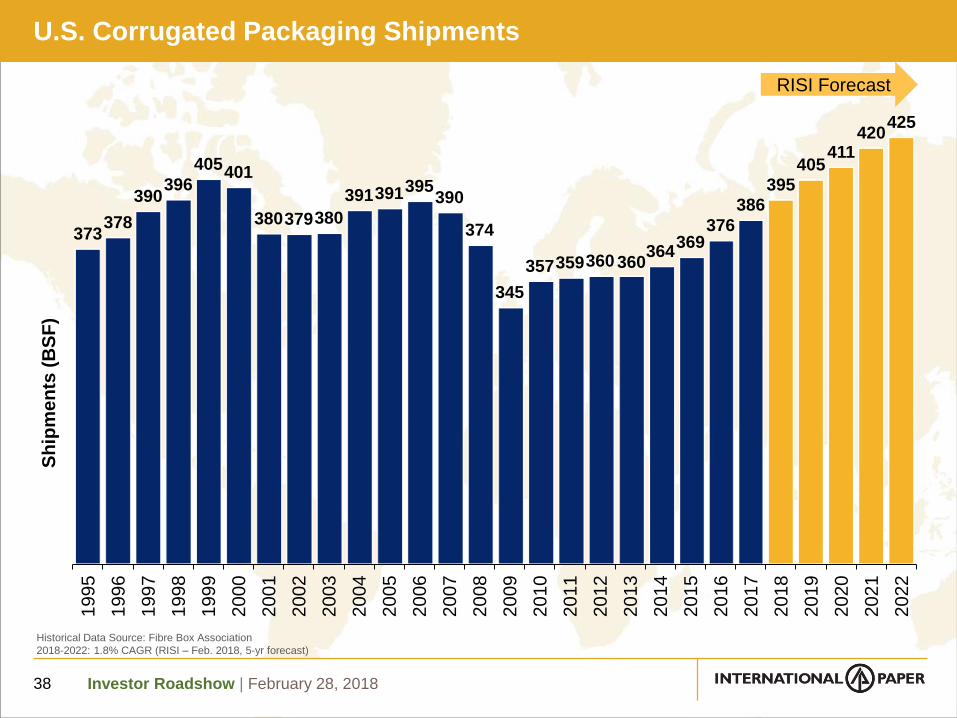
U.S. Corrugated Packaging Shipments
38
Historical Data Source: Fibre Box Association
2018-2022: 1.8% CAGR (RISI – Feb. 2018, 5-yr forecast)
RISI Forecast
Investor Roadshow | February 28, 2018
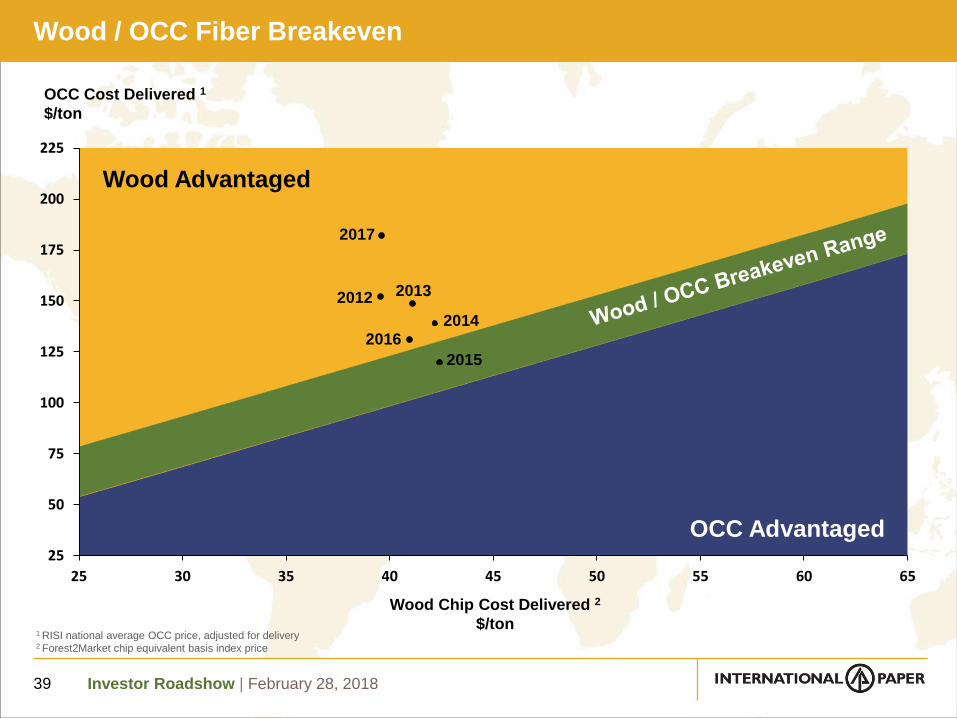
Wood / OCC Fiber Breakeven
39
25
50
75
100
125
150
175
200
225
25 30 35 40 45 50 55 60 65
OCC Cost Delivered 1
$/ton
Wood Chip Cost Delivered 2
$/ton
Wood Advantaged
OCC Advantaged
2012
2014
2013
1 RISI national average OCC price, adjusted for delivery2 Forest2Market chip equivalent basis index price
2015
2016
2017
Investor Roadshow | February 28, 2018
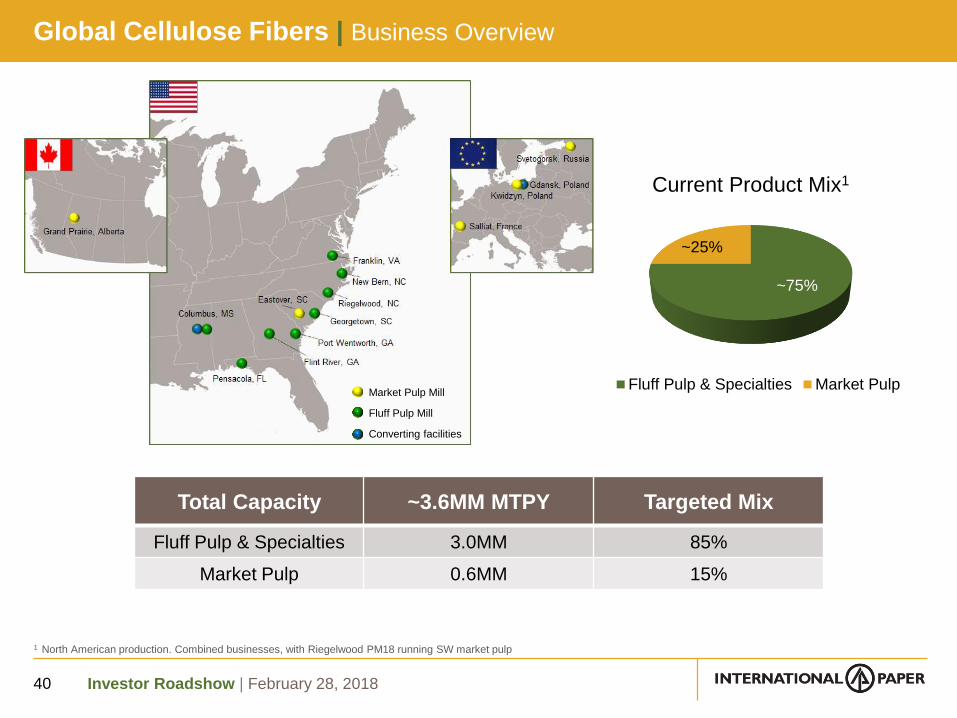
Global Cellulose Fibers | Business Overview
40
~75%
~25%
Current Product Mix1
Fluff Pulp & Specialties Market Pulp
Total Capacity ~3.6MM MTPY Targeted Mix
Fluff Pulp & Specialties 3.0MM 85%
Market Pulp 0.6MM 15%
1 North American production. Combined businesses, with Riegelwood PM18 running SW market pulp
Market Pulp Mill
Fluff Pulp Mill
Converting facilities
Investor Roadshow | February 28, 2018
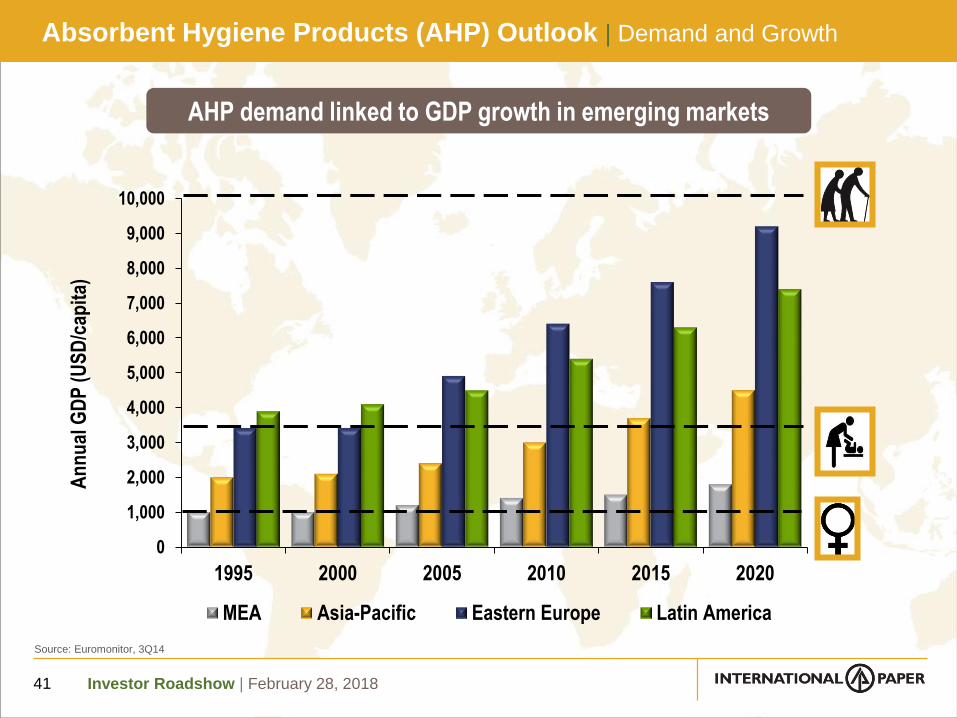
0
1,000
2,000
3,000
4,000
5,000
6,000
7,000
8,000
9,000
10,000
1995 2000 2005 2010 2015 2020
An
nu
al G
DP
(U
SD
/cap
ita)
MEA Asia-Pacific Eastern Europe Latin America
Source: Euromonitor, 3Q14
Absorbent Hygiene Products (AHP) Outlook | Demand and Growth
41
AHP demand linked to GDP growth in emerging markets
Investor Roadshow | February 28, 2018
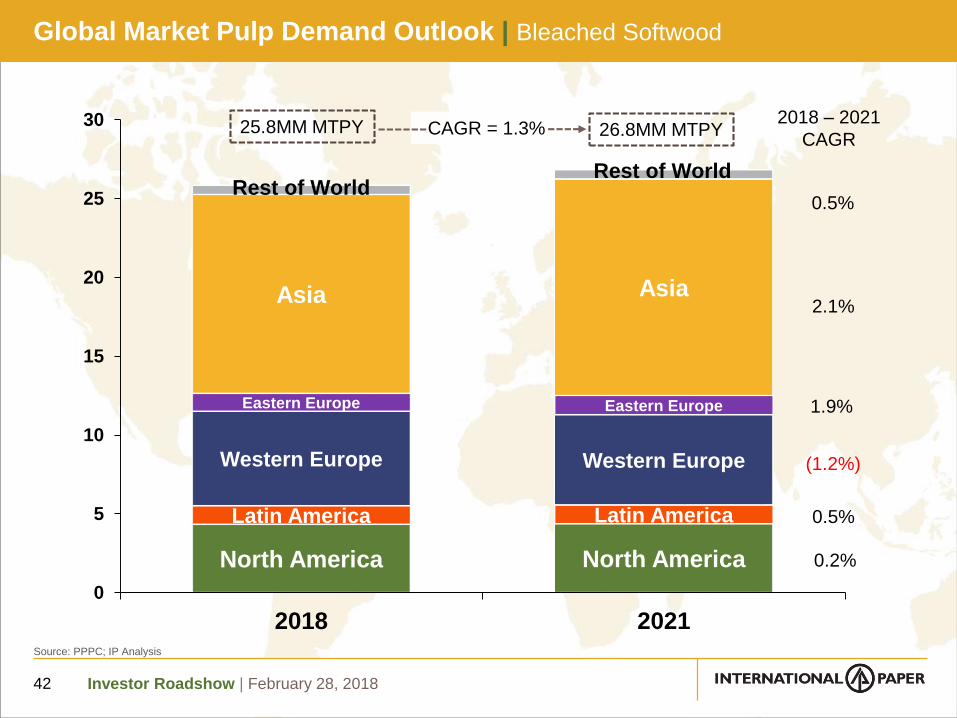
Global Market Pulp Demand Outlook | Bleached Softwood
42
North America North America
Latin America Latin America
Western Europe Western Europe
Eastern Europe Eastern Europe
Asia Asia
Rest of WorldRest of World
0
5
10
15
20
25
30
2018 2021
2018 – 2021
CAGR
0.5%
2.1%
1.9%
(1.2%)
0.2%
0.5%
Source: PPPC; IP Analysis
25.8MM MTPY 26.8MM MTPYCAGR = 1.3%
Investor Roadshow | February 28, 2018
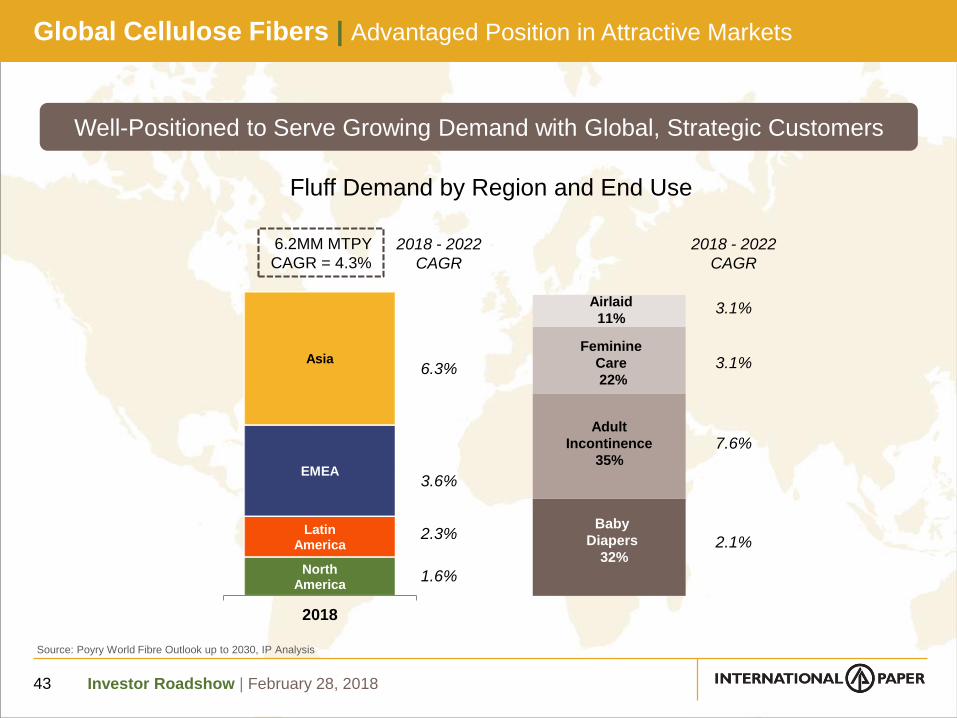
Global Cellulose Fibers | Advantaged Position in Attractive Markets
43
Well-Positioned to Serve Growing Demand with Global, Strategic Customers
Source: Poyry World Fibre Outlook up to 2030, IP Analysis
North America
Latin America
EMEA
Asia
2018
2018 - 2022
CAGR
2.1%
3.1%
7.6%
3.1%Airlaid
11%
Adult
Incontinence
35%
Feminine
Care
22%
Baby
Diapers
32%
6.2MM MTPY
CAGR = 4.3%
Fluff Demand by Region and End Use
2.3%
3.6%
6.3%
1.6%
2018 - 2022
CAGR

Investor Roadshow | February 28, 2018
Pulp mill
IP Global Pulp Capacity | Total of 4.1 MM MTPY1
44
Ilim JV
2.0 MM
Europe / Russia
0.3 MM N. America
3.6 MM
L. America
0.2 MM
1 Does not include llim JV
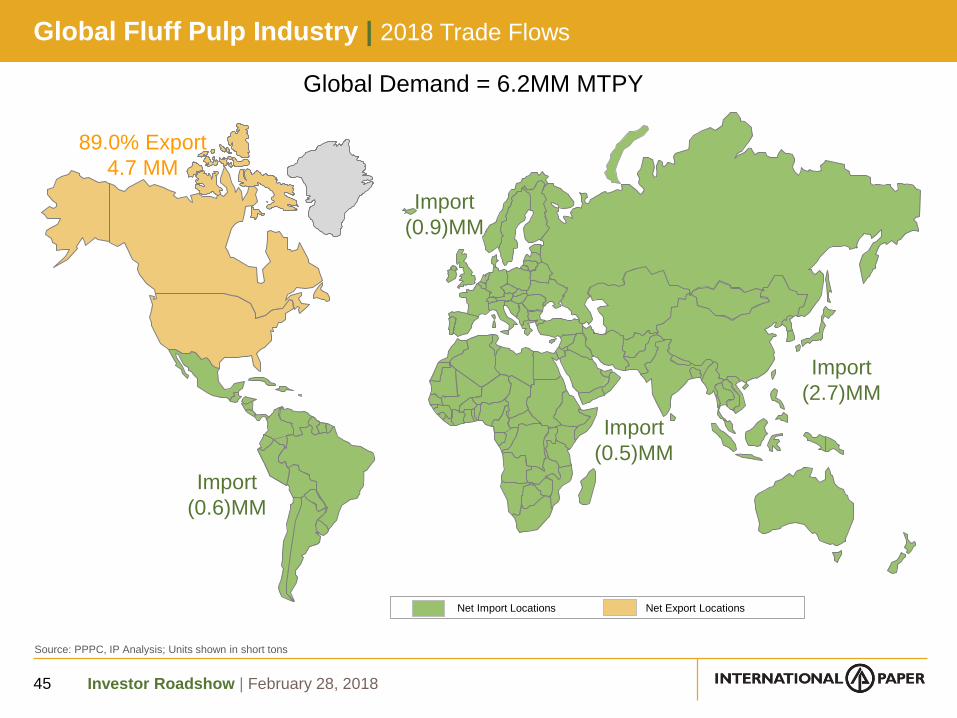
Investor Roadshow | February 28, 201845
Global Fluff Pulp Industry | 2018 Trade Flows
Net Import Locations Net Export Locations
Global Demand = 6.2MM MTPY
Import
(0.9)MM
89.0% Export
4.7 MM
Import
(0.5)MM
Import
(0.6)MM
Import
(2.7)MM
Source: PPPC, IP Analysis; Units shown in short tons
Investor Roadshow | February 28, 2018
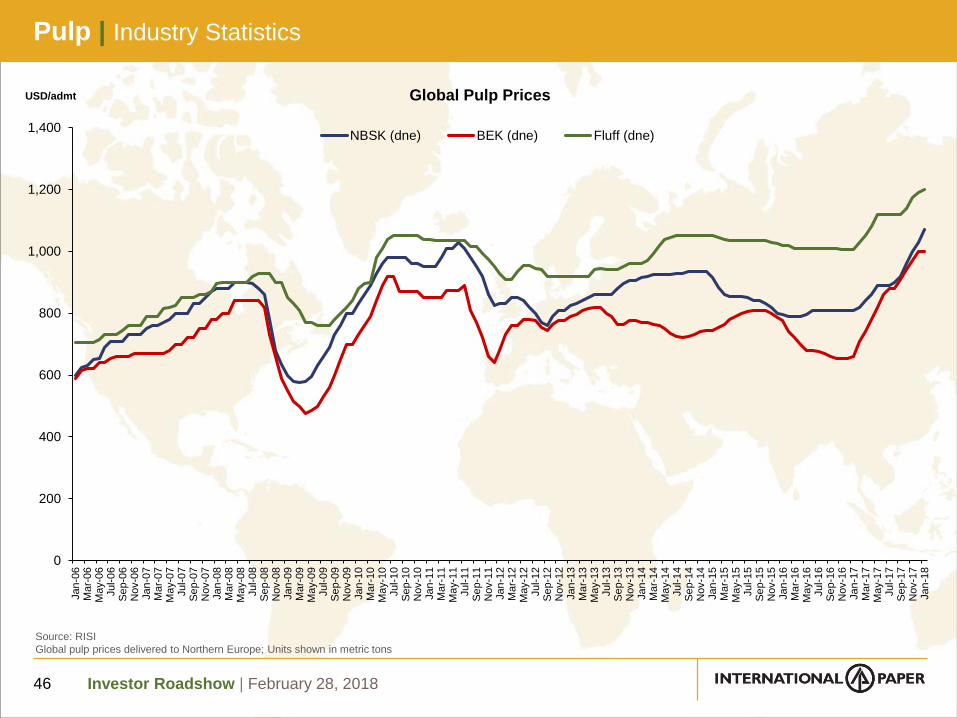
Pulp | Industry Statistics
46
0
200
400
600
800
1,000
1,200
1,400
Jan
-06
Ma
r-06
Ma
y-0
6Jul-0
6S
ep-0
6N
ov-0
6Jan
-07
Ma
r-07
Ma
y-0
7Jul-0
7S
ep-0
7N
ov-0
7Jan
-08
Ma
r-08
Ma
y-0
8Jul-0
8S
ep-0
8N
ov-0
8Jan
-09
Ma
r-09
Ma
y-0
9Jul-0
9S
ep-0
9N
ov-0
9Jan
-10
Ma
r-10
Ma
y-1
0Jul-1
0S
ep-1
0N
ov-1
0Jan
-11
Ma
r-11
Ma
y-1
1Jul-1
1S
ep-1
1N
ov-1
1Jan
-12
Ma
r-12
Ma
y-1
2Jul-1
2S
ep-1
2N
ov-1
2Jan
-13
Ma
r-13
Ma
y-1
3Jul-1
3S
ep-1
3N
ov-1
3Jan
-14
Ma
r-14
Ma
y-1
4Jul-1
4S
ep-1
4N
ov-1
4Jan
-15
Ma
r-15
Ma
y-1
5Jul-1
5S
ep-1
5N
ov-1
5Jan
-16
Ma
r-16
Ma
y-1
6Jul-1
6S
ep-1
6N
ov-1
6Jan
-17
Ma
r-17
Ma
y-1
7Jul-1
7S
ep-1
7N
ov-1
7Jan
-18
USD/admt Global Pulp Prices
NBSK (dne) BEK (dne) Fluff (dne)
Source: RISI
Global pulp prices delivered to Northern Europe; Units shown in metric tons
Investor Roadshow | February 28, 201847
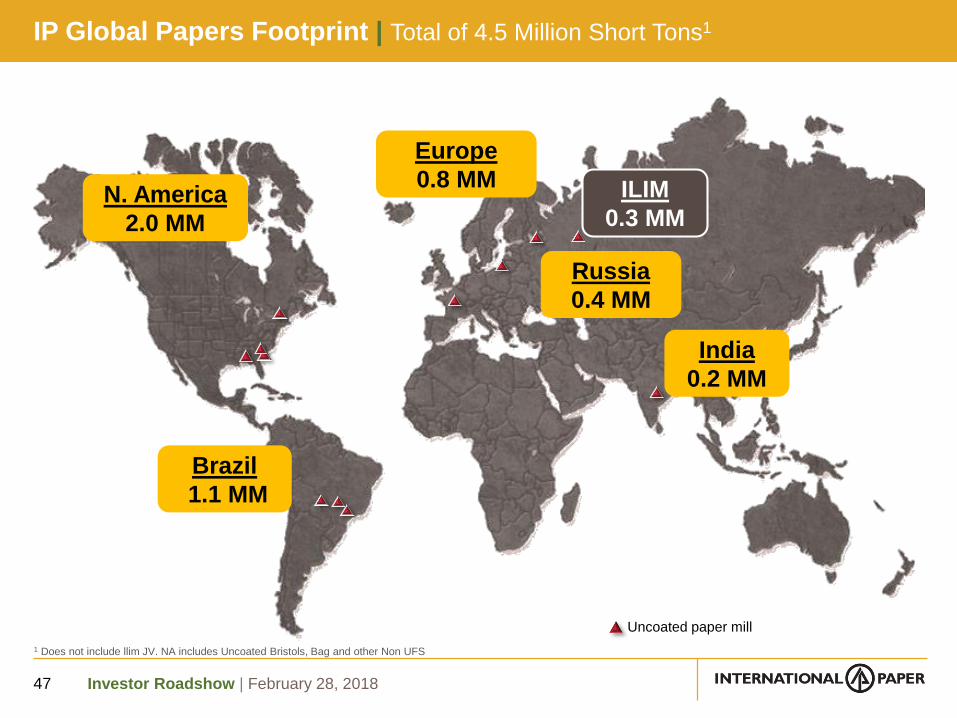
IP Global Papers Footprint | Total of 4.5 Million Short Tons1
1 Does not include llim JV. NA includes Uncoated Bristols, Bag and other Non UFS
Brazil
1.1 MM
N. America
2.0 MM
Europe
0.8 MM
Russia
0.4 MM
Uncoated paper mill
India
0.2 MM
ILIM
0.3 MM
Investor Roadshow | February 28, 2018
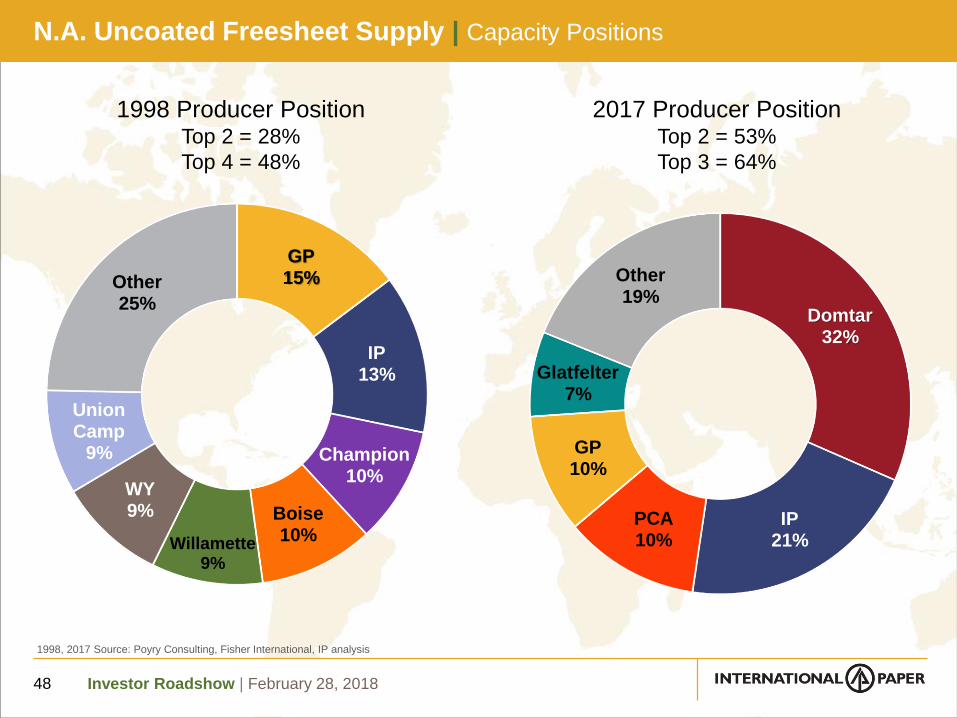
GP15%
IP13%
Champion10%
Boise10%Willamette
9%
WY9%
Union Camp
9%
Other 25%
1998 Producer PositionTop 2 = 28%
Top 4 = 48%
2017 Producer PositionTop 2 = 53%
Top 3 = 64%
1998, 2017 Source: Poyry Consulting, Fisher International, IP analysis
N.A. Uncoated Freesheet Supply | Capacity Positions
48
Domtar32%
IP21%
PCA10%
GP10%
Glatfelter7%
Other 19%

Investor Roadshow | February 28, 2018
0%
20%
40%
60%
80%
100%
Riverdale Ticonderoga Eastover Georgetown
% G
rad
e / M
ix
Uncoated Freesheet Non UFS Pulp1
N.A. Papers Mill System | 1.9MM Short Ton Capacity
49
1 Non UFS includes Kraft Bag and Uncoated Bristols
Source: IP analysis
Paper
(M Tons) 645 295 740 305
Pulp
(M Tons) 0 0 115 350C
ap
ac
ity
Investor Roadshow | February 28, 2018
$0
$200
$400
$600
$800
$1,000
$1,200
$1,400
$1,600
$1,800
0 10,000 20,000 30,000 40,000 50,000
Ma
nu
fac
turi
ng
Co
sts
$/T
on
Cumulative Annual Production (Thousand Tons)
Cash Costs + Delivery to Chicago
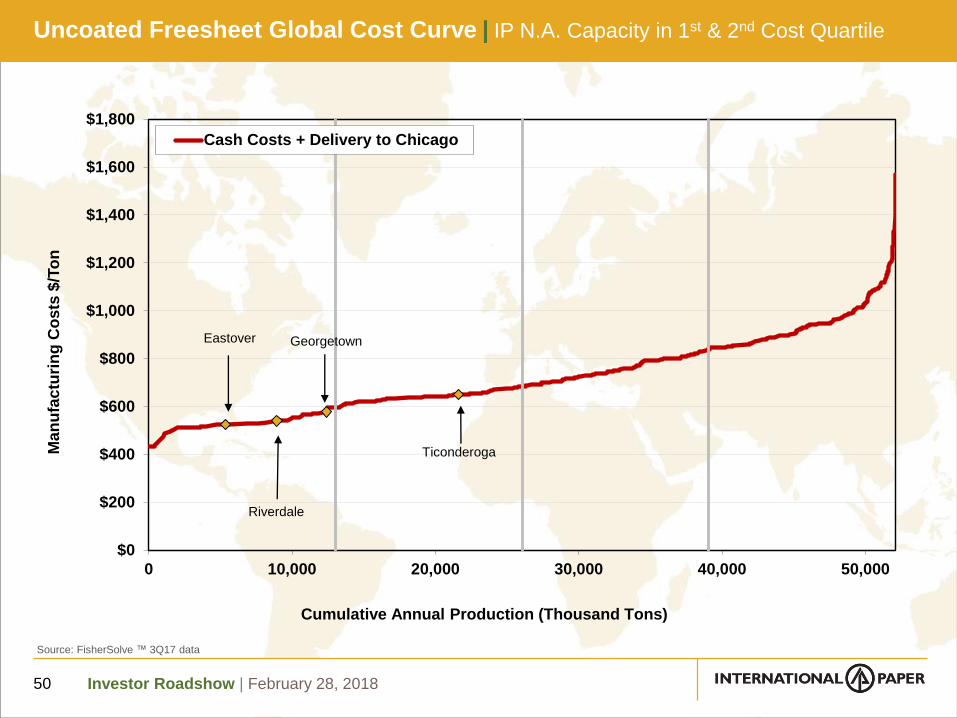
Uncoated Freesheet Global Cost Curve | IP N.A. Capacity in 1st & 2nd Cost Quartile
50
Source: FisherSolve ™ 3Q17 data
Georgetown
Riverdale
Ticonderoga
Eastover

Investor Roadshow | February 28, 2018
314
575657 657
513 539598
499
310253 261 316
213
10%
16%
19% 19%18%
20%
22%
18%
12% 12%13%
17%
12%
0%
5%
10%
15%
20%
25%
0
200
400
600
800
1,000
2005 2006 2007 2008 2009 2010 2011 2012 2013 2014 2015 2016 2017
Adj.EBITDA1
%
Adj.EBITDA1
$ MM Papers Only
N.A. Printing Papers | Margin History
51
Tons (MM)
4.0 4.1 3.9 3.5 3.0 2.8 2.7 2.7 2.6 2.0 2.0 1.9 1.9
1 From continuing operations before special items and non-operating pension expense
Investor Roadshow | February 28, 2018
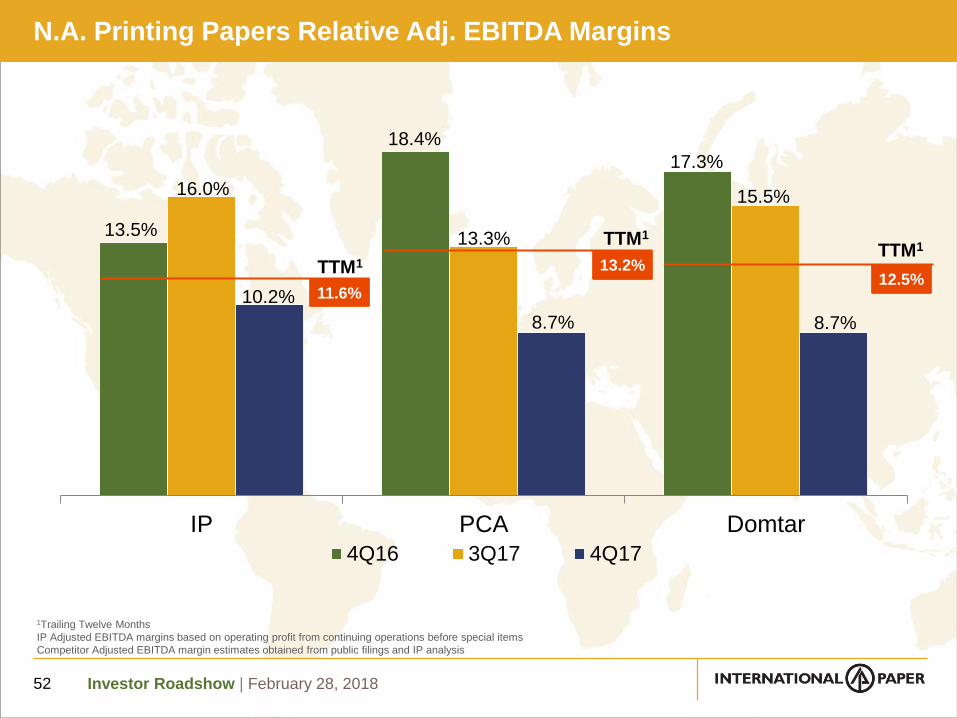
N.A. Printing Papers Relative Adj. EBITDA Margins
52
13.5%
18.4%
17.3%
16.0%
13.3%
15.5%
10.2%
8.7% 8.7%
IP PCA Domtar
4Q16 3Q17 4Q17
1Trailing Twelve Months
IP Adjusted EBITDA margins based on operating profit from continuing operations before special items
Competitor Adjusted EBITDA margin estimates obtained from public filings and IP analysis
TTM1
11.6%
TTM1
13.2%12.5%
TTM1
Investor Roadshow | February 28, 2018
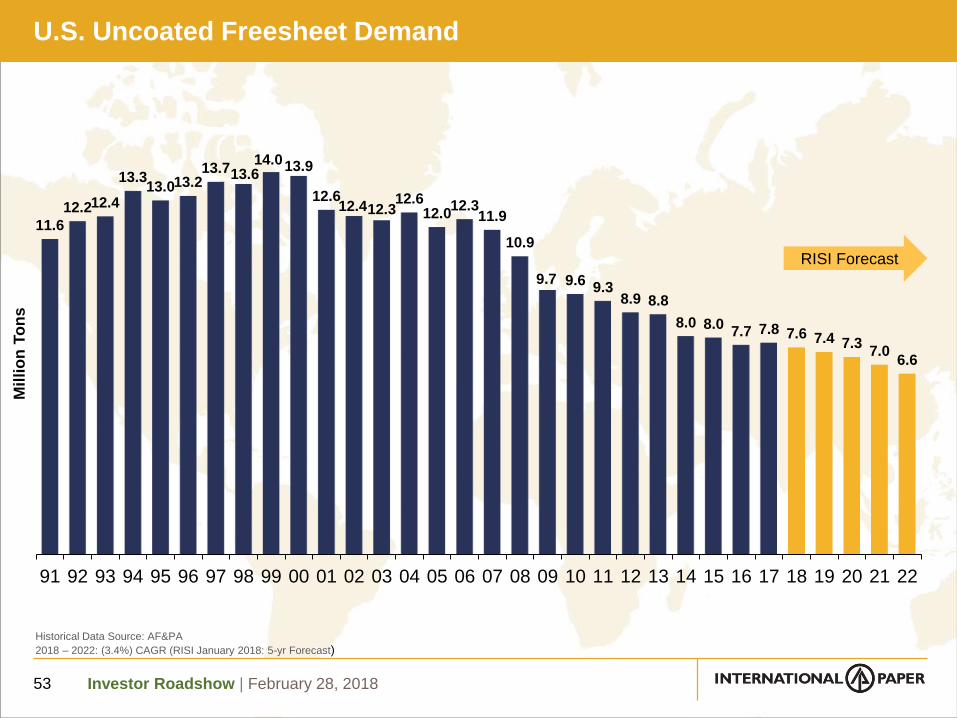
U.S. Uncoated Freesheet Demand
53
Historical Data Source: AF&PA
2018 – 2022: (3.4%) CAGR (RISI January 2018: 5-yr Forecast)
11.6
12.212.4
13.313.013.2
13.713.614.013.9
12.612.412.3
12.612.0
12.311.9
10.9
9.7 9.69.3
8.9 8.8
8.0 8.07.7 7.8 7.6 7.4 7.3
7.06.6
91 92 93 94 95 96 97 98 99 00 01 02 03 04 05 06 07 08 09 10 11 12 13 14 15 16 17 18 19 20 21 22
Mil
lio
n T
on
s
RISI Forecast

Investor Roadshow | February 28, 2018
U.S. Uncoated Freesheet | Industry Statistics
54
$500
$600
$700
$800
$900
$1,000
$1,100
$1,200
$500
$600
$700
$800
$900
$1,000
$1,100
$1,200
Jan
-06
Ma
r-0
6M
ay-0
6Jul-
06
Se
p-0
6N
ov-0
6Jan
-07
Ma
r-0
7M
ay-0
7Jul-
07
Se
p-0
7N
ov-0
7Jan
-08
Ma
r-0
8M
ay-0
8Jul-
08
Se
p-0
8N
ov-0
8Jan
-09
Ma
r-0
9M
ay-0
9Jul-
09
Se
p-0
9N
ov-0
9Jan
-10
Ma
r-1
0M
ay-1
0Jul-
10
Se
p-1
0N
ov-1
0Jan
-11
Ma
r-1
1M
ay-1
1Jul-
11
Se
p-1
1N
ov-1
1Jan
-12
Ma
r-1
2M
ay-1
2Jul-
12
Se
p-1
2N
ov-1
2Jan
-13
Ma
r-1
3M
ay-1
3Jul-
13
Se
p-1
3N
ov-1
3Jan
-14
Ma
r-1
4M
ay-1
4Jul-
14
Se
p-1
4N
ov-1
4Jan
-15
Ma
r-1
5M
ay-1
5Jul-
15
Se
p-1
5N
ov-1
5Jan
-16
Ma
r-1
6M
ay-1
6Jul-
16
Se
p-1
6N
ov-1
6Jan
-17
Ma
r-1
7M
ay-1
7Jul-
17
Se
p-1
7N
ov-1
7Jan
-18
$/short ton
Uncoated Freesheet Pricing Trends
RISI 20# Cutsize RISI 50# Offset
Source: RISI
Investor Roadshow | February 28, 2018
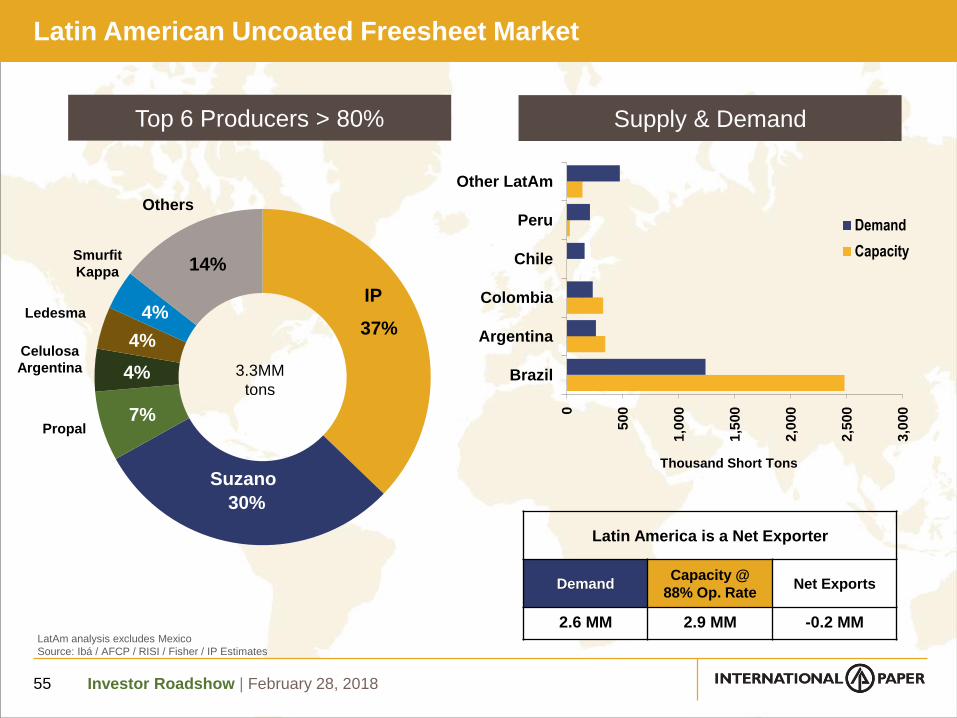
Latin American Uncoated Freesheet Market
55
0
500
1,0
00
1,5
00
2,0
00
2,5
00
3,0
00
Brazil
Argentina
Colombia
Chile
Peru
Other LatAm
Thousand Short Tons
Demand
Capacity
Latin America is a Net Exporter
DemandCapacity @
88% Op. RateNet Exports
2.6 MM 2.9 MM -0.2 MM
Supply & Demand
LatAm analysis excludes Mexico
Source: Ibá / AFCP / RISI / Fisher / IP Estimates
Top 6 Producers > 80%
Suzano
37%
30%
7%
4%
4%
4%
14%Smurfit
Kappa
Ledesma
Celulosa
Argentina
Propal
IP
Others
Suzano
3.3MM
tons
Investor Roadshow | February 28, 2018
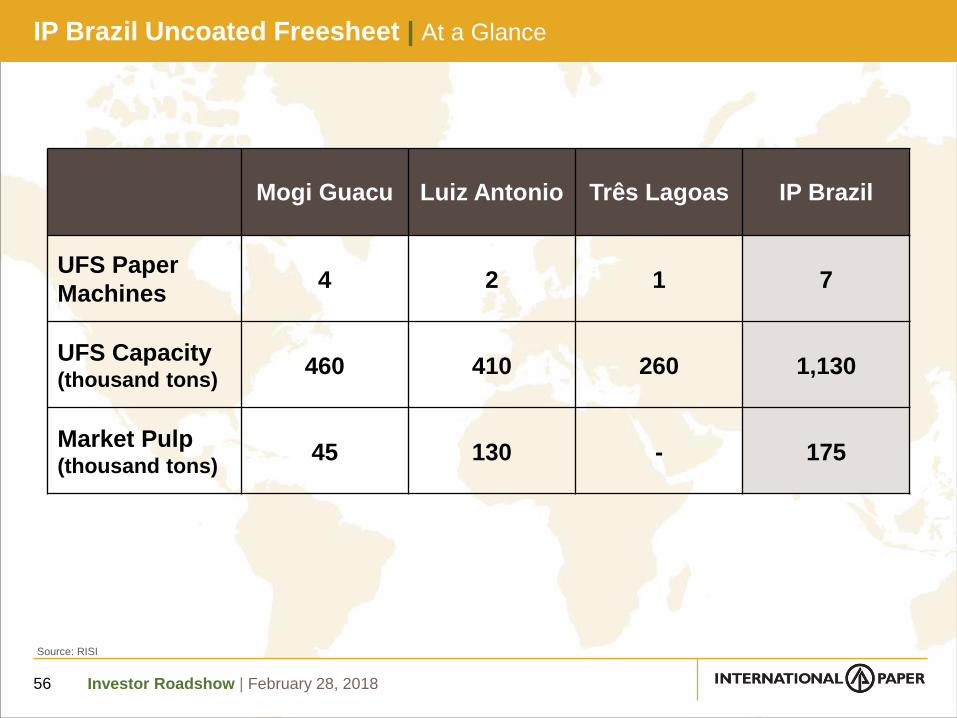
IP Brazil Uncoated Freesheet | At a Glance
56
Mogi Guacu Luiz Antonio Três Lagoas IP Brazil
UFS Paper
Machines4 2 1 7
UFS Capacity (thousand tons)
460 410 260 1,130
Market Pulp (thousand tons)
45 130 - 175
Source: RISI
Investor Roadshow | February 28, 2018
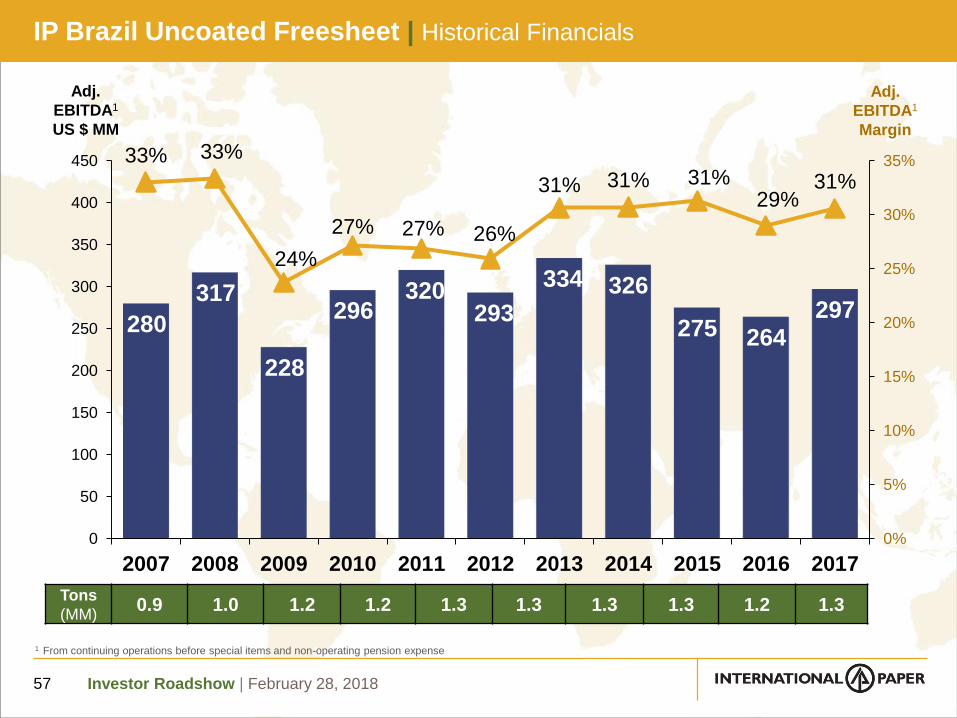
IP Brazil Uncoated Freesheet | Historical Financials
57
280
317
228
296 320
293
334 326
275 264297
33% 33%
24%
27% 27% 26%
31% 31% 31%29%
31%
0%
5%
10%
15%
20%
25%
30%
35%
0
50
100
150
200
250
300
350
400
450
2007 2008 2009 2010 2011 2012 2013 2014 2015 2016 2017
Adj.
EBITDA1
US $ MM
Adj.
EBITDA1
Margin
Tons
(MM) 0.9 1.0 1.2 1.2 1.3 1.3 1.3 1.3 1.2 1.3
1 From continuing operations before special items and non-operating pension expense
Investor Roadshow | February 28, 2018
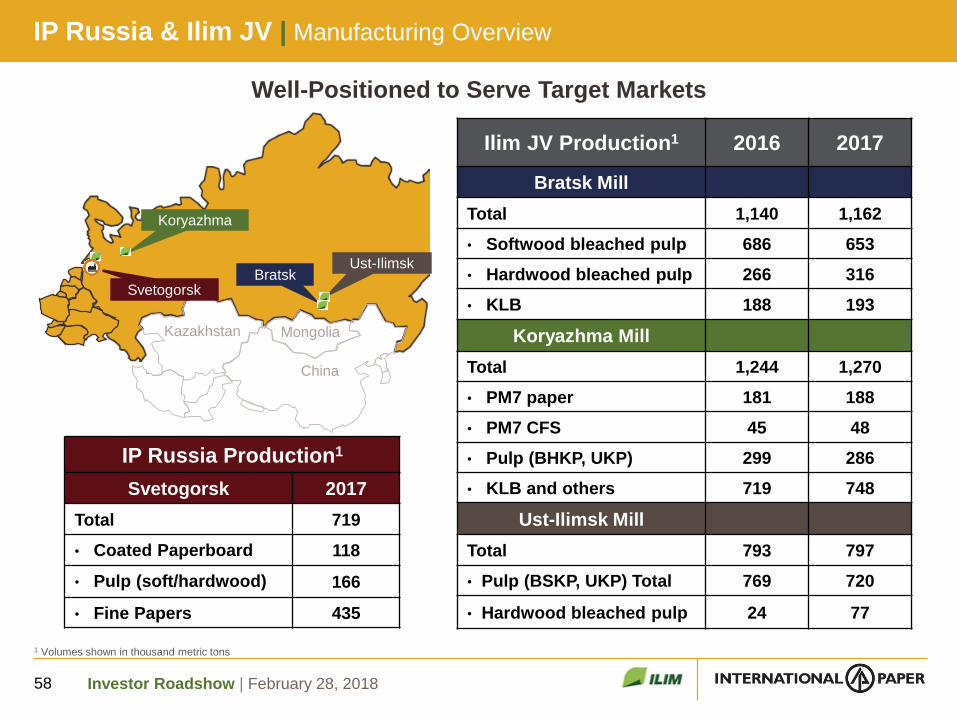
IP Russia & Ilim JV | Manufacturing Overview
Ilim JV Production1 2016 2017
Bratsk Mill
Total 1,140 1,162
• Softwood bleached pulp 686 653
• Hardwood bleached pulp 266 316
• KLB 188 193
Koryazhma Mill
Total 1,244 1,270
• PM7 paper 181 188
• PM7 CFS 45 48
• Pulp (BHKP, UKP) 299 286
• KLB and others 719 748
Ust-Ilimsk Mill
Total 793 797
• Pulp (BSKP, UKP) Total 769 720
• Hardwood bleached pulp 24 77
IP Russia Production1
Svetogorsk 2017
Total 719
• Coated Paperboard 118
• Pulp (soft/hardwood) 166
• Fine Papers 435
1 Volumes shown in thousand metric tons
Koryazhma
BratskUst-Ilimsk
China
Kazakhstan Mongolia
Svetogorsk
Well-Positioned to Serve Target Markets
58
Investor Roadshow | February 28, 2018
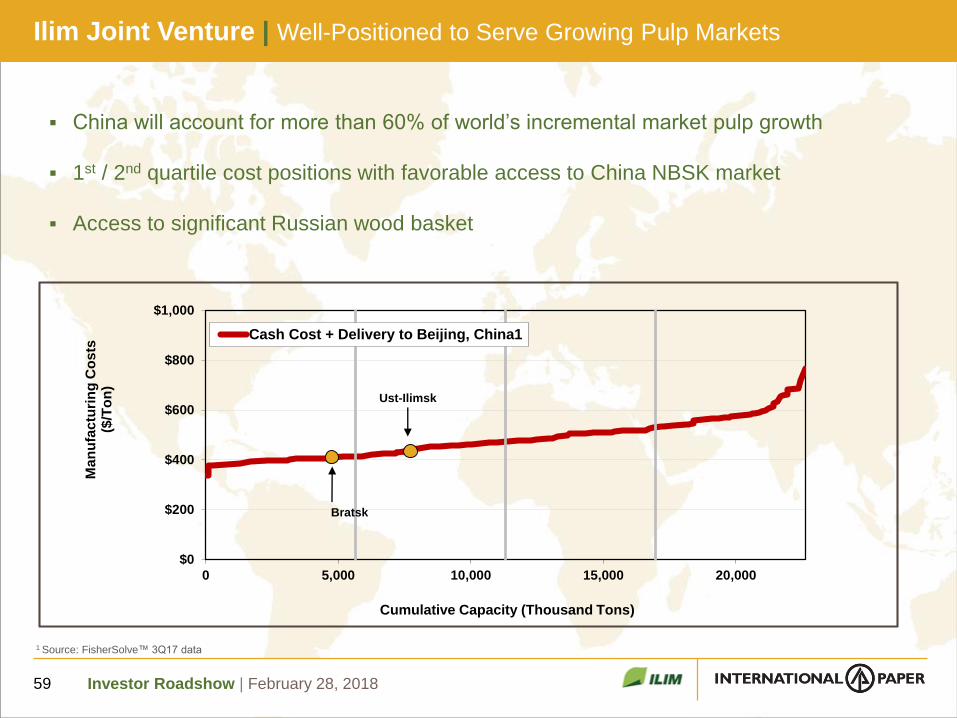
Ilim Joint Venture | Well-Positioned to Serve Growing Pulp Markets
59
China will account for more than 60% of world’s incremental market pulp growth
1st / 2nd quartile cost positions with favorable access to China NBSK market
Access to significant Russian wood basket
1 Source: FisherSolve™ 3Q17 data
$0
$200
$400
$600
$800
$1,000
0 5,000 10,000 15,000 20,000
Ma
nu
fac
turi
ng
Co
sts
($/T
on
)
Cumulative Capacity (Thousand Tons)
Cash Cost + Delivery to Beijing, China1
Ust-Ilimsk
Bratsk

Investor Roadshow | February 28, 2018
Ilim Joint Venture | Full Year Financials
60
2013 2014 2015 2016 2017
Sales Volume (Million metric tonnes) 2.4 2.9 3.0 3.2 3.1
Sales ($B) 1.9 2.1 1.9 1.9 2.2
Debt ($B) 1.5 1.4 1.2 1.5 1.6
Adj. Operating EBITDA ($MM) 203 459 694 680 695
F/X Gain (Loss)1 ($MM) (80) (674) (188) 63 37
EBITDA ($MM) 123 (215) 506 743 732
Depreciation ($MM) 176 188 128 121 151
EBIT ($MM) (53) (403) 378 622 581
Interest Expense ($MM) 39 69 52 81 $88
Net Income / (Loss) ($MM) (72) (359) 237 385 362
IP Equity Earnings / (Loss) ($MM) (46) (194) 131 199 183
Dividends (to IP) ($MM) 0 56 35 60 134
Ilim JV results are US GAAP basis 1 Represents F/X impact including that related to Ilim JV USD-denominated net debt (balance of ~$0.9B at year end 2017)

Investor Roadshow | February 28, 2018
Ilim Joint Venture | 4Q17 vs. 3Q17
61
$ Millions 4Q16 3Q17 4Q17 2016 2017
Sales Volume (thousand metric tonnes)
895 772 843 3,195 3,110
Sales $539 $523 $632 $1,927 $2,150
EBITDA $194 $184 $236 $743 $732
F/X (Impact of USD Net Debt)1 $14 $18 $7 $63 $37
Adj. Operational EBITDA2 $180 $166 $229 $680 $695
IP Equity Earnings (Loss)3 $45 $48 $64 $199 $183
Higher pricing and strong sales volume in 4Q17
F/X gain (non-cash) on USD denominated net debt driven by ruble strengthening
1Q18 equity earnings projected to be $80M-$90MM4 on continued strong, demand-
driven market fundamentals
Ilim JV results are on U.S. GAAP basis 1 Represents F/X impact including amounts related to Ilim JV USD-denominated net debt (balance of ~$0.9B at end of 4Q17); Ilim Group’s functional currency is the
Ruble (RUB); Non-functional-denominated currency balances are measured monthly using the month-end exchange rate2 Before F/X impact including USD-denominated net debt3 IP Equity Earnings (Loss) for 4Q16, 3Q17 and 4Q17 include after-tax F/X gains (losses) (primarily on USD-denominated net debt) of $6MM, $7MM and $3MM, respectively4 At December 31, 2017 RUB/USD exchange rate
Investor Roadshow | February 28, 2018
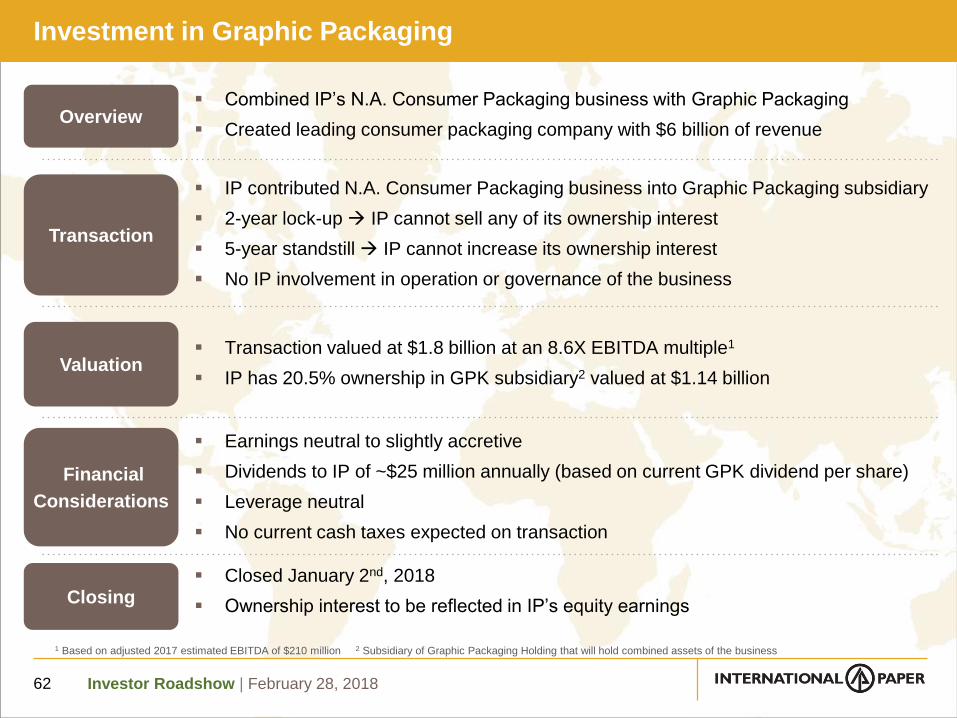
Investment in Graphic Packaging
62
1 Based on adjusted 2017 estimated EBITDA of $210 million 2 Subsidiary of Graphic Packaging Holding that will hold combined assets of the business
Combined IP’s N.A. Consumer Packaging business with Graphic Packaging
Created leading consumer packaging company with $6 billion of revenue
IP contributed N.A. Consumer Packaging business into Graphic Packaging subsidiary
2-year lock-up IP cannot sell any of its ownership interest
5-year standstill IP cannot increase its ownership interest
No IP involvement in operation or governance of the business
Transaction valued at $1.8 billion at an 8.6X EBITDA multiple1
IP has 20.5% ownership in GPK subsidiary2 valued at $1.14 billion
Earnings neutral to slightly accretive
Dividends to IP of ~$25 million annually (based on current GPK dividend per share)
Leverage neutral
No current cash taxes expected on transaction
Closed January 2nd, 2018
Ownership interest to be reflected in IP’s equity earnings
Overview
Transaction
Financial
Considerations
Valuation
Closing

Investor Roadshow | February 28, 2018
Adj. Operating EPS
63
2006 as originally reported
2007-2011 adjusted for elimination of the Ilim JV reporting lag
2006-2010 Net Earnings from continuing operations and before special items; 2010 onward reflects Operating Earnings
xpedx is reflected as a Discontinued Operation from 2010 onward
N.A. Consumer Packaging is reflected as a Discontinued Operation from 2013 onward
.12
.35
.40
.47 .45
.52.57
.73
.45.49
.41
.15
.07
.27
.38
.22
.05
.44
.85
.72.76 .77.78
.67
.58
.49
.77
.66
.58
.52
.91
.78
.59
.87 .87
.46
.79
.90 .91
.84
.78
.82 .83
.67
.56
.66
1.01
1.27
.42
.08
1Q
2Q
3Q
4Q
1Q
2Q
3Q
4Q
1Q
2Q
3Q
4Q
1Q
2Q
3Q
4Q
1Q
2Q
3Q
4Q
1Q
2Q
3Q
4Q
1Q
2Q
3Q
4Q
1Q
2Q
3Q
4Q
1Q
2Q
3Q
4Q
1Q
2Q
3Q
4Q
1Q
2Q
3Q
4Q
1Q
2Q
3Q
4Q
20172006 2007 20102008
Impact of Mineral
Rights Gain
2009
.83
2011
.93Final Land Sale
2012 2013 2014 2015 2016
Investor Roadshow | February 28, 2018
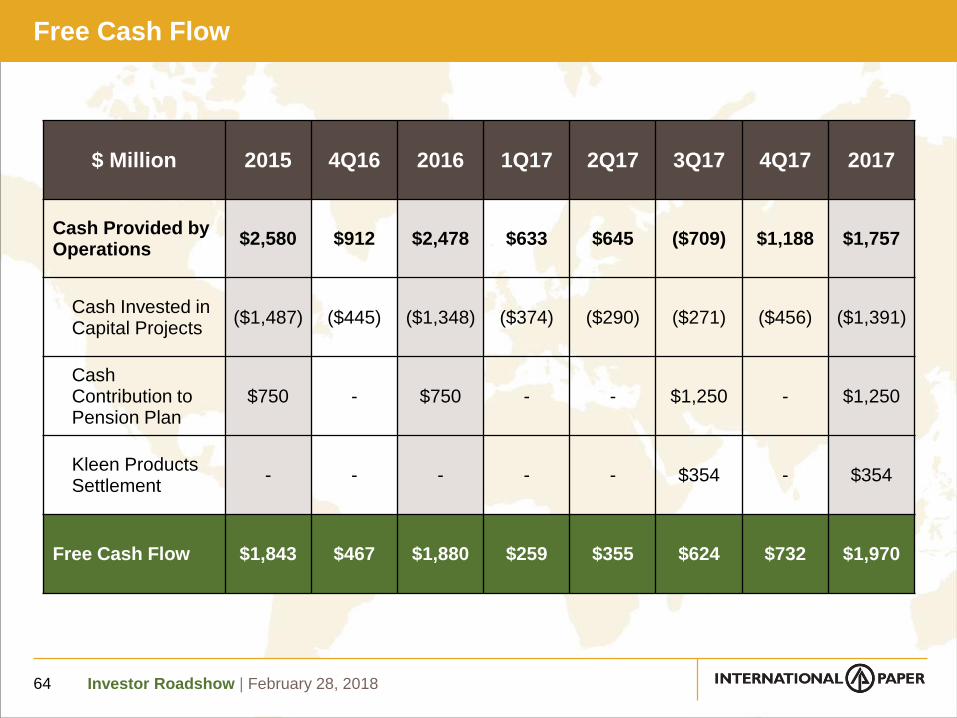
$ Million 2015 4Q16 2016 1Q17 2Q17 3Q17 4Q17 2017
Cash Provided by Operations
$2,580 $912 $2,478 $633 $645 ($709) $1,188 $1,757
Cash Invested in Capital Projects
($1,487) ($445) ($1,348) ($374) ($290) ($271) ($456) ($1,391)
Cash Contribution to Pension Plan
$750 - $750 - - $1,250 - $1,250
Kleen Products Settlement
- - - - - $354 - $354
Free Cash Flow $1,843 $467 $1,880 $259 $355 $624 $732 $1,970
Free Cash Flow
64
Investor Roadshow | February 28, 2018
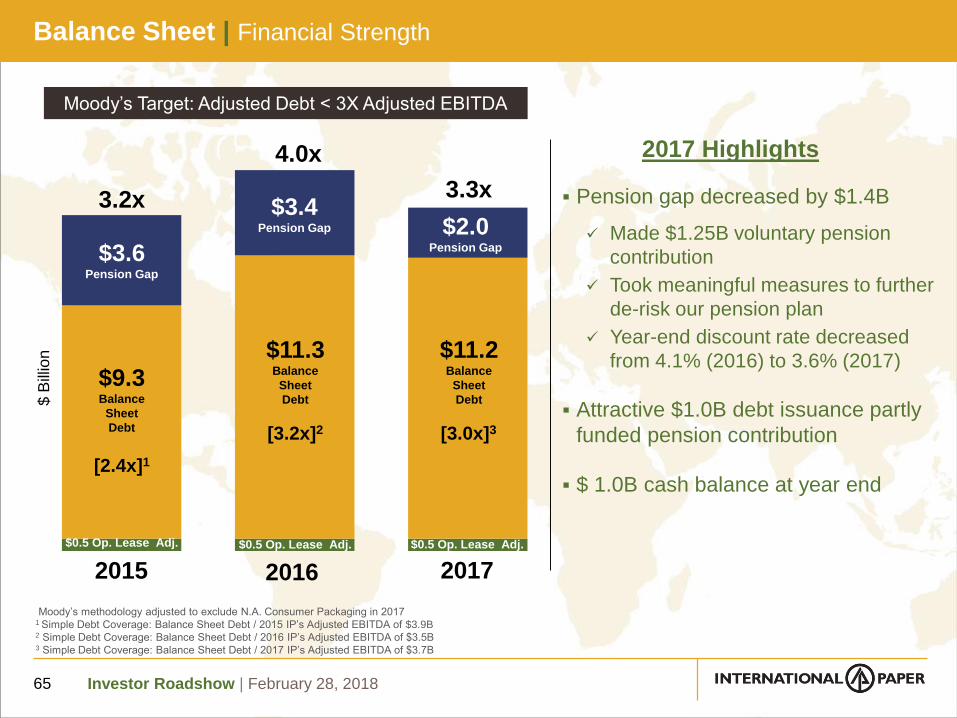
Balance Sheet | Financial Strength
65
$ B
illio
n
3.2x
$9.3Balance
Sheet
Debt
$0.5 Op. Lease Adj. $0.5 Op. Lease Adj.
$3.4Pension Gap
20162015 2017
3.3x
[2.4x]1
Moody’s Target: Adjusted Debt < 3X Adjusted EBITDA
Pension gap decreased by $1.4B
Made $1.25B voluntary pension
contribution
Took meaningful measures to further
de-risk our pension plan
Year-end discount rate decreased
from 4.1% (2016) to 3.6% (2017)
Attractive $1.0B debt issuance partly
funded pension contribution
$ 1.0B cash balance at year end
$11.3Balance
Sheet
Debt
[3.2x]2
$0.5 Op. Lease Adj.
$3.6Pension Gap
4.0x
$11.2Balance
Sheet
Debt
$2.0Pension Gap
[3.0x]3
2017 Highlights
Moody’s methodology adjusted to exclude N.A. Consumer Packaging in 20171 Simple Debt Coverage: Balance Sheet Debt / 2015 IP’s Adjusted EBITDA of $3.9B2 Simple Debt Coverage: Balance Sheet Debt / 2016 IP’s Adjusted EBITDA of $3.5B3 Simple Debt Coverage: Balance Sheet Debt / 2017 IP’s Adjusted EBITDA of $3.7B
Investor Roadshow | February 28, 2018
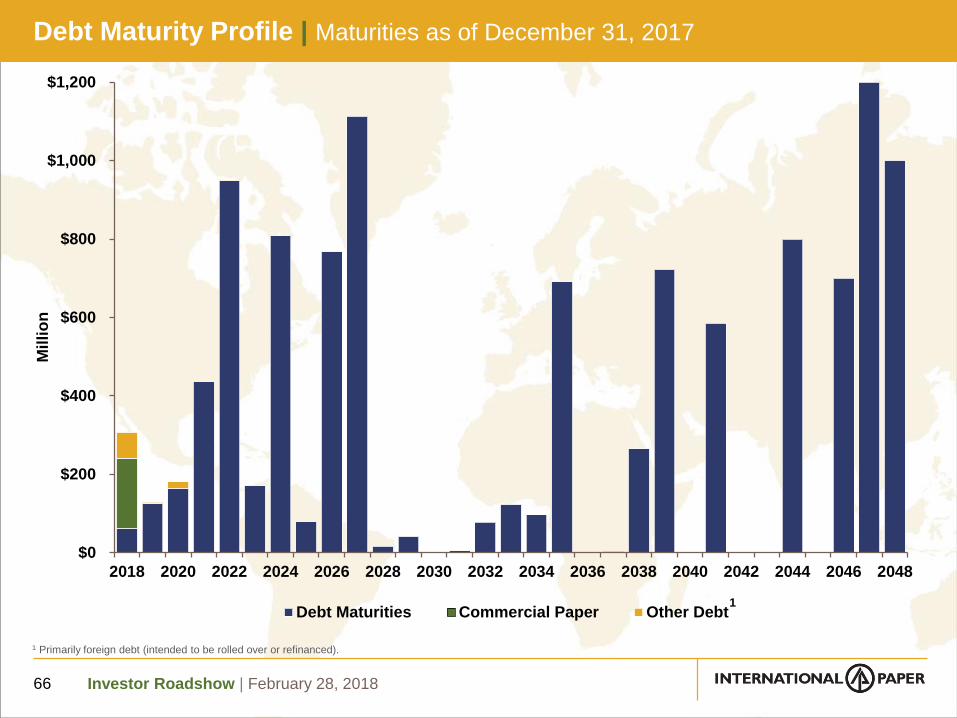
1 Primarily foreign debt (intended to be rolled over or refinanced).
Debt Maturity Profile | Maturities as of December 31, 2017
66
$0
$200
$400
$600
$800
$1,000
$1,200
2018 2020 2022 2024 2026 2028 2030 2032 2034 2036 2038 2040 2042 2044 2046 2048
Mil
lio
n
Debt Maturities Commercial Paper Other Debt1

Investor Roadshow | February 28, 2018
De-Risking the Company
67
Taking additional measures to reduce risk in our pension plan
– Making changes to the plan's asset allocation to emphasize more fixed income
– Reallocating the plan’s fixed income investments to longer duration maturities
– Expanding certain hedging strategies
– Transferred ~$1.3B of pension benefit obligations to Prudential (2H 2017)
IP is taking meaningful and deliberate steps to de-risk our pension plan
2004
Pension plan
closed to new
entrants
2014
Decision made to freeze
defined benefit pension plan
for active salary participants
effective 12/31/18
2016
Voluntary term-vested
buy out program
reduced plan size by
~10% and introduced
new LDI1 policy
Contributions2014
$353MM
2015
$750MM
2016
$750MM
2017
$1.25B
De-Risking
2017+
1 Liability Driven Investment
Investor Roadshow | February 28, 2018
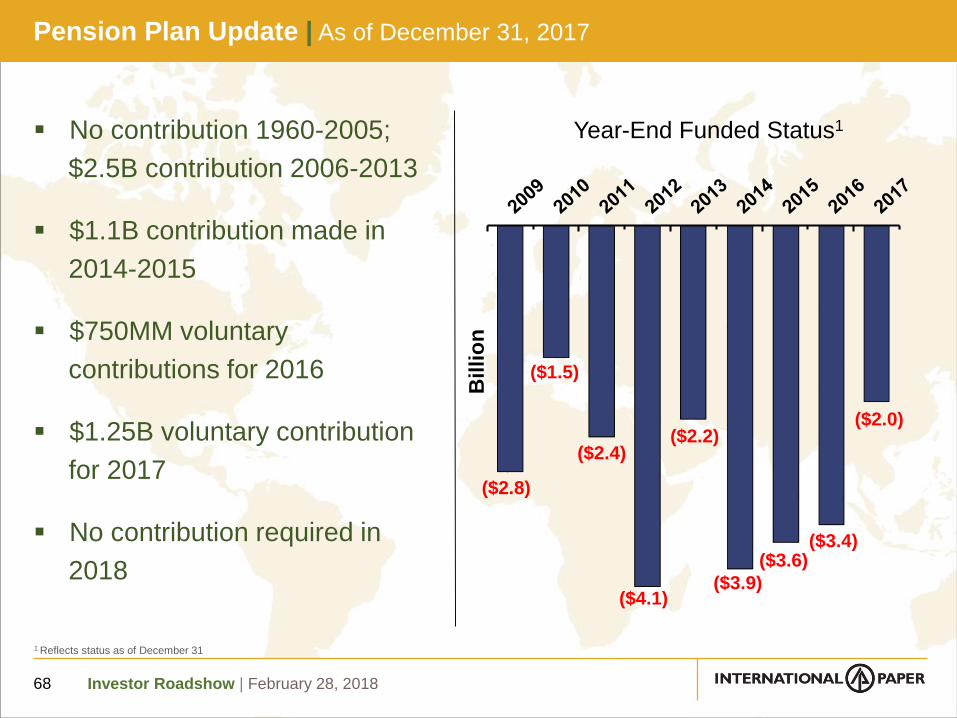
Pension Plan Update | As of December 31, 2017
68
No contribution 1960-2005;
$2.5B contribution 2006-2013
$1.1B contribution made in
2014-2015
$750MM voluntary
contributions for 2016
$1.25B voluntary contribution
for 2017
No contribution required in
2018
($2.8)
($1.5)
($2.4)
($4.1)
($2.2)
($3.9)
($3.6)($3.4)
($2.0)
Billio
n
Year-End Funded Status1
1 Reflects status as of December 31
Investor Roadshow | February 28, 2018
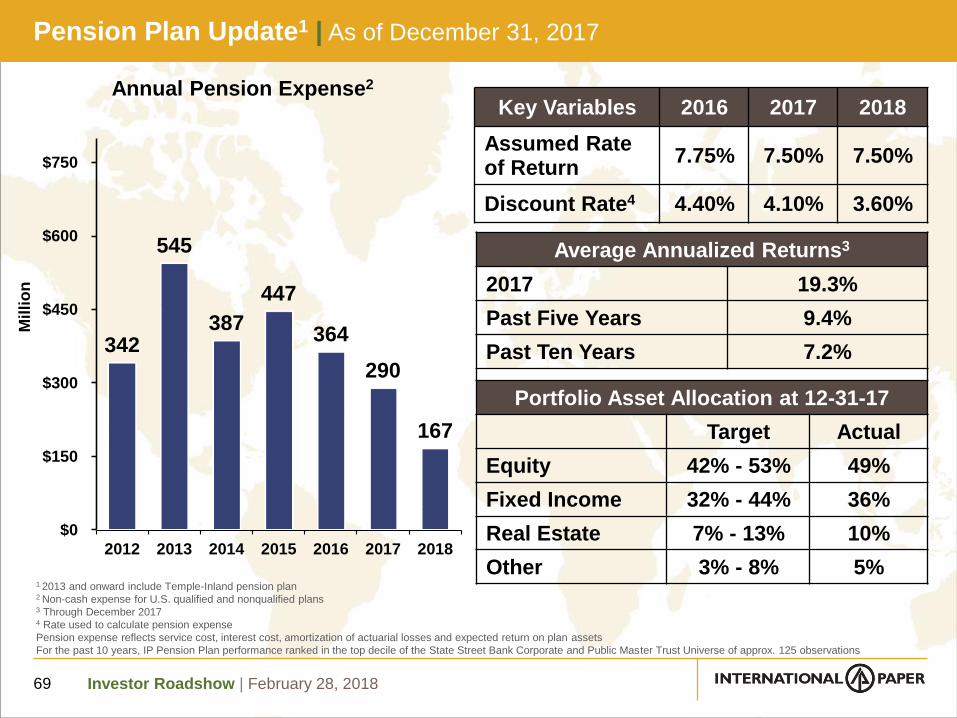
Pension Plan Update1 | As of December 31, 2017
69
342
545
387
447
364
290
167
$0
$150
$300
$450
$600
$750
2012 2013 2014 2015 2016 2017 2018
Mil
lio
n
Annual Pension Expense2
Key Variables 2016 2017 2018
Assumed Rate of Return
7.75% 7.50% 7.50%
Discount Rate4 4.40% 4.10% 3.60%
Average Annualized Returns3
2017 19.3%
Past Five Years 9.4%
Past Ten Years 7.2%
Portfolio Asset Allocation at 12-31-17
Target Actual
Equity 42% - 53% 49%
Fixed Income 32% - 44% 36%
Real Estate 7% - 13% 10%
Other 3% - 8% 5%1 2013 and onward include Temple-Inland pension plan2 Non-cash expense for U.S. qualified and nonqualified plans 3 Through December 20174 Rate used to calculate pension expense
Pension expense reflects service cost, interest cost, amortization of actuarial losses and expected return on plan assets
For the past 10 years, IP Pension Plan performance ranked in the top decile of the State Street Bank Corporate and Public Master Trust Universe of approx. 125 observations
Investor Roadshow | February 28, 2018
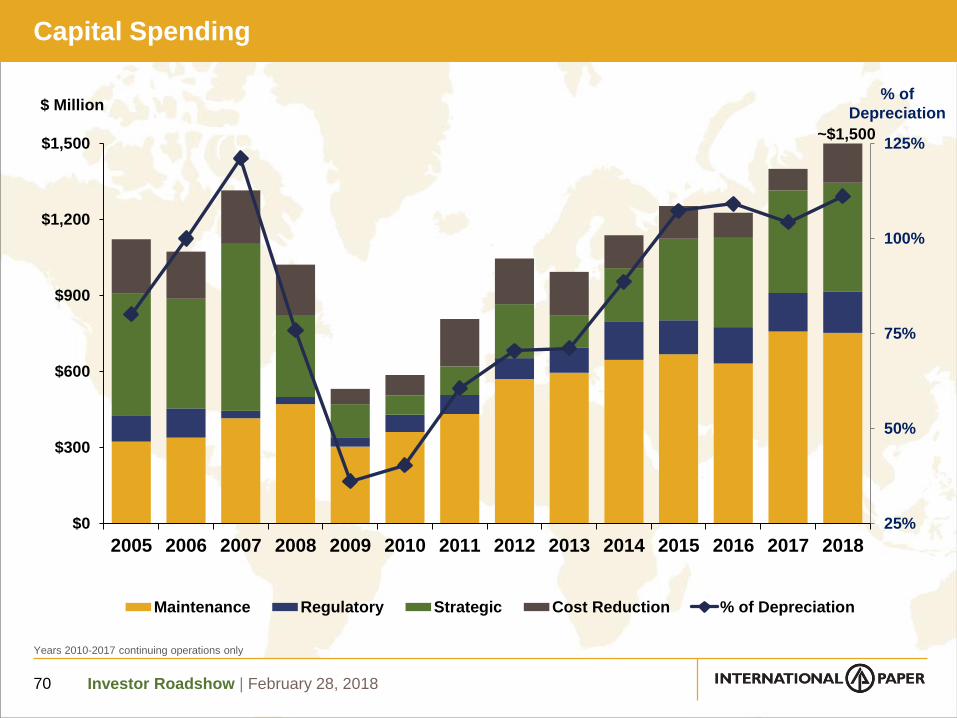
25%
50%
75%
100%
125%
$0
$300
$600
$900
$1,200
$1,500
2005 2006 2007 2008 2009 2010 2011 2012 2013 2014 2015 2016 2017 2018
Maintenance Regulatory Strategic Cost Reduction % of Depreciation
$ Million% of
Depreciation
Years 2010-2017 continuing operations only
Capital Spending
70
~$1,500

Investor Roadshow | February 28, 2018
2018 Capital Investment | Optimizing Advantaged Assets
71
$0
$200
$400
$600
$800
$1,000
$1,200
0 20,000 40,000 60,000 80,000 100,000
Cumulative Annual Containerboard Global Production (Thousand Tons)
IP N.A. Containerboard Mills
Cash Cost (Delivered to Chicago)
Source: IP Analysis, FisherSolve™
Maintenance &
Regulatory
Maintaining world-class,
low-cost, advantaged assets
Madrid Mill Conversion
$0.9B $0.2B $0.4B
Cost Reduction Strategic
Creating value through pipeline
of high return projects
≥ 30% IRR
Reinvesting in core businesses
with higher growth profile
$0.1B $0.5B
Investor Roadshow | February 28, 2018
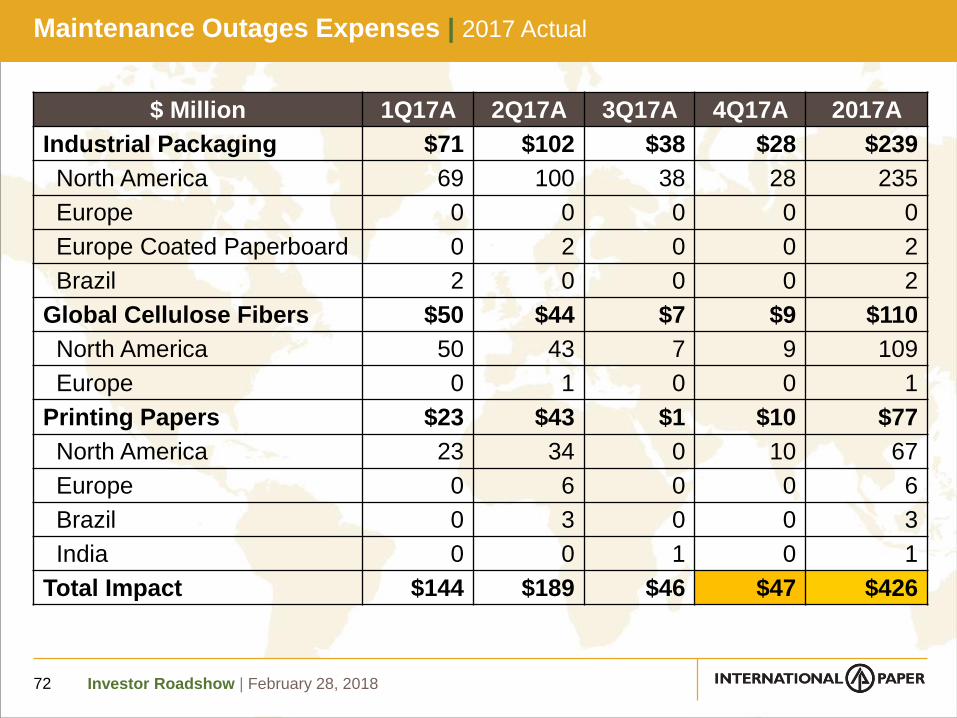
Maintenance Outages Expenses | 2017 Actual
72
$ Million 1Q17A 2Q17A 3Q17A 4Q17A 2017A
Industrial Packaging $71 $102 $38 $28 $239
North America 69 100 38 28 235
Europe 0 0 0 0 0
Europe Coated Paperboard 0 2 0 0 2
Brazil 2 0 0 0 2
Global Cellulose Fibers $50 $44 $7 $9 $110
North America 50 43 7 9 109
Europe 0 1 0 0 1
Printing Papers $23 $43 $1 $10 $77
North America 23 34 0 10 67
Europe 0 6 0 0 6
Brazil 0 3 0 0 3
India 0 0 1 0 1
Total Impact $144 $189 $46 $47 $426

Investor Roadshow | February 28, 2018
Maintenance Outages Expenses | 2018 Forecast
73
$ Million 1Q18F 2Q18F 3Q18F 4Q18F 2018F
Industrial Packaging $87 $122 $77 $22 $308
North America 81 117 77 22 297
Europe 0 0 0 0 0
Europe Coated Paperboard 5 3 0 0 8
Brazil 1 2 0 0 3
Global Cellulose Fibers $61 $44 $9 $36 $150
North America 59 37 9 36 141
Europe 2 7 0 0 9
Printing Papers $45 $50 $4 $9 $108
North America 32 29 0 9 70
Europe 8 17 0 0 25
Brazil 5 4 2 0 11
India 0 0 2 0 2
Total Impact $193 $216 $90 $67 $566

Investor Roadshow | February 28, 2018
North American Downtime
74
92141 125
86117 93
157
8546
230
85107 41
35
Maintenance Economic
30
11
25
010
24 25
111
3617
4
2918
0
55
7 11
13190
Containerboard
Uncoated Papers
Cellulose Fibers
Th
ou
sa
nd
To
ns
Th
ou
sa
nd
To
ns
322353
210193
158
13
212
128
Th
ou
sa
nd
To
ns

Investor Roadshow | February 28, 2018
Total Cash Cost Components | 2017
75
Fiber35%
Materials15%
Freight12%
Labor12%
Energy8%
Overhead10%
Chemicals8%
2/27/2018
North American mills only (Excludes Newly Acquired Pulp Business)
Investor Roadshow | February 28, 2018
90
95
100
105
110
115
120
125
130
2017
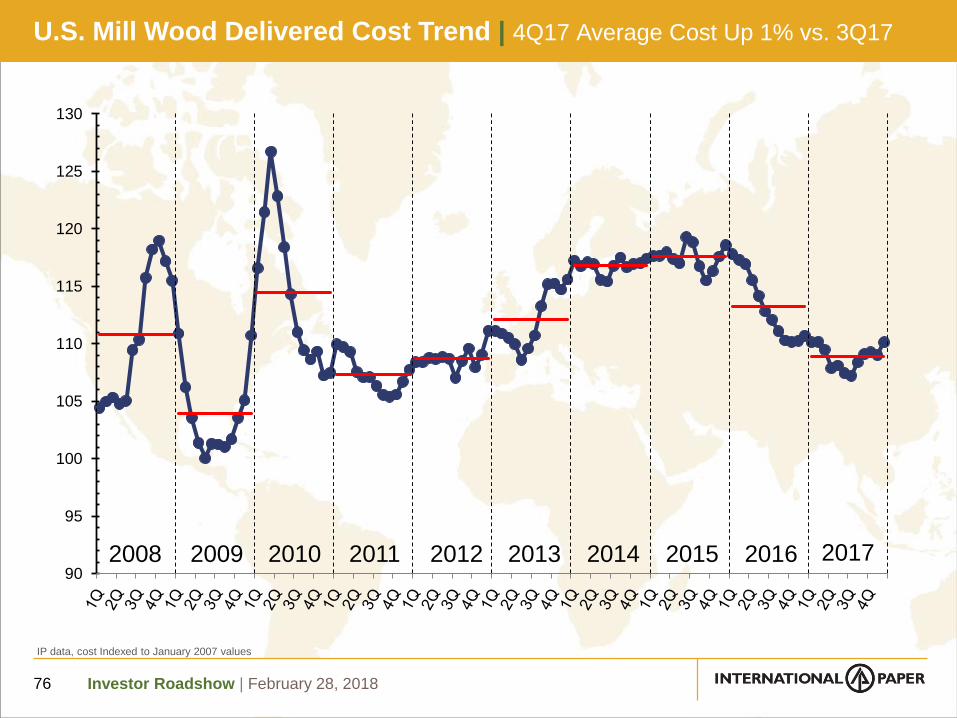
U.S. Mill Wood Delivered Cost Trend | 4Q17 Average Cost Up 1% vs. 3Q17
76
IP data, cost Indexed to January 2007 values
2008 2009 2010 2011 2012 2013 2014 2015 2016
Investor Roadshow | February 28, 2018
40
60
80
100
120
140
160
180
200
220
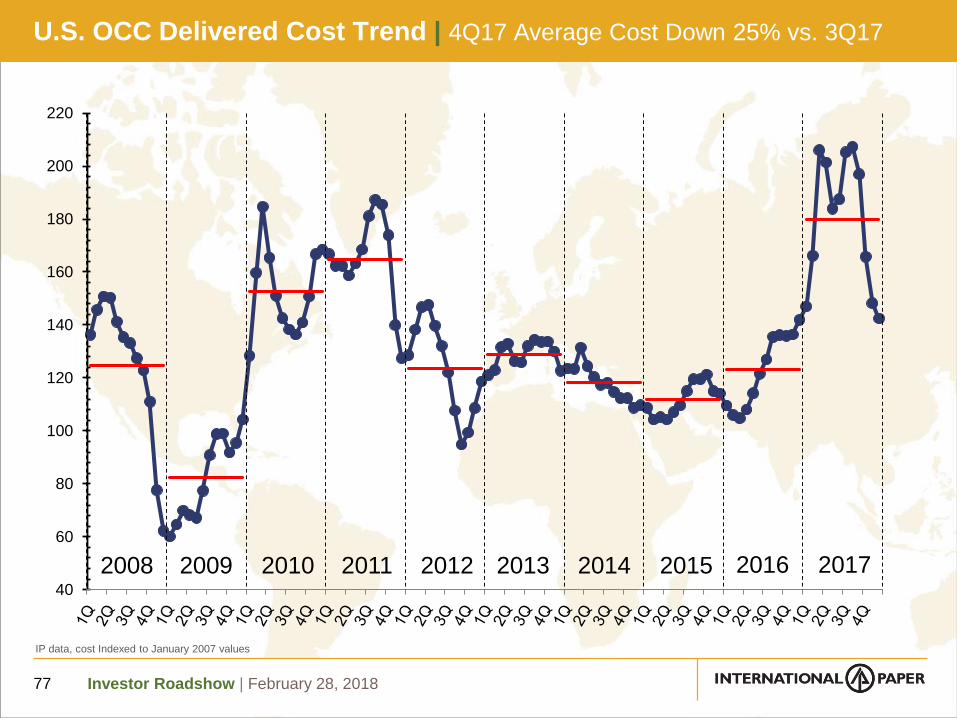
IP data, cost Indexed to January 2007 values
U.S. OCC Delivered Cost Trend | 4Q17 Average Cost Down 25% vs. 3Q17
77
2008 2009 2010 2011 2012 2013 2014 2015 2016 2017

Investor Roadshow | February 28, 2018
U.S. Natural Gas Cost Trend | 4Q17 Average Cost Down 2% vs. 3Q17
78
0
50
100
150
200
250
IP data, cost Indexed to January 2007 values
NYMEX Natural Gas closing prices
2008 2009 2010 2011 2012 2013 2014 2015 2016 2017
Investor Roadshow | February 28, 2018
0
50
100
150
200
250
300
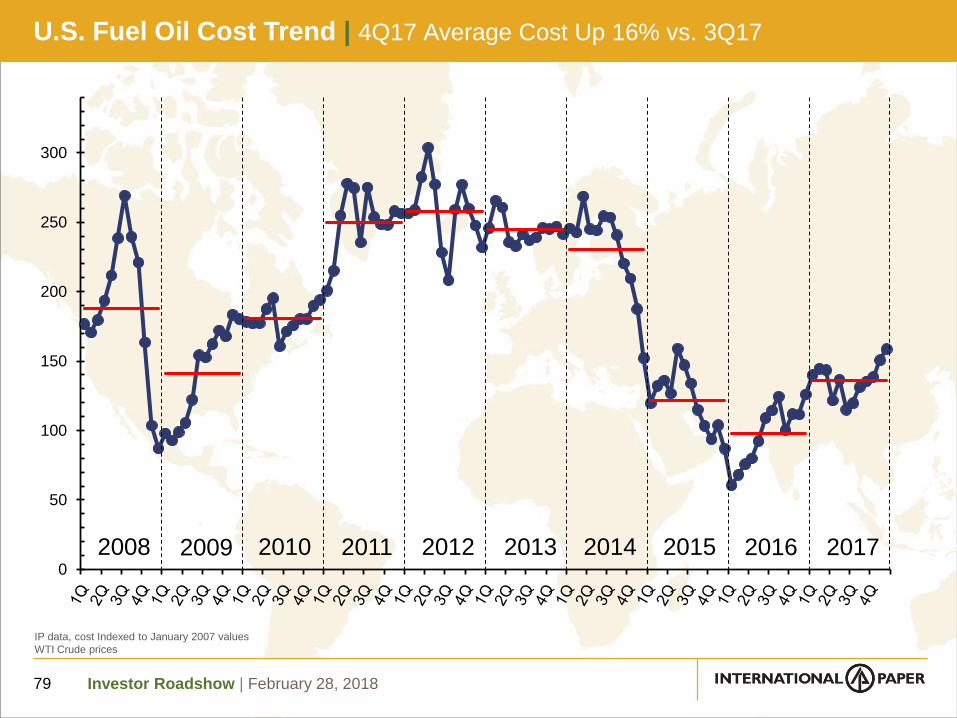
U.S. Fuel Oil Cost Trend | 4Q17 Average Cost Up 16% vs. 3Q17
79
IP data, cost Indexed to January 2007 values
WTI Crude prices
2008 2009 2010 2011 2012 2013 2014 2015 2016 2017
Investor Roadshow | February 28, 2018
75
100
125
150
175
200
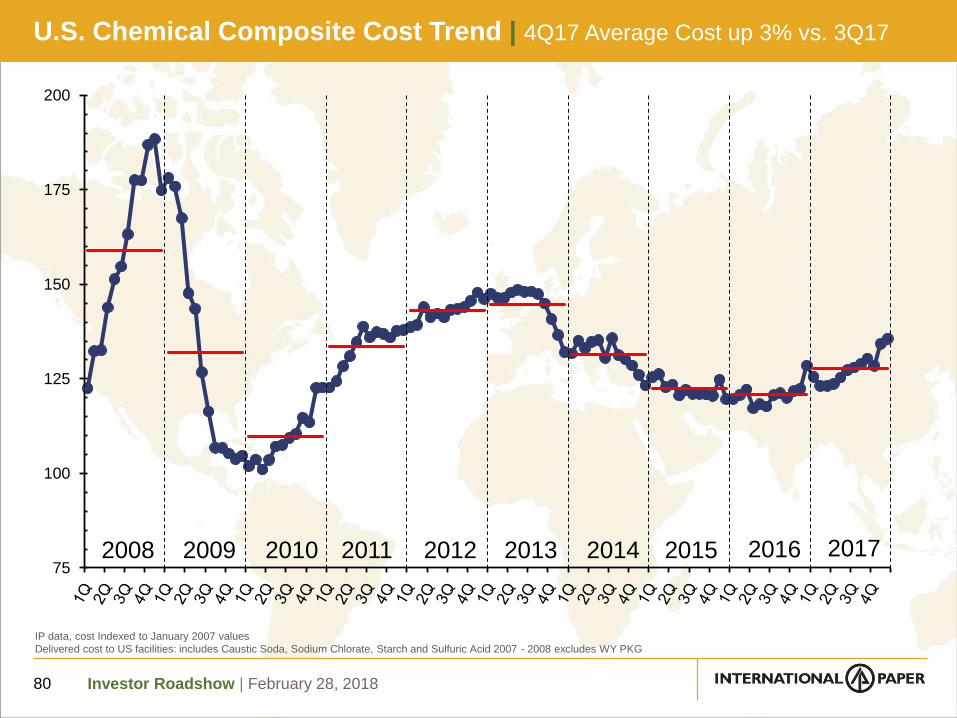
U.S. Chemical Composite Cost Trend | 4Q17 Average Cost up 3% vs. 3Q17
80
IP data, cost Indexed to January 2007 values
Delivered cost to US facilities: includes Caustic Soda, Sodium Chlorate, Starch and Sulfuric Acid 2007 - 2008 excludes WY PKG
2008 2009 2010 2011 2012 2013 2014 2015 2016 2017
Investor Roadshow | February 28, 2018
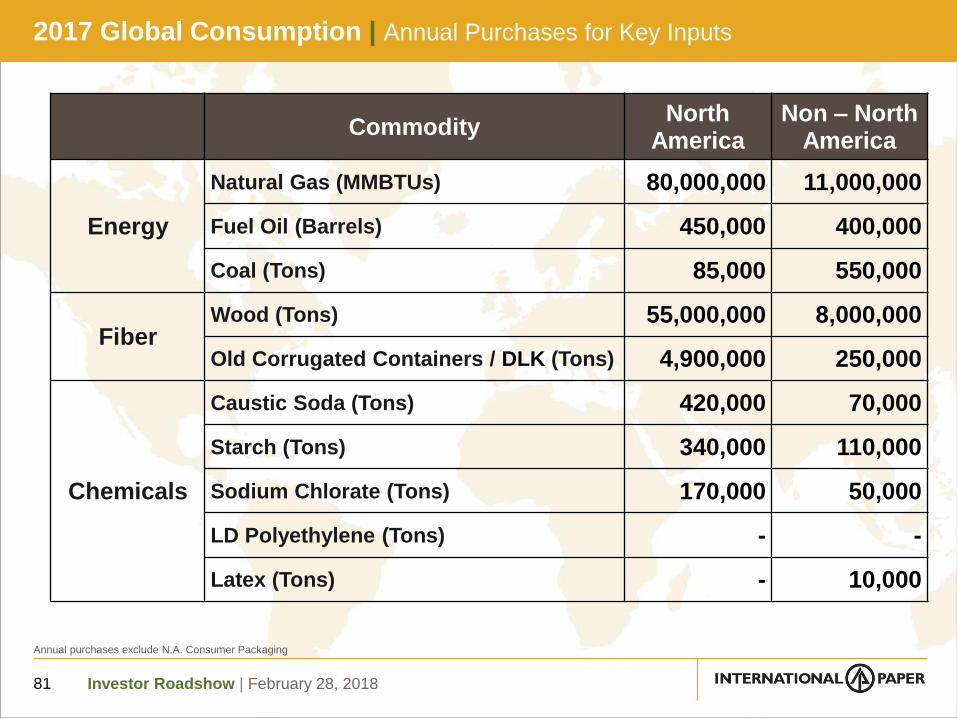
2017 Global Consumption | Annual Purchases for Key Inputs
81
CommodityNorth
AmericaNon – North
America
Energy
Natural Gas (MMBTUs) 80,000,000 11,000,000
Fuel Oil (Barrels) 450,000 400,000
Coal (Tons) 85,000 550,000
FiberWood (Tons) 55,000,000 8,000,000
Old Corrugated Containers / DLK (Tons) 4,900,000 250,000
Chemicals
Caustic Soda (Tons) 420,000 70,000
Starch (Tons) 340,000 110,000
Sodium Chlorate (Tons) 170,000 50,000
LD Polyethylene (Tons) - -
Latex (Tons) - 10,000
Annual purchases exclude N.A. Consumer Packaging

Investor Roadshow | February 28, 2018
Global Citizenship | Sustainability throughout the Value Chain
82

Investor Roadshow | February 28, 20188383
Global Citizenship | The IP Way Forward

Investor Roadshow | February 28, 2018
Global Citizenship | Progress Toward our Vision 2020 Goals
8484
* Includes $3 million raised through employee giving and fundraising
WATER QUALITY PROGRESS
28% improvementin effluent water quality
SOLID WASTE PROGRESS
11% reductionin manufacturing waste to landfills
WATER STEWARDSHIP PROGRESS
Mapped water use and risk by location, identified priority mills and initiated annual stakeholder and facility assessments
SUPPLY CHAIN PROGRESS
Established baseline supply chain performance and implemented improvement plans
AIR EMISSIONS PROGRESS
23% reductionin air emissions(PM, SO2, NOx)
GHG EMISSIONS PROGRESS
19% reductionin greenhouse gas emissions
FIBER EFFICIENCY PROGRESS
0.79% fiber lossfrom reporting mills
SAFETY PROGRESS
39% reductionin serious safety incidents
COMMUNITY INVOLVEMENT PROGRESS
$17.3 milliondonated to charitable organizations in 2016*
ENERGY EFFICIENCY PROGRESS
6.4% improvementin purchased energy efficiency
FIBER CERTIFICATION PROGRESS
31% increasein certified fiber volume
RECYCLING PROGRESS
17% increasein recovery of OCC
Investor Roadshow | February 28, 2018
Investor Relations | Contact Information
85
Guillermo GutierrezVice President, Investor Relations
+1-901-419-1731
Michele VargasDirector, Investor Relations
+1-901-419-7287
Betty GroomFinancial & Administrative Analyst
+1-901-419-4250
Investor Roadshow | February 28, 2018
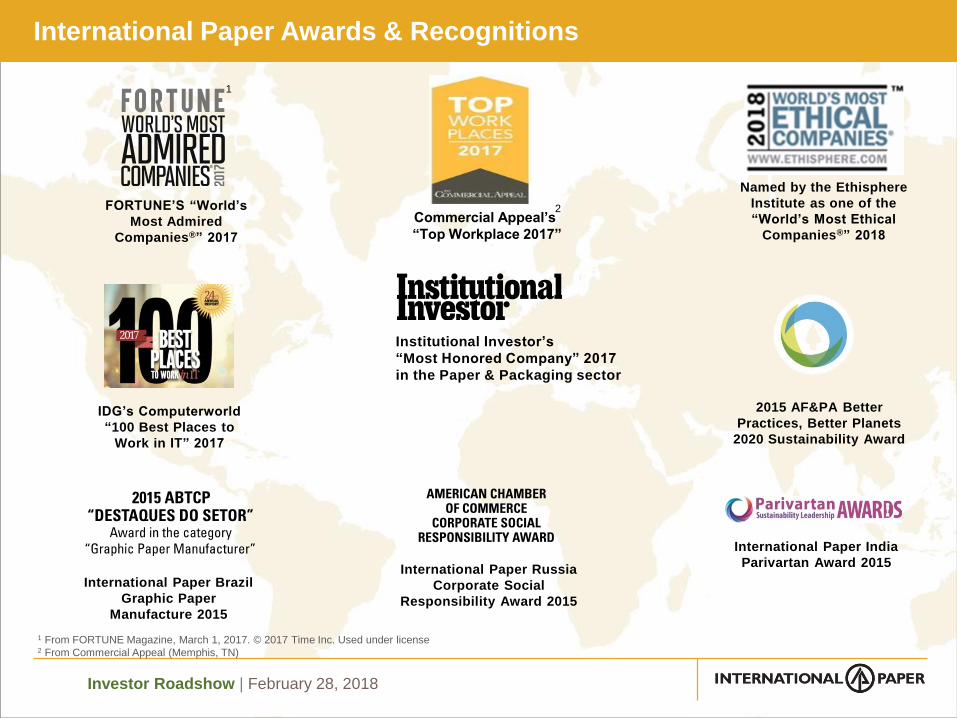
International Paper Brazil
Graphic Paper
Manufacture 2015
International Paper Russia
Corporate Social
Responsibility Award 2015
Named by the Ethisphere
Institute as one of the
“World’s Most Ethical
Companies®” 2018
2015 AF&PA Better
Practices, Better Planets
2020 Sustainability Award
International Paper India
Parivartan Award 2015
International Paper Awards & Recognitions
IDG’s Computerworld
“100 Best Places to
Work in IT” 2017
1 From FORTUNE Magazine, March 1, 2017. © 2017 Time Inc. Used under license2 From Commercial Appeal (Memphis, TN)
FORTUNE’S “World’s
Most Admired
Companies®” 2017
1
Commercial Appeal’s
“Top Workplace 2017”
2
Institutional Investor’s
“Most Honored Company” 2017
in the Paper & Packaging sector