investor update - franklincovey
TRANSCRIPT

1
Investor UpdateThird Quarter FY19
Forward-looking Statements / Non-GAAP
This presentation contains forward-looking statements within the meaning of the Private Securities Litigation Reform Act of 1995. Forward-looking statements are based upon management’s current expectations and are subject to various risks and uncertainties including, but not limited to: The ability of the Company to stabilize and grow revenues; The acceptance of, and renewal rates for the All Access Pass; The ability of the Company to hire productive sales professionals; General economic conditions; Competition in the Company's targeted marketplace; Market acceptance of new products or services and marketing strategies; Changes in the Company's market share; Changes in the size of the overall market for the Company's products; Changes in the training and spending policies of the Company's clients, and other factors identified and discussed in the Company's most recent Annual Report on Form 10-K and other periodic reports filed with the Securities and Exchange Commission. Many of these conditions are beyond our control or influence, any one of which may cause future results to differ materially from the Company's current expectations, and there can be no assurance the Company's actual future performance will meet management's expectations. These forward-looking statements are based on management's current expectations and we undertake no obligation to update or revise these forward-looking statements to reflect events or circumstances after the date of today’s presentation, except as required by law.
The Securities and Exchange Commission‘s Regulation G applies to any public disclosure or release of material information that includes a non-GAAP financial measure. In the event of such a disclosure or release, Regulation G requires: (i) the presentation of the most directly comparable financial measure calculated and presented in accordance with GAAP and (ii) a reconciliation of the differences between the non-GAAP financial measure presented and the most directly comparable financial measure calculated and presented in accordance with GAAP. The required presentations and reconciliations are contained herein and can be found at our website at www.franklincovey.com.
FranklinCovey uses the non-GAAP financial measure “earnings before interest, taxes, depreciation and amortization” (“EBITDA”) to assess the operating results and effectiveness of the Company’s ongoing training and consulting business. In addition, the Company also uses the non-GAAP financial measure “Adjusted EBITDA” as a representation of the Company‘s operating performance. Adjusted EBITDA is defined as pre-tax net income (loss), plus depreciation and amortization, net interest income (expense), and special charges, such as the gain on the sale of the Japan Products division in Fiscal 2010, restructuring costs, and asset impairment changes. The Company finds these non-GAAP financial measures to be useful when evaluating its operating and financial performance. These nonGAAP financial measures may not be comparable to similar measures used by other companies and should not be used as a substitute for revenue, net income (loss) or other GAAP operating measures.
2
Forward-looking Statements / Non-GAAP
33
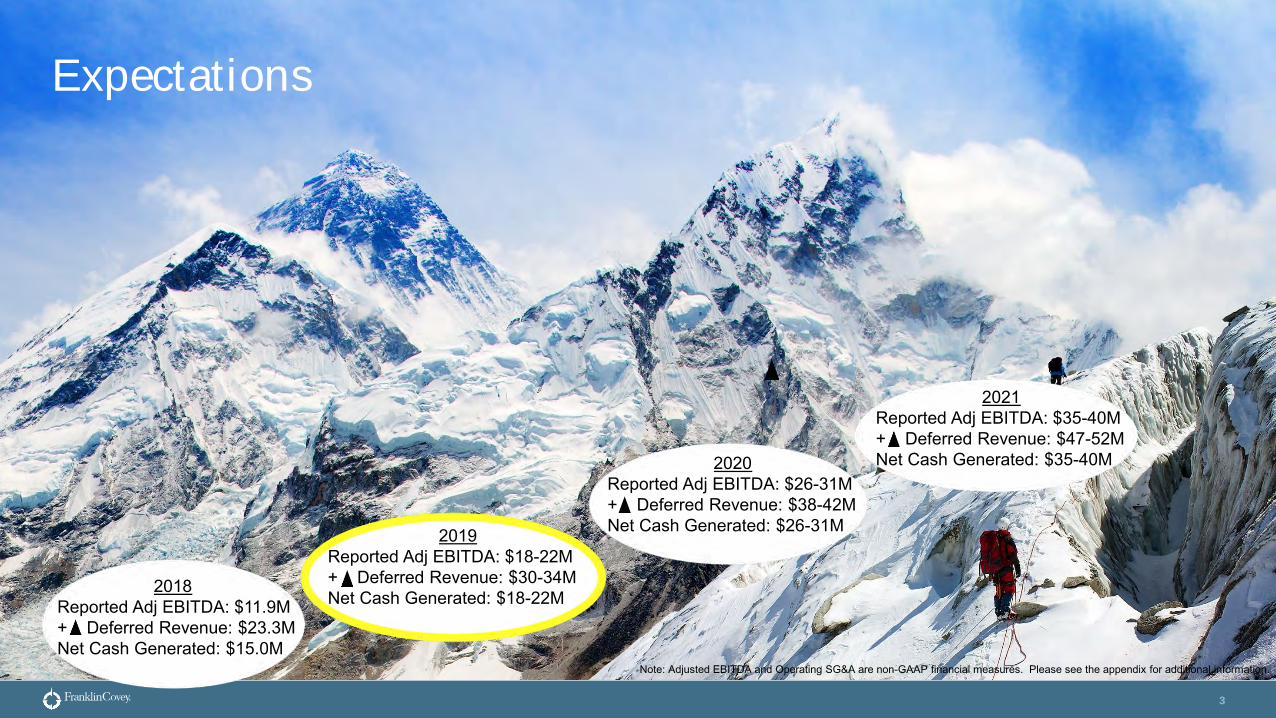
2018Reported Adj EBITDA: $11.9M+ Deferred Revenue: $23.3MNet Cash Generated: $15.0M
2019Reported Adj EBITDA: $18-22M+ Deferred Revenue: $30-34MNet Cash Generated: $18-22M
2021Reported Adj EBITDA: $35-40M+ Deferred Revenue: $47-52MNet Cash Generated: $35-40M
Note: Adjusted EBITDA and Operating SG&A are non-GAAP financial measures. Please see the appendix for additional information.
Expectations
2020Reported Adj EBITDA: $26-31M+ Deferred Revenue: $38-42MNet Cash Generated: $26-31M

4
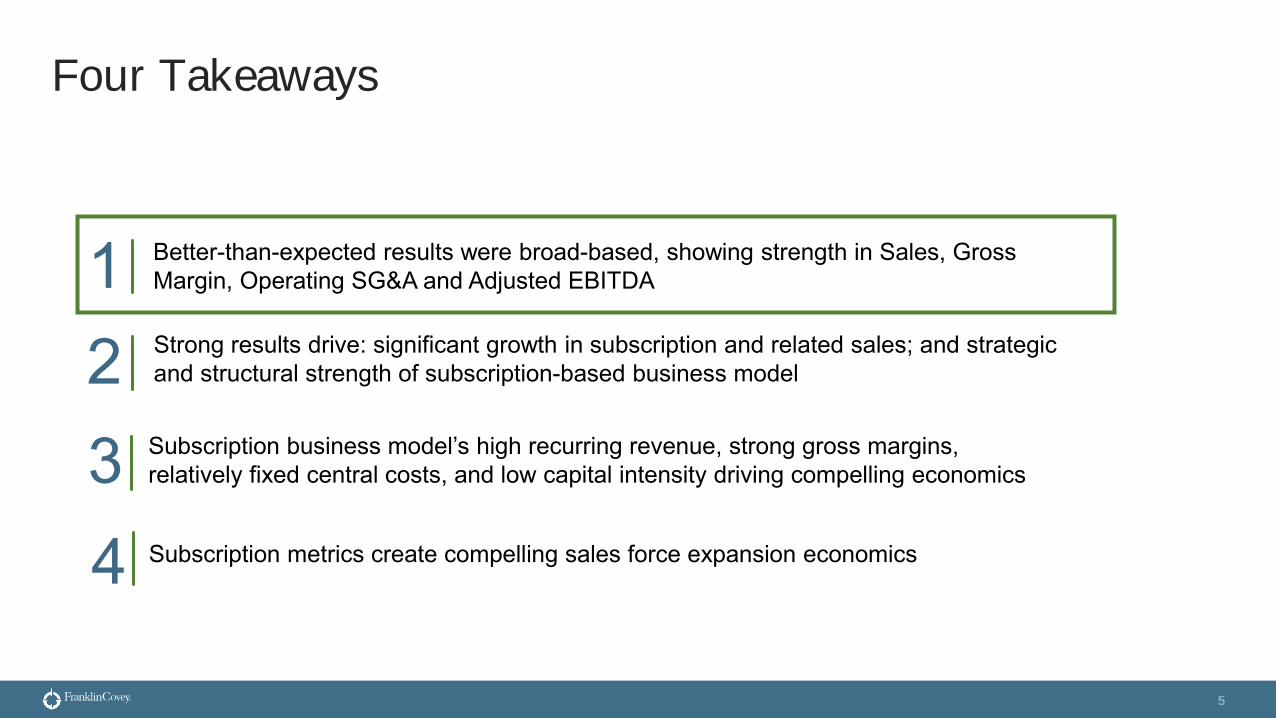
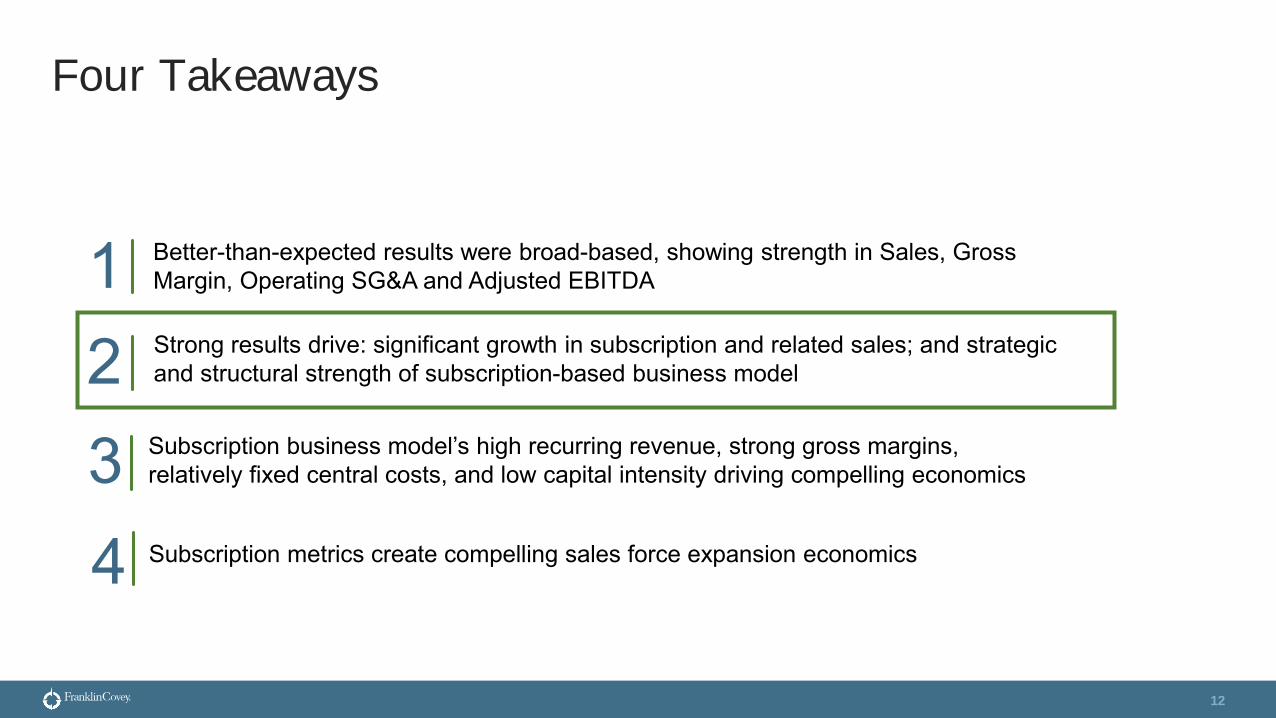
Four Takeaways
1 Better-than-expected results were broad-based, showing strength in Sales, Gross Margin, Operating SG&A and Adjusted EBITDA
3 Subscription business model’s high recurring revenue, strong gross margins, relatively fixed central costs, and low capital intensity driving compelling economics
2 Strong results drive: significant growth in subscription and related sales; and strategic and structural strength of subscription-based business model
4 Subscription metrics create compelling sales force expansion economics
5
Four Takeaways
1 Better-than-expected results were broad-based, showing strength in Sales, Gross Margin, Operating SG&A and Adjusted EBITDA
3 Subscription business model’s high recurring revenue, strong gross margins, relatively fixed central costs, and low capital intensity driving compelling economics
2 Strong results drive: significant growth in subscription and related sales; and strategic and structural strength of subscription-based business model
4 Subscription metrics create compelling sales force expansion economics
6
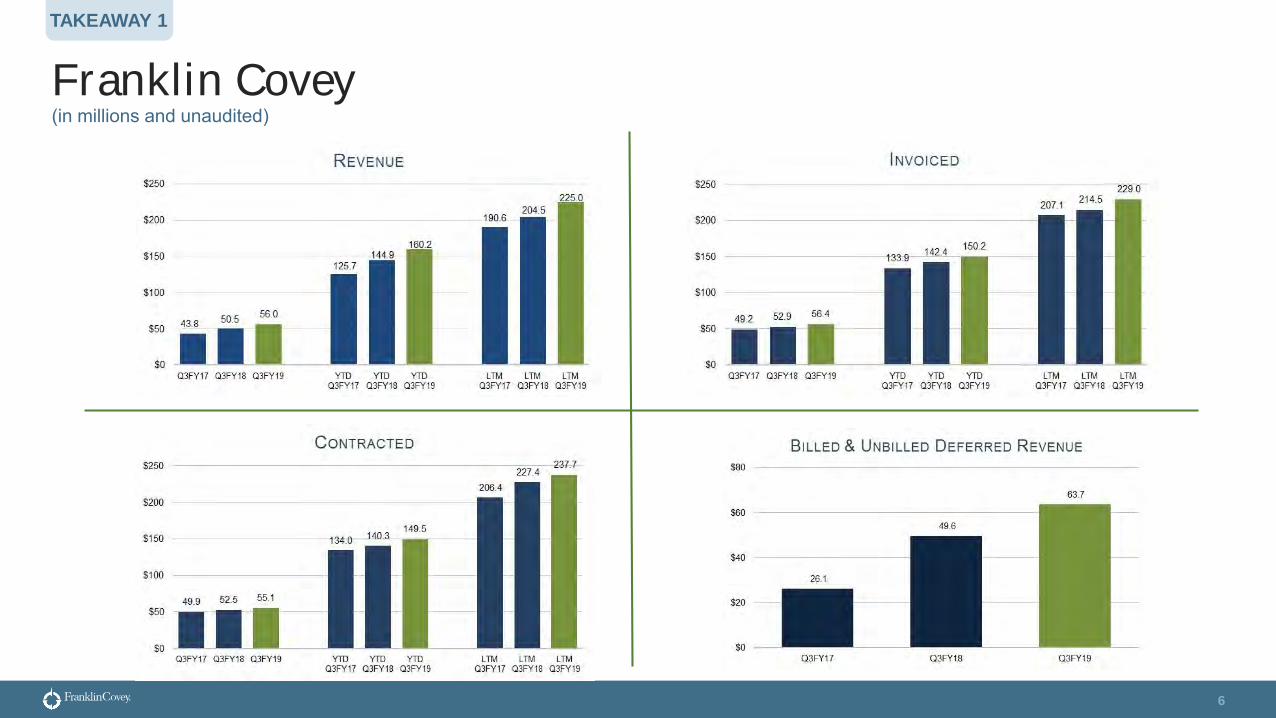
Franklin Covey
TAKEAWAY 1
(in millions and unaudited)
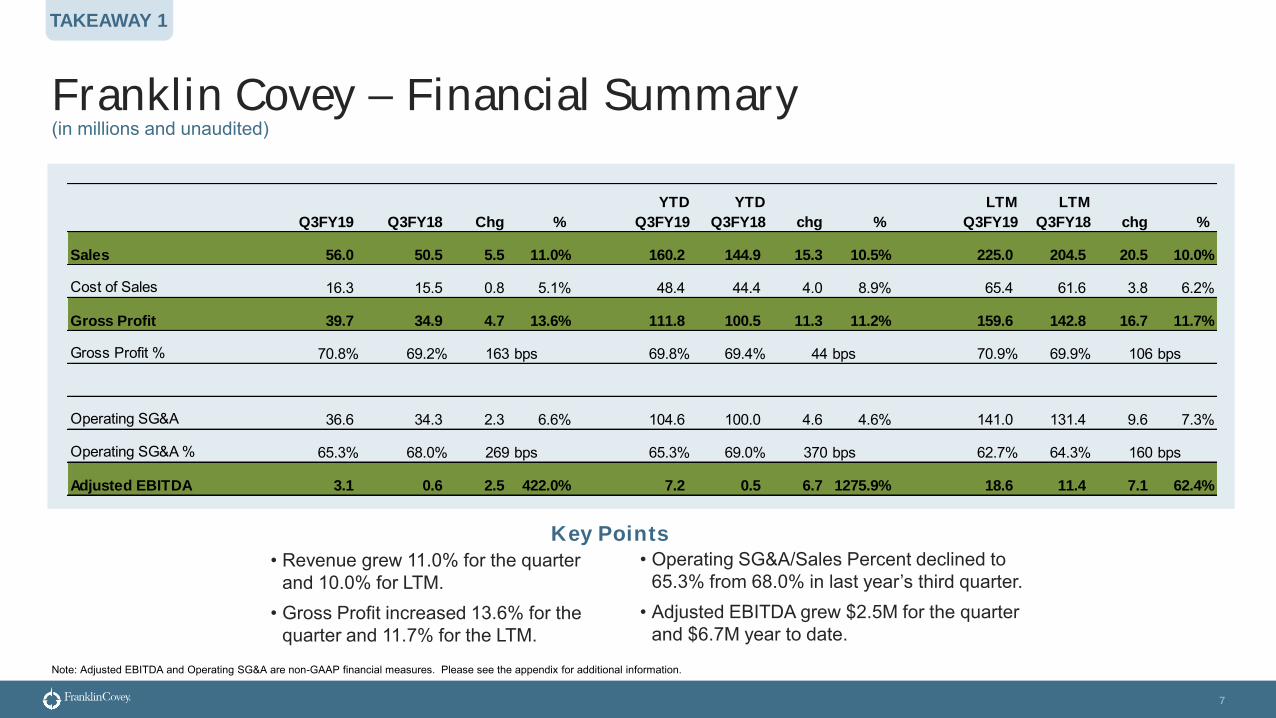
Franklin Covey – Financial Summary
7
(in millions and unaudited)
Key Points• Revenue grew 11.0% for the quarter
and 10.0% for LTM.• Gross Profit increased 13.6% for the
quarter and 11.7% for the LTM.Note: Adjusted EBITDA and Operating SG&A are non-GAAP financial measures. Please see the appendix for additional information.
TAKEAWAY 1
• Operating SG&A/Sales Percent declined to 65.3% from 68.0% in last year’s third quarter.
• Adjusted EBITDA grew $2.5M for the quarterand $6.7M year to date.
Q3FY19 Q3FY18 Chg %
YTD
Q3FY19
YTD
Q3FY18 chg %
LTM
Q3FY19
LTM
Q3FY18 chg %
Sales 56.0 50.5 5.5 11.0% 160.2 144.9 15.3 10.5% 225.0 204.5 20.5 10.0%
Cost of Sales 16.3 15.5 0.8 5.1% 48.4 44.4 4.0 8.9% 65.4 61.6 3.8 6.2%
Gross Profit 39.7 34.9 4.7 13.6% 111.8 100.5 11.3 11.2% 159.6 142.8 16.7 11.7%
Gross Profit % 70.8% 69.2% 163 bps 69.8% 69.4% 44 bps 70.9% 69.9% 106 bps
Operating SG&A 36.6 34.3 2.3 6.6% 104.6 100.0 4.6 4.6% 141.0 131.4 9.6 7.3%
Operating SG&A % 65.3% 68.0% 269 bps 65.3% 69.0% 370 bps 62.7% 64.3% 160 bps
Adjusted EBITDA 3.1 0.6 2.5 422.0% 7.2 0.5 6.7 1275.9% 18.6 11.4 7.1 62.4%
8
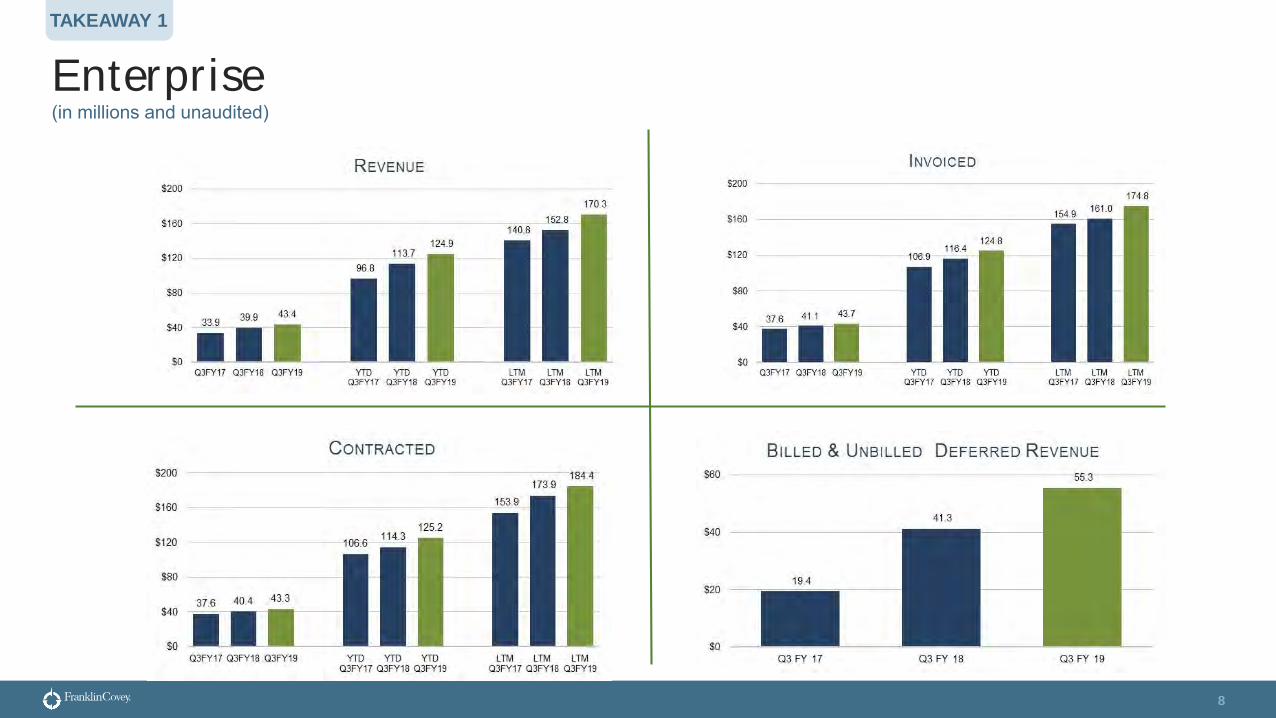
Enterprise
TAKEAWAY 1
(in millions and unaudited)
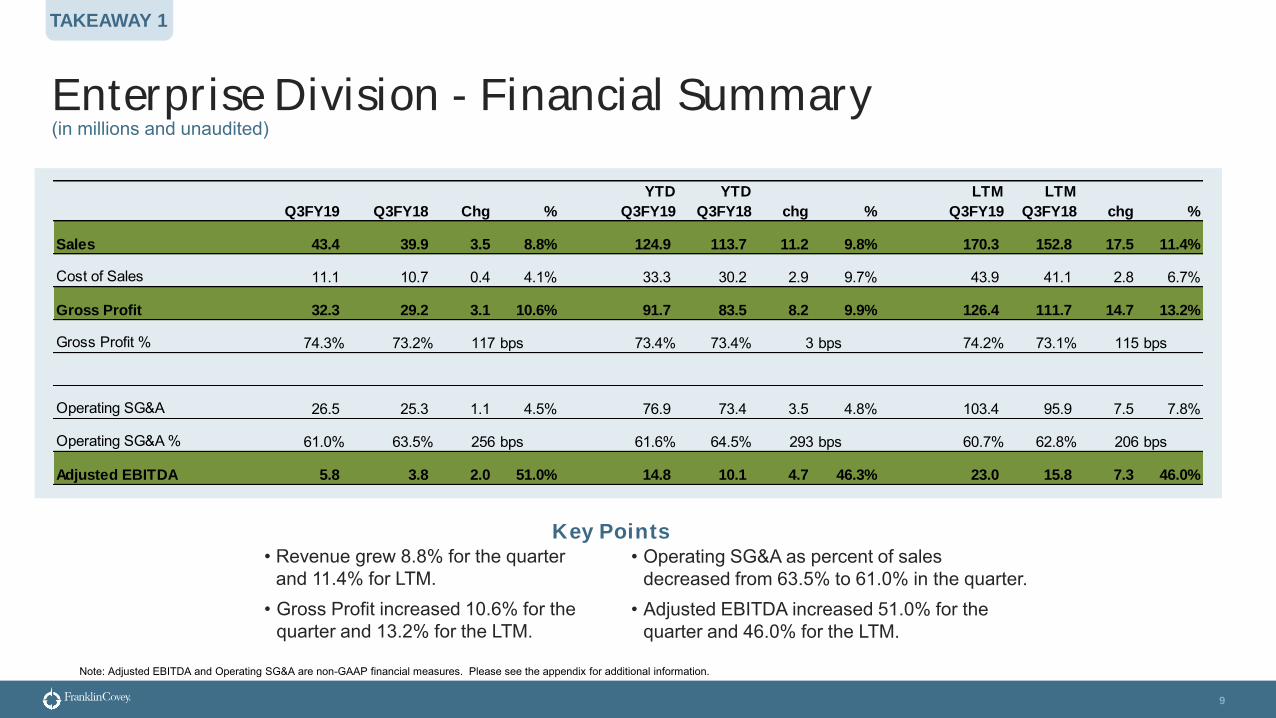
Enterprise Division - Financial Summary
9
Key Points• Revenue grew 8.8% for the quarter
and 11.4% for LTM.• Gross Profit increased 10.6% for the
quarter and 13.2% for the LTM.
Note: Adjusted EBITDA and Operating SG&A are non-GAAP financial measures. Please see the appendix for additional information.
TAKEAWAY 1
• Operating SG&A as percent of sales decreased from 63.5% to 61.0% in the quarter.
• Adjusted EBITDA increased 51.0% for the quarter and 46.0% for the LTM.
(in millions and unaudited)
Q3FY19 Q3FY18 Chg %
YTD
Q3FY19
YTD
Q3FY18 chg %
LTM
Q3FY19
LTM
Q3FY18 chg %
Sales 43.4 39.9 3.5 8.8% 124.9 113.7 11.2 9.8% 170.3 152.8 17.5 11.4%
Cost of Sales 11.1 10.7 0.4 4.1% 33.3 30.2 2.9 9.7% 43.9 41.1 2.8 6.7%
Gross Profit 32.3 29.2 3.1 10.6% 91.7 83.5 8.2 9.9% 126.4 111.7 14.7 13.2%
Gross Profit % 74.3% 73.2% 117 bps 73.4% 73.4% 3 bps 74.2% 73.1% 115 bps
Operating SG&A 26.5 25.3 1.1 4.5% 76.9 73.4 3.5 4.8% 103.4 95.9 7.5 7.8%
Operating SG&A % 61.0% 63.5% 256 bps 61.6% 64.5% 293 bps 60.7% 62.8% 206 bps
Adjusted EBITDA 5.8 3.8 2.0 51.0% 14.8 10.1 4.7 46.3% 23.0 15.8 7.3 46.0%
10
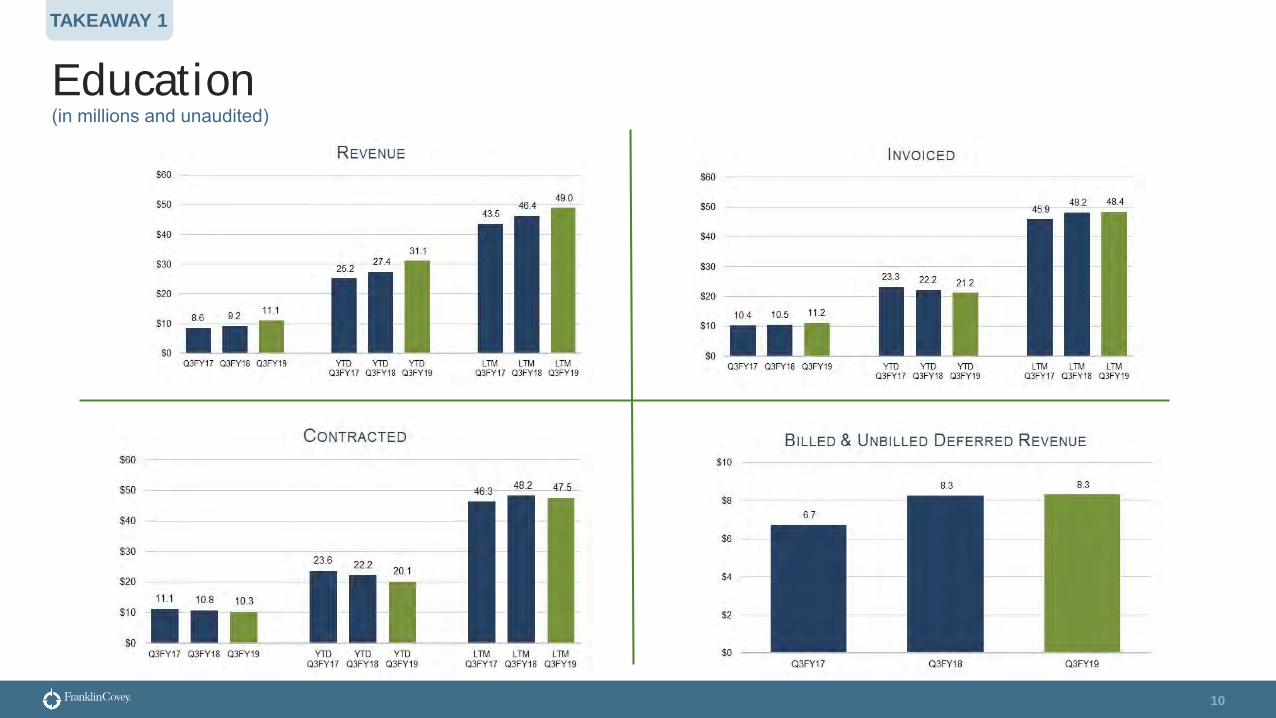
Education
TAKEAWAY 1
(in millions and unaudited)
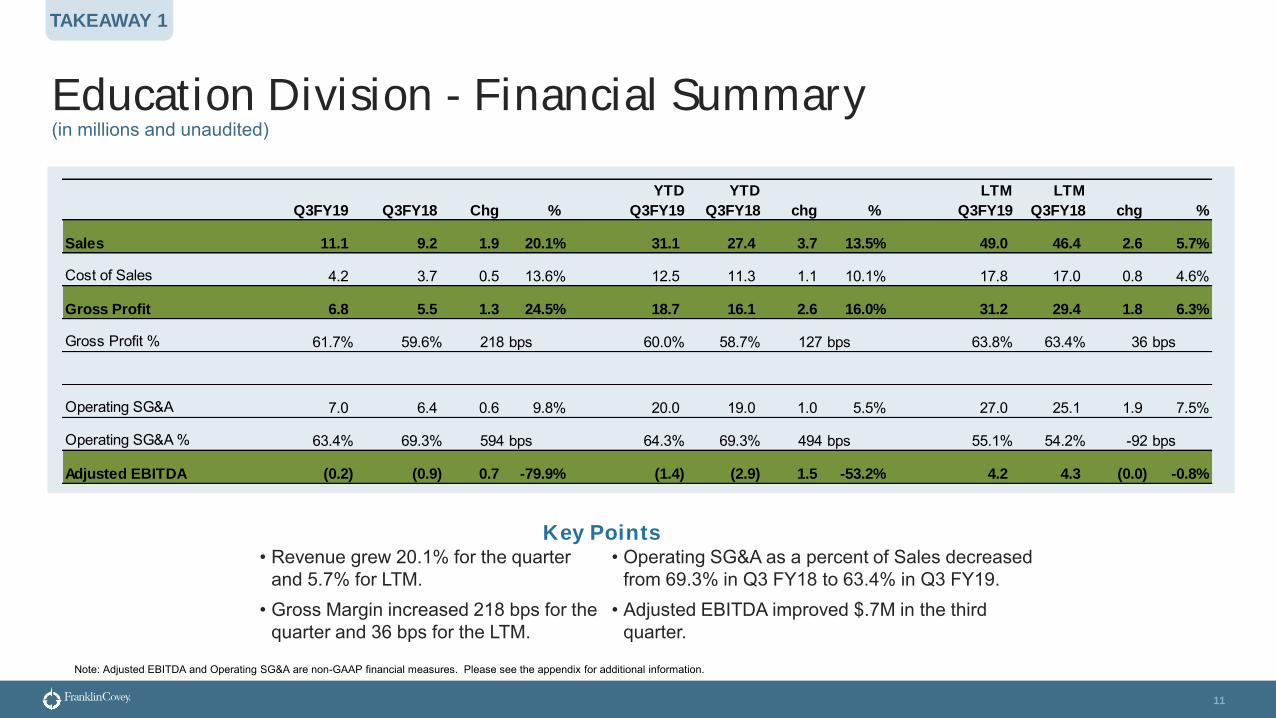
Education Division - Financial Summary
11
Key Points• Revenue grew 20.1% for the quarter
and 5.7% for LTM.• Gross Margin increased 218 bps for the
quarter and 36 bps for the LTM.
Note: Adjusted EBITDA and Operating SG&A are non-GAAP financial measures. Please see the appendix for additional information.
TAKEAWAY 1
• Operating SG&A as a percent of Sales decreased from 69.3% in Q3 FY18 to 63.4% in Q3 FY19.
• Adjusted EBITDA improved $.7M in the third quarter.
(in millions and unaudited)
Q3FY19 Q3FY18 Chg %
YTD
Q3FY19
YTD
Q3FY18 chg %
LTM
Q3FY19
LTM
Q3FY18 chg %
Sales 11.1 9.2 1.9 20.1% 31.1 27.4 3.7 13.5% 49.0 46.4 2.6 5.7%
Cost of Sales 4.2 3.7 0.5 13.6% 12.5 11.3 1.1 10.1% 17.8 17.0 0.8 4.6%
Gross Profit 6.8 5.5 1.3 24.5% 18.7 16.1 2.6 16.0% 31.2 29.4 1.8 6.3%
Gross Profit % 61.7% 59.6% 218 bps 60.0% 58.7% 127 bps 63.8% 63.4% 36 bps
Operating SG&A 7.0 6.4 0.6 9.8% 20.0 19.0 1.0 5.5% 27.0 25.1 1.9 7.5%
Operating SG&A % 63.4% 69.3% 594 bps 64.3% 69.3% 494 bps 55.1% 54.2% -92 bps
Adjusted EBITDA (0.2) (0.9) 0.7 -79.9% (1.4) (2.9) 1.5 -53.2% 4.2 4.3 (0.0) -0.8%
12
Four Takeaways
1 Better-than-expected results were broad-based, showing strength in Sales, Gross Margin, Operating SG&A and Adjusted EBITDA
3 Subscription business model’s high recurring revenue, strong gross margins, relatively fixed central costs, and low capital intensity driving compelling economics
2 Strong results drive: significant growth in subscription and related sales; and strategic and structural strength of subscription-based business model
4 Subscription metrics create compelling sales force expansion economics

13
TAKEAWAY 2
Continued Strong Growth
14
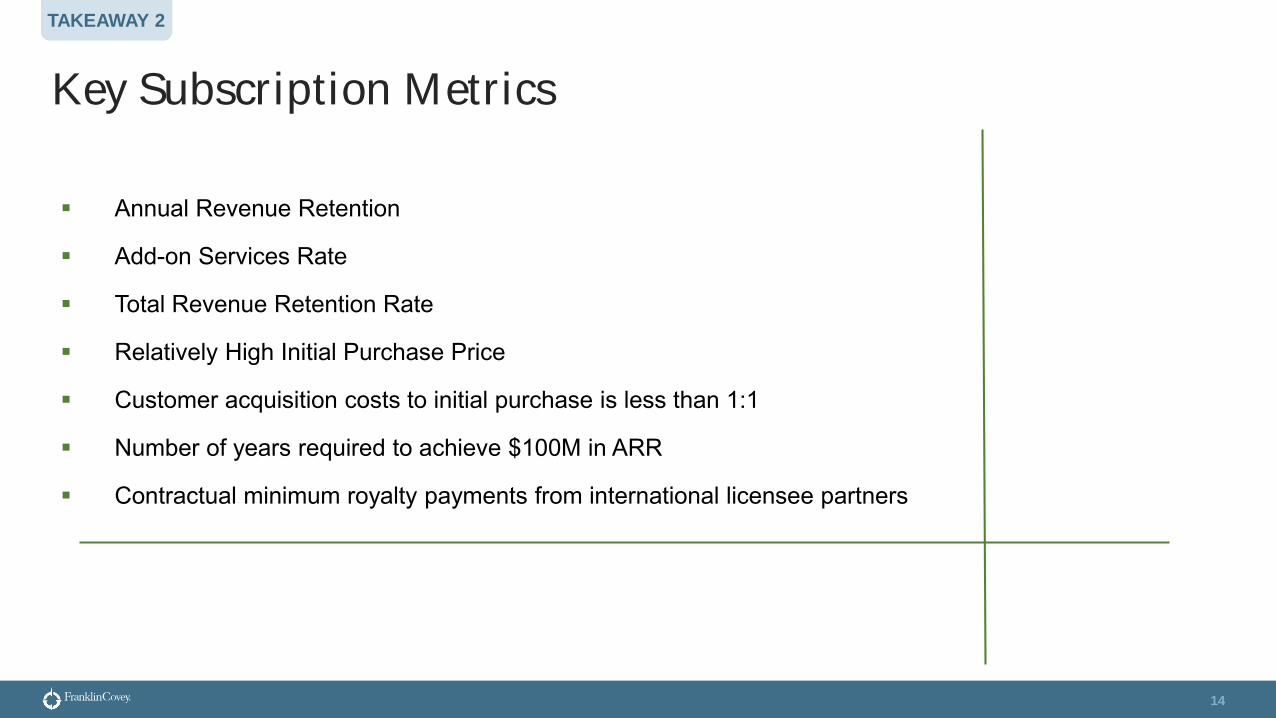
Key Subscription Metrics
Annual Revenue Retention
Add-on Services Rate
Total Revenue Retention Rate
Relatively High Initial Purchase Price
Customer acquisition costs to initial purchase is less than 1:1
Number of years required to achieve $100M in ARR
Contractual minimum royalty payments from international licensee partners
TAKEAWAY 2
15
TAKEAWAY 2
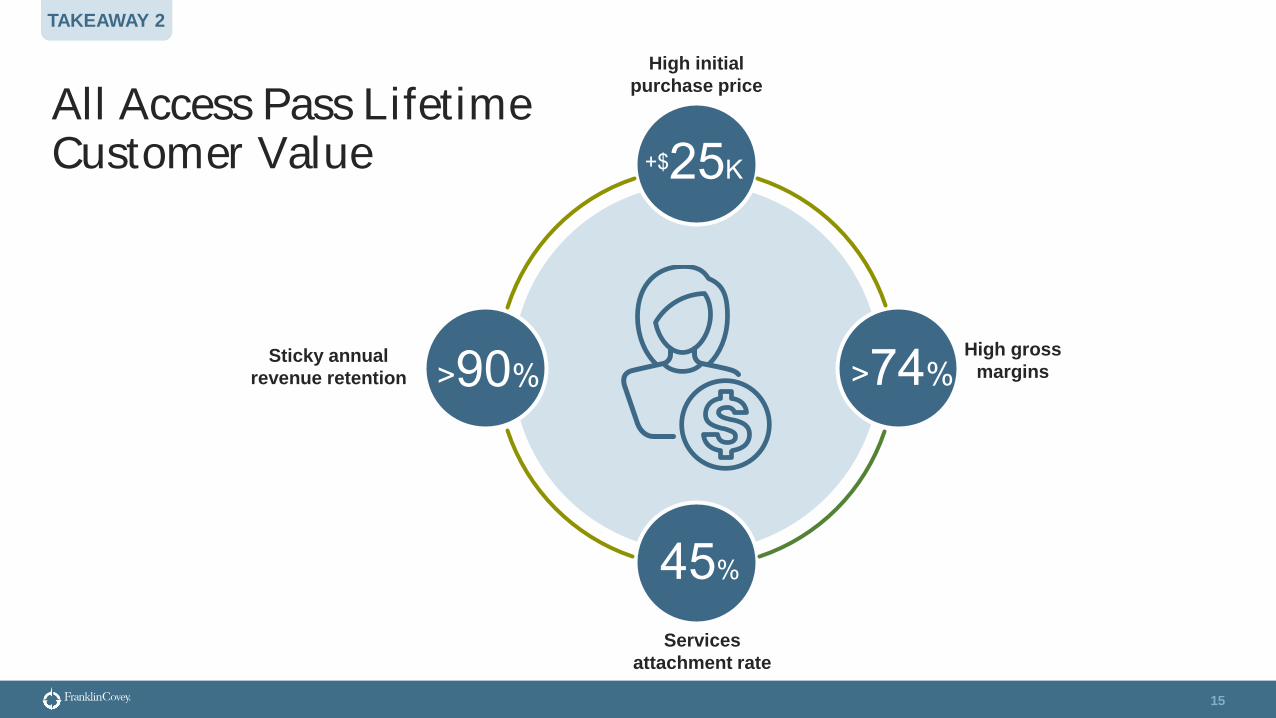
All Access Pass Lifetime Customer Value +$25K
>74%
45%
>90%
High initial
purchase price
Sticky annual
revenue retention
Services
attachment rate
High gross
margins
16
TAKEAWAY 2
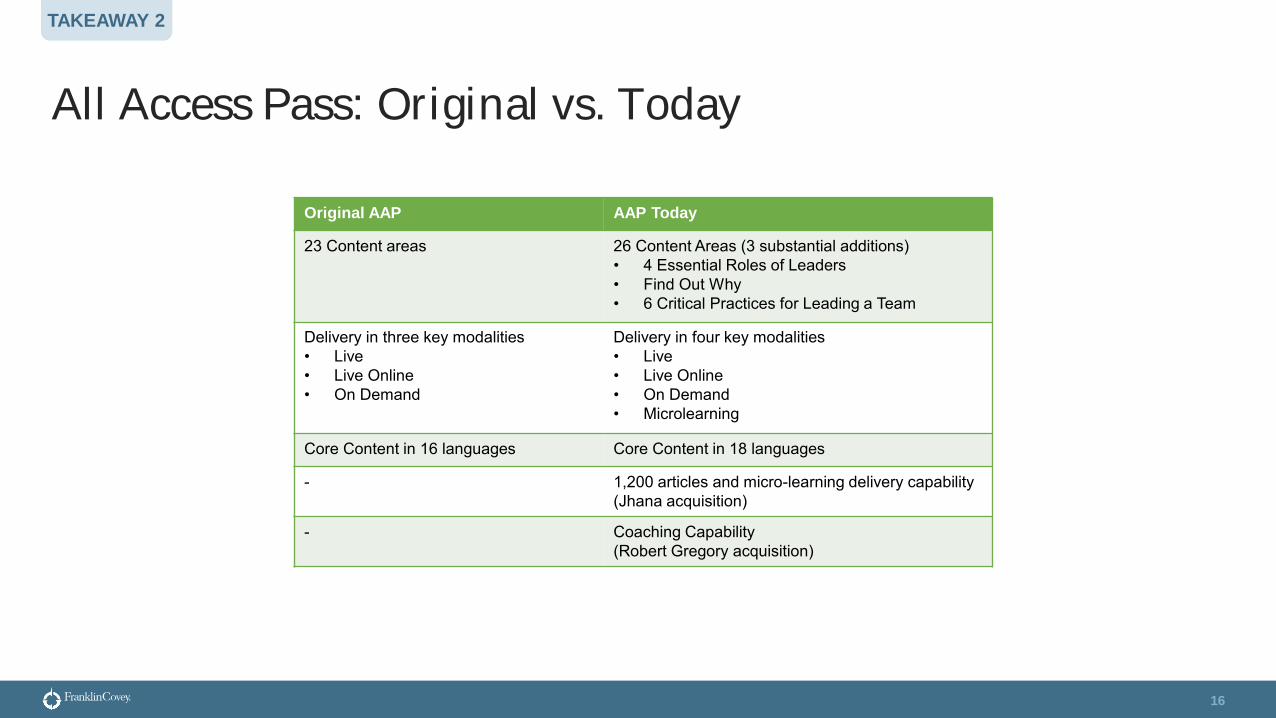
All Access Pass: Original vs. Today
Original AAP AAP Today
23 Content areas 26 Content Areas (3 substantial additions)• 4 Essential Roles of Leaders• Find Out Why• 6 Critical Practices for Leading a Team
Delivery in three key modalities• Live• Live Online• On Demand
Delivery in four key modalities• Live• Live Online• On Demand• Microlearning
Core Content in 16 languages Core Content in 18 languages
- 1,200 articles and micro-learning delivery capability (Jhana acquisition)
- Coaching Capability (Robert Gregory acquisition)
17
TAKEAWAY 2
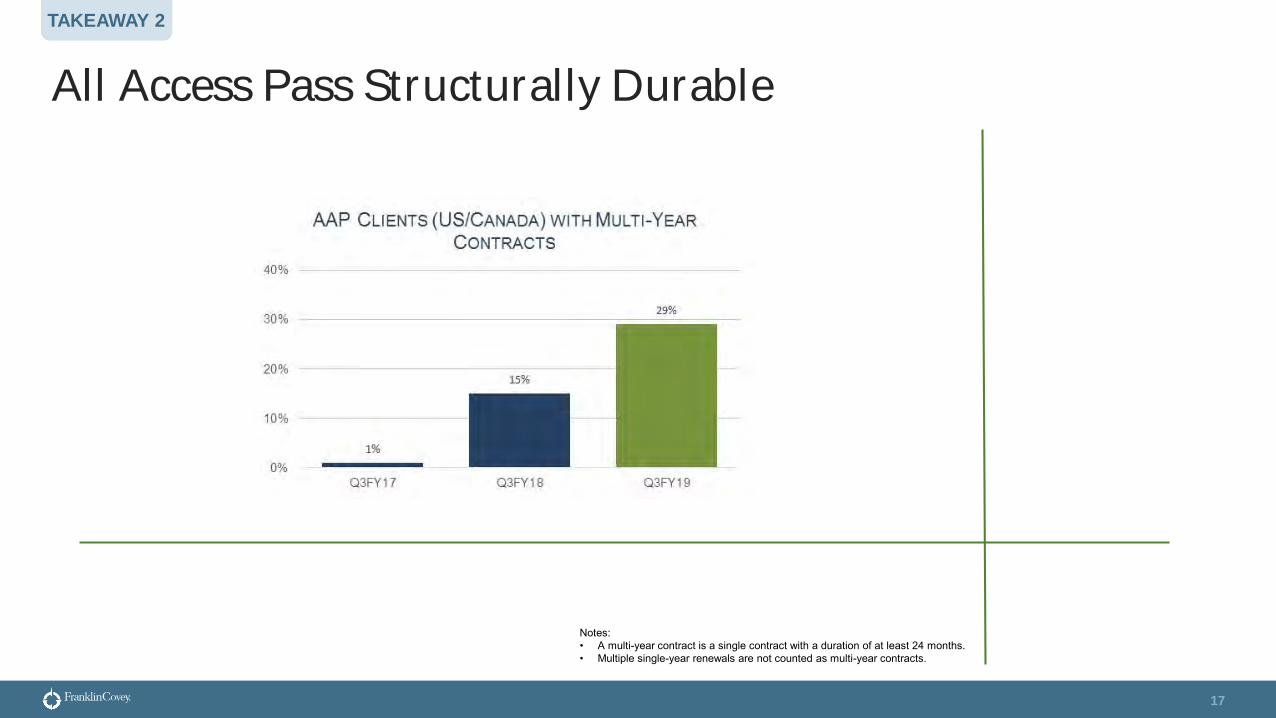
All Access Pass Structurally Durable
Notes: • A multi-year contract is a single contract with a duration of at least 24 months. • Multiple single-year renewals are not counted as multi-year contracts.
18
TAKEAWAY 2
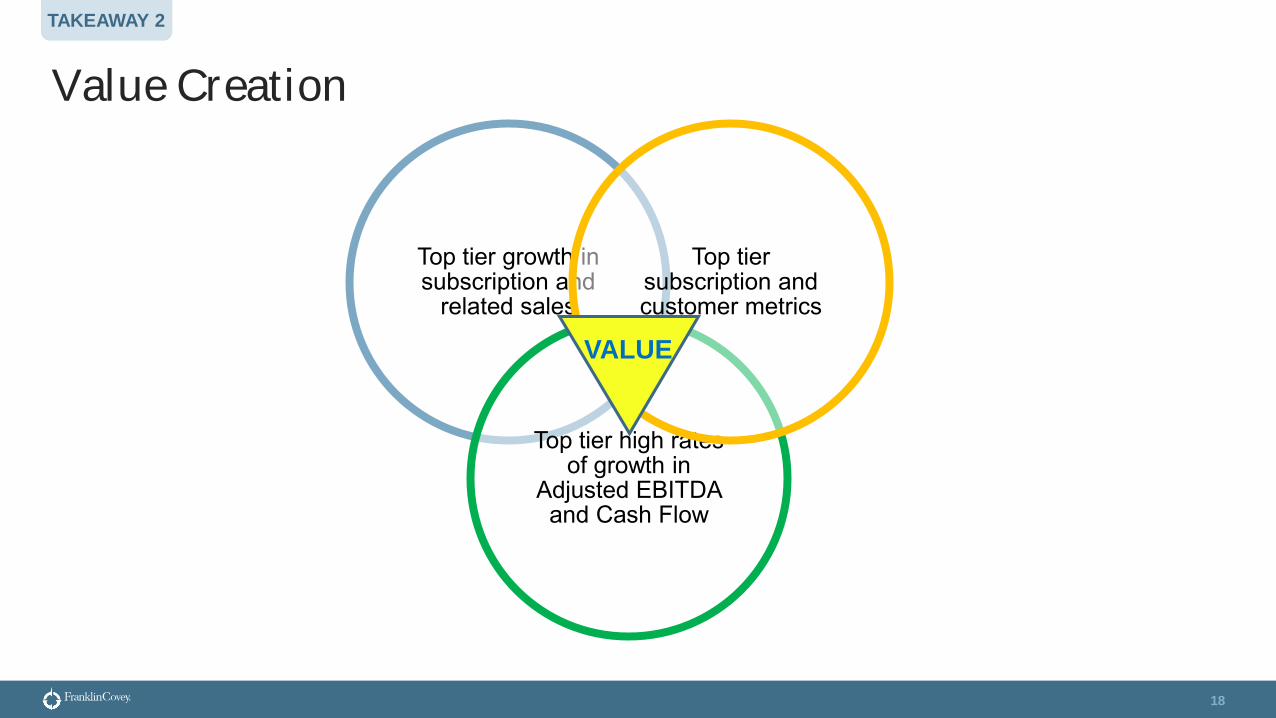
Value Creation
Top tier growth in subscription and
related sales
Top tier high rates of growth in
Adjusted EBITDA and Cash Flow
Top tier subscription and customer metrics
VALUE
19
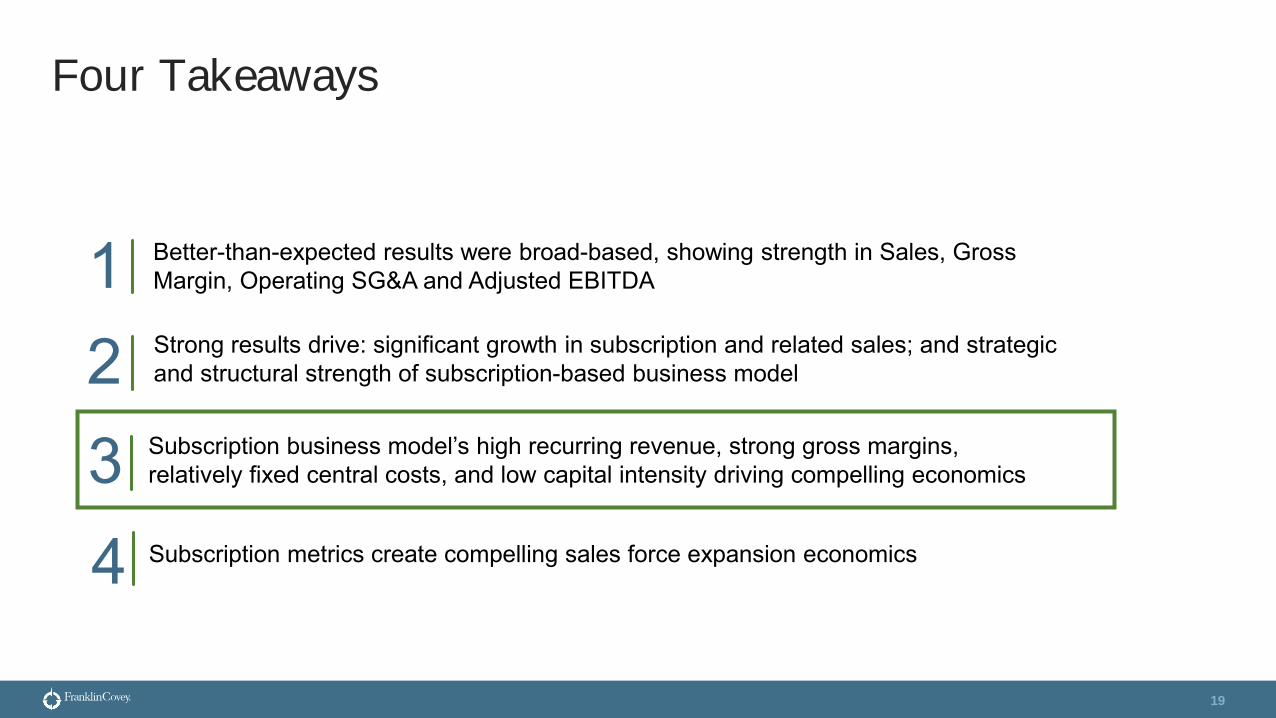
Four Takeaways
1 Better-than-expected results were broad-based, showing strength in Sales, Gross Margin, Operating SG&A and Adjusted EBITDA
3 Subscription business model’s high recurring revenue, strong gross margins, relatively fixed central costs, and low capital intensity driving compelling economics
2 Strong results drive: significant growth in subscription and related sales; and strategic and structural strength of subscription-based business model
4 Subscription metrics create compelling sales force expansion economics
20
TAKEAWAY 3
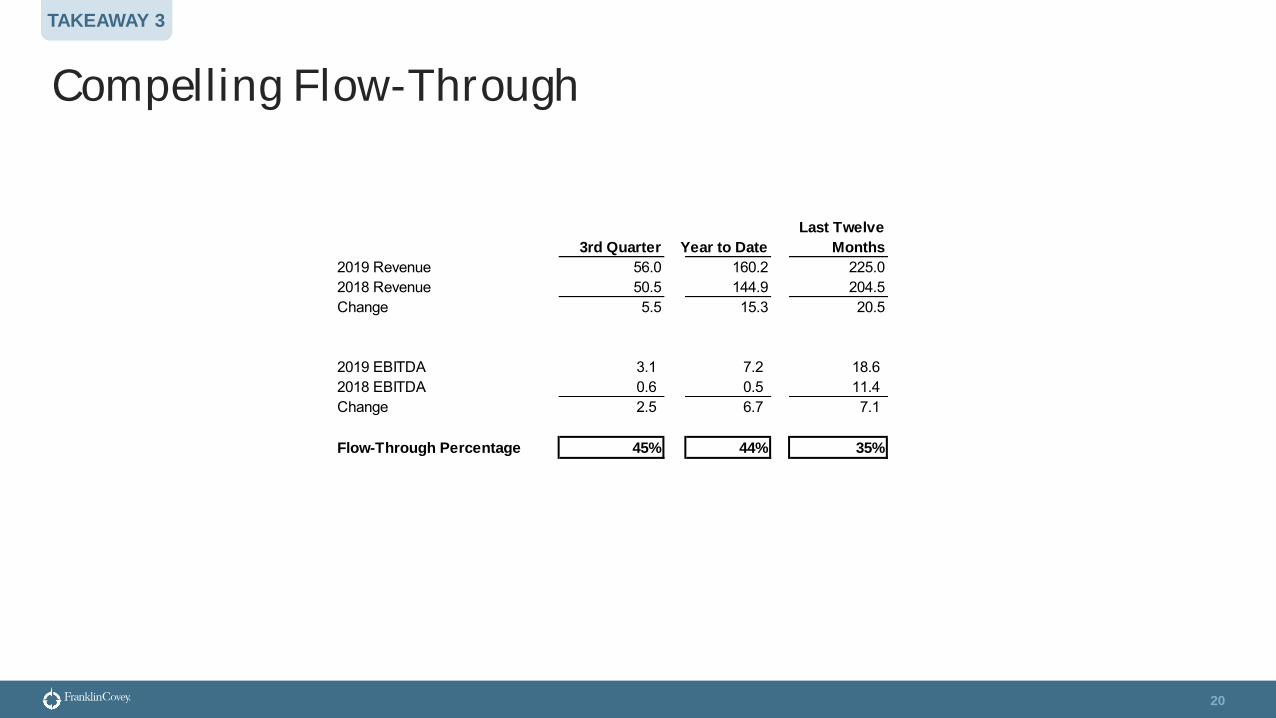
Compelling Flow-Through
3rd Quarter Year to Date
Last Twelve
Months
2019 Revenue 56.0 160.2 225.02018 Revenue 50.5 144.9 204.5Change 5.5 15.3 20.5
2019 EBITDA 3.1 7.2 18.6 2018 EBITDA 0.6 0.5 11.4 Change 2.5 6.7 7.1
Flow-Through Percentage 45% 44% 35%
21
Four Takeaways
1 Better-than-expected results were broad-based, showing strength in Sales, Gross Margin, Operating SG&A and Adjusted EBITDA
3 Subscription business model’s high recurring revenue, strong gross margins, relatively fixed central costs, and low capital intensity driving compelling economics
2 Strong results drive: significant growth in subscription and related sales; and strategic and structural strength of subscription-based business model
4 Subscription metrics create compelling sales force expansion economics
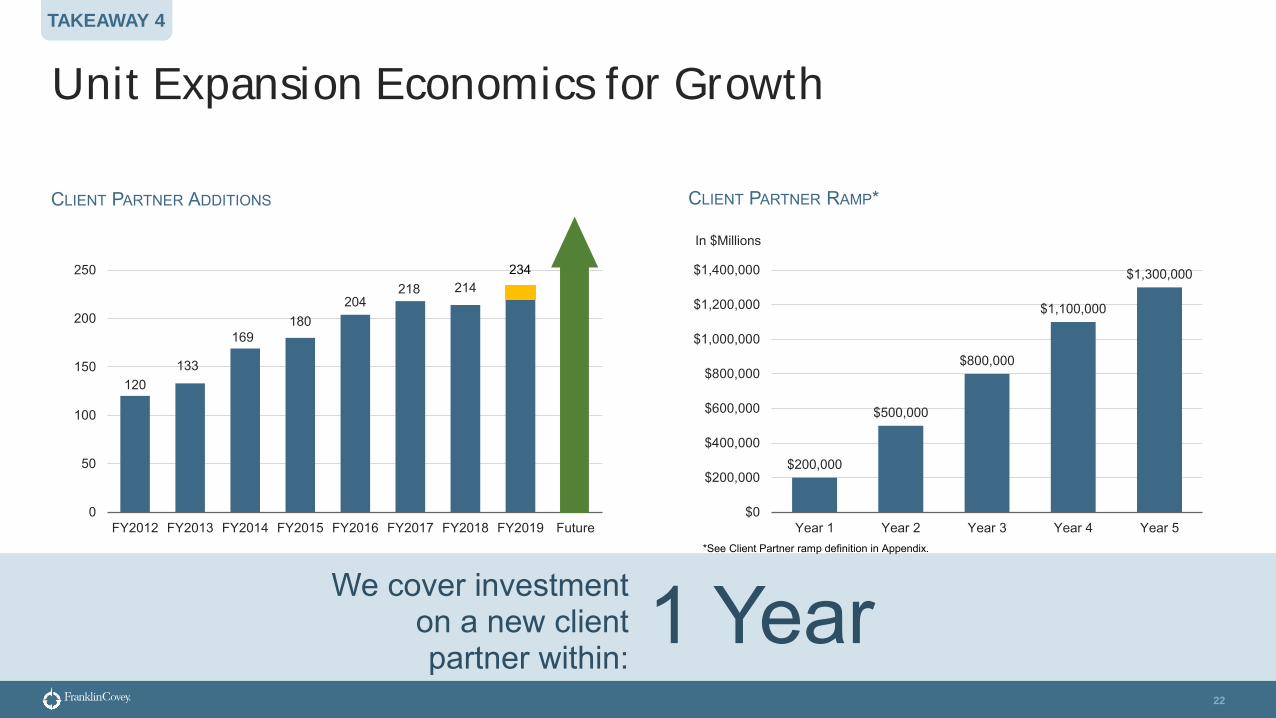
Unit Expansion Economics for Growth
22
We cover investment on a new client partner within:
1 Year
TAKEAWAY 4
120133
169180
204218 214
0
50
100
150
200
250
FY2012 FY2013 FY2014 FY2015 FY2016 FY2017 FY2018 FY2019 Future
$200,000
$500,000
$800,000
$1,100,000
$1,300,000
$0
$200,000
$400,000
$600,000
$800,000
$1,000,000
$1,200,000
$1,400,000
Year 1 Year 2 Year 3 Year 4 Year 5
CLIENT PARTNER ADDITIONS CLIENT PARTNER RAMP*
In $Millions
234
*See Client Partner ramp definition in Appendix.
23
Four Takeaways
1 Better-than-expected results were broad-based, showing strength in Sales, Gross Margin, Operating SG&A and Adjusted EBITDA
3 Subscription business model’s high recurring revenue, strong gross margins, relatively fixed central costs, and low capital intensity driving compelling economics
2 Strong results drive: significant growth in subscription and related sales; and strategic and structural strength of subscription-based business model
4 Subscription metrics create compelling sales force expansion economics

24
Appendix
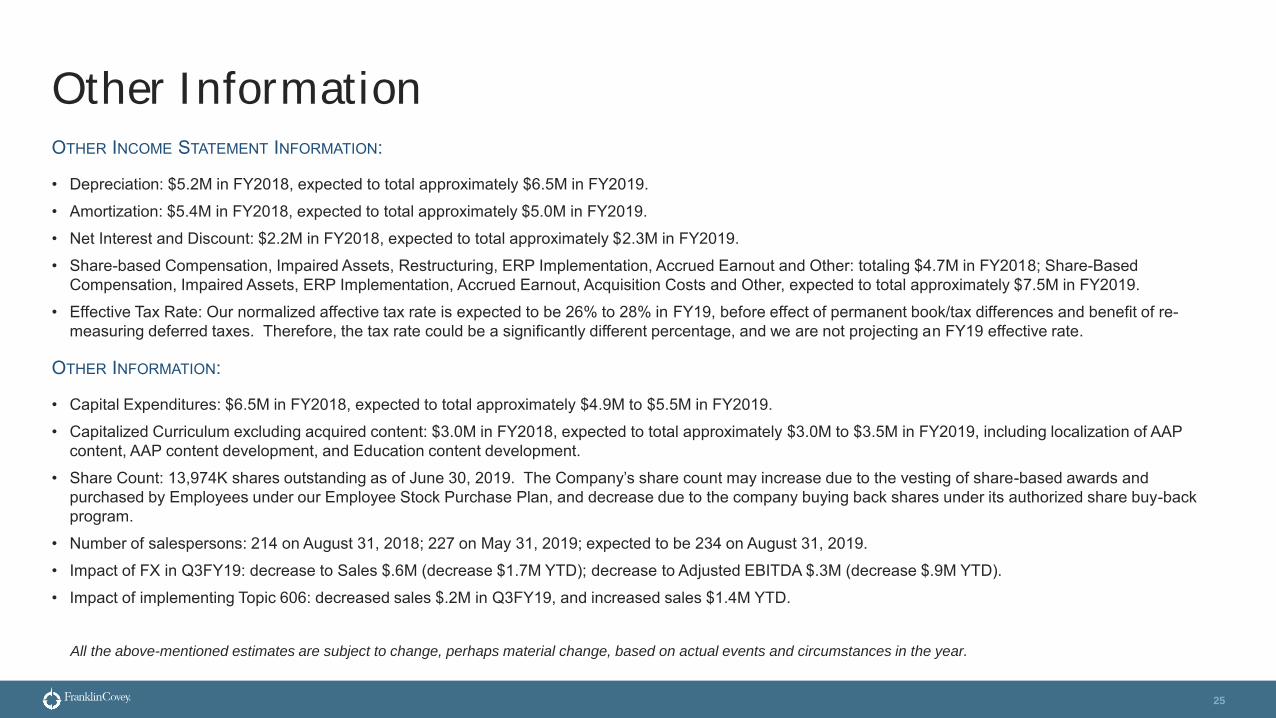
OTHER INCOME STATEMENT INFORMATION:
• Depreciation: $5.2M in FY2018, expected to total approximately $6.5M in FY2019.• Amortization: $5.4M in FY2018, expected to total approximately $5.0M in FY2019.• Net Interest and Discount: $2.2M in FY2018, expected to total approximately $2.3M in FY2019.• Share-based Compensation, Impaired Assets, Restructuring, ERP Implementation, Accrued Earnout and Other: totaling $4.7M in FY2018; Share-Based
Compensation, Impaired Assets, ERP Implementation, Accrued Earnout, Acquisition Costs and Other, expected to total approximately $7.5M in FY2019.• Effective Tax Rate: Our normalized affective tax rate is expected to be 26% to 28% in FY19, before effect of permanent book/tax differences and benefit of re-
measuring deferred taxes. Therefore, the tax rate could be a significantly different percentage, and we are not projecting an FY19 effective rate.
OTHER INFORMATION:
• Capital Expenditures: $6.5M in FY2018, expected to total approximately $4.9M to $5.5M in FY2019.• Capitalized Curriculum excluding acquired content: $3.0M in FY2018, expected to total approximately $3.0M to $3.5M in FY2019, including localization of AAP
content, AAP content development, and Education content development.• Share Count: 13,974K shares outstanding as of June 30, 2019. The Company’s share count may increase due to the vesting of share-based awards and
purchased by Employees under our Employee Stock Purchase Plan, and decrease due to the company buying back shares under its authorized share buy-back program.
• Number of salespersons: 214 on August 31, 2018; 227 on May 31, 2019; expected to be 234 on August 31, 2019.• Impact of FX in Q3FY19: decrease to Sales $.6M (decrease $1.7M YTD); decrease to Adjusted EBITDA $.3M (decrease $.9M YTD).• Impact of implementing Topic 606: decreased sales $.2M in Q3FY19, and increased sales $1.4M YTD.
All the above-mentioned estimates are subject to change, perhaps material change, based on actual events and circumstances in the year.
Other Information
25
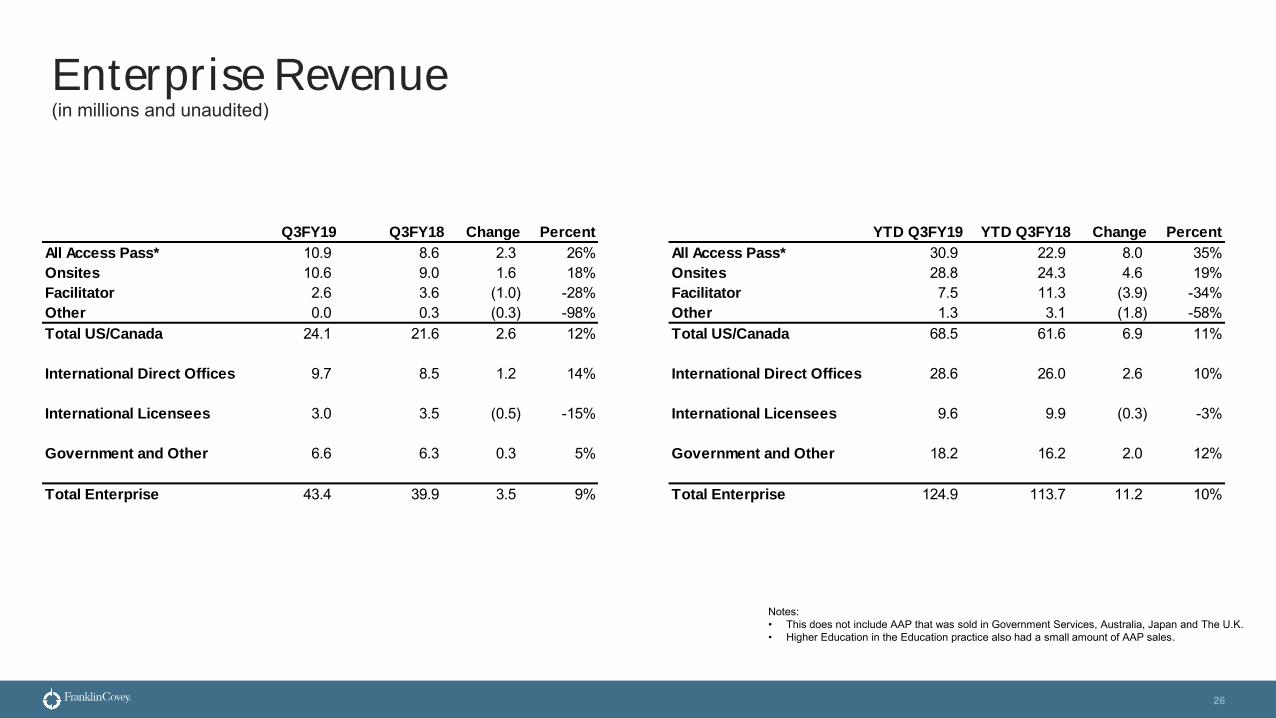
Enterprise Revenue(in millions and unaudited)
26
Notes:• This does not include AAP that was sold in Government Services, Australia, Japan and The U.K. • Higher Education in the Education practice also had a small amount of AAP sales.
Q3FY19 Q3FY18 Change Percent
All Access Pass* 10.9 8.6 2.3 26%Onsites 10.6 9.0 1.6 18%Facilitator 2.6 3.6 (1.0) -28%Other 0.0 0.3 (0.3) -98%Total US/Canada 24.1 21.6 2.6 12%
International Direct Offices 9.7 8.5 1.2 14%
International Licensees 3.0 3.5 (0.5) -15%
Government and Other 6.6 6.3 0.3 5%
Total Enterprise 43.4 39.9 3.5 9%
YTD Q3FY19 YTD Q3FY18 Change Percent
All Access Pass* 30.9 22.9 8.0 35%Onsites 28.8 24.3 4.6 19%Facilitator 7.5 11.3 (3.9) -34%Other 1.3 3.1 (1.8) -58%Total US/Canada 68.5 61.6 6.9 11%
International Direct Offices 28.6 26.0 2.6 10%
International Licensees 9.6 9.9 (0.3) -3%
Government and Other 18.2 16.2 2.0 12%
Total Enterprise 124.9 113.7 11.2 10%
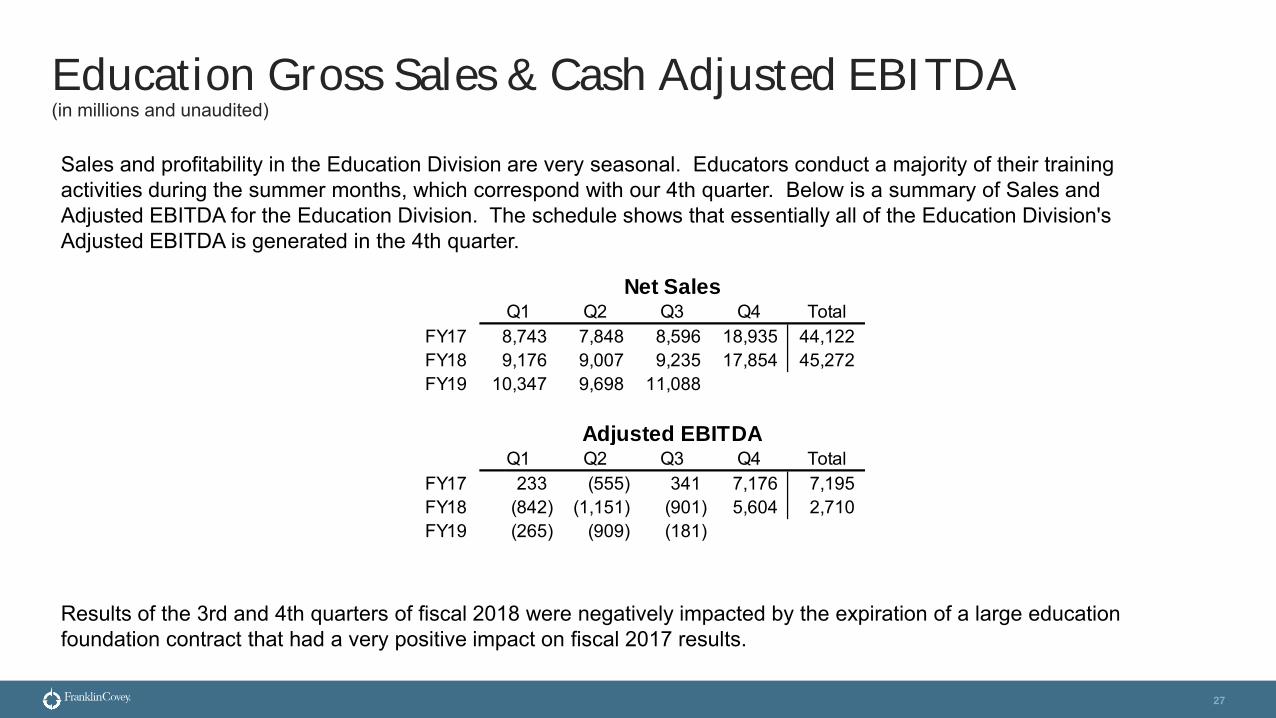
Education Gross Sales & Cash Adjusted EBITDA(in millions and unaudited)
27
Sales and profitability in the Education Division are very seasonal. Educators conduct a majority of their training activities during the summer months, which correspond with our 4th quarter. Below is a summary of Sales and Adjusted EBITDA for the Education Division. The schedule shows that essentially all of the Education Division's Adjusted EBITDA is generated in the 4th quarter.
Results of the 3rd and 4th quarters of fiscal 2018 were negatively impacted by the expiration of a large education foundation contract that had a very positive impact on fiscal 2017 results.
Q1 Q2 Q3 Q4 TotalFY17 8,743 7,848 8,596 18,935 44,122 FY18 9,176 9,007 9,235 17,854 45,272 FY19 10,347 9,698 11,088
Q1 Q2 Q3 Q4 TotalFY17 233 (555) 341 7,176 7,195 FY18 (842) (1,151) (901) 5,604 2,710 FY19 (265) (909) (181)
Net Sales
Adjusted EBITDA
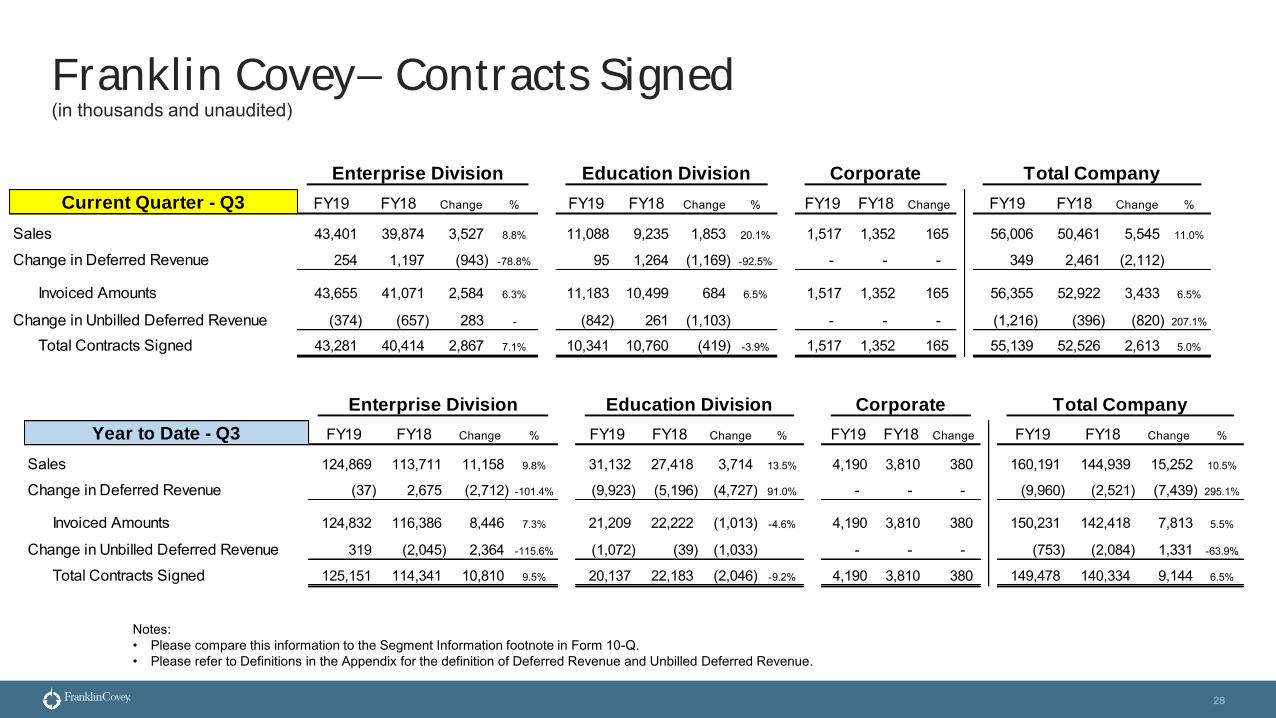
Franklin Covey– Contracts Signed(in thousands and unaudited)
28
Notes:• Please compare this information to the Segment Information footnote in Form 10-Q.• Please refer to Definitions in the Appendix for the definition of Deferred Revenue and Unbilled Deferred Revenue.
FY19 FY18 Change % FY19 FY18 Change % FY19 FY18 Change FY19 FY18 Change %
Sales 124,869 113,711 11,158 9.8% 31,132 27,418 3,714 13.5% 4,190 3,810 380 160,191 144,939 15,252 10.5%
Change in Deferred Revenue (37) 2,675 (2,712) -101.4% (9,923) (5,196) (4,727) 91.0% - - - (9,960) (2,521) (7,439) 295.1%
Invoiced Amounts 124,832 116,386 8,446 7.3% 21,209 22,222 (1,013) -4.6% 4,190 3,810 380 150,231 142,418 7,813 5.5%
Change in Unbilled Deferred Revenue 319 (2,045) 2,364 -115.6% (1,072) (39) (1,033) - - - (753) (2,084) 1,331 -63.9%
Total Contracts Signed 125,151 114,341 10,810 9.5% 20,137 22,183 (2,046) -9.2% 4,190 3,810 380 149,478 140,334 9,144 6.5%
Enterprise Division Education Division Corporate Total Company
Year to Date - Q3
FY19 FY18 Change % FY19 FY18 Change % FY19 FY18 Change FY19 FY18 Change %
Sales 43,401 39,874 3,527 8.8% 11,088 9,235 1,853 20.1% 1,517 1,352 165 56,006 50,461 5,545 11.0%
Change in Deferred Revenue 254 1,197 (943) -78.8% 95 1,264 (1,169) -92.5% - - - 349 2,461 (2,112)
Invoiced Amounts 43,655 41,071 2,584 6.3% 11,183 10,499 684 6.5% 1,517 1,352 165 56,355 52,922 3,433 6.5%
Change in Unbilled Deferred Revenue (374) (657) 283 - (842) 261 (1,103) - - - (1,216) (396) (820) 207.1%
Total Contracts Signed 43,281 40,414 2,867 7.1% 10,341 10,760 (419) -3.9% 1,517 1,352 165 55,139 52,526 2,613 5.0%
Enterprise Division Education Division Corporate Total Company
Current Quarter - Q3

Sales Information(in thousands and unaudited)
29
Notes:• Invoiced Amounts represent the amount billed (invoiced) in the period. The Invoiced Amount is equal to Reported Net Sales, plus the associated chance in Deferred Subscription Sales on the balance sheet (adjusted for FX). AAP Subscriptions, Education Memberships, and Other Invoiced
Subscriptions are all Invoiced Amounts. Unbilled portions of multi-year agreements are not included.• The Difference between Change in Deferred Sales, which is added to Reported Net Sales to equal the Invoiced Amount, and the Change in Deferred Sales on the balance sheet is adjustments for FX, acquisitions and other. Q1 of FY2019 also includes the adjustment attributed to the adoption of
Topic 606.• Certain historical amounts have been adjusted by immaterial amounts to conform with the current presentation - including the acquired Jhana Deferred Revenue.• Deferred Revenue is primarily a current liability. However, a small portion is long-term and recorded as a part of Other Liabilities.
Q1 Q2 Q3 Q4 Yr Total Q1 Q2 Q3 Q4 YTD Total Q1 Q2 Q3 YTD TotalSales
Reported Net Sales 39,787 42,196 43,751 59,522 185,256 47,932 46,549 50,461 64,818 209,760 53,829 50,356 56,006 160,191
Change in Deferred Revenue 702 2,069 5,442 12,562 20,775 (5,193) 211 2,461 13,925 11,404 (8,514) (1,795) 349 (9,960)
Invoiced Amount 40,489 44,265 49,193 72,084 206,031 42,739 46,760 52,922 78,743 221,164 45,315 48,561 56,355 150,231
Balance Sheet
Roll-Forward of Deferred Revenue
Beginning Balance (deferred revenue) 15,460 16,096 18,185 23,618 15,460 36,397 31,429 32,067 34,521 36,397 48,432 41,375 39,580 48,432
Subscription Sales 6,306 8,710 13,785 23,026 51,827 7,882 13,941 17,324 30,563 69,710 9,798 15,902 19,276 44,976
Amounts Recorded to Revenue (5,604) (6,641) (8,343) (10,464) (31,052) (13,075) (13,730) (14,863) (16,638) (58,306) (18,312) (17,697) (18,671) (54,680)
Change in Deferred Revenue 702 2,069 5,442 12,562 20,775 (5,193) 211 2,461 13,925 11,404 (8,514) (1,795) 605 (9,704)
FX, 606, and Other Changes (66) 20 (9) 217 162 225 427 (7) (14) 631 1,457 - (256) 1,201
Ending Balance (Def Subscription Revenue) 16,096 18,185 23,618 36,397 36,397 31,429 32,067 34,521 48,432 48,432 41,375 39,580 39,929 39,929
Unbilled Deferred Contracts
Beginning Balance (off balance sheet) 2,378 1,978 1,728 2,479 2,378 17,151 16,255 15,463 15,067 17,151 24,495 24,426 24,959 24,495
New Unbilled Contracts - - 751 15,600 16,351 1,863 2,149 2,766 13,437 20,215 1,434 4,578 3,534 9,546
Amounts Invoiced (400) (250) - (928) (1,578) (2,759) (2,941) (3,162) (4,009) (12,871) (1,503) (4,045) (4,749) (10,297)
Ending Balance (off balance sheet) 1,978 1,728 2,479 17,151 17,151 16,255 15,463 15,067 24,495 24,495 24,426 24,959 23,744 23,744
Breakout of Deferred Sales (above)
Subscription Sales
AAP Subscriptions 4,969 7,801 9,189 12,616 34,575 6,822 13,409 11,667 16,895 48,793 8,270 15,070 13,708 37,048
Education Memberships 652 226 4,130 9,766 14,774 893 159 4,978 13,142 19,172 827 382 5,236 6,445
Other Subscriptions and Adjustments 685 683 466 644 2,478 167 373 679 526 1,745 701 450 332 1,483
Total Additions to balance sheet 6,306 8,710 13,785 23,026 51,827 7,882 13,941 17,324 30,563 69,710 9,798 15,902 19,276 44,976
FY17 Information FY18 Information FY19 Information
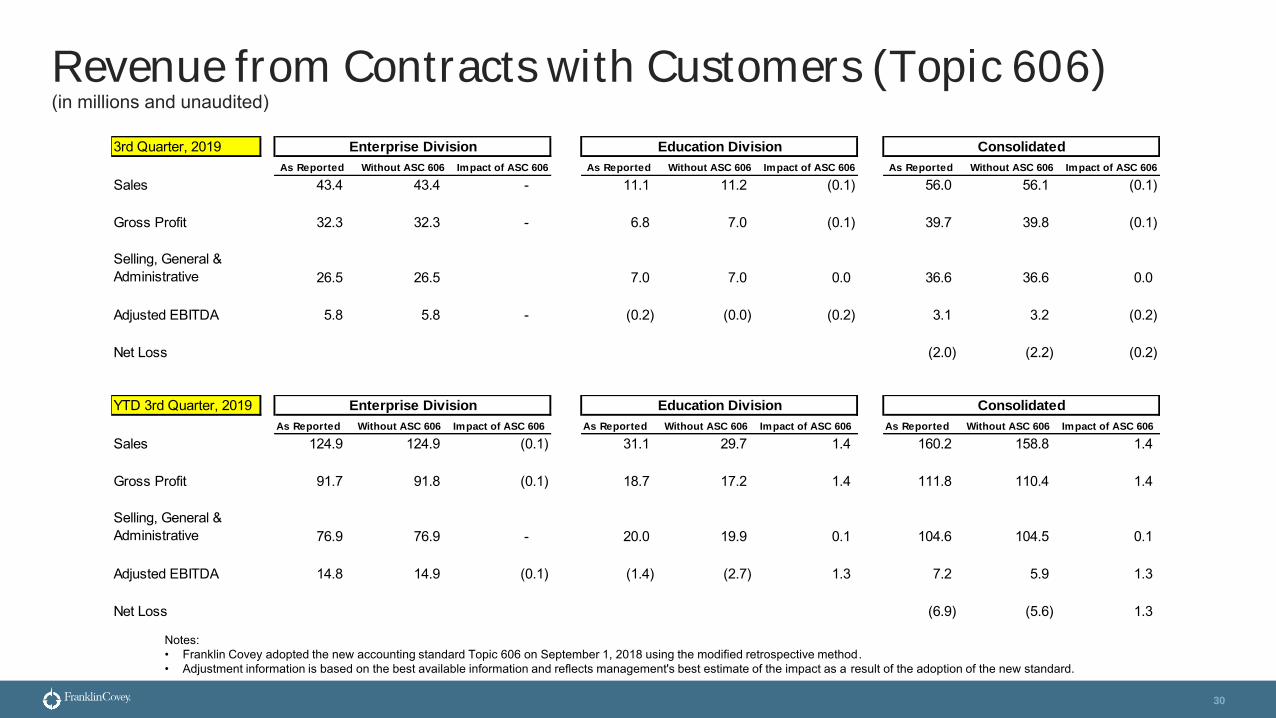
Revenue from Contracts with Customers (Topic 606)(in millions and unaudited)
30
Notes:• Franklin Covey adopted the new accounting standard Topic 606 on September 1, 2018 using the modified retrospective method.• Adjustment information is based on the best available information and reflects management's best estimate of the impact as a result of the adoption of the new standard.
3rd Quarter, 2019As Reported Without ASC 606 Impact of ASC 606 As Reported Without ASC 606 Impact of ASC 606 As Reported Without ASC 606 Impact of ASC 606
Sales 43.4 43.4 - 11.1 11.2 (0.1) 56.0 56.1 (0.1)
Gross Profit 32.3 32.3 - 6.8 7.0 (0.1) 39.7 39.8 (0.1)
Selling, General & Administrative 26.5 26.5 7.0 7.0 0.0 36.6 36.6 0.0
Adjusted EBITDA 5.8 5.8 - (0.2) (0.0) (0.2) 3.1 3.2 (0.2)
Net Loss (2.0) (2.2) (0.2)
Enterprise Division Education Division Consolidated
YTD 3rd Quarter, 2019As Reported Without ASC 606 Impact of ASC 606 As Reported Without ASC 606 Impact of ASC 606 As Reported Without ASC 606 Impact of ASC 606
Sales 124.9 124.9 (0.1) 31.1 29.7 1.4 160.2 158.8 1.4
Gross Profit 91.7 91.8 (0.1) 18.7 17.2 1.4 111.8 110.4 1.4
Selling, General & Administrative 76.9 76.9 - 20.0 19.9 0.1 104.6 104.5 0.1
Adjusted EBITDA 14.8 14.9 (0.1) (1.4) (2.7) 1.3 7.2 5.9 1.3
Net Loss (6.9) (5.6) 1.3
Enterprise Division Education Division Consolidated
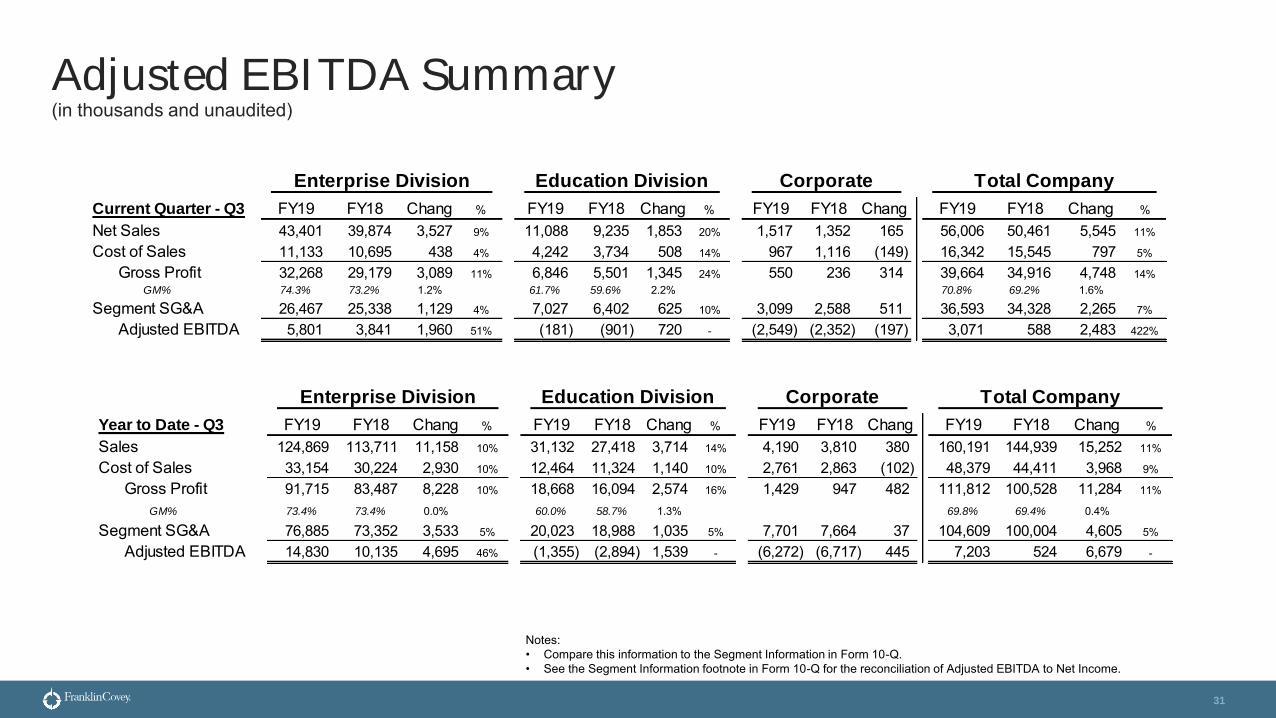
Adjusted EBITDA Summary(in thousands and unaudited)
31
Notes:• Compare this information to the Segment Information in Form 10-Q.• See the Segment Information footnote in Form 10-Q for the reconciliation of Adjusted EBITDA to Net Income.
Current Quarter - Q3 FY19 FY18 Chang % FY19 FY18 Chang % FY19 FY18 Chang FY19 FY18 Chang %
Net Sales 43,401 39,874 3,527 9% 11,088 9,235 1,853 20% 1,517 1,352 165 56,006 50,461 5,545 11%
Cost of Sales 11,133 10,695 438 4% 4,242 3,734 508 14% 967 1,116 (149) 16,342 15,545 797 5%
Gross Profit 32,268 29,179 3,089 11% 6,846 5,501 1,345 24% 550 236 314 39,664 34,916 4,748 14%GM% 74.3% 73.2% 1.2% 61.7% 59.6% 2.2% 70.8% 69.2% 1.6%
Segment SG&A 26,467 25,338 1,129 4% 7,027 6,402 625 10% 3,099 2,588 511 36,593 34,328 2,265 7%
Adjusted EBITDA 5,801 3,841 1,960 51% (181) (901) 720 - (2,549) (2,352) (197) 3,071 588 2,483 422%
Enterprise Division Education Division Corporate Total Company
Year to Date - Q3 FY19 FY18 Chang % FY19 FY18 Chang % FY19 FY18 Chang FY19 FY18 Chang %
Sales 124,869 113,711 11,158 10% 31,132 27,418 3,714 14% 4,190 3,810 380 160,191 144,939 15,252 11%
Cost of Sales 33,154 30,224 2,930 10% 12,464 11,324 1,140 10% 2,761 2,863 (102) 48,379 44,411 3,968 9%
Gross Profit 91,715 83,487 8,228 10% 18,668 16,094 2,574 16% 1,429 947 482 111,812 100,528 11,284 11%
GM% 73.4% 73.4% 0.0% 60.0% 58.7% 1.3% 69.8% 69.4% 0.4%
Segment SG&A 76,885 73,352 3,533 5% 20,023 18,988 1,035 5% 7,701 7,664 37 104,609 100,004 4,605 5%
Adjusted EBITDA 14,830 10,135 4,695 46% (1,355) (2,894) 1,539 - (6,272) (6,717) 445 7,203 524 6,679 -
Enterprise Division Education Division Corporate Total Company

Net Cash Generated as defined below(in thousands and unaudited)
32
Notes:• We expect Net Cash Generated in FY2019 to fall within the range of $18 million to $22 million.• Net Cash Generated is a measure used by management to monitor the amount of available cash generated by the operations of the company. Net Cash Generated
includes the items listed above and excludes other cash activities shown on the Consolidated Statements of Cash Flows, such as cash paid for taxes, acquisitions, changes in working capital, other SG&A, and payments on term notes and financing obligations.
• Please refer to the Appendix for the definition of Adjusted EBITDA and for the reconciliation of Adjusted EBITDA to Net Income.• Please also refer to the Condensed Consolidated Statements of Cash Flows for the current quarter.
Q3 FY19 Q3 FY18 Q3 FY19 Q3 FY18 Q3 FY19 Q3 FY18Reported Adjusted EBITDA 3,071$ 588$ 7,203$ 524$ 18,560$ 11,427$ Adjustments
Change in Deferred Revenue (related to subscription sales) 349 2,461 (9,960) (2,521) 3,964 10,040 Costs deferred with Deferred Revenue (163) (65) 631 229 (943) (1,366) Amortization of capitalized development 1,095 1,361 3,951 3,923 5,308 4,985 Purchases of property and equipment (801) (693) (2,996) (4,981) (4,543) (7,042) Capitalized curriculum development costs (565) (260) (1,821) (2,445) (2,374) (4,761) Cash paid for interest (579) (673) (1,855) (1,947) (2,563) (2,414)
Net Cash Generated 2,407$ 2,719$ (4,847)$ (7,218)$ 17,409$ 10,869$
Current Quarter Year to Date Last Four Quarters
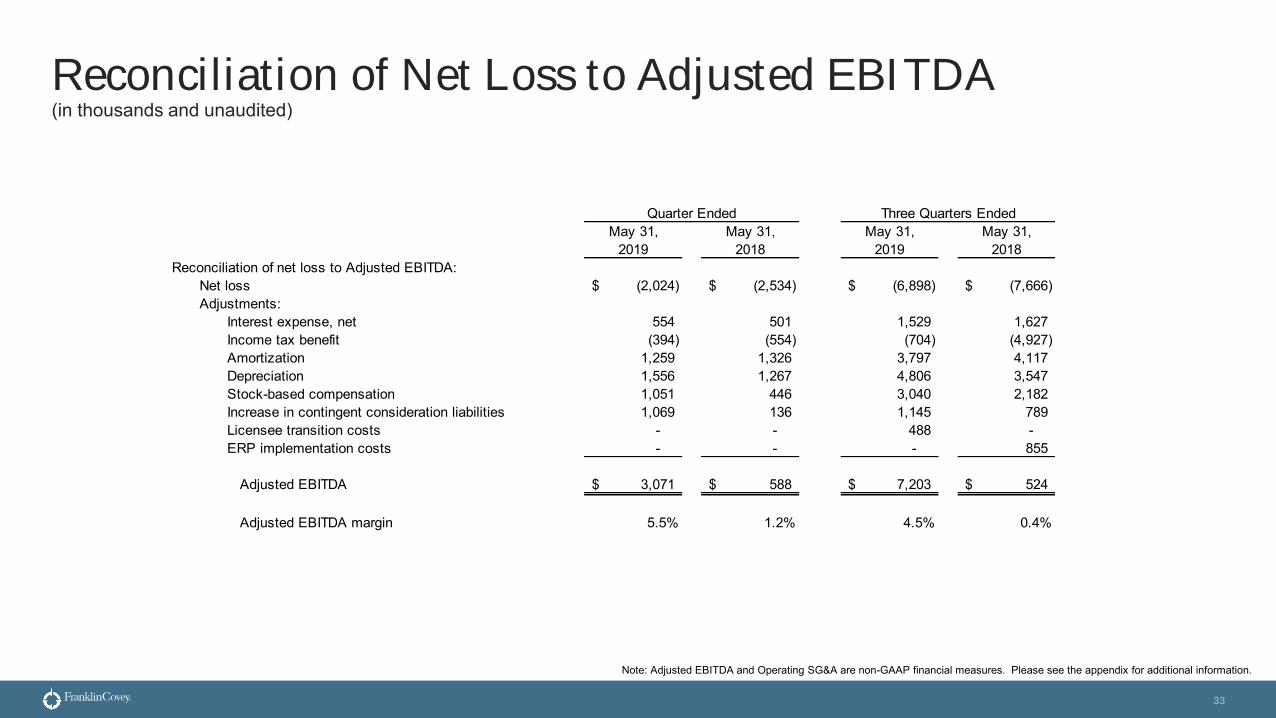
Reconciliation of Net Loss to Adjusted EBITDA(in thousands and unaudited)
33
Note: Adjusted EBITDA and Operating SG&A are non-GAAP financial measures. Please see the appendix for additional information.
May 31, May 31, May 31, May 31,2019 2018 2019 2018
Reconciliation of net loss to Adjusted EBITDA:Net loss (2,024)$ (2,534)$ (6,898)$ (7,666)$ Adjustments:
Interest expense, net 554 501 1,529 1,627 Income tax benefit (394) (554) (704) (4,927) Amortization 1,259 1,326 3,797 4,117 Depreciation 1,556 1,267 4,806 3,547 Stock-based compensation 1,051 446 3,040 2,182 Increase in contingent consideration liabilities 1,069 136 1,145 789 Licensee transition costs - - 488 - ERP implementation costs - - - 855
Adjusted EBITDA 3,071$ 588$ 7,203$ 524$
Adjusted EBITDA margin 5.5% 1.2% 4.5% 0.4%
Three Quarters EndedQuarter Ended

Additional Financial Information(in thousands and unaudited)
34
May 31, May 31, May 31, May 31,2019 2018 2019 2018
Sales by Division/Segment:
Enterprise Division:Direct offices 40,387$ 36,331$ 115,271$ 103,802$ International licensees 3,014 3,543 9,598 9,909
43,401 39,874 124,869 113,711 Education Division 11,088 9,235 31,132 27,418 Corporate and other 1,517 1,352 4,190 3,810
Consolidated 56,006$ 50,461$ 160,191$ 144,939$
Gross Profit by Division/Segment:
Enterprise Division:Direct offices 29,836$ 26,444$ 84,200$ 75,886$ International licensees 2,432 2,735 7,515 7,601
32,268 29,179 91,715 83,487 Education Division 6,846 5,501 18,668 16,094 Corporate and other 550 236 1,429 947
Consolidated 39,664$ 34,916$ 111,812$ 100,528$
Adjusted EBITDA by Division/Segment:
Enterprise Division:Direct offices 4,520$ 2,190$ 10,703$ 5,913$ International licensees 1,281 1,651 4,127 4,222
5,801 3,841 14,830 10,135 Education Division (181) (901) (1,355) (2,894) Corporate and other (2,549) (2,352) (6,272) (6,717)
Consolidated 3,071$ 588$ 7,203$ 524$
Quarter Ended Three Quarters Ended
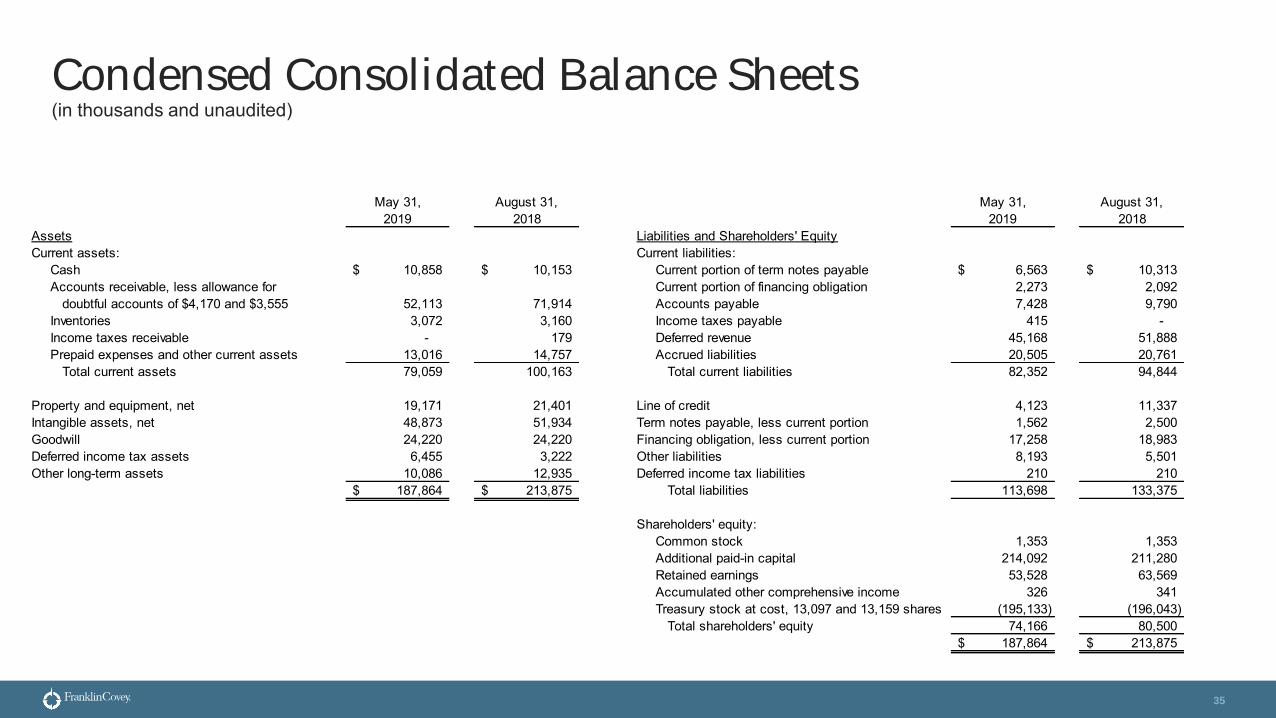
Condensed Consolidated Balance Sheets(in thousands and unaudited)
35
May 31, August 31,2019 2018
AssetsCurrent assets:
Cash 10,858$ 10,153$ Accounts receivable, less allowance for doubtful accounts of $4,170 and $3,555 52,113 71,914 Inventories 3,072 3,160 Income taxes receivable - 179 Prepaid expenses and other current assets 13,016 14,757 Total current assets 79,059 100,163
Property and equipment, net 19,171 21,401 Intangible assets, net 48,873 51,934 Goodwill 24,220 24,220 Deferred income tax assets 6,455 3,222 Other long-term assets 10,086 12,935
187,864$ 213,875$
May 31, August 31,2019 2018
Liabilities and Shareholders' EquityCurrent liabilities:
Current portion of term notes payable 6,563$ 10,313$ Current portion of financing obligation 2,273 2,092 Accounts payable 7,428 9,790 Income taxes payable 415 - Deferred revenue 45,168 51,888 Accrued liabilities 20,505 20,761 Total current liabilities 82,352 94,844
Line of credit 4,123 11,337 Term notes payable, less current portion 1,562 2,500 Financing obligation, less current portion 17,258 18,983 Other liabilities 8,193 5,501 Deferred income tax liabilities 210 210
Total liabilities 113,698 133,375
Shareholders' equity:Common stock 1,353 1,353 Additional paid-in capital 214,092 211,280 Retained earnings 53,528 63,569 Accumulated other comprehensive income 326 341 Treasury stock at cost, 13,097 and 13,159 shares (195,133) (196,043) Total shareholders' equity 74,166 80,500
187,864$ 213,875$
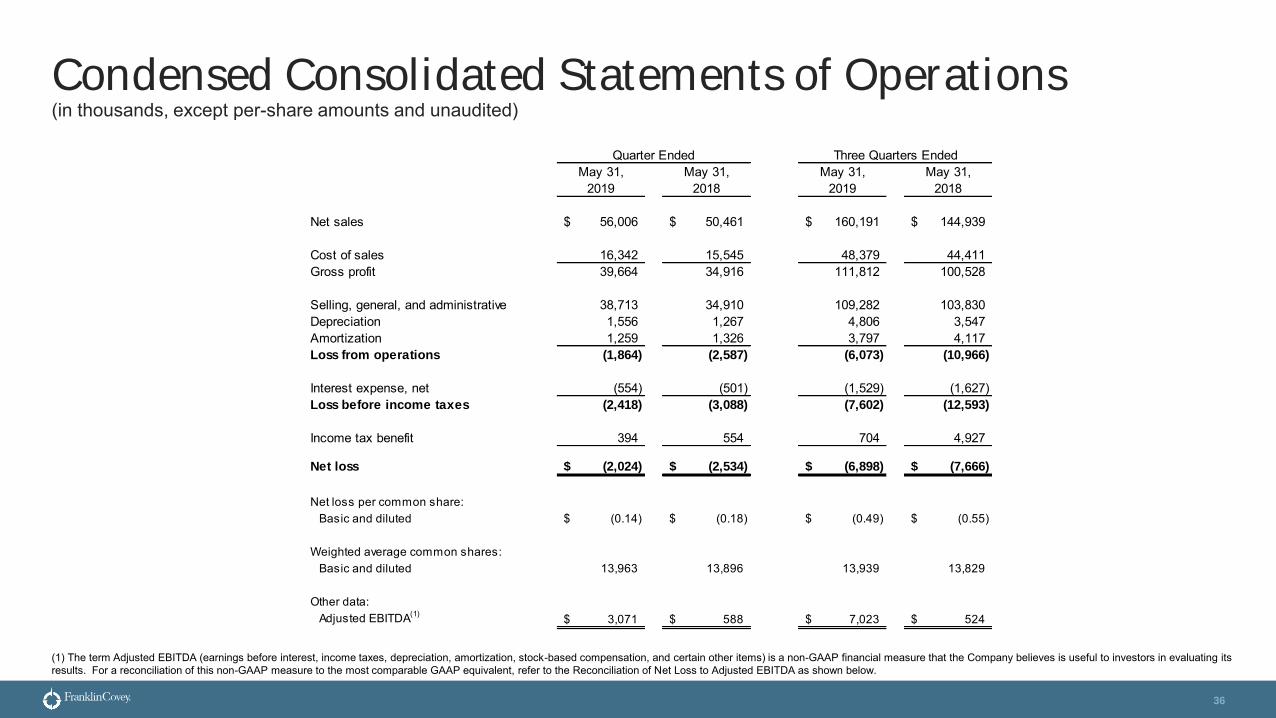
Condensed Consolidated Statements of Operations(in thousands, except per-share amounts and unaudited)
36
(1) The term Adjusted EBITDA (earnings before interest, income taxes, depreciation, amortization, stock-based compensation, and certain other items) is a non-GAAP financial measure that the Company believes is useful to investors in evaluating its results. For a reconciliation of this non-GAAP measure to the most comparable GAAP equivalent, refer to the Reconciliation of Net Loss to Adjusted EBITDA as shown below.
Quarter EndedMay 31, May 31, May 31, May 31,
2019 2018 2019 2018
Net sales 56,006$ 50,461$ 160,191$ 144,939$
Cost of sales 16,342 15,545 48,379 44,411Gross profit 39,664 34,916 111,812 100,528
Selling, general, and administrative 38,713 34,910 109,282 103,830Depreciation 1,556 1,267 4,806 3,547Amortization 1,259 1,326 3,797 4,117Loss from operations (1,864) (2,587) (6,073) (10,966)
Interest expense, net (554) (501) (1,529) (1,627)Loss before income taxes (2,418) (3,088) (7,602) (12,593)
Income tax benefit 394 554 704 4,927
Net loss (2,024)$ (2,534)$ (6,898)$ (7,666)$
Net loss per common share: Basic and diluted (0.14)$ (0.18)$ (0.49)$ (0.55)$
Weighted average common shares: Basic and diluted 13,963 13,896 13,939 13,829
Other data: Adjusted EBITDA(1) 3,071$ 588$ 7,023$ 524$
Three Quarters Ended
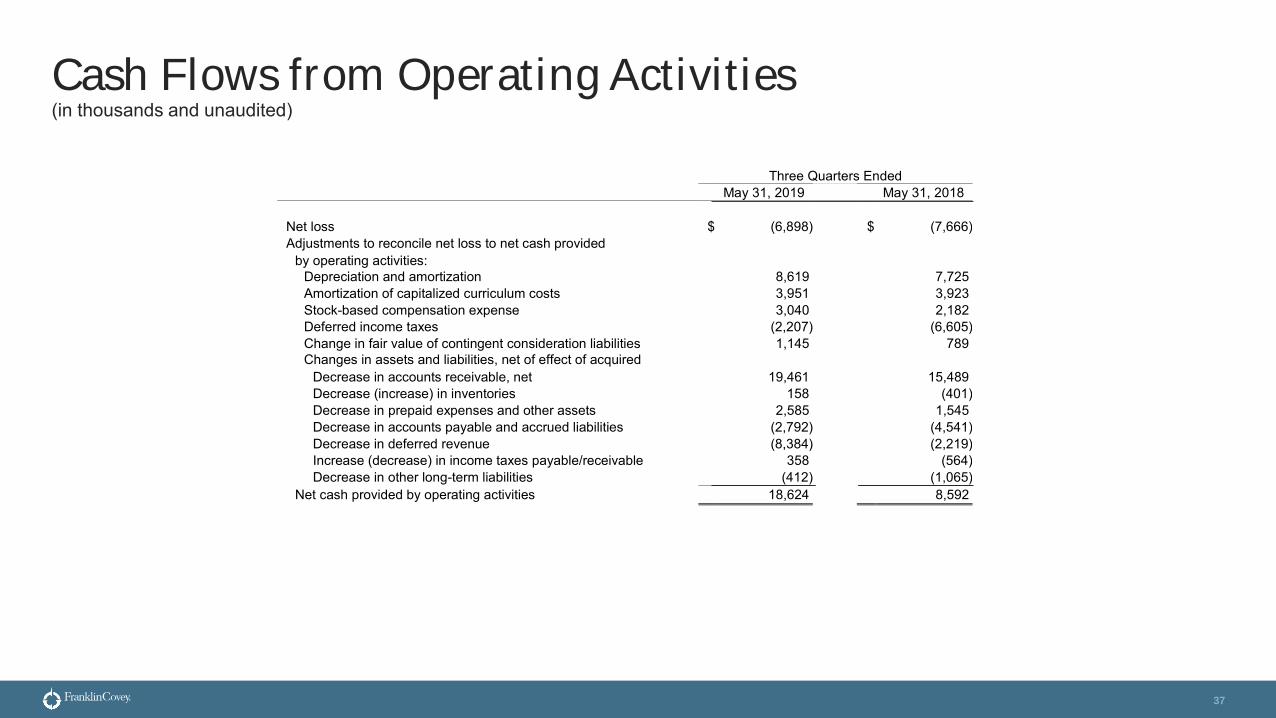
Cash Flows from Operating Activities(in thousands and unaudited)
37
Three Quarters Ended May 31, 2019 May 31, 2018
Net loss $ (6,898) $ (7,666) Adjustments to reconcile net loss to net cash provided
by operating activities: Depreciation and amortization 8,619 7,725 Amortization of capitalized curriculum costs 3,951 3,923 Stock-based compensation expense 3,040 2,182 Deferred income taxes (2,207) (6,605) Change in fair value of contingent consideration liabilities 1,145 789 Changes in assets and liabilities, net of effect of acquired business:
Decrease in accounts receivable, net 19,461 15,489 Decrease (increase) in inventories 158 (401) Decrease in prepaid expenses and other assets 2,585 1,545 Decrease in accounts payable and accrued liabilities (2,792) (4,541) Decrease in deferred revenue (8,384) (2,219) Increase (decrease) in income taxes payable/receivable 358 (564) Decrease in other long-term liabilities (412) (1,065)
Net cash provided by operating activities 18,624 8,592
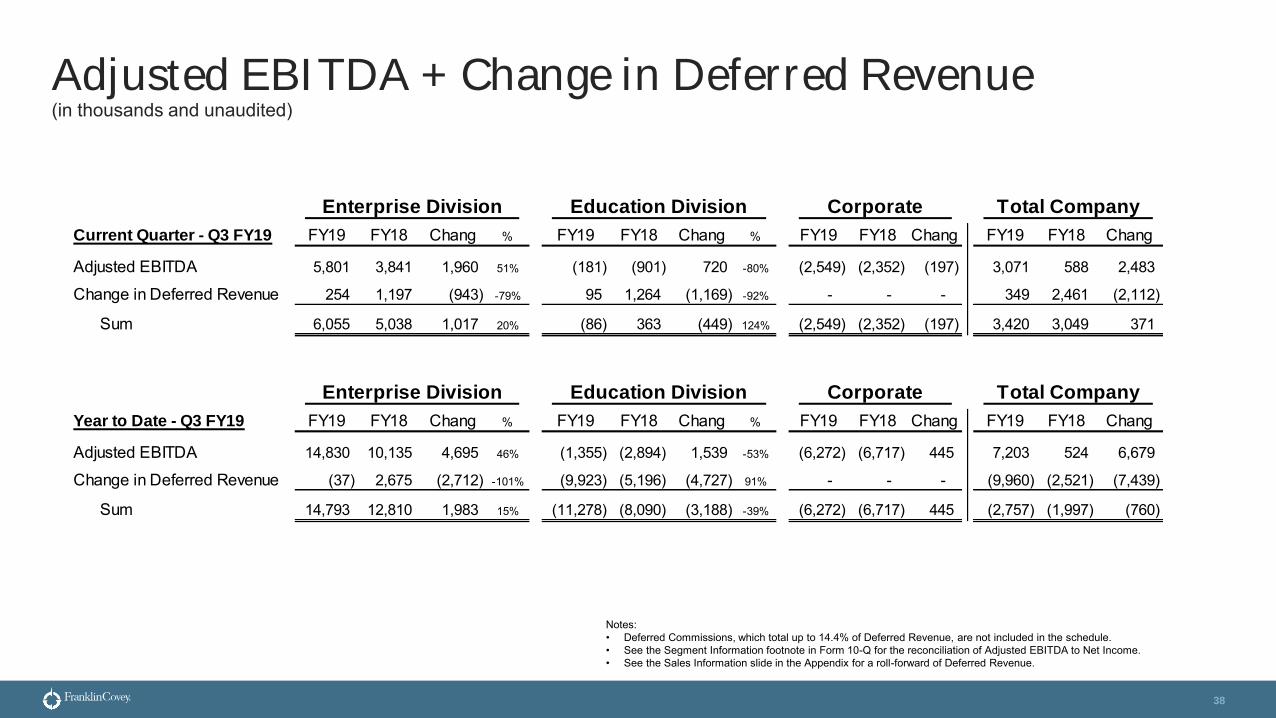
Adjusted EBITDA + Change in Deferred Revenue(in thousands and unaudited)
38
Notes:• Deferred Commissions, which total up to 14.4% of Deferred Revenue, are not included in the schedule.• See the Segment Information footnote in Form 10-Q for the reconciliation of Adjusted EBITDA to Net Income.• See the Sales Information slide in the Appendix for a roll-forward of Deferred Revenue.
Current Quarter - Q3 FY19 FY19 FY18 Chang % FY19 FY18 Chang % FY19 FY18 Chang FY19 FY18 Chang
Adjusted EBITDA 5,801 3,841 1,960 51% (181) (901) 720 -80% (2,549) (2,352) (197) 3,071 588 2,483
Change in Deferred Revenue 254 1,197 (943) -79% 95 1,264 (1,169) -92% - - - 349 2,461 (2,112)
Sum 6,055 5,038 1,017 20% (86) 363 (449) 124% (2,549) (2,352) (197) 3,420 3,049 371
Year to Date - Q3 FY19 FY19 FY18 Chang % FY19 FY18 Chang % FY19 FY18 Chang FY19 FY18 Chang
Adjusted EBITDA 14,830 10,135 4,695 46% (1,355) (2,894) 1,539 -53% (6,272) (6,717) 445 7,203 524 6,679
Change in Deferred Revenue (37) 2,675 (2,712) -101% (9,923) (5,196) (4,727) 91% - - - (9,960) (2,521) (7,439)
Sum 14,793 12,810 1,983 15% (11,278) (8,090) (3,188) -39% (6,272) (6,717) 445 (2,757) (1,997) (760)
Enterprise Division Education Division Corporate Total Company
Enterprise Division Education Division Corporate Total Company
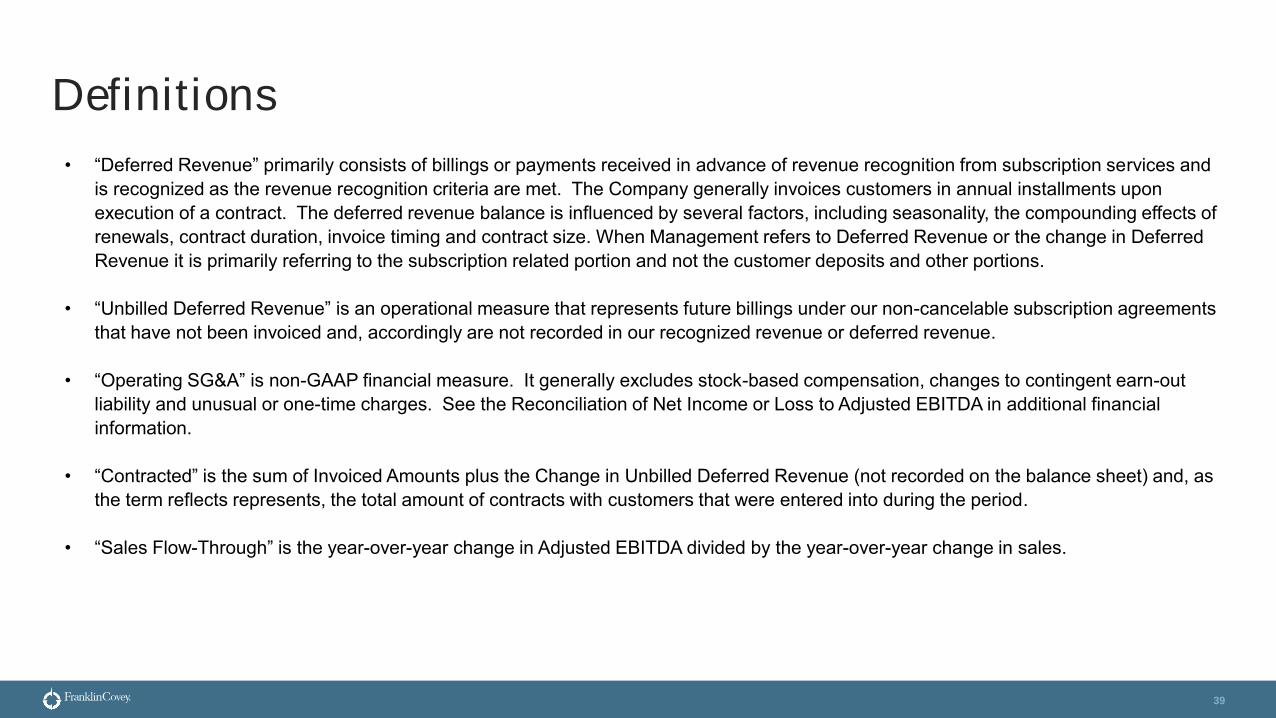
Definitions
39
• “Deferred Revenue” primarily consists of billings or payments received in advance of revenue recognition from subscription services and is recognized as the revenue recognition criteria are met. The Company generally invoices customers in annual installments upon execution of a contract. The deferred revenue balance is influenced by several factors, including seasonality, the compounding effects of renewals, contract duration, invoice timing and contract size. When Management refers to Deferred Revenue or the change in Deferred Revenue it is primarily referring to the subscription related portion and not the customer deposits and other portions.
• “Unbilled Deferred Revenue” is an operational measure that represents future billings under our non-cancelable subscription agreements that have not been invoiced and, accordingly are not recorded in our recognized revenue or deferred revenue.
• “Operating SG&A” is non-GAAP financial measure. It generally excludes stock-based compensation, changes to contingent earn-out liability and unusual or one-time charges. See the Reconciliation of Net Income or Loss to Adjusted EBITDA in additional financial information.
• “Contracted” is the sum of Invoiced Amounts plus the Change in Unbilled Deferred Revenue (not recorded on the balance sheet) and, as the term reflects represents, the total amount of contracts with customers that were entered into during the period.
• “Sales Flow-Through” is the year-over-year change in Adjusted EBITDA divided by the year-over-year change in sales.

Definitions
40
• “Adjusted EBITDA” (earnings before interest, income taxes, depreciation, amortization, stock-based compensation, and certain other items) is a non-GAAP financial measure that the Company believes is useful to investors in evaluating its results. A reconciliation of “Adjusted EBITDA,” to consolidated net income (loss), the most comparable GAAP financial measure is provided within this presentation. The Company references this non-GAAP financial measure in its decision making because it provides supplemental information that facilitates consistent internal comparisons to the historical operating performance of prior periods and the Company believes it provides investors with greater transparency to evaluate operational activities and financial results. We are unable to provide a reconciliation of forward-looking estimates of non-GAAP Adjusted EBITDA to GAAP measures because certain information needed tomake a reasonable forward-looking estimate is difficult to estimate and dependent on future events which may be uncertain or out of our control, including the amount of AAP contracts invoiced, the number of AAP contracts that are renewed, necessary costs to deliver our offerings such as unanticipated content development costs, and other potential variables. Accordingly, a reconciliation is not available without unreasonable effort.
• “Invoiced” is the sum of reported Net Sales plus the change in Deferred Revenue reported on the balance sheet (a portion of which is recorded as a currant liability and a portion as a long-term liability and represents the amount of billings during the period). We typically invoice our customers annually upon execution of the contract or subscription renewals. Our clients frequently prepay for products and services, which prepayment is included in amounts invoiced and corresponding Deferred Revenue.
• Client Partner Ramp is the expected amount of invoiced amounts the Company expects its client partners to generate based upon the length of time the client partner has been in a sales role. This metric measures client partners who are currently employed by the Company and does not subtract any accounts that are transitioned to a client partner from a previous client partner.