ion exchange nutrient recovery from municipal wastewater
TRANSCRIPT

Marquette Universitye-Publications@Marquette
Master's Theses (2009 -) Dissertations, Theses, and Professional Projects
Ion Exchange Nutrient Recovery from MunicipalWastewaterAllen WilliamsMarquette University
Recommended CitationWilliams, Allen, "Ion Exchange Nutrient Recovery from Municipal Wastewater" (2013). Master's Theses (2009 -). 239.https://epublications.marquette.edu/theses_open/239

ION EXCHANGE NUTRIENT RECOVERY FROM MUNICIPAL WASTEWATER
by
Allen T. Williams
A Thesis submitted to the Faculty of the Graduate School,
Marquette University,
In Partial Fulfillment of the Requirements for
The Degree of Master of Science and Engineering
Milwaukee, Wisconsin
December 2013

ABSTRACT
ION EXCHANGE NUTRIENT RECOVERY FROM MUNICIPAL WASTEWATER
Allen T. Williams
Marquette University, 2013
Nitrogen and phosphorus discharge is regulated due to eutrophication. Typically
ammonium-nitrogen is removed through nitrification which requires energy and
phosphorus (P) is removed by metal salt addition to precipitate P. A more sustainable
approach may be to implement nutrient recovery to form fertilizers. Most nitrogen
fertilizer is formed through the energy intensive Haber-Bosch process. Phosphate rock, a
limited resource, is mined for P fertilizer. Discharge regulations and the fertilizer
production costs provide an economic driver for recovery. The current project used
anionic and cationic ion exchange (IX) to concentrate the nutrients with recovery by
struvite precipitation. Previous work lacks direct comparison of anion media, treatment of
real wastewater with 2 IX columns in series, evaluation of regeneration characteristics
and struvite precipitation from combined regenerants. During batch testing, Dow-Cu
removed 76% of P while Dow-FeCu and LayneRT™
showed removal of >60%. These
three media were tested in column mode using filtered municipal wastewater secondary
effluent dosed with nutrients. Phosphate removal before breakthrough (PO4-P
effluent>0.075 mg/l) for LayneRT™
, Dow-FeCu, and Dow-Cu was 2.00, 1.49, and 0.46 g
P/LBV, respectively. Desorption of >89% occurred for all 3 resins. Dow-FeCu provided
the best conditions: effective removal, efficient regeneration at neutral pH and high (560
mg/l) regenerant P concentration. Natural zeolite was used for cation exchange. During
ammonium exchange batch tests, NaCl solution with pH<13 was optimal for regeneration
of zeolite. Column testing of zeolite was conducted using effluent from the LayneRT™
column. Capacity during IX cycle 1 and 2 before breakthrough (NH4-N effluent > 1.5
mg/l) was 3.9 and 6.1 g N/LBV, respectively; performance variability is due to the
difference in influent cation concentrations. Desorption was 74% and 68% in cycle 1 and
2, respectively. Struvite was precipitated from zeolite and anion regenerant with 71%,
13%, and 74% P removal for LayneRT™
, Dow-Cu, and Dow-FeCu regenerants,
respectively. Struvite precipitation was limited by Mg. Precipitates contained impurities
such as Al3+
, Ca2+
, and Fe2+
. The IX-recovery process removed greater than 98% P and
95% N and formed solids containing 13% P and 2% N.

i
ACKNOWLEDGEMENTS
Allen T. Williams
I would like to thank Dr. Mayer and Dr. Zitomer for giving me the opportunity to
work on this project, guiding me in my research, and allowing me the opportunity to
obtain my Master’s in Civil and Environmental Engineering at Marquette University. The
project allowed me to utilize my existing knowledge and develop a greater knowledge of
the environmental and wastewater treatment field. At the same time I was given the
ability to gain extensive knowledge in an important topic, nutrient removal. Dr. Mayer
and Dr. Zitomer provided me continual guidance on the project and helped to shape my
critical thinking skills. I would like to express my gratitude to Xylem, Inc. for funding
this research project and being such a significant source of guidance along the way. The
members of the Xylem group helped progress this project from a broad goal to a specific
design. I would also like to thank Dr. McNamara for being a part of my advisory
committee and for his guidance in my education and research. I would also like to
acknowledge Matt Seib and Patrick Mullen for their efforts in regards to the project. The
other members of the Water Quality Center research group deserve acknowledgement for
their support: Dan Carey, Kaushik Venkiteshwaran, Jonathan Kusowski, Thomas
Hoffman, John Ross, Michael Syverson and Kevin Berg. Finally, I would not have
completed this project without the support of my wife and parents.

ii
DEDICATION
I would like to dedicate this thesis to my wife, parents, extended family and
friends whose support throughout my life has allowed me to reach the point I am at
today.

iii
TABLE OF CONTENTS
DEDICATION .................................................................................................................... ii
LIST OF TABLES ............................................................................................................. vi
LIST OF FIGURES ......................................................................................................... viii
1 Introduction and Literature Review ..................................................................................1
1.1 Redesigning Wastewater Treatment..................................................................... 1
1.2 Recovery Streams Review ................................................................................... 7
1.3 Nutrient Removal Review .................................................................................... 8
1.31 Suspended Growth Biological Nitrogen Removal .............................................. 9
1.32 Attached Growth Biological Nitrogen Removal ............................................... 11
1.33 Photosynthetic Biological Nitrogen Removal ................................................... 12
1.34 Biological Phosphorus Removal ....................................................................... 13
1.35 Physical/Chemical Nitrogen Removal............................................................... 14
1.36 Physical/Chemical Phosphorus Removal .......................................................... 15
1.4 Nutrient Recovery Scheme................................................................................. 17
1.5 Ion Exchange Physico-chemistry ....................................................................... 19
1.6 Ammonium Ion Exchange ................................................................................. 21
1.7 Phosphate Ion Exchange Review ....................................................................... 24
1.8 Struvite Precipitation Review............................................................................. 29
1.9 Ammonia Distillation and Absorption Review .................................................. 32
2 Materials and Methods ...............................................................................................34

iv
2.1 Research Questions and Hypotheses .................................................................. 34
2.1.3 Phosphate Ion Exchange Research Questions .................................................. 34
2.1.2 Ammonium Ion Exchange Research Questions ............................................... 36
2.1.3 Struvite Precipitation Research Questions ....................................................... 37
2.2 Selection and Preparation of Ion Exchange Materials ....................................... 38
2.3 Ammonium Ion Exchange Batch Testing .......................................................... 39
2.4 Phosphate Ion Exchange Batch Testing ............................................................. 42
2.5 Column Testing .................................................................................................. 47
2.6 Column Regeneration ......................................................................................... 50
2.7 Struvite Precipitation .......................................................................................... 52
2.8 Analytical Methods ............................................................................................ 54
2.9 Statistical Analysis ............................................................................................. 55
3 Results and Discussion ...............................................................................................57
3.1 Zeolite NH4+ Exchange and Regeneration Batch Testing .................................. 57
3.1.1 Zeolite Ion Exchange Batch Testing with Ammonium Chloride ............... 59
3.1.2 Zeolite Regeneration for Ammonium Only Batch Testing......................... 61
3.1.3 Zeolite Ion Exchange Batch Testing with Mixed Cation Solution ............. 62
3.1.4 Zeolite Regeneration for Mixed Cation IX Batch Tests ............................. 65
3.2 Phosphate Ion Exchange Batch Testing ............................................................. 66
3.3 Wastewater Characterization.............................................................................. 72

v
3.4 Removal of Phosphate in Lab-Scale Ion Exchange Columns ............................ 74
3.5 Desorption of Phosphate from Lab-Scale Ion Exchange Columns .................... 79
3.6 Ammonium Exchange in a Lab-Scale Zeolite Column ..................................... 84
3.7 Ammonium desorption during Lab-Scale Zeolite Regeneration ....................... 88
3.8 Struvite Precipitation .......................................................................................... 90
4 Conclusions ................................................................................................................97
4.1 Phosphate Ion Exchange Batch Testing Conclusions ........................................ 97
4.2 Zeolite Ion Exchange Batch Testing Conclusions ............................................. 98
4.3 Column Phosphate Ion Exchange Conclusions .................................................. 99
4.4 Zeolite Ion Exchange Column Conclusions ......................................................... 101
4.5 Struvite Precipitation Conclusions ........................................................................ 102
4.6 Final Conclusions.................................................................................................. 104
5 Bibliography .............................................................................................................105
Appendix A ......................................................................................................................114

vi
LIST OF TABLES
Table 1: Phosphate selective IX resin literature ............................................................... 27
Table 2: Chelating phosphate selective resins .................................................................. 42
Table 3: List of anion media and regenerants used in PO4-P IX batch testing ................. 46
Table 4: Average separation factor for NH4+ during IX cycle 3 and 4. ............................ 65
Table 5: Phosphate only batch IX (triplicate bottles) ....................................................... 67
Table 6: Final solution characteristics in mixed anion solution batch IX (triplicate
averages) ........................................................................................................................... 69
Table 7: Mixed anion regeneration test (triplicate averages) ............................................ 69
Table 8: Spiked phosphate batch IX (triplicate bottles) .................................................... 70
Table 9: Student t-test p-values for spiked phosphate IX ................................................. 71
Table 10: Regeneration performance for spiked P test (triplicate bottles) ....................... 72
Table 11: Removal % and initial ion concentration for anion + zeolite regenerant
precipitation ...................................................................................................................... 95
Table 12: Average solids composition for LayneRT™
and Dow-Cu 2 precipitation ....... 96
Table A1: Nitrogen removal technology list .................................................................. 114
Table A2: Phosphorus removal technology list .............................................................. 115
Table A3: Student t-test results for zeolite IX in mixed cation solution (IX cycle 5) .... 115
Table A4: P-values for F-test of zeolite IX in mixed cation solution (IX cycle 5) ......... 115
Table A5: P-values for F-test of spiked phosphate IX .................................................... 116
Table A6: Student t-test p-values for spiked phosphate regeneration ............................ 116
Table A7: P-values for F-test of spiked phosphate regeneration .................................... 116
Table A8: SSWRF Secondary Effluent Characteristics.................................................. 117

vii
Table A9: Anion IX effluent metals ............................................................................... 118
Table A10: Ion concentrations in anion and zeolite regenerants .................................... 119

viii
LIST OF FIGURES
Figure 1: Simplified schematic of nitrogen cycle relating to fertilization and wastewater 3
Figure 2: Process diagram for anaerobically treated municipal wastewater ....................... 4
Figure 3: Estimated N balance for 1 million gallons per day (MGD) anaerobically treated
municipal wastewater.......................................................................................................... 5
Figure 4: Estimated P balance for 1 MGD anaerobically treated municipal wastewater ... 6
Figure 5: Nutrient recovery schematic .............................................................................. 19
Figure 6: The steps to NH4-N batch testing ...................................................................... 41
Figure 7: The steps to PO4-P batch testing ....................................................................... 47
Figure 8: Phosphate IX column testing apparatus ............................................................ 49
Figure 9: Batch struvite precipitation steps ...................................................................... 54
Figure 10: Sorption of NH4+ onto clinoptilolite ................................................................ 58
Figure 11: Sorption of NH4-N onto zeolite vs final NH4-N concentration; initial NH4-N
labeled next to data point .................................................................................................. 59
Figure 12: NH4-N removal by clinoptilolite in NH4Cl solution vs IX cycle .................... 61
Figure 13: Regenerant NH4-N concentration (NH4+ only test) vs. regeneration cycle ..... 62
Figure 14: Removal of NH4-N (mixed cation solution) vs IX cycle ................................ 63
Figure 15: Regenerant NH4-N concentration (mixed cation test) vs regeneration cycle .. 66
Figure 16: LayneRT™
column effluent PO4-P vs BV treated. .......................................... 75
Figure 17: Dow-Cu cycle 1 column effluent PO4-P vs BV treated .................................. 76
Figure 18: Dow-Cu cycle 2 column effluent PO4-P vs BV treated .................................. 77
Figure 19: Dow-FeCu effluent PO4-P concentration vs BV treated ................................. 79
Figure 20: LayneRT™
regeneration effluent PO4-P vs BV passed ................................... 81
Figure 21: DOW-Cu regenerant PO4-P concentration vs BV passed during cycle 1 and 2
........................................................................................................................................... 82

ix
Figure 22: Dow-FeCu regenerant effluent PO4-P concentration vs BV passed ............... 84
Figure 23: Zeolite column effluent NH4-N vs BV treated (cycle 1) ................................. 85
Figure 24: Zeolite column effluent NH4-N vs BV treated (cycle 2) ................................. 86
Figure 25: Zeolite regenerant NH4-N concentration versus BV passed (cycle 1 and 2) .. 89
Figure 26: K-struvite precipitation vs pH using synthetic solution (Mg:P:N of 2:2:1) .... 91
Figure 27: N-struvite precipitation vs pH using synthetic solutions................................. 92
Figure A1: Zeolite IX cycle 1 effluent cations vs BV treated. ....................................... 120
Figure A2: Zeolite IX cycle 2 effluent cations vs BV treated ........................................ 120
Figure A3: Zeolite IX cycle 1 effluent metals vs BV treated ......................................... 121
Figure A4: Conditional struvite solubility product vs pH for synthetic solution N-struvite
precipitation .................................................................................................................... 121

1
1 Introduction and Literature Review
1.1 Redesigning Wastewater Treatment
The focus of this study was to more efficiently utilize resources in municipal
wastewater for economic benefit while producing high quality effluent. In its traditional
form, municipal wastewater treatment requires large energy inputs for biochemical
oxygen demand (BOD) and nitrogen (N) removal and chemical inputs for phosphorus (P)
removal (Jetten et al., 1997; Metcalf and Eddy, 2003). The first project objective was to
replace secondary aerobic treatment of organics with anaerobic treatment. Aerobic
treatment requires large quantities of electricity, greater than 50% of all plant energy
usage, to transfer air into the reactor, while anaerobic treatment could potentially produce
a net gain in energy (McCarty et al., 2011). Net energy gain would be accomplished
through electrical generation from the anaerobic reactor’s biogas. In addition, anaerobic
treatment produces less biomass than aerobic treatment and therefore biosolids handling
is reduced; biosolids handling is a costly component of wastewater treatment plants
(Smith et al., 2012). Despite these benefits, anaerobic treatment lacks nutrient, N and P,
removal capabilities that are conventionally accomplished through
nitrification/denitrification and enhanced biological phosphorus removal (EBPR) in
aerobic and anoxic systems (Smith et al., 2012). In addition to EBPR, phosphorus is also
removed through chemical precipitation which uses metals to precipitate phosphate (PO4-
P). An alternative redesigned wastewater treatment process may take advantage of
2
anaerobic treatment for energy recovery coupled with physical/chemical treatments
targeting N and P removal and recovery.
N and P often must be removed from wastewater to meet regulatory discharge
limits, but they are also valuable resources. In states with numeric criteria, total P and
total N waterway limits range from 0.006-3.75 mg/l and 0.14-90 mg/l, respectively
(USEPA, 2013). N and P are regulated due to eutrophication in the environment, which is
excess growth of algae due to nutrient availability followed by their death, consumption
by microbes and subsequent oxygen depletion; N is also regulated due to aquatic toxicity
(Camargo and Alonso, 2006; Diaz and Rosenberg, 2008). These two macronutrients are
potential resources as high crop yields are dependent on fertilizers containing N and P. In
order to obtain N fertilizers, about 1% of the world’s energy is used in the Haber-Bosch
process that forms ammonium (NH4+) from nitrogen gas (N2) (Smith, 2002). In
wastewater treatment, additional energy is spent to convert the NH4+ in the wastewater
back to N2 through nitrification/denitrification; the N cycle as it pertains to fertilization
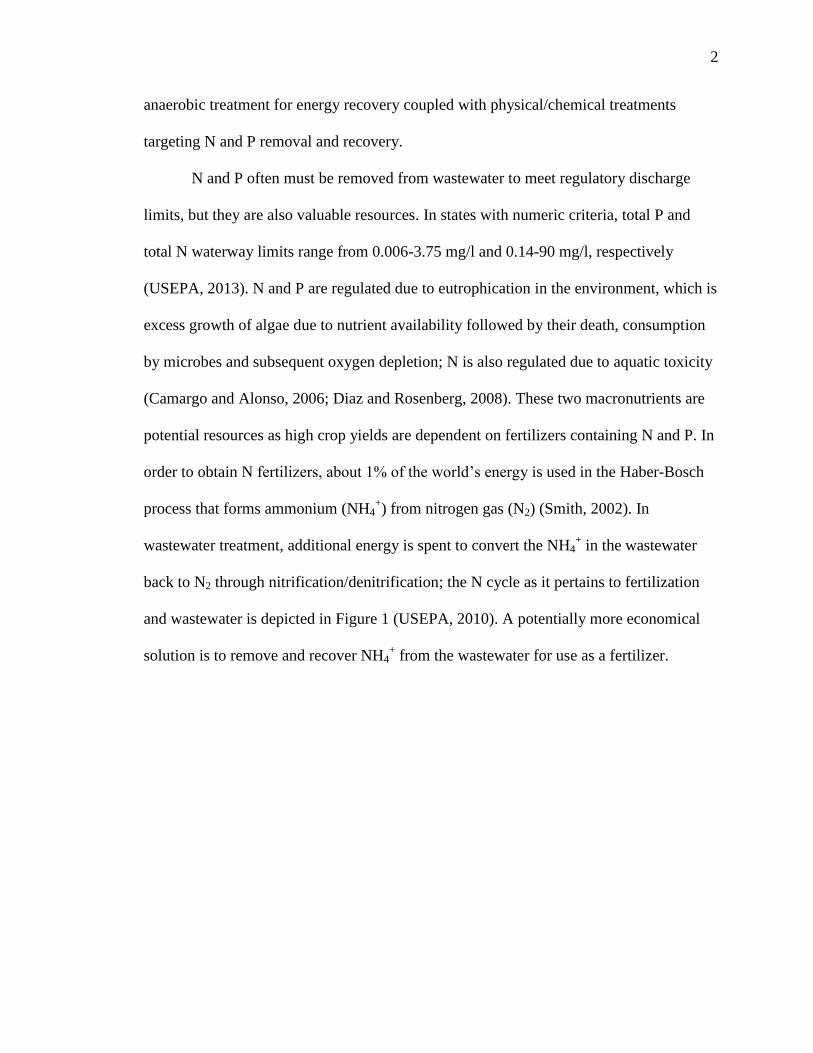
and wastewater is depicted in Figure 1 (USEPA, 2010). A potentially more economical
solution is to remove and recover NH4+ from the wastewater for use as a fertilizer.

3
Figure 1: Simplified schematic of nitrogen cycle relating to fertilization and
wastewater
Phosphorus fertilizer is currently obtained from mining, which introduces two main
concerns: processing requires energy and phosphate rock supplies are expected to be
depleted in 50-100 years (Cordell et al., 2009). Therefore, recovery of PO4-P from
wastewater may be more sustainable than mining and traditional wastewater P removal
by providing economic, environmental, and food supply benefits. Accordingly, the
redesign of wastewater treatment considering improved sustainability must address
nutrient recovery.
The anaerobic membrane bioreactor (AnMBR) has been proposed as the
anaerobic treatment process and has the potential to reduce chemical oxygen demand
(COD) and total suspended solids (TSS) to less than 80 and 1 mg/l, respectively
(Gimenez et al., 2011; Kim et al., 2011). The treatment train can include a primary
clarifier in series with an AnMBR. Solids from each of these processes are removed and

4
can be sent to conventional municipal anaerobic digestion which is followed by solids
dewatering. N removal could be implemented in the supernatant from solids dewatering,
primary clarifier effluent, or AnMBR permeate; N removal technologies must be separate
from the other treatment unites. P removal could be implemented anywhere in the system
depending upon process selection. Specifically, precipitation of P could be performed in
the clarifier, AnMBR, solids dewatering supernatant (SDS) or the final effluent.
However, other P removal processes would only be applicable to the SDS or final
effluent. A diagram one possible process is depicted in Figure 2.
Figure 2: Process diagram for anaerobically treated municipal wastewater

5
Figure 3: Estimated N balance for 1 million gallons per day (MGD) anaerobically
treated municipal wastewater
A N balance for the proposed municipal wastewater treatment system is depicted
in Figure 3. A typical raw municipal wastewater contains about 30-50 mg/l total Kjeldahl
nitrogen (TKN) (Metcalf and Eddy, 2003). Settled sludge in the primary clarifier solids is
approximately 0.5-1% of the influent flow with 2-7% solids, with approximately 1.5-4%
of those solids consisting of N (Metcalf and Eddy, 2003; Turovskiy and Mathai, 2006).
Using 4% total solids for the primary sludge and 2.5% N in the solids, N content was
calculated (Metcalf and Eddy, 2003; Turovskiy and Mathai, 2006). Approximately 10%
of AnMBR’s influent N is removed in the solids through biomass growth (Grundestam
and Hellstrom, 2007). Flow rate of the AnMBR waste solids was estimated in accordance
with Kim et al. (2011): 4.4 hr hydraulic retention time and 50 day solids retention time.
In solids handling, dewatering with a belt filter press results in approximately 85% solids
capture; these solids contain approximately 3.3% N (Metcalf and Eddy, 2003). By
solving a system of equations for solids dewatering, the flow rate for solids and
supernatant as well as the supernatant N concentration were calculated. As shown in

6
Figure 3, theoretically 7% of N is removed in biosolids, 10% of influent N is in the solids
dewatering supernatant leaving and 93% of influent N is in the final effluent if the solids
dewatering supernatant is recycled to the primary clarifier.
Figure 4: Estimated P balance for 1 MGD anaerobically treated municipal
wastewater
A P balance was completed for an AnMBR treatment plant and is depicted in
Figure 4. Influent total phosphorus (TP) averages about 4-12 mg/l (Metcalf and Eddy,
2003). P content in the primary sludge solids is about 1%; primary sludge P content in
Figure 4 was calculated with the previously stated solids content (Metcalf and Eddy,
2003). An AnMBR is estimated to remove about 10% TP through biological growth and
particulate reject by the membrane (Grundestam and Hellstrom, 2007). Therefore the
final effluent TP concentration would be 3.5 mg/l TP. In the biosolids from dewatering of
anaerobic digester effluent, there is about 0.9 to 5.2% TP (European Commission, 2001).
Since dewatered solids supernatant typically contains 60 mg/l TP or greater, a TP

7
concentration in the biosolids of 1.5% was used for calculations (Forrest et al., 2008).
Figure 4 shows that 50% of the influent P can be recovered in the biosolids, 11% could
be recovered in the sludge dewatering supernatant and 50% in the final effluent if the
supernatant is recycled.
1.2 Recovery Streams Review
Selection of an applicable technology for nutrient recovery is highly dependent
upon the characteristics of the wastewater to be treated. In this study, AnMBR permeate
or SDS was targeted for nutrient recovery. Anaerobic digester SDS has been well
characterized and studied for nutrient removal and recovery. This stream typically
contains ammonium-N (NH4-N) and PO4-P concentrations of 600 and 70 mg/l,
respectively (USEPA, 1979). Since it is the liquid stream from solids digestion and
dewatering, there is also a significant 5-day BOD (BOD5) and TSS associated with the
stream, 100-2,000 and 100-10,000 mg/l, respectively (USEPA, 1987). Struvite
precipitation has been widely investigated in this stream and is now being applied full-
scale with companies such as Ostara and Multiform Harvest (Clean Water Services,
2013; Ostara, 2013). Precipitation of struvite recovers most of the PO4-P and a portion of
N from the sidestream (Munch and Barr, 2001). Another technology developed for this
stream is partial nitritation and Anammox. This process simply removes N, but does so
with less carbon and energy than nitrification/denitrification (van Dongen et al., 2001).
Full-scale AnMBR has not been well defined since much of the work with these
systems has been at pilot and lab scale with little or no full-scale municipal wastewater
implementation (Smith et al., 2012). AnMBR are capable of producing permeate with

8
effluent COD and TSS of less than 80 and 1 mg/l, respectively; effluent COD in one
process was 7 mg/l (Gimenez et al., 2011; Kim et al., 2011; Martinez-Sosa et al., 2011).
A submerged AnMBR treating screened raw sewage produced an effluent with 33 mg/l
NH4-N, 3.1 mg/l PO4-P, 95 mg/l S2-
, and 1.7 mg/l SO4-S (Gimenez et al., 2011). Influent
NH4-N and PO4-P concentration were less than effluent concentrations in the Gimenez et
al. (2011) system, suggesting that PO4-P was being released by microbes and organic N
undergoes ammonification in the anaerobic reactor. In the work of Gimenez et al. (2011),
influent sulfur was in the sulfate form and most of it was reduced to sulfide with a small
amount lost to gas and less than 2% remaining as sulfate. TP and TKN concentrations in
an AnMBR were reduced by 9% each during a study by Grundestam and Hellstrom
(2007). Therefore, it was estimated that only about 9% of nutrients will be removed
through biological uptake and membrane rejection. Since there is no mechanism for
removal and because the dissolved constituents will pass through the membrane, little
change in the concentration of NH4+, PO4
-3, ionic sulfur (SO4
-2+S
2-), Ca
2+, Mg
2+, K
+,
bicarbonate (HCO3-), and Cl
- is expected. However, the amount of organics and solids
will be significantly reduced. AnMBR permeate should contain few organic nutrients due
to membrane rejection and ammonification. An extra step for nutrient removal and/or
recovery is needed following anaerobic secondary treatment.
1.3 Nutrient Removal Review
A review of nutrient removal and recovery technologies was conducted in order to
develop a recovery process to be tested in the lab and to perform an initial removal
process comparison. The selected removal and recovery processes were to fit into the

9
treatment train depicted in Figure 2. The objective of the review was to assess the
characteristics of each N and P removal technology and compare them based on the
project goals. The priority goals for selecting a treatment process were as follows: value
of recoverable, footprint, treatment capability, energy and chemical use, and degree of
development. Treatment capability encompasses influent wastewater characteristics
suitable for the process and effluent quality. Wastewater characteristics into a unit
process were estimated based upon the mass balances in Figures 3 and 4. Processes were
categorized as biological or chemical/physical processes and removal or recovery
processes. Text books, peer-reviewed journal articles, presentations, and other sources
were used to collect information on nutrient removal processes. A complete list of the
technologies discussed in the following sections and their recoverables can be found in
Tables A1 and A2 for N and P, respectively.
1.31 Suspended Growth Biological Nitrogen Removal
Organisms used for biological treatment nutrient removal can be subdivided into
heterotrophic or autotrophic organisms and the organisms may grow either attached or in
suspension. Suspended growth microbes are typically used for municipal wastewater
treatment. N is removed through an aerated tank in which microbes nitrify NH4+ into
nitrite (NO2-) and nitrate (NO3
-). In a second tank that is anoxic, microbes convert NO2
-
and NO3- into N2. This process is known as nitrification/denitrification. Instead of a two
reactor system, there are many other potential configurations, including a sequencing
batch reactor, oxidation, Modified Ludzack-Ettinger, 4-Stage Bardenpho, and
simultaneous nitrification/denitrification (SNdN) (USEPA, 2010). In a sequencing batch

10
reactor, the wastewater enters the tank, is aerated to nitrify then allowed to become
anoxic to denitrify (USEPA, 1993). The wastewater is then discharged. An oxidation
ditch is a large oval with aerobic and anoxic zones (Metcalf and Eddy, 2003). Modified
Ludzack-Ettinger and the 4-Stage Bardenpho processes involve arrangement of multiple
oxic and anoxic tanks (Metcalf and Eddy, 2003). SNdN occurs when the DO
concentration is low enough that oxygen does not reach all microbes in flocs (USEPA,
2010). With these suspended growth methods, most of the N is lost to the atmosphere, but
some is recovered in the wasted biosolids as organic N (Metcalf and Eddy, 2003).
A suspended growth process that can be used in concentrated NH4+ streams is the
Single reactor system for High activity Ammonium Removal Over Nitrite (SHARON)
with denitritation or Anammox. This reactor operates at a high temperature (30-40 °C)
with equal hydraulic retention time and solids retention time (van Dongen et al., 2001). If
denitritation, the conversion of nitrite to N2, is next in the process then all NH4+ is
converted to NO2- without conversion of NO2
- to NO3
-, therefore reducing energy
requirements. If Anammox microbes are utilized in the second reactor, then half of the
NH4+ is converted to NO2
- in the SHARON reactor and in the Anammox tank NO2
- and
NH4+ are converted to N2 (van Loosdrecht et al., 2009). This saves aeration needed to
nitrify NH4+ and reduces the carbon requirements in the anoxic tank since NH4
+ acts as
the electron donor (van Dongen et al., 2001). A recently developed process, Completely
Autotrophic Nitrogen-removal Over Nitrite (CANON), combines SHARON and
Anammox in one tank. In this reactor NH4+-oxidizing bacteria outgrow nitrite-oxidizing
bacteria and cooperate with Anammox bacteria (Zhang et al., 2012). SHARON-
Anammox and CANON have not been operated for mainstream wastewater treatment.

11
SHARON has been operated full-scale in the Netherlands and Anammox reactors have
been operated full-scale in the Netherlands, Japan, China, Poland, and UK (Ni and
Zhang, 2013). Full-scale CANON facilities can be found in the Netherlands, Switzerland
and China (Haandel and Lubbe, 2012).
1.32 Attached Growth Biological Nitrogen Removal
Attached growth processes have been developed to increase microbial contact
with wastewater, thereby reducing the footprint required. These processes still require an
aerobic and anoxic zone for nitrification and denitrification. Common attached growth
reactors include: biological aerated filter (BAF), fluidized bed bioreactor (FBBR),
moving bed biofilm reactor (MBBR), rotating biological contactor (RBC), and trickling
filter (TF). In a BAF, the bed is packed with a media such as plastic and the wastewater is
passed either down or up through the bed (Canler and Perret, 1994). In FBBRs and
MBBRs media is suspended, but an FBBR is a column shape with wastewater fed
upwards to fluidize the media while an MBBR tank has a rectangular surface area with
air or a mixer to keep the media suspended and moving (Metcalf and Eddy, 2003;
USEPA, 2010). Rotating biological contactors are large rotating disks that provide
oxygen to bacteria when exposed to air then are re-submerged in the wastewater through
a continuous cycle. Trickling filters consist of a large surface area tank with rocks or
plastic through which wastewater is allowed to flow by gravity (Daigger and Boltz,
2011). The MBBR and RBC have been used for full-scale secondary treatment of
wastewater; however, the other attached growth processes are designed for tertiary

12
treatment (Metcalf and Eddy, 2003). N can be recovered from the backwash of TFs,
BAFs, and FBBRs through solids dewatering and land application of biosolids; however,
most of the N is lost to the atmosphere.
1.33 Photosynthetic Biological Nitrogen Removal
Nutrient removal can be accomplished through an algae or floating aquatic
organism pond and algae reactors (Singh and Thomas, 2012; USEPA, 1993; van der
Steen et al., 1999). With these ponds, N and P are taken up in the biomass and the ponds
also contain microorganisms capable of nitrification/denitrification. Suspended organic P
can be settled in the ponds. This method requires a large footprint and has poor treatment
efficiency at low temperatures (USEPA, 1980). The biomass can be harvested if a cost-
effective technique for algae separation from water is available (Cai et al., 2013). Novel
algae reactor designs have been developed to minimize footprint and increase the ability
to harvest biomass. These include the following: high rate algal pond (HRAP), tubular
photobioreactor, membrane algae bioreactor, and the Algaewheel. Tubular
photobioreactors allow for more light penetration into the algae biomass, but can
overheat, accumulate toxic concentrations of O2 and have a high initial investment costs
(Arbib et al., 2013). Although HRAPs are easier to operate than closed systems, there is
poor mixing, a large area requirement, and high diffusion rates to the atmosphere (Arbib
et al., 2013). Membrane bioreactors with algae cultivation can be used for tertiary
nutrient removal (Singh and Thomas, 2012). Utilizing membranes allows for algae
retention and therefore a more rapid rate of nutrient removal. It also increases the
concentration of algae, making biomass recovery more efficient. The Algaewheel is

13
capable of removing nutrients and BOD and includes a spool harvesting technique for
algae separation from water (Christenson and Sims, 2012). During the spool harvesting
technique, cord lining a rotating algae wheel is passed through a scraper to detach
biomass and then is wound back onto the wheel (Christenson and Sims, 2012).
1.34 Biological Phosphorus Removal
P can be removed through biological uptake in a process known as biological
phosphorus removal (BPR). This process utilizes a specific group of microorganisms
known as PO4-P accumulating organisms (PAOs) that take up more PO4-P than typically
found within microbial cells (Metcalf and Eddy, 2003). During anaerobic conditions,
PAOs release polyphosphate and uptake readily biodegradable compounds, typically
short-chain volatile fatty acids (VFA) (USEPA, 2010). Under aerobic conditions, the
microorganisms use energy from the VFAs stored as poly-β-hydroxy-alkonates to uptake
P into their cells (USEPA, 2010). These organisms have a competitive advantage in
sequential anaerobic-aerobic environments with high substrate (i.e., VFA) concentration
in the anaerobic period in that they can store energy where as other microorganisms must
wait for oxygen to be present to uptake VFAs (USEPA, 2010). The steps to BPR are as
follows: anaerobic zone for VFA uptake, aerobic zone for P uptake and cell growth, and
clarification to settle PAO for waste and recycle (Metcalf and Eddy, 2003). P removal is
improved since organisms containing excess PO4-P are wasted for solids handling.
Suggested wastewater constituent ratios for effective BPR performance, include the
following: BOD:TP=20:1, readily biodegradable chemical oxygen demand (rbCOD) to
TP ratio of 10-16:1 and VFA:TP=4-16:1 (Barnard et al., 2006; Neethling et al., 2005;

14
WEF and ASCE, 2006). Carbon sources may come from the wastewater, a process may
be added to ferment the waste, or external sources of carbon, such as molasses, may be
added (USEPA, 2010).
1.35 Physical/Chemical Nitrogen Removal
The physical/chemical technologies for removing or concentrating NH4+ from
wastewater include the following: breakpoint chlorination, ion exchange (IX), and
electrodialysis. Ion exchange using zeolite has been studied for NH4+ removal for 80
years (Gleason and Loonam, 1933). As wastewater passes through the IX column
containing zeolite, NH4+ is attached to the zeolite surface in exchange for Na
+ or other
cations. With this media treating municipal wastewater, the NH4-N effluent concentration
is typically less than 1 mg/l for around 130 bed volumes treated (USEPA, 1993).
Regeneration of the IX column with a high pH salt produces high NH4-N concentration
salt water. Electrodialysis is a method for concentrating NH4+ ions by applying a current
to a selective membrane, causing the ions to pass from the sample to a concentrated
solution on the other side of the membrane (Ippersiel et al., 2012). The benefit of
concentration with electrodialysis or IX is that it provides a concentrated solution more
suitable for recovery technologies. Breakpoint chlorination is the addition of chlorine to
the point at which NH4+ is oxidized to N2 (USEPA, 1980). Breakpoint chlorination can
result in chlorinated organics formation and is not recommended for total N removal
(USEPA, 1993).
NH4+ can be removed and recovered from wastewater through physical/chemical
methods such as ammonia transfer to the gas phase with subsequent absorption or struvite

15
precipitation. Air stripping, vacuum distillation, and vacuum membrane distillation all
work by the same mechanism: ammonia conversion to the gas phase. This is
accomplished by adjusting the pH to 10.8 or greater and then forcing ammonia into the
gas phase by passing it countercurrent to air in a packed bed tower (air stripping),
spraying the liquid into drops in a vacuumed tank (vacuum distillation), or passing the
solution through a membrane allowing only gas transfer (vacuum membrane distillation)
(El-Bourawi et al., 2007). The ammonia gas must then be captured in acidic water,
carbonic acid, nitric acid, or sulfuric acid. The final technology is struvite precipitation.
Struvite is a slow-release fertilizer with the chemical formula MgNH4PO4. This process
has been developed at full-scale to treat high NH4-N concentration streams such as the
SDS; however, mainstream recovery work has been limited. This process requires the
addition of a Mg2+
source such as MgCl2 and pH adjustment to around 8-10 depending on
wastewater composition for maximum struvite precipitation (Adnan et al., 2003).
1.36 Physical/Chemical Phosphorus Removal
Removal of P by physical/chemical methods includes precipitation with a metal
salt, ballasted flocculation, electrodialysis, adsorptive filtration, ion exchange, thermal-
metallurgical recovery, and wet chemical extraction. Precipitation of PO4-P by metal
salts, typically ferric chloride (ferric) or aluminum sulfate (alum) is a widely accepted
and utilized practice in wastewater treatment (USEPA, 2000b). This process is effective;
however, excess ferric or alum is required due to competing chemical reactions (USEPA,
2000b). Polyaluminum chloride is another metal salt that can be utilized for P removal.
Polyaluminum chloride can also be used to increase remove organics and suspended

16
solids; in addition it can decrease irreversible fouling rate when added to membrane
bioreactors (Gasiunas and Askinis, 2011; Teli et al., 2012). P removal is also possible
through magnetite seeded calcium PO4-P precipitation (Karapinar et al., 2004). Removal
of PO4-P by precipitation occurs through formation of super-saturation, nucleation and
crystal growth (Karapinar et al., 2006). Struvite precipitation, as described previously
with respect to N, is effective for P removal as well. P is typically the limiting nutrient as
P is found in insufficient quantities to remove all N when precipitating struvite in
municipal SDS or anaerobically digested dairy manure (Munch and Barr, 2001). The
product is valuable as a slow-release fertilizer (Yilmazel and Demirer, 2011).
P can be captured and concentrated in a liquid stream through
adsorption/desorption, ion exchange, or electrodialysis. There are a number of adsorbents
for PO4-P, including: iron-based adsorbents, poly hydrogels, adsorbent beads (Ashahi
Kasei Chemical, Tokyo, Japan), titanium dioxide, raw dolomite, iron and manganese
mixtures, steel slag, blast-furnace slag, coal slag, red mud, iron-oxide tailings, and
aluminum oxide (Rittman et al., 2011). Iron-oxide coated sand filtration has been
developed to selectively remove PO4-P and suspended solids. The media is continually
sheared of PO4-P and new iron coating is added. This process has been proven to provide
effluent TP of less than 0.075 mg/l as tertiary municipal wastewater treatment
(Newcombe et al., 2008). Ion exchange of PO4-P is a method that can concentrate PO4-P,
similar to adsorption. As with NH4+ IX, an ion on the media surface is transferred into
solution with PO4-P taking its place on the media surface. Currently well-researched
exchange materials include metal-loaded chelating resins, hydrotalcites, iron-based
hydroxide compounds and capacitive deionization (CD) on electrodes (Rittmann et al..

17
2011). PO4-P ions accumulate on oppositely charged carbon electrodes in CD. Metal-
loaded resins have shown a high selectivity towards PO4-P and the ability to be
regenerated at greater than 95% recovery of exchanged PO4-P (Sengupta and Pandit,
2011).
In some locations, wastewater sludge are incinerated due to regulations against
landfilling, the high cost of landfilling, or other factors. However, this sludge is rich in P
and many technologies have been developed to capture this P either through wet
chemical extraction or thermal metallurgical recovery (Rittmann et al., 2011). During
thermal metallurgical recovery, sewage sludge ash is mixed with a chloride (Cl-) donor
and then heated to greater than 750 °C (Adam et al., 2009). This removes metal chlorides
from the ash and provides a highly bioavailable P ash, but these metal chloride gases
must then be treated (Adam et al., 2009). Wet chemical treatment of sewage sludge ash
decreases the ash pH to leach metals and PO4-P followed by two steps for separation of
heavy metals and P from the acidic water (Takashashi et al., 2001). There are many
different variations of this technology on the market as described by Rittmann et al.
(2011).
1.4 Nutrient Recovery Scheme
A multi-step process for nutrient recovery was developed based on the literature
review. Ion exchange was selected for both PO4-P and NH4+ as a way to concentrate the
N and P. Selection of IX was based upon treatment of wastewater with nearly no solids
and low BOD; solids will cause plugging in IX columns and elevated BOD can cause
biological fouling of the media. In addition, the recovery technologies are less expensive

18
to operate in concentrated streams; therefore, IX can be used as a lower-cost method to
produce concentrated N and P streams. Struvite precipitation was selected as the method
for removing PO4-P and a portion of the NH4+ as the recovered product can be used as a
fertilizer (Forrest et al., 2008). Since there is not enough P to remove all N through
struvite precipitation, vacuum ammonia distillation and absorption was selected to
recover N from the remaining concentrated N stream. Ammonia gas stripping and
absorption is the only technology well-developed for complete recovery of aqueous
NH4+. Vacuum distillation is the preferred method of gas transfer since the energy
requirements and tank space are less than that of traditional gas stripping towers
(Orentlicher et al., 2007).
The system developed for NH4+ and PO4
-3 recovery is depicted in Figure 5.
Removal of P in the HPO4-2
and H2PO4- form by anionic IX was investigated herein.
NH4-N removal using IX with clinoptilolite was also investigated. Regeneration eluate
from anion exchange containing a high concentration of PO4-P and a fraction of the
cation regenerant containing high NH4-N concentration are combined in a flask with
magnesium addition in order to precipitate struvite. Effluent from the struvite reactor
could be recycled for PO4-P IX regeneration. Recovery of NH4+ from the regeneration
eluate could be performed using vacuum distillation at pH of around 11. Ammonia gas
from the distillation process could be absorbed in an acid such as sulfuric acid to create
(NH4)2SO4 solution. Reduced ammonia wastewater from the vacuum distillation process
could be recycled for use as the regenerant at the end of each IX cycle.

19
Figure 5: Nutrient recovery schematic
1.5 Ion Exchange Physico-chemistry
Ion exchange is the process of transfer of an ion on a solid surface for a similarly
charged ion in solution. This exchange occurs in equivalent amounts of charge and is
reversible (Reynolds and Richards, 1996). For example one Ca2+
ion in solution will
transfer to the solid phase in exchange for two Na+ ions. This Ca
2+ ion would be bonded
to the same surface sites as the two Na+ ions were originally. The total exchange capacity
is measured as equivalents per g or L of solid: in other words, the number of equivalents
of exchangeable ions per unit of media. An exchange preference for ions exists for each
media and is dependent upon surface functional groups and characteristics of the material
(Eckenfelder, Jr. et al., 2009). For example, a media such as zeolite with Na+ ions on the
surface will exchange with different amounts of K+, Ca
2+, Mg
2+, and NH4
+. Some of the

20
important factors in determining exchange amount and rate include the following: size
and valence of ions being exchanged, concentration of ions in solution, physical/chemical
nature of media, and temperature (Eckenfelder, Jr. et al., 2009). There are synthetic and
natural ion exchangers; natural ion exchangers include materials such as zeolites and
clays while synthetic exchange resins are polymers containing reactive surface groups
(Reynolds and Richards, 1996). Synthetic resins are either cationic or anionic depending
on the surface group. In water and wastewater treatment, IX is used for removal of
hardness, metals, and nutrients (Weber, Jr., 1972). In an operating column, media will
produce a consistent effluent until exchange capacity begins to be exhausted; at this point
the effluent concentration of the targeted ion will begin to increase until it becomes equal
to the influent. Flowrate in IX systems is typically 1 to 8 gpm/ft2; the height-to-diameter
ratio should be about 1.5:1-3:1 (Reynolds and Richards, 1996). When the media is
exhausted, it is typically backwashed and then regenerated by passing a 5-10% brine
solution through the column. Backwashing will result in bed expansion of 75-100% in
synthetic resins and 25% in zeolites; therefore, tanks must be designed to handle this
increase in volume (Reynolds and Richards, 1996). This forms a concentrated solution of
the ion exchanged during the service cycle. Valuable heavy metals and other compounds
can be recovered from this regenerant stream. Finally there is a rinse cycle prior to
starting the next service cycle (Weber, 1972).

21
1.6 Ammonium Ion Exchange
Removal of NH4+ from wastewater by IX was first researched in the early-to-mid
1900’s (Gleason and Loonam, 1933). The media typically used for NH4+ ion exchange is
clinoptilolite, a natural mineral which is a type of zeolite (USEPA, 1980). Exchange of
ions occurs in minerals between two layers of either silica-oxide or alumina-oxide
tetrahedral in which there is a deficit of positive ions (Reynolds and Richards, 1996). At
this location, cations such as K+, Ca
2+, Mg
2+, etc. are weakly bonded to the surface and
will exchange with ions in solution based on a chemical potential (Kitsopoulos, 1999).
Despite the mineral’s lower total exchange capacity in comparison to synthetic resins,
zeolite’s selectivity for NH4+ compensates for the exchange deficiency (Koon and
Kaufman, 1975). Potassium is the only ion clinoptilolite is more selective towards than
NH4+ (USEPA, 1993). Exchange capacity of the clinoptilolite in wastewater applications
is about 0.2-0.5 meq/L (USEPA, 1993). This process is not significantly affected by
temperature and can reduce influent NH4-N concentrations of 10-50 mg/l to within the
range of 0.2 to 3 mg/l (USEPA, 1980). With typical wastewater NH4-N concentration,
about 25-30 mg/l, zeolite can reduce NH4-N to less than 1 mg/l in about 130 bed volumes
(BV) of wastewater (Cooney and Booker, 1999; USEPA, 1993).
Once the IX bed is exhausted, the media must be regenerated. Regeneration of
clinoptilolite is accomplished using 10-20 BV of a high pH salt solution (USEPA, 1993).
High pH salt solutions may include an individual chemical or some combination of NaCl,
NaOH, and/or Ca(OH)2. Calcium hydroxide solution is suggested by Metcalf and Eddy
(2003). Using Ca(OH)2 may be beneficial if ammonia is to be stripped from the

22
regenerant as it reduces the need for chemicals in the next step since the pH is already
elevated above 11; however, Ca2+
will not exchange from the surface as easily as Na+
(Hedstrom, 2001). Previous work has utilized NaCl concentrations at an elevated pH to
increase the speed of regeneration (Hedstrom, 2001). Guo et al. (2013) looked at the
optimal regenerant salt and NaOH concentration and determined that 2% NaCl with 0.1
M NaOH was sufficient; however, this test was performed with treatment of high NH4+
wastewater which may affect the IX-regeneration characteristics. There is a point at
which the pH becomes too excessive as it causes attrition of the zeolite; however, this
point is not defined (Koon and Kaufmann, 1975). Peak regenerant concentration is
around 500 mg/l NH4-N when treating municipal wastewater and desorbing NH4+ with
NaCl at an elevated pH (Cooney and Booker, 1999; Du et al., 2005). Zeolite has been
shown to maintain exchange capacity after 12 IX cycles utilizing a 3.5% NaCl solution at
a pH of 10; testing ended after 12 cycles (Cooney and Booker, 1999).
Operational risks to consider include plugging, biological fouling, inorganic
fouling, and reduction in exchange capacity. Excess solids pose the threat of plugging the
IX column, causing an increase in pressure drop and reduction in exchange capacity.
Typically regeneration is preceded by backwashing to remove solids; however, in the
current study’s system nearly no solids will be present due to membrane rejection in the
AnMBR. There is the potential for biological fouling due to the concentration of organics
and inorganic fouling caused by precipitation of calcium or magnesium hydroxides.
However, biological fouling risks would appear to be limited due to the low BOD and
high pH regenerant. The Langelier Saturation Index is calculated using Equations 1 and 2
to estimate the inorganic fouling potential of the wastewater (Langlier, 1936).

23
[ ][
]
[ ]
( {[ ][ ]}) [ ] [ ] Equation (1)
Where,
[H+]= Concentration of H
+ (mol/L)
[CO32-
]= Concentration of CO32-
(mol/L)
[HCO3-]= Concentration of HCO3
- (mol/L)
[ak]= Alkalinity of wastewater (mol/L)
Equation (2)
Where,
LSI=Langelier Saturation Index
pHactual=pH of wastewater
Calculated LSI values less than 1 indicate slight to moderate fouling potential, 1 to 3
indicates strong to very strong fouling potential, and greater than 3 is severe fouling
potential (Cremaschi et al., 2012). Results for the wastewater used in this study will be
described in the section, Wastewater Characterization.
Cations in solution will affect the uptake of NH4+; in municipal wastewater the
cations found in significant concentrations are K+, Na
+, Mg
2+, Ca
2+, and Al
3+. Uptake of
these ions with clinoptilolite has been studied in tertiary treated wastewater, urine and
stored urine, and concentrated NH4+ streams (Beler Baykal et al., 2009; Cooney and
Booker, 1999; Guo et al., 2013). In one study, tertiary treated wastewater contained 12,
10, and 15 mg/l Ca2+
, Mg2+
, and K+, respectively (Cooney and Booker, 1999). Potassium
concentrations are similar to expectations for AnMBR permeate; however, Mg2+
and Ca2+
are expected to be closer to 35 and 70 mg/l, respectively based on conventional primary
effluent (Metcalf and Eddy, 2003). Magnesium breakthrough occurred at about the same

24
time as NH4+; K
+ and Ca
2+ never had complete breakthrough as a result of preferential
exchange (Cooney and Booker, 1999). Peak regenerant concentrations of K+, Ca
2+, and
Mg2+
were about 300, 270, and 170 mg/l, respectively; (Cooney and Booker, 1999). The
greater the salt concentration, the greater efficiency of K+ desorption (Guo et al., 2013).
NH4-N and K+ exchange were similar between IX cycles, with K
+ being slightly greater
after cycle 1 (Guo et al., 2013). Weatherley and Miladinovic (2004) showed that the
presence of K+, Ca
2+, and Mg
2+ decreased NH4
+ removal, but not significantly. Removal
of NH4+ decreases in the presence of other cations due to their occupation of exchange
sites.
1.7 Phosphate Ion Exchange Review
PO4-3
can be removed from wastewater using IX just as discussed with NH4+;
however, synthetic resins are typically used for PO4-P removal. This process has been
researched for PO4-P removal due to its ability to work in variable wastewater
composition, flow-rate and temperature; however, the challenges associated with PO4-P
IX include the following: poor selectivity towards PO4-P over other ions, inefficient
regeneration, and loss of loading capacity due to fouling (Petruzzelli et al., 2003).
Despite these challenges, the process could be optimized to overcome these three issues.
Selectivity towards PO4-P can be enhanced by loading resins with iron, copper, or other
metals that form a strong coordination bond with HPO4-2
and H2PO4- (Sengupta and
Pandit, 2011). Typical resins used as the base for loading with metal, include Dow
M4195 and Dow 3N (Petruzzelli et al., 2003; Sengupta and Pandit, 2011). Biological and
inorganic fouling issues should be minimized by treating AnMBR permeate that contains

25
a low concentration of BOD5 and organics. With many different resins to choose from,
efficiency of regeneration could be optimized by testing various media with multiple
regenerants. Regenerant could be beneficially used to recover PO4-P: thereby providing a
valuable product to offset process costs. Previous work has been performed using PO4-P
IX with struvite precipitation of the regenerant (Sengupta and Pandit, 2011). Zeolite
regenerant has been proposed as a N or K source in struvite precipitation of this process
(Petruzzelli et al., 2003). A patent on selective IX of N, K, and P with struvite recovery
from the regeneration eluates is held by Liberti et al. (1984).
A list of PO4-P selective resins from the literature is shown in Table 1. Resins that
selectively remove PO4-P are either polymeric ligand exchange resins, impregnated with
metal nanoparticles, or a combination thereof (Sengupta and Pandit, 2011). Polymeric
ligand exchange resins attract Lewis bases such as PO4-P (Zhao and Sengupta, 1998).
Zhao and Sengupta (1996) first developed copper loaded resin that was prepared by
passing 1N HCl, 1N NaOH, and then 500 mg/l Cu2+
solution at a pH of 4.5 through the
resin until saturation; the resin was considered saturated when effluent Cu2+
was equal to
influent; this resin was patented in 2000 (Sengupta et al., 2000; Zhao and Sengupta,
1998). The resin, Dow-Cu, was shown to treat just over 1,000 bed volumes (BVs) of
wastewater containing concentrations of 4 mg/l P, 56 mg/l HCO3-, 100 mg/l SO4
-2, 71
mg/l Cl-, and 93 mg/l NO3
- (Zhao and Sengupta, 1998). However, using secondary
effluent that contained total organic carbon (TOC), resin breakthrough occurred at about
700 BV with 2.2 mg/l P in the influent. Zhao and Sengupta (1998) recovered 96% of
PO4-P from Dow-Cu in the regenerant within 8 BV using 6% NaCl (pH=4.3). This resin
was then used in a pilot plant by Petruzzelli et al. (2003). The pilot IX column was

26
treating secondary effluent with a P concentration of 4 mg/l; the column successfully
removed PO4-P for 150 BV at a flow rate of 10 BV/h. Regeneration was successful in
concentrating P 130 times using the chemical mix from Table 1; a total of 3 BV
regenerant was required (Petruzzelli et al., 2003). Performance of the copper-loaded resin
decreased by 10-15% after 3 months of continuous operation (Petruzzelli et al., 2004).

27
Table 1: Phosphate selective IX resin literature
Citation Media Experiments Sample Regenerant
Blaney et al.,
2007
HAIX Column,
regeneration
Synthetic, secondary
wastewater
2% NaCl +
2% NaOH
Kumar et al.,
2007
Dow-Cu &
HAIX
Column,
regeneration
Synthetic,
Membrane
bioreactor RO
concentrate
6% NaCl,
pH=4.3
Martin et al.,
2009
HAIX Column,
regeneration
Final effluent w/
precipitation or w/
trickling filter
2% NaCl +
4% NaOH
Martin et al.,
2013
HAIX Column Final effluent w/
trickling filter,
groundwater + P
N/A
O’ Neal and
Boyer, 2013
HAIX Batch,
regeneration
Synthetic, urine,
diluted urine
2% NaCl +
2% NaOH
Pan et al.,
2009
HFO-201 Batch,
column,
regeneration
Synthetic, pesticide-
mfg effluent
5% NaOH +
5% NaCl
Petruzzelli et
al., 2003
Dow-Cu Column,
regeneration
Synthetic 1 M NaCl,
pH=4.3
Sendrowski
and Boyer,
2013
HAIX Batch Urine and
hydrolyzed urine
N/A
Sengputa and
Pandit, 2011
HAIX,
Dow-HFO, &
Dow-HFO-Cu
Batch,
column,
regeneration
Synthetic 2.5% NaCl
+ 2% NaOH
Wu et al.,
2007
Lanthanum
loaded resin
Column,
regeneration
Synthetic, seawater 6 M NaOH
or 6 M NaCl
Zhao and
Zengupta,
1996
Dow-Cu Column,
regeneration
Secondary
wastewater
6% NaCl,
pH=4.3
Zhao and
Sengupta,
1998
Dow-Cu Batch,
column,
regeneration
Secondary
wastewater
6% NaCl,
pH=4.3
Zhu and Jyo,
2005
Zirconium
loaded resin
Column,
regeneration
Synthetic, river
water, seawater
0.5 M
NaOH
Four types of resin loaded with iron have been reported in the literature: HFO-
201, hydrated ferric oxide (HFO) impregnated resin (DOW-HFO) and hybrid anion
exchanger (HAIX) which is also known as LayneRT™
, and Cu2+
loaded and HFO

28
impregnated resin (DOW-HFO-Cu). DOW-HFO is prepared by adding 10 g of virgin
resin to 1 L of solution containing 2 g/L Fe in the form of FeCl3*6H2O; this resin was
patented in 2007 (Sengupta et al., 2007; Sengupta and Pandit, 2011). The resin is mixed
for 1 hr, stepwise increased in pH to 8 over 3 hr by 1N NaOH and then slowly mixed for
24 hrs; finally the resin is rinsed multiple times and dried for 24 hr at 45 °C (Sengupta
and Pandit, 2011). LayneRT™
is available commercially through Layne Christensen
Company (The Woodlands, TX). In tests run with reverse osmosis (RO) concentrate
containing 12 mg/l P, breakthrough of LayneRT™
and Dow-Cu resin occurred after about
200 and 40 BV, respectively (Kumar et al., 2007). Work by Martin et al. (2009) showed
that LayneRT™
was only capable of treating 10 BV to an effluent P concentration of less
than 0.1 mg/l when the influent wastewater contained 4.7 mg/l P. This may be a result of
the excess concentration of nitrate, 157 mg/l, and other ions (Martin et al., 2009).
However, in later work by Martin et al. (2013), the resin was more effective as column
size increased, treating 675 BV of 4.7 mg/l P wastewater to less than 0.1 mg/l P. In recent
work by Sengupta and Pandit (2011), a resin loaded with an Fe and Cu (DOW-HFO-Cu)
method, was observed to treat about twice as much wastewater as the LayneRT™
resin
with the same level of removal efficiency. In this study, the LayneRT™
column treated
about 625 BV of water containing P and SO4-2
concentrations of 2.75 and 20 mg/l,
respectively (Sengupta and Pandit, 2011). Regeneration of LayneRT™
was accomplished
in less than 10 BV, while it required almost 15 BV to regenerate DOW-HFO-Cu
(Sengputa and Pandit, 2011).

29
1.8 Struvite Precipitation Review
Precipitation of NH4+ and PO4
-3 is possible with the addition of magnesium to
form struvite pellets. Struvite is solid magnesium ammonium phosphate (MgNH4PO4).
This chemical is formed in equimolar amounts of P and N; this ratio is equivalent to 14
mg/l NH4-N for 31 mg/l PO4-P. The two parameters most critical to struvite precipitation
are the molar ratio of Mg:P:N and the pH (Britton et al., 2005). A parameter that
accounts for pH and ion concentrations is the supersaturation ratio (SSR), which
describes the mixture of wastewater, MgCl2, and NaOH (Britton et al., 2005). Struvite
precipitates quicker at pH greater than 8.5; however, calcium hydroxide precipitates
inhibit struvite formation (Mavinic et al., 2007). Addition of excess magnesium and
seeding of struvite crystals can be used to provide the same results at lower pH’s (Hao et
al., 2013). In pilot scale testing, 80% P removal was found at pH’s greater than 8.4 and
50% P removal was found at pH near 7.7 (Britton et al., 2005). Higher pH values are
recommended to maintan greater than 80% removal; however, some pilot studies have
resulted in greater than 95% P removal at pH=7.6 (Adnan et al., 2003). Typically sodium
hydroxide (NaOH) is used to raise the pH and magnesium hydroxide (Mg(OH)2) or
magnesium chloride (MgCl2) is used as the magnesium source. Magnesium is typically
dosed at a molar ratio of 1.1-1.5:1 Mg:P (Bhuiyan et al., 2008) (Mavinic et al., 2007).
The advantage of precipitation of P as struvite is that it can be used beneficially as a
slow-release fertilizer (Forrest et al., 2008; Munch and Barr, 2001).
Solids dewatering supernatant is the focus for most research and processes
utilizing struvite precipitation (Bhuyian et al., 2008). This stream has a low volume and

30
high concentration of PO4-3
and NH4+ (Munch and Barr, 2001). However, since the molar
concentration of NH4+ is much greater than PO4-P (10-25:1 N:P), most of the NH4
+
remains in the liquid phase unless a P source such as phosphoric acid is added as a
supplement (Mavinic et al., 2007). Also, sidestream precipitation could only supplement
a nutrient removal process in the mainstream, which is necessary to meet discharge
permits. This precipitation reaction could be performed in the AnMBR permeate;
however, due to the high volume of water and low nutrient concentrations, the chemical
costs for pH adjustment and magnesium addition would not be economically beneficial.
Therefore this process is suitable for SDS and the concentrated IX regenerant produced
from the PO4-3
and NH4+ IX columns. The regenerant pH should be considered when
determining media for IX as excess amounts of pH adjustment chemicals could be
necessary in certain situations.
No studies have reported the efficiency of struvite precipitation in AnMBR
permeat; however, previous research has been completed using struvite precipitation in
regeneration eluate from aerobically treated municipal wastewater. The first process
developed for IX and struvite recovery is called REM-NUT (Petruzzelli et al., 2004).
This process includes two IX columns treating secondary clarifier effluent, one with
LayneRT™
for removal of PO4-3
and one with clinoptilolite for NH4+ removal.
Theoretically with this process, about 10% of the zeolite regenerant is added to the
LayneRT™
regenerant along with MgCl2 and NaOH to precipitate struvite; however, no
precipitation experiments were reported (Petruzzelli et al., 2004). Using regenerant from
anion exchange columns, Sengupta and Pandit (2011) precipitated struvite by adding
MgSO4 and NH4Cl. Greater than 90% of the PO4-3
was recovered as a high-value

31
fertilizer; resins regenerated in this study included the following: LayneRT™
, DOW-
HFO, and DOW-FeCu (Sengupta and Pandit, 2011). Another study using DOW-Cu IX
treating RO concentrate from municipal wastewater treatment, found almost 100% P
precipitation at a pH of 9 (Kumar et al., 2007). In this test, NH4+ and Mg
2+ salts were
added in a molar ratio of 1.5:1:1 Mg:P:N. One study combined the regenerant from
clinoptilolite with LayneRT™
or DOW-HFO-Cu; however, the cation column treated
septic tank effluent and the anion columns treated synthetic wastewater (Sengupta, 2013).
Greater than 85% of N and P were recovered in the precipitate with no Cu or Fe
(Sengupta, 2013). The precipitates from Sengupta (2013) contained 16.4% P and 2.4% N;
however, pure struvite contains 14.9% P and 6.6% N.
Struvite is a slow-release fertilizer and has a low solubility at neutral pH values
which means that it does not provide excess N and P to plant roots (Shu et al., 2006).
Struvite has a high value as an agricultural fertilizer, estimated at $0.1-0.15/lb P (Munch
and Barr, 2001; Uysal et al., 2010). One kg of struvite per day as a PO4-P fertilizer is
enough for 2.6 ha of agricultural land (Shu et al., 2006). Dry matter yield and P uptake
were shown to be similar between plants fertilized with synthetic struvite, recovered
struvite, recovered calcium phosphates, and commercial grade calcium phosphates
(Johnston and Richards, 2004). The value of struvite may be dependent upon soil type as
the Mg:Ca ratio is important in determining oxygen availability and drainage (Muster et
al., 2013).

32
1.9 Ammonia Distillation and Absorption Review
A process developed in 1998 for NH3 removal and recovery is the use of vacuum
distillation with absorption of the NH3 gas in acid (USEPA, 1998). Traditionally, NH3
removal by transfer to the gas phase is accomplished through air or steam stripping;
however, this method can require air to liquid ratios of 900:1 (Orentlicher et al., 2007).
Vacuum distillation of NH3 relies on a tank under negative pressure in which high
concentration NH3 wastewater at an elevated pH and temperature (90-110 °F) is sprayed
into the tank (Orentlicher et al., 2007). Optimum pH for NH3 transfer is 10.8-11.5; at this
pH essentially no NH3-N is in the aqueous NH4+ form (USEPA, 2000a). Vacuum
distillation requires less space, lower temperatures, and about 6 times less energy than
traditional NH3 stripping (Orentlicher et al., 2007; Orentlicher, 2012). Streams typically
treated with this process such as anaerobic digester supernatant in municipal wastewater
and livestock waste have NH3-N concentrations of 500 mg/l or greater; traditional NH3
stripping is only economical at concentrations less than 100 mg/l (Orentlicher et al.,
2007; USEPA, 2000a). When using vacuum distillation to remove 500-1000 mg/l NH3-N
streams, effluent NH3-N concentrations are less than 100 mg/l (CASTion, 2008).
Ammonia gas from the vacuum distillation step is absorbed in an acid as a
recoverable product. Typically H2SO4 is used to absorb the NH3 gas in a solution
containing 40% (NH4)2SO4 (USEPA, 1993). However, water can be used as the
absorption solution to yield at 1-30% NH4+ solution (USEPA, 1980). About 90%
recovery is expected with absorption towers (USEPA, 1980). The (NH4)2SO4 or aqueous
NH4+ solution can be sold as an agricultural fertilizer. (NH4)2SO4 has value as a

33
commercial grade fertilizer; however, (NH4)2SO4 has an acidifying effect on the soil that
farmers do not desire (Evans, 2009). The 2011 prices paid for NH4NO3, (NH4)2SO4, and
aqueous NH4+ are 479, 423, and 249 $/ton, respectively (Orentlicher, 2012). Other
options for acid used to recover NH3 include: HNO3, HCl, and H2CO3 (requires passing
CO2 through water to reduce pH). However, NH4NO3 is an explosive hazard and the
value of NH4Cl and NH4HCO3 is low.

34
2 Materials and Methods
2.1 Research Questions and Hypotheses
Batch and column ion exchange testing was conducted for removal and
concentration of PO4-3
and NH4+. Batch tests were conducted to determine parameters
that would consume too much time with columns and column testing was conducted to
simulate real operating conditions. The present study used wastewater from South Shore
Water Reclamation Facility (SSWRF) in Milwaukee, WI as column influent; the
wastewater was dosed with N and P to obtain wastewater similar to AnMBR permeate.
Regenerant with concentrated N and P was utilized for precipitation of struvite. Each unit
process was evaluated individually and then a systems evaluation was conducted to
determine the effect of a single process on downstream processes.
2.1.3 Phosphate Ion Exchange Research Questions
A few PO4-P -selective media have been developed and tested in the literature,
including: Dow-Cu, Dow-HFO, Dow-HFO-Cu, activated alumina and LayneRT™
(Hano
et al., 1997; Sengupta, 2013; Zhao and Sengupta, 1998). Although these materials have
been used in various studies, Dow-HFO-Cu has not been tested in real wastewater.
Neutral pH regenerant has not been tested in the literature; either acidic or basic solutions
are used (Kumar et al., 2007; Sengupta and Pandit, 2011; Zhao and Sengupta, 1998).
Metals concentration and pH of regeneration eluate have not been determined in the
literature. Batch testing was conducted to determine relative exchange capacity of the

35
various anion media. Column testing was conducted in order to determine realistic
operating conditions for PO4-P IX. The outcomes to be tested and hypotheses for each
test are listed below:
1. What is the percent removal of P in synthetic solution batch tests utilizing various IX
media?
a. Hypothesis: Removal of P will be greatest for LayneRT™
or Dow-HFO-Cu
2. What is the removal capacity (g P/LIX bed) and effluent PO4-P concentration for the
various IX media in SSWRF secondary effluent dosed with P?
a. Hypothesis: Resins that removed the most P in batch tests will perform
similarly in column testing, but may be slightly different due to a change in
water-solid interaction.
b. Hypothesis: Effluent from PO4-P IX will contain PO4-P<0.1 mg/l.
3. What are the pH, metals concentration, and PO4-P concentration of regenerant from
each media?
a. Hypothesis: Regenerant pH will change across the IX bed as a result of OH-
sorption onto the media and PO4-P release and H+ uptake to form H2PO4
-2 or
HPO4-.
b. Hypothesis: Significant concentrations of metals such as Fe2+
and Cu2+
in the
regeneration eluate are expected as a result of release from the media.
4. Can the media be regenerated with a neutral pH solution to reduce chemical
consumption during struvite precipitation or solution disposal?
a. Neutral pH regenerant can be used for DOW-HFO and DOW-HFO-Cu as
HFO particles are formed at a neutral pH.

36
2.1.2 Ammonium Ion Exchange Research Questions
Zeolite is shown to selectively removed NH4+ in the presence of other cations
(USEPA, 1993). Zeolite has been studied for NH4+ removal from secondary wastewater,
solids dewatering supernatant, source separated urine, and other solutions (Beler-Baykal
et al., 2011; Cooney and Booker, 1999; Jorgensen and Weatherley, 2003; Wirthensohn et
al., 2009). Optimum NaCl and NaOH regenerant concentrations have also been studied
(Guo et al., 2013; Koon and Kauffman, 1975). Research shows that zeolite attrition
occurs with high pH regeneration (Koon and Kauffman, 1975). In order to directly
compare a variety of NaCl and high pH solutions for regeneration, long-term batch
studies to determine the various regenerants’ effect on NH4-N removal capacity were
conducted. Column testing of zeolite was conducted to determine the removal of NH4-N
in SSWRF wastewater and the characteristics of zeolite regeneration eluate. The
following questions were investigated:
1. What is the optimal NaCl concentration and pH for NH4+ desorption and subsequent
IX?
a. Hypothesis: Regeneration at high pH with x% NaCl will be more effective in
desorption than regeneration at neutral pH with x% NaCl.
b. Hypothesis: There will be a pH of regenerant at which N removal capacity in
subsequent IX cycles will decrease in comparison to neutral pH regeneration.
2. How much NH4-N can be removed from SSWRF secondary effluent dosed with N
using zeolite and what is the effluent quality?

37
a. Hypothesis: Around 130 BV of secondary wastewater can be treated with
zeolite before breakthrough; however, the exact amount will be depedent upon
K+, Ca
2+, and Mg
2+ concentration.
b. Hypothesis: Effluent from NH4-N IX will contain NH4-N<1 mg/l.
3. What are the characteristics of zeolite regeneration eluate?
a. Hypothesis: There will be significant concentrations of NH4-N, K+, Ca
2+,
Mg2+
, and Na+. The pH of the solution will be similar to the influent since OH
-
ions are not exchanging with the media.
2.1.3 Struvite Precipitation Research Questions
Struvite precipitation has been well-defined for P removal in solids dewatering
supernatant and source-separated urine (Bhuiyan et al., 2008; Forrest et al., 2008; Maurer
et al., 2006). In addition struvite precipitation from the combination of anion and zeolite
regenerant has been proposed (Petruzzelli et al., 2004; Sengupta, 2013). However, the
work by Sengupta (2013) is currently the only published data combining regenerants
from both IX media to precipitate struvite. Synthetic solutions are treated by anion media
and septic effluent is treated by zeolite media in Sengupta (2013); therefore, exchanged
ions may differ and subsequently regenerant characteristics may differ in comparison to a
system treating secondary effluent dosed with N and P. Additionally, large volumes of
regenerant were required, greater than 20 BV, likely diluting the N and P. Greater than
85% removal of N and P were obtained from the combination of LayneRT™
or Dow-
HFO-Cu regenerant with zeolite regenerant; solids were claimed to be high purity
struvite, but there is only 33% as much N in the solids as there would be in pure struvite

38
(Sengupta, 2013). The present work treated the same wastewater with the anion and
cation column and utilized a small volume of neutral pH solution to regenerate the iron
and copper loaded resin. Struvite precipitation of the combined regenerants was tested in
batch mode and the following questions were answered:
1. What percentage removal of N and P can be accomplished with struvite precipitation
of anion and zeolite regeneration eluates?
a. Hypothesis: Provided there are enough cations such as Mg2+
in solution,
greater than 85% of P will be removed. Removal of N will be dependent upon
the amount of P removed as MgNH4PO4 versus other solids.
2. What impurities are found in the recovered solids?
a. Hypothesis: Given that Ca2+
, K+, Fe
2+, and Cu
2+ potentially leach or desorb
from the zeolite or anionic media, a number of non-MgNH4PO4 solids will
form. Given these cations, there is the potential to form Ca(OH)2, Ca3(PO4)2,
hydroxyapatite, MgKPO4, Fe(OH)2, vivianite, and Cu(OH)2.
2.2 Selection and Preparation of Ion Exchange Materials
Clinoptilolite was selected as the media for NH4+ exchange due to its preference
for NH4+ in the presence of other cations (USEPA, 1993). Clinoptilolite, (St. Cloud
Zeolite, Tucson, AZ, USA) in the sodium aluminosilicate form had a cation exchange
capacity of 1.85 meq/g. Preparation of clinoptilolite to saturate the surface with Na+ ions
was accomplished through the following steps: rinse 25 g of material 3x to remove fine
particles, soak in 1% NaCl on shaker table at 150 rpm for 2 days, remove NaCl solution
and rinse 2x with deionized (DI) water, dry material at 103 °C for 24 hours. Preparation

39
of clinoptilolite is similar to methods reported by Guo et al. (2013) and Jorgensen and
Weatherley (2003).
In order to test a non-specific exchange resin, commercially available P selective
resin, and laboratory prepared P selective resins, the following media were purchased:
Dowex WBA-2 (Dow Chemical Co., Midland, MI, USA), Dowex M4195 (Dow
Chemical Co., Midland, MI, USA) and LayneRT™
(Layne Company, Mission Woods,
KS). Dow WBA-2 is a non-specific weak-base anion exchanger with a 1.7 eq/L exchange
capacity and an average particle size of 0.55 mm. The shipping density of this resin is
640 g/L. This resin was utilized to examine the competitive uptake between PO4-P and
other anions in a general resin versus a PO4-P selective resin. Regeneration of Dow-
WBA-2 is typically performed with 2-4 BV of 2-5% NaOH (DOW, 2013). Dowex
M4195 is an anion exchange resin with tertiary amine groups with a particle size of 0.3-
0.841 mm and a bulk density of about 670 g/L. This resin is used as a base resin to
develop chelating resins; loading of metals may include iron, copper, aluminum, or some
combination thereof. Finally, LayneRT™
is an iron-loaded resin selective towards PO4-P
and is regenerated with an equal mixture of NaCl and NaOH. Density of LayneRT™
is
790-840 g/L with a particle size of 0.3-1.2 mm (Sengupta, 2013).
2.3 Ammonium Ion Exchange Batch Testing
Batch testing of NH4+ removal using clinoptilolite was conducted with NH4
+ only
solution and a mixed cation solution, both containing about 40 mg/l NH4-N. Bottles used
for batch testing were completely filled with 128 mL of solution, leaving no headspace
for ammonia volatilization. The concentration of zeolite was 10 g/l or 1.28 g in the 128

40
mL bottles and they were placed on a shaker table at 150 rpm. NH4-N only solution was
made by adding 1.53 g of NH4Cl to 1000 mL MilliQ (0.22μm pore size) water and then
diluting the solution by a factor of 10; the target NH4-N concentration was 40 mg/l. To
determine the required test duration, batch equilibrium was measured by setting up two
bottles for each day of analysis. One bottle contained zeolite and the other did not as a
control to account for ammonia absorption to the glass. Analysis was conducted after 1,
2, 3, 4 and 6 days. Once the percent change, as defined by Equation 3, was less than 5%,
equilibrium was assumed to be reached.
( )
( ) Equation (3)
Where,
Sorption = mg NH4-N removed/g zeolite
n = day
t = time difference between samples (days)
The time to equilibrium was utilized to conduct all further zeolite batch tests.
NH4-N only batch testing was conducted using the chemical solution, rotation
speed, equilibrium, and media concentration described previously. After the equilibrium
time was reached, solution was analyzed for NH4-N concentration and then the liquid was
decanted while retaining the zeolite. Next, regenerant was added to the bottles for 2
hours; the solution was sampled, removed, and the zeolite was rinsed 2 times to remove
excess salts. The batch testing process is depicted in Figure 6.

41
Figure 6: The steps to NH4-N batch testing
A variety of regenerants based upon a literature review were developed in order to
determine the effect of each solution on subsequent IX capacity. Triplicate bottles were
prepared for each regenerant condition. Five regenerant solutions were tested for 3 IX
cycles, while two more regenerant solutions were tested for 7 IX cycles. Solutions tested
for 3 cycles include the following: 2% NaOH, 2% Ca(OH)2, 10% NaCl, 5% NaCl, and
0.5% NaOH. The most effective neutral and high pH regenerants were tested for 7 IX
cycles; these regenerants were 8% NaCl and 7.5% NaCl + 0.5% NaOH. Evaluation of the
results was based on percent removal of NH4-N during IX and regeneration NH4-N
concentration.
After NH4-N only testing, mixed cation IX batch testing was conducted in order
to determine competitive uptake of cations. Regenerant solution utilized were revised
based on results from NH4-N only IX testing. The same zeolite dose, solution volume,
and exchange time were used in the mixed cation batch tests. Mixed cation solution

42
contained 1.53 g NH4Cl, 0.38 g KCl, 5.08 g NaCl, 1.38 g CaCl2, and 2.1 g MgCl2*6H2O.
This solution was then diluted by a factor of 10 with target concentrations of 40 mg/l
NH4-N, 20 mg/l K+, 50 mg/l Ca
2+, 25 mg/l Mg
2+, and 200 mg/l Na
+; these concentrations
were based on typical primary effluent concentrations (Metcalf and Eddy, 2003).
Regeneration solutions selected for this test included 8% NaCl, 7.5% NaCl (pH=12),
0.1% NaOH, and 0.1% Ca(OH)2. Testing was carried out for 5 IX cycles and results were
analyzed based on the same two parameters discussed in the NH4-N only tests as well as
the separation factor. The separation factor describes the preference of a media for
exchange of one ion over another. Knowing preference for exchange of NH4+ over other
cations will determine which cations should be considered when designing the amount of
wastewater an IX column will handle.
2.4 Phosphate Ion Exchange Batch Testing
In addition to the two resins purchased in ready-to-use form, six chelating anionic
resins were created using previous literature and novel methods. The base resin for all six
chelating resins was Dowex M4195 (DOW Chemical Co., Midland, MI). A list of resins
is given in Table 2.
Table 2: Chelating phosphate selective resins
Name Dow-Cu Dow-
HFO
Dow-
FeCu
Dow-
HFO-Cu
Dow-
NAB-Cu
Dow-Al
Metal
Solution
Utilized
CuCl2 FeCl3 CuCl2
&
FeCl3
CuCl2 &
FeCl3
CuCl2 Al2(SO4)3

43
The first resin undergoes acid and base treatment followed by copper loading; this resin is
denoted DOW-Cu. The protocol for loading was derived from previous work where the
resin was prepared in column mode (Zhao and Sengupta, 1996). In a 1 L bottle, 10 g of
Dowex M4195 was mixed with 100 mL of 1 N HCl and placed on a shaker table for 2
hours. The acid was removed, the resin rinsed twice with DI water and then 1 L of 1 N
NaOH solution was added to the bottle of resin. This mixture was also placed on a shaker
table for 2 hours, then it was removed, and the resin was rinsed twice with DI water.
Finally, 1 L of 500 mg/l Cu2+
solution (1.34 g CuCl2*2H2O in 1 L DI water) was added to
the bottle. After 24 hours, the Cu2+
solution was decanted and the resin was rinsed twice
with DI water and allowed to air dry at 35 °C for 48 hours. Another resin, loaded with
ferric chloride (DOW-HFO) was prepared using methods previously discussed by
Sengupta and Pandit (2011) with the exception of drying the resin at 35 °C instead of 45
°C. A resin combining the previous two methods was produced by first preparing Dowex
M4195 with the ferric chloride method and then the cupric chloride method; this resin
was denoted as DOW-FeCu. The iron and copper loaded resin method of preparation was
revised to be similar to that described by Sengupta (2013); this resin was called DOW-
HFO-Cu. Ten grams of Dowex M4195 was added to 40 g FeCl3*6H2O in 3 L of MilliQ
water. The pH was adjusted to 8 over a period of 4 hours using NaOH tablets. The resin
was then stirred for 24 hours followed by decanting of the iron solution and rinsing of the
resin with DI water to remove all iron precipitates. Solution containing 1.33%
CuCl2*5H2O was added to the bottle of resin and allowed to stir for 24 hours. The copper
solution was decanted and the resin was rinsed with DI water and allowed to dry at 35 °C
for 24 hours.

44
Two of the six metal-loaded resins were prepared by novel methods. The first was
copper loaded Dowex M4195 (Dow-NAB-Cu) without acid and base pretreatment. The
purpose was to determine if the extreme pH solutions used in preparation of DOW-Cu
were necessary. This was accomplished by soaking 10 g of Dowex M4195 in 1 L of 500
mg/l Cu solution formed from 1.34 g CuCl2*2H2O in 1 L MilliQ water. The resin and
solution mixture was placed on a shaker table for 24 hours, then the solution was
discarded, the resin was rinsed twice with DI water, and allowed to dry at 35 °C for 48
hours. The next resin was Dowex M4195 loaded with aluminum sulfate (DOW-Al) by a
method derived from a patent for loading an anion resin with iron (Sengupta and Cumbal,
2007). Ten grams of Dowex M4195 was added to 1 L of 500 mg/l KMnO4 solution. This
mixture was allowed to stir for 30 minutes and then the solution was discarded and the
resin was rinsed twice with DI water. Next 1 L of 2% Al2(SO4)3*7H2O (alum) was added
to the bottle of resin and allowed to stir for 24 hours. After the given time period, the
mixture was passed through a 45 μm sieve to remove all aluminum precipitates and then
the resin was allowed to dry for 48 hours at 35 °C.
PO4-P -only batch testing was conducted using the following media: Dowex
WBA-2, Dowex M4195, LayneRT™
and weakly acidic activated alumina (AA) (Sigma
Aldrich, Milwaukee, WI, USA). PO4-P solution was prepared by adding 0.45 g of
NaH2PO4*H2O to 1 L of MilliQ water. This solution was then diluted by a factor of 10 to
obtain a solution with a PO4-P concentration around 3 mg/l. Media were dosed into 128
mL of solution at a concentration of 10 g/l; bottles were placed on a shaker table at 150
rpm for 7 days. Triplicate bottles were set up for each media and triplicate bottles without
media were run to account for PO4-P absorption to the glass. After 7 days, the solution

45
was analyzed for PO4-P concentration and the media were regenerated with 6% NaCl at
pH=10 for 2 hours. Percent PO4-P removal during IX and regenerant PO4-P concentration
were determined.
After PO4-P only testing, the same media were tested using a mixed anion
solution. Solution volume, rotation speed and media dosing remained the same, while the
IX time was reduced to 4 days to match zeolite batch testing. The targeted concentrations
in mixed anion solution were 3.9 mg/l PO4-P, 150 mg/l HCO3-, 5 mg/l SO4-S, 5 mg/l S
2-,
and 50 mg/l Cl-. Concentrations were selected based on a literature review of typical
wastewater influent and AnMBR permeate characteristics (Gimenez et al., 2011; Metcalf
and Eddy, 2003; Yoo et al., 2012). The following mass of chemicals was added to the 10
times concentrated solution: 0.22 g K2HPO4, 2.07 g NaHCO3, 0.22 g Na2SO4, 0.12 g
NaSH*nH2O (74% NaSH), and 0.82 g NaCl. Final concentration of each anion was
measured to determine each media’s affinity towards specific anions. Regenerants used in
the mixed anion tests were dependent upon the material. A solution of 5% NaCl (pH=10)
was used for Dowex WBA2 and Dowex M4195 while 2% NaCl+2% NaOH was used for
LayneRT™
based on a literature review (Blaney et al., 2007). Regenerant for AA was 2%
NaOH which was based on previous work in the literature (Ames, Jr. and Dean, 1970).
Regeneration was conducted for 2 hours with 2 DI rinse cycles following the regenerant
analysis. Data analysis included percent removal during IX for anions and the
concentration of PO4-P in the regenerant.
The final batch test was a high-concentration (spiked) PO4-P test to determine the
difference in exchange capacity of various resins. Media utilized for this test included the
following: AA-neutral, AA-basic, Dow-Cu, Dow-NAB-Cu, DOW-HFO, LayneRT™
,

46
DOW-FeCu, and DOW-Al. Media was dosed at 10 g/l in 128 mL of 100 mg/l PO4-P
solution. PO4-P solution was created by adding 1.124 g K2HPO4 to 2 L of MilliQ water;
the pH of this solution was about 8.1. The bottles were placed on a shaker table at 150
rpm for 4 days. All bottles were run in triplicate and controls were run to account for
PO4-P absorption to the glass. PO4-P concentration and pH at the end of the test were
measured. Percent removal of PO4-P was calculated using the results from the controls.
After completion of IX with spiked PO4-P batch tests, regeneration was conducted
in order to determine the potential for recovery. Solutions contained various
concentrations of NaCl and NaOH based either literature reported solutions or a reduction
in chemicals in comparison to the literature. Solutions used in the literature can be found
in Table 1 and regenerants used for the spiked P test are displayed in Table 3.
Table 3: List of anion media and regenerants used in PO4-P IX batch testing
Media AA
neutral
AA
basic
LayneRT™
Dow-
Cu
Dow-
NAB-
Cu
Dow-
HFO
Dow-
FeCu
Regenerant 5% NaCl
pH=7.5
5% NaCl
pH=9.5
2% NaCl
+
2% NaOH
5%
NaCl
pH=4.3
5%
NaCl
pH=4.3
5%
NaCl
pH=8
5%
NaCl
pH=8
Regeneration was performed with 128 mL of solution and the bottles were placed on a
shaker table at 150 rpm for 4 hours. Final pH and PO4-P concentration were measured;
percent desorption of PO4-P was calculated as the comparable result. The PO4-P batch IX
and regeneration steps are depicted in Figure 7.

47
Figure 7: The steps to PO4-P batch testing
2.5 Column Testing
The 3 media with greatest PO4-3
exchange in batch studies were tested in column
mode, LayneRT™
, Dow-Cu, and Dow-FeCu. Testing the materials in columns was
important as full-scale systems would be operated in columns and the solution-solid
contact is different in columns compared to batch tests and as a result, the exchange
kinetics are different. Anion column testing was conducted using secondary effluent from
SSWRF. The secondary effluent was dosed with (NH4)2HPO4 and NH4Cl to
approximately 4-6.5 mg/l PO4-P and 30-35 mg/l NH4-N to simulate anaerobic membrane
permeate from municipal wastewater treatment. The sample was filtered using a 1.5 µm
filter. Anion concentrations measured in the sample include PO4-P, Cl-, SO4-S, S
2-, NO3-
N, and bicarbonate. The column, which was 2.5 cm in diameter, was filled with PO4-P
exchange media to a 7.5 cm height. Media volume was approximately 35-37 mL and
exact volume was measured and used in calculations. Samples were stored at 3 °C for up

48
to 2 months. Each day the sample was prepared by filtration, equilibration to 22 ºC and
then added to the influent tank. Flow rate through the system was maintained at 3 Lpd or
3.4 BV/hr. This flow rate provided an empty bed contact time (EBCT) of 17.6 min.
Contact time was greater than previous work with EBCTs of 6-8 min in order to ensure
that multiple samples would be collected during breakthrough with 2 hr sampling
intervals (Kumar et al., 2007; Petruzzelli et al., 2003. Influent and effluent pH were
recorded for each column test. A water head of about 3 inches was maintained above the
IX media in order to eliminate short circuiting of the system and disruption of the bed due
to influent droplets. Effluent was directed to a valve that was opened every 2 hours for a
period of 20 mins. When this valve was open, sample was sent to a fraction collector
(CF-1, Spectrum Chromatography, Houston, TX) and when the valve was closed, the
effluent was discarded. Twelve samples were measured each day for PO4-P and 3 – 5
samples from the test were measured for metals. The IX column system is displayed in
Figure 8.

49
Figure 8: Phosphate IX column testing apparatus
PO4-P discharge was calculated by fitting a curve to multiple sections of the effluent PO4-
P curve using Microsoft Excel and integrating the curve to obtain the area (mass of PO4-P
leaving the system). Exchanged P was calculated as influent mass minus effluent mass.
Clinoptilolite was used as the media in cation exchange column testing. Bed
volume of the mineral was 37 mL; the column diameter and height were 2.5 and 7.5 cm,
respectively. Effluent from the LayneRT™
column test was used as influent to the
clinoptilolite column. The sample was allowed to mix on a stir plate until reaching room
temperature, 20 °C; sample was stored at 4 ºC for up to 45 days. NH4-N was measured in
the sample prior to pumping the wastewater into the IX column. Metals including, Na+,
Water head
Media
Fraction
Collector
Influent
Timer
Solenoid Valve
Excess
Effluent

50
Mg2+
, Ca2+
, K+, and 16 others were measured in the sample; all cations measured are
listed in the analytical section. A water head of about 3 inches was maintained in the
column for the same reasons as during anion exchange. Using a peristaltic pump,
wastewater sample was pumped through the column at a rate of 3 Lpd or 3.4 BV/hr.
Effluent was collected just as with the anion exchange column. The pH of the influent
and effluent were recorded. Regression lines for multiple sections of the plot, effluent
NH4-N versus volume treated, were developed using Microsoft Excel and these curves
were integrated to determine the area (mass of NH4-N leaving the system). Exchanged
NH4-N was calculated as described for P in the previous section.
2.6 Column Regeneration
Regeneration of the anion columns was conducted following exhaustion of the
media’s exchange capacity. Different solutions were mixed for each of the resins;
LayneRT™
, DOW-Cu, and DOW-FeCu were regenerated with 2% NaCl + 2% NaOH,
6% NaCl (pH=4.3), and 6% NaCl (pH=8), respectively. Solution was passed through the
IX bed at a rate of 125 mL/hr or 3.4 BV/hr; as during IX, a water head of around 3 inches
was maintained above the media. Five mL of sample was collected continuously until
about 50 mL had passed and then sample was collected approximately after every 30 mL
of solution passed; PO4-P measurements were used to develop a curve of PO4-P
concentration versus BV passed. Regenerant sample was diluted 1/1000, 1/100 or 1/10
depending on the time of collection to enable sample quantification within a measureable
range. Once the regenerant concentration was below 10 mg/l PO4-P, the test was ended.
Total desorption of PO4-P was calculated by fitting regression lines to the regenerant

51
PO4-P concentration curve. Regenerant was preserved by collecting effluent in a bottle
during the first 7 BV for LayneRT™
and the first 4 BV for other resins since desorption
was negligible after 4 BV. Solution was preserved at 4 °C for struvite precipitation tests;
the pH of this solution was recorded and PO4-P concentration was measured.
Concentration of metals in the regenerant was measured as described in the analytical
section; ions of greatest interest were Al3+
, Fe2+
, and Cu2+
. After regeneration, the bed
was rinsed with 150 mL of MilliQ water and then air was pumped through the column to
remove all liquid to prevent metal leaching while the bed was not in operation.
Clinoptilolite was regenerated using 6% NaCl at a pH of 11. Flow rates and
operating conditions were the same as with the anion regeneration. Four mL of
regenerant sample was collected in a bottle containing 1 mL of 1% H2SO4 to prevent
ammonia volatilization; collection occurred in intervals of approximately every 10-30
mL. The sample was diluted 1/5000, 1/500 or 1/100 based upon the time of collection to
enable sample quantification within the detection range. Regression curves were
developed for effluent NH4-N versus BV passed in order to determine total desorption
and NH4-N concentration of the first 8 BV. Regenerant from the first 8 BV was preserved
by collection in a bottle and storage at 4 °C; the pH of this solution was recorded and
NH4-N was measured. Preservation of the regeneration eluate was conducted for later use
in struvite precipitation tests. Metals concentration in this regenerant was measured;
specifically Mg2+
, Ca2+
, K+, Na
+, Al
3+, and Fe
2+ were of interest. The clinoptilolite bed
was rinsed with 150 mL of DI water prior to running a second IX cycle.

52
2.7 Struvite Precipitation
Struvite precipitation was first conducted using laboratory grade chemicals.
Struvite containing NH4+ (N-struvite) and struvite containing K (K-struvite) were
precipitated. Struvite formed with K (MgKPO4) was precipitated as an alternative to
MgNH4PO4 to obtain data in the case of targeting K recovery instead of N. The goal was
to determine pH of minimum solubility and the requirements for ion molar ratios for K-
struvite; N-struvite precipitation was conducted for direct comparison to K-struvite.
Molar ratios of Mg:N:P and Mg:K:P were targeted at 1:1:1. For K-struvite precipitation,
90 mL of solution containing 2.32 g of MgCl2*6H2O and 0.61 g KCl per L was added to
10 mL of solution containing 1.14 g Na2PO4*H2O per L. Once the solutions were mixed,
pH was adjusted using 0.1 N NaOH and 0.1 N HCl. Seven Erlenmeyer flasks with a
range of pH from 8.1 to 13.3 were prepared with the mixture of solutions. Flasks were
placed on a shaker table at 150 rpm for 10 minutes and then the solids were allowed to
settle for 30 minutes. After the settling period, supernatant was sampled for measurement
of PO4-P, K+, and Mg
2+. Remaining sample was then filtered through a 0.45 μm glass
fiber filter. The filter was dried in an oven at 105 °C for 24 hrs and the mass of solids was
measured. N-struvite was precipitated with the same method except 0.44 g NH4Cl per L
replaced KCl. NH4-N and Mg2+
solution were added in a volume of 90 mL to the 10 mL
PO4-3
solution in order to obtain a 1:1:1 Mg:P:N molar ratio. Range of pH tested, pH
adjustment chemicals, reaction time and settling time were the same as with K-struvite.
Supernatant was sampled for PO4-P, NH4-N, and Mg. The solids were again filtered,
dried, and weighed.

53
Once pure solution tests had been performed, regenerants from column testing
were used for precipitation of struvite. Zeolite regenerant was used as the NH4-N source
and four anion exchange regenerants were tested as PO4-P sources for comparison.
LayneRT™
, DOW-Cu column run 1 (DOW-Cu 1), DOW-Cu column run 2 (DOW-Cu 2),
and Dow-FeCu regenerants were used (as described in section 1.4 Nutrient Recovery
Scheme). PO4-P was measured in the anion regenerants and NH4-N was measured in the
zeolite regenerant. Triplicate precipitation tests were run for each anion regenerant in 125
mL Erlenmeyer flasks. Anion regenerant was added in a volume of 40 mL for LayneRT™
precipitation flasks and 30 mL was added to DOW-Cu and Dow-FeCu precipitation
flasks. A Mg solution containing 12.5 g MgCl2*6H2O per L was mixed and 11 mL was
added to LayneRT™
precipitation while 2.5 mL was added to the two DOW-Cu
precipitation tests; volume of Mg solution is based upon a 1:1 Mg:P molar ratio. Zeolite
regenerant was added in a volume of 16 and 3.3 mL to LayneRT™
and DOW-Cu
precipitation flasks, respectively, in order to obtain a 1:1 P:N molar ratio. For Dow-FeCu
precipitation, 1000 mg/l Mg2+
solution and zeolite regenerant were added in volumes of
12.5 and 20 mL, respectively. Once all three solutions were mixed, the pH was adjusted
to 10 using 0.1 N NaOH or 1 N HCl. There was a reaction period of 10 minutes at 150
rpm and a settling period of 30 minutes. Supernatant was collected for PO4-P, NH4-N and
metals analysis. Concentrations of Fe2+
, Cu2+
, Ca2+
, K+, Mg
2+, and Al
3+ were of interest
as they could be desorbed from the resins or zeolite and therefore in the precipitates. A
diagram of the full batch struvite precipitation test is shown in Figure 9.

54
Figure 9: Batch struvite precipitation steps
Mass of solids was measured by filtering the sample through a 0.45 μm glass fiber filter
and drying the solids at 105 °C for 24 hrs. Struvite solids were analyzed by nitric acid
digestion. Solids dried on glass fiber filters were placed in 100 mL of 0.5% nitric acid for
2 days. Sample was then collected for PO4-P, NH4-N, and metals analysis. Results were
compared to the mass balance utilizing initial and final solution ion concentration data.
2.8 Analytical Methods
Spectrophotometric methods were used for analysis of NH4-N, PO4-P, SO4-2
, Cl-,
and NO3-N. NH4-N was measured using the Phenate Method, standard method 4500-NH3
F, having a range of 0.1-1 mg/l NH4-N. (APHA et al., 1998). PO4-P was determined
using the ascorbic acid standard method (APHA et al., 1998); this method has a range of
0.006 to 0.8 mg PO4-P/l. TP was determined using the acid persulfate digestion method
followed by the ascorbic acid method for PO4-P. Mercuric thiocyanate method from

55
Hach (Loveland, CO) was utilized to determine chloride concentration; the test range was
0 to 25 mg/l Cl-. Sulfate was determined with a Hach method equivalent to USEPA
method 375.4 which can detect sulfate concentrations to a maximum of 70 mg/l.
Cadmium reduction method was conducted for nitrate-N analysis with a range of 0 to 0.5
mg NO3-N/l. Standard solutions of NH4-N, PO4-P, SO4-S, Cl-, and NO3-N were created
using NH4Cl, K2HPO4, Na2SO4, NaCl, and KNO3, respectively. Absorbance was
measured using Thermo Scientific (Waltham, MA) Genysys 20 spectrophotometer. An
ICP-MS (7700 Series, Agilent Technologies, Santa Clara, CA, USA) was used to
measure Ca, Mg, K, Na, Al, Fe, Cu, Be, Cr, Mn, Co, Ni, Zn, Se, As, Mo, Pb, Hg, Ag, and
Cd. Measurement of pH was conducted with a Thermo Scientific Orion 4 STAR pH
meter. Biochemical oxygen demand was analyzed using standard method 5210 B; the test
was performed in order to conclude whether or not biological fouling was an issue at a
given influent BOD concentration (APHA et al., 1998). Polyseed (The Woodlands, TX)
microbes were used as the seed for BOD tests. Seed dilutions of 10, 20, 25, and 30 mL
were used. Sample was added in a volume of 75 mL with 4 mL of seed. The bottles were
allowed to run to 20 days to estimate the ultimate BOD. Hach nitrification inhibitor
formula 2533 was used to eliminate nitrification. Alkalinity was determined using
standard method 2320 B (APHA et al., 1998).
2.9 Statistical Analysis
Standard deviation (std. dev.) assuming a normal distribution was calculated for
mixed cation batch test IX and regeneration. Standard deviation of triplicate tests was
used to create error bars for plots; this provides an estimate as to whether sample

56
averages are statistically similar or not. This allowed for determination of significant
differences between test conditions, specifically, the statistical difference between
regenerants.
In order to determine whether two data sets were statistically similar, a student’s
t-test was conducted. First an F-test was conducted with a null hypothesis that the
variances of two data sets were similar. The function “F.Test” in Excel was used to
calculate the F-test p-value. If the p-value was less than 0.05, the null hypothesis was
rejected and a type 3 t-test was conducted; if p was greater than 0.05, a type 2 t-test was
conducted. A student’s t-test was calcualted for mixed cation IX batch tests, spiked PO4-
P IX batch tests, and spiked PO4-P regeneration batch tests. The test was conducted for
comparison of two conditions, for example removal percent of NH4-N with 8% NaCl
versus 7.5% NaCl (pH=12). Statistics were calculated with a two-tailed distribution, type
2 or 3 t-Test using the “TTEST” function in Microsoft Excel. Two test conditions were
considered statistically different with 95% confidence if the resulting value was less than
0.05. If the value was greater than 0.05, the two conditions are considered not statistically
different.

57
3 Results and Discussion
3.1 Zeolite NH4+ Exchange and Regeneration Batch Testing
Equilibrium for NH4+ exchange was tested in order to ensure that batch testing
was conducted for a sufficient period to nearly reach equilibrium of solid and liquid
phase NH4+. If batch testing is ended prior to reaching equilibrium, results may vary and
not be accurate. Sorption equilibrium of NH4-N onto clinoptilolite was reached in 4 days
based on less than 5% change in total sorption between days as calculated using Equation
1. Figure 10 displays the sorption of NH4-N onto clinoptilolite versus time. More than
50% of the sorption occurred within the first day and by Day 4 there was little change in
total sorption. Although almost all total sorption was accounted for in the first 3 days,
equilibrium was assumed after 4 days in subsequent NH4-N batch tests.

58
Figure 10: Sorption of NH4
+ onto clinoptilolite
As sample passes through a column, the aqueous NH4-N concentration decreases
and therefore lower sections of the column are exposed to low NH4-N concentration.
Therefore, a sorption test was conducted to determine the ability of clinoptilolite’s to
remove NH4-N in solution at low NH4-N concentration. This test was conducted with 30
mL of solution, at 150 rpm and a contact time of 2 days. Sorption equilibrium appeared to
follow a second-order polynomial curve (see Figure 11). The media achieved NH4-N
concentrations of less than 0.1 mg/l in solution when the initial concentration was less
than 4.8 mg/l. Theoretically, the concentration of NH4-N will continually decrease from
the top of an IX column to the point of discharge. Therefore, according to this sorption
test, column effluent NH4-N concentrations could be less than 0.1 mg/l if the bed has
sufficient depth.
0
0.5
1
1.5
2
2.5
3
3.5
4
0 1 2 3 4 5 6
Cu
mm
ula
tive
So
rpti
on
(m
g N
H4-
N/g
clin
op
tilo
lite
)
Time (days)
Clinoptilolite=10 g/l Initial NH4-N=41 mg/l
Shaker Speed=150 rpm 1 Sample per point

59
Figure 11: Sorption of NH4-N onto zeolite vs final NH4-N concentration; initial NH4-
N labeled next to data point
3.1.1 Zeolite Ion Exchange Batch Testing with Ammonium Chloride
NH4-N only IX tests were conducted utilizing a variety of regenerants with
triplicate bottles for each regenerant. By testing a variety of regenerants, the pH and NaCl
for optimal desorption and subsequent IX can be determined. Essentially, the optimal
solution requires the least chemicals, provides large N desorption, and maintains IX
capacity long-term. A key parameter tested in each IX cycle was percent NH4-N removal.
Percent removal results for multiple cycles could be used to help identify which solutions
could be used to regenerate the material with the least exchange capacity loss. Five
regenerant solutions were tested for 3 IX cycles after which 2 regenerants were selected
to be operated for 7 IX cycles; results are displayed in Figure 8. Removal of NH4+ during
the first IX cycle was approximately 85-88% for all exchange bottles. Results showed
that 8% NaCl was the most effective regenerant in maintaining removal and 10% NaCl,
9.4
4.8
1.8
0.9 0.5
0.0
0.1
0.2
0.3
0.4
0.5
0.6
0.7
0.8
0.9
1.0
0.0 0.1 0.2 0.3 0.4 0.5 0.6 0.7 0.8
Sorp
tio
n (
mg
NH
4-N
/g
clin
op
tilo
lite
)
Solution Final NH4-N Concentration (mg/l)
Clinoptilolite=10 g/l Time = 2 days
Volume=30 mL Shaker Speed=150 rpm

60
5% NaCl, and 0.5% NaOH resulted in slightly less removal than 8% NaCl after 3 cycles
(Figure 12). Excessive NaOH becomes negatively impacts IX capacity as 0.5% NaOH
outperformed 2% NaOH. These results were expected based on the literature; high pH
solutions cause attrition of clinoptilolite surface (Koon and Kauffman, 1975). Use of
Ca(OH)2 was unsuccessful as much of the calcium remained insoluble. The insoluble
calcium was entrapped in the media and therefore disrupted IX processes; previous work
has noted Ca(CO3)2 precipitation within the bed (Sedlak, 1991). The two regenerants
tested for 7 IX cycles were 8% NaCl and 7.5% NaCl + 0.5% NaOH (pH=13). Sodium
chloride only solution significantly outperformed the high pH regenerant; however, after
7 IX cycles, percent removal of NH4-N during regeneration was only 17% less for 7.5%
NaCl + 0.5% NaOH in comparison to 8% NaCl. Reduced removal compared to 8% NaCl
may be due to excessive pH of this solution causing changes to the zeolite surface that
reduced NH4-N exchange; therefore, for the next set of batch tests, the NaOH
concentration was decreased.

61
Figure 12: NH4-N removal by clinoptilolite in NH4Cl solution vs IX cycle
3.1.2 Zeolite Regeneration for Ammonium Only Batch Testing
Regenerant NH4-N concentration in regeneration brine was the second parameter
of interest for NH4-N only exchange with clinoptilolite. Regenerant concentration was
nearly identical between the 3 NaCl only solutions after 3 cycles, as shown in Figure 13.
NH4-N concentration in the 0.5% NaOH solution was greater than the 2% NaOH
solution, which may be attributed to the lower IX performance. As with IX, 7.5% NaCl +
0.5% NaOH resulted in slightly worse performance than 8% NaCl with respect to
regenerant NH4-N concentration. Reduced concentration can be attributed to less
exchange of NH4+ and therefore less to be desorbed during regeneration. Based on the
regeneration and IX results, the NaOH concentration should be decreased if attempting to
0
10
20
30
40
50
60
70
80
90
100
0 1 2 3 4 5 6 7
NH
4+ R
em
ova
l %
IX Cycle
10% NaCl (pH=8.3)
8% NaCl (pH=8)
5% NaCl (pH=7.5)
7.5% NaCl + 0.5% NaOH(pH=13)
2% NaOH (pH=13.7)
0.5% NaOH (pH=13)
2% Ca(OH)2 (pH=13.7)
Initial NH4-N≈40 mg/l
Triplicate bottles
+/- 1 std. dev. error bars

62
utilize a high pH solution. The salt concentration should be 8% NaCl or less in order to
reduce chemical use.
Figure 13: Regenerant NH4-N concentration (NH4+ only test) vs. regeneration cycle
3.1.3 Zeolite Ion Exchange Batch Testing with Mixed Cation Solution
In order to evaluate NH4+ exchange in the presence of other cations and revise the
set of regenerants tested, a mixed cation batch test was conducted. As before, the goal
was to evaluate each regenerant’s effect on long-term IX capacity and N desorption. A
set of four regenerants were tested in triplicate using clinoptilolite as the media for
removal of NH4+ from a mixed cation solution. As stated in the methods, mixed cation
solution contained Ca2+
, Mg2+
, K+, Na
+, and NH4
+. As with the NH4-N only batch tests,
0
5
10
15
20
25
30
35
40
45
50
0 1 2 3 4 5 6 7
NH
4-N
(m
g/l)
Regeneration Cycle
10% NaCl (pH=8.3)
8% NaCl (pH=8)
5% NaCl (pH=7.5)
7.5% NaCl + 0.5% NaOH(pH=13)
2% NaOH (pH=13.7)
0.5% NaOH (pH=13)
2% Ca(OH)2 (pH=13.7)
Triplicate bottles
+/- 1 std. dev. error bars

63
IX capacity in each cycle was the parameter of interest. Results for 5 IX cycles are
displayed in Figure 14 as well as the initial ion concentrations. Results showed that after
3 IX cycles there was no significant difference in using 8% NaCl, 7.5% NaCl (pH=12), or
0.1% NaOH. However, by IX cycle 5, 7.5% NaCl (pH=12) and 8% NaCl were more
effective than 0.1% NaOH and 0.1% Ca(OH)2 based on +/- one std. dev. A student’s t-
test was performed to show statistical dissimilarity, the results of which are in Table A3.
After 5 IX cycles there was no statistically significant difference in clinoptilolite
performance when regenerated with 8% NaCl (pH=8) or 7.5% NaCl (pH=12). The
conclusion is that at a pH of 12, clinoptilolite is successfully regenerated without attrition
of the surface.
Figure 14: Removal of NH4-N (mixed cation solution) vs IX cycle
Selectivity of clinoptilolite for NH4-N exchange over other cations was
determined in order to estimate each cation’s impact on total NH4-N exchange capacity.
0
10
20
30
40
50
60
70
80
90
0 1 2 3 4 5
NH
4-N
Re
mo
val (
%)
IX Cycle
8% NaCl (pH=8)
7.5% NaCl (pH=12)
0.1% NaOH (pH=12)
0.1% Ca(OH)2 (pH=12)
Initial Concentrations:
NH4-N≈40 mg/l
K≈10 mg/l
Ca≈35 mg/l
Mg≈22 mg/l
Na≈135 mg/l
Triplicate bottles, +/- 1
std. dev. error bars

64
The parameter used to determine selectivity is called the separation factor and is
calculated using Equation 4.
Equation (4)
Where,
αNH4-N/M+= Separation factor of NH4-N versus a cation
X=Mass of ion in solution (eq)
Y=Mass of ion exchanged onto solid (eq)
M+=Cation
Separation factors for NH4-N in relation to Ca2+
, Mg2+
, K+ and Na
+ are displayed in Table
4; saturation of exchange sites with Na+ was assumed in order to enable the calculation
(1.85 meq/g solid). For the solutions found to be most effective in regeneration, 8% NaCl
and 7.5% NaCl (pH=12), the separation factor for NH4-N/ Ca2+
was slightly less than 1
indicating that Ca2+
is slightly more preferred. Separation factor for Mg2+
with these same
two solutions was near 4, indicating a greater preference for NH4-N. For K+, the
separation factor was essentially 0, which indicates that K+ is significantly preferred over
NH4-N by the media. The separation factor for Na+ is near 1; however, Na
+ ions are being
released from the surface since the surface is nearly saturated with Na+. From these
results, the conclusion can be drawn that Ca2+
and K+ concentration in water will
significantly affect NH4-N exchange; however, Na+ and Mg
2+ concentration will not.

65
Table 4: Average separation factor for NH4+ during IX cycle 3 and 4.
Separation Factor1
Regenerant Preferred Cation
8% NaCl
7.5% NaCl
(pH 12) 8% NaCl
7.5% NaCl
(pH 12)
α,NH4-N/Ca 0.98 0.78 Ca2+
Ca2+
α,NH4-N/Mg 4.09 3.59 NH4+ NH4
+
α,NH4-N/K 0.00 0.00 K+ K
+
α,NH4-N/Na 0.97 1.02 Na+ NH4
+
3.1.4 Zeolite Regeneration for Mixed Cation IX Batch Tests
Regenerant NH4-N concentration for each IX cycle was measured in order to
determine the recovery potential. Figure 15 displays the results for each IX cycle by type
of regenerant. Regenerants containing NaCl and NaOH were similar through 4
regeneration cycles, but after 5 cycles, 8% NaCl and 7.5% NaCl (pH=12) resulted in the
greatest concentration and were not statistically different. After 5 cycles, regenerant
concentration was about 70% of the initial sample concentration (40 mg/l NH4-N) for 8%
NaCl and 7.5% NaCl (pH=12). Calcium hydroxide performed poorly in regeneration
especially during cycle 2 and 3. According to the data in Figs. 9 and 10, the two NaCl
solutions outperformed the 0.1% NaOH and 0.1% Ca(OH)2 solutions.
1 Separation factor>1: NH4
+ preferred, separation factor<1:other cation preferred

66
Figure 15: Regenerant NH4-N concentration (mixed cation test) vs regeneration
cycle
3.2 Phosphate Ion Exchange Batch Testing
In order to evaluate PO4-P removal with various media and then select media for
column testing, batch testing was conducted. The first PO4-P batch testing was conducted
with four media, including: Dowex WBA-2, Dowex M4195, LayneRT™
, and AA weakly
acidic (AAwa). PO4-P only tests were conducted in order to compare uptake of PO4-P
among resins without the presence of competing anions. Results are displayed in Table 5.
Essentially all PO4-P was removed with Dowex WBA-2, LayneRT™
, and AAwa.
However, Dowex M4195 only removed about 17% of PO4-P. This result is because the
surface of Dowex M4195 is designed for preparation as a ligand exchange resin through
loading of metals on the surface. Regeneration of the resins was conducted using 6%
NaCl at pH=10. This solution was found to desorb almost all PO4-P for Dowex WBA-2
0
5
10
15
20
25
30
35
0 1 2 3 4 5
NH
4-N
Co
nce
ntr
atio
n (
mg/
l)
Regeneration Cycle
8% NaCl (pH=8)
7.5% NaCl (pH=12)
0.1% NaOH (pH=12)
0.1% Ca(OH)2 (pH=12)
Triplicate bottles, +/- 1
std. dev. error bars

67
and Dowex M4195, but essentially none for LayneRT™
and AAwa.
Table 5: Phosphate only batch IX (triplicate bottles)
Ion Exchange Dowex
WBA-2
Dowex
M4195
LayneRT™
(PhosX)
AA
weakly
acidic
Control
(Glass
adsorption)
Final PO4-P,
Avg. (mg/l)
0.006 2.4 <0.006 0.02 2.9
Sorption (mg/g) 0.29 0.05 0.29 0.29
Removal (%) 100 18 100 99
Following PO4-P only testing, mixed anion exchange was tested to determine the
effect of competing ions on PO4-P uptake; initial and final anion concentrations are
displayed in Table 6. Dowex M4195 and AAwa results were slightly affected as percent
PO4-P removal decreased from 17 to 12 and 99 to 95%, respectively. However, this is not
a substantial change considering AAwa was still capable of removing 95% of PO4-P in the
presence of large concentrations of other anions. LayneRT™
was not affected by the
presence of other anions as removal of PO4-P was essentially 100%. As expected, Dowex
WBA-2, a non-PO4-P selective resin, was significantly affected by the presence of other
anions as PO4-P removal decreased from almost 100% to 64%. This is caused by a lack
of PO4-P specific binding sites on the resin.
Sulfate, alkalinity, and chloride uptake/release were investigated, as shown in
Table 5; these anions are expected to be found in the most significant concentration in
municipal secondary effluent. Chloride was released in 3 of the media with the exception
of LayneRT™
which resulted in some uptake of chloride. Almost 100% of SO4-2
was
removed by Dow-WBA2 whereas LayneRT™
removed just 13%; selectivity towards P
removal by LayneRT™
will reduce the number of regeneration cycles required in

68
comparison to Dow-WBA2. Removal of alkalinity, mostly in the form of bicarbonate,
was greatest in Dow-WBA2, the non-selective media. Sulfide and nitrate concentrations
were lower than expected in the controls and therefore difficult to detect.
Regeneration of the media was conducted using three different brine solutions
based on the literature; solutions used are listed in Table 7. The regeneration test was
performed to determine P desorption potential with the revised solutions based on the
first batch test and literature. Regeneration was only slightly successful with Dowex
M4195, LayneRT™
, and AAwa; desorption of PO4-P was 31%, 31%, and 38%,
respectively. Results for LayneRT™
desorption were surprising as previous work has
shown >90% desorption of PO4-P in column tests; however, this may be due to the
difference in kinetics between batch and column testing (Blaney et al., 2007). Complete
PO4-P desorption was achieved for Dowex WBA-2. Control and final pH values illustrate
the uptake of OH- ions onto the media surface during regeneration. Clearly there is
uptake of OH- ions in Dowex WBA-2 and Dowex M4195; however, for the other two
media, results are inconclusive. Knowing the pH change during regeneration is necessary
for estimating the amount of chemicals that will be required to adjust pH of the
regenerant before P recovery or disposal. Dow WBA-2 was not tested further due to its
lack of selectivity towards PO4-P. Dowex M4195 was only tested in the metal-loaded
(Cu, Fe, Al, or Cu & Fe) form for the rest of the study.

69
Table 6: Final solution characteristics in mixed anion solution batch IX (triplicate
averages)
Ion
Exchange PO4-P Cl- SO4-S Alkalinity
HCO3-
(Assuming all
Alk. is HCO3-)
pH
after IX
mg/l mg/l mg/l
mg/l as
CaCO3 mg/l
Dowex
WBA-2 1.2 65 <0.8 119 72 7.1
Dowex
M4195 2.9 70 39 0 0 2.6
LayneRT™
(PhosX) <0.006 48 14 96 59 7.0
AA weakly
acidic 0.18 70 4.4 112 68 7.6
Control
(Glass
adsorption) 3.3 55 16 136 83 7.4
Table 7: Mixed anion regeneration test (triplicate averages)
Regeneration PO4-P
Initial
regen. pH
Final
regen. pH Regenerant P Desorbed
mg/l %
Dowex
WBA-2 2.6 10.1 9.6
5% NaCl,
pH=10 114
Dowex
M4195 0.14 10.1 9.3
5% NaCl,
pH=10 31
LayneRT™
(PhosX) 1.0 13.4 13.4
2% NaCl,
2% NaOH 31
AA weakly
acidic 0.9 13.4 13.3 2% NaOH 38
In order to determine maximum sorption of PO4-P in conditions that were not P
limited, anionic IX media were tested in a spiked PO4-P batch test containing 100 mg/l
PO4-P. An excess PO4-P concentration, greater than the exchange potential, was used in
order to determine maximum exchange capability. Eight media were tested and results
from the test are listed in Table 8 in order of greatest PO4-P removal to least. Removal of

70
PO4-P with Dow-Cu was significantly (p≤0.014) better in terms of IX performance than
all other resins. A student’s t-test was conducted to determine statistical difference
between media; a p-value of less than 0.05 indicates statistical difference with 95%
confidence. The student’s t-test results for spiked PO4-P IX are in Table 9. LayneRT™
and Dow-FeCu were found to perform similarly and their performance was only about
12-16% less than Dow-Cu. Statistics also show that Dow-NAB-Cu and Dow-HFO IX
performance are similar. PO4-P uptake with the two activated alumina media was less
than 50% of Dow-Cu and Dow-FeCu. Applying KMnO4 and Al2(SO4)3 in two steps was
the most successful IX resin loaded with Al; however, as shown in Table 6, this resin
performed at less than a third the capacity of Dow-Cu. Based on batch testing, the three
top performing resins were identified for use in column tests; these media were Dow-Cu,
Dow-FeCu, and LayneRT™
.
Table 8: Spiked phosphate batch IX (triplicate bottles)
Resin Removal PO4-P
% mg/l
Dow-Cu 76 24
DOW-FeCu 64 36
LayneRT™
60 41
Dow-NAB-Cu 53 47
DOW-HFO 52 49
AA neutral 32 67
AA basic 28 72
Dow-Mn-Alum 23 78

71
Table 9: Student t-test p-values for spiked phosphate IX
Dow-
Cu
DOW-
FeCu
LayneRT™
DOW-
NAB-
Cu
DOW-
HFO
AA
neutral
AA
basic
DOW-FeCu 0.0014
LayneRT™
0.0008 0.016
DOW-Cu 0.0001 0.0003 0.0033
DOW-HFO 0.0002 0.0011 0.0066 0.18
AA neutral 0.0000 0.0000 0.0000 0.0000 0.0004
AA basic 0.0000 0.0000 0.0000 0.0000 0.0001 0.013
DOW-Mn-
Alum
0.0000 0.0000 0.0000 0.0000 0.0000 0.0004 0.0022
For comparison of desorption capabilities of each resin, regeneration of the media
used in spiked PO4-P batch testing was conducted. Regenerants were selected either
based upon solution used in previous research, as listed in Table 1, or utilizing salt
solution at a neutral pH; solutions for each media are listed in Table 10. Regenerant
concentration was greatest for Dow-Cu; however, the Dow-FeCu had the greatest percent
desorption. Regeneration of Dow-NAB-Cu and AA neutral (AAn) desorbed less than
40% of PO4-P. Dow-HFO regeneration was ineffective as only 8% was desorbed; the
strong binding between iron and PO4-P requires a higher pH to reverse. A student’s t-test
was conducted on percent desorption and results are found in Table A6. There was no
statistical difference between Dow-Cu and Dow-FeCu. Dow-Cu removed the most P, but
requires acidic regenerant (pH=4.3). However, for Dow-Cu batch tests, the final
regenerant pH is neutral which suggests that little pH adjustment will be necessary prior
to struvite precipitation. LayneRT™
can be purchased pre-prepared and has the 3rd
greatest P removal, but requires a strong basic solution (pH=14) to regenerate. The data

72
led to the conclusion that Dow-FeCu is best of the tested resins as it has a large IX
capacity, large percent desorption and does not require acid or caustic chemical additions
to the regenerant.
Table 10: Regeneration performance for spiked P test (triplicate bottles)
Resin Regenerate PO4-P Desorption
Final
pH
mg/l %
DOW-Cu 6% NaCl pH=4.3 46 60 7.2
DOW-FeCu 6% NaCl pH=8 42 65 7.6
LayneRT™
2% NaCl +
2% NaOH 30 49 13.4
Dow-NAB-Cu 6% NaCl pH=4.3 20 38 6.4
AA basic 6% NaCl pH=9.5 14 53 9.0
AA neutral 6% NaCl pH=7.5 10 31 8.2
DOW-HFO 6% NaCl pH=8 4 8 6.3
3.3 Wastewater Characterization
Column tests were conducted using actual wastewater to account for biological
activity and dissolved organic carbon. Secondary clarifier effluent from South Shore
Wastewater Treatment Plant was collected and analyzed to determine concentrations of
cations, anions, BOD, and organic P (orgP). The wastewater contained 1.5 mg/l NH4-N
and 0.2 mg/l PO4-P; complete characterization is given in Table A8. Based on the
anaerobic treatment mass balances for N and P in Figs. 3 and 4, expected of TKN and TP
were 42 mg/l and 3.5 mg/l, respectively, with most of the nutrients in the form of NH4+
and PO4-3
, respectively. As a result, the nutrient concentrations were supplemented to
about 32 mg/l NH4-N and 4-6 mg/l PO4-P. There is 4.5 mg/l NO3-N in the secondary

73
effluent which would not be expected in AnMBR permeate since there is no aeration step
to nitrify NH4+ to NO3
-. The BOD5 of the wastewater is 12 mg/l which is comparable to
expected AnMBR permeate quality (Kim et al., 2011). Cl-, alkalinity, SO4-S, K
+, Ca
2+,
Mg2+
, and Na+ were found in significant concentrations (all were greater than 8 mg/l). In
anaerobic wastewater, much of the sulfate would be present as sulfide as a result of
biologically mediated reduction. The only heavy metals detected in the wastewater were
aluminum and copper. After nutrient dosing and before pumping sample into the
columns, the wastewater was passed through a 1.5 μm filter to remove suspended
particles that would not be present in AnMBR permeate. This resulted in removal of
about 0.1 mg/l TP and likely some BOD5 and TKN.
A strong potential for inorganic fouling was determined using the Langelier
Saturation Index. Influent wastewater to the IX system has a pH of 7.6. At this pH HCO3-
will exist in significantly greater concentrations than CO3-2
and therefore CO3-2
is
assumed to be zero. In addition, all alkalinity is assumed to be in the HCO3- form since
OH- concentration is minimal at neutral pH and no other significant source of alkalinity is
expected. Using eqn. 1, the first 2 terms cancel out since CO3-2≈0; the first 2 terms
become -log(<<0.0001)+log(<<0.0001). Using the wastewater Ca2+
and alkalinity
concentration in mol/L, the pHsaturation=5.3 and therefore the LSI=2.3. An LSI between 1
and 3 is considered a strong to very strong fouling potential.

74
3.4 Removal of Phosphate in Lab-Scale Ion Exchange Columns
An anion exchange column was tested as the first step in nutrient removal from
secondary effluent dosed with nutrients. Column testing was conducted as full-scale
operation would be in column mode. The first media tested was LayneRT™
, a
commercially available iron-loaded resin that was proven effective for P removal in batch
testing. Effluent, average influent and breakthrough PO4-P concentration are displayed in
Figure 16. Influent anion concentrations are also provided as these impact PO4-P
exchange capacity. However, it is important to note that nearly no NO3- is expected in
AnMBR permeate and most sulfur will be reduced from SO4-2
to HS- in the AnMBR;
therefore, secondary effluent differs from AnMBR, but is the most similar alternative
without operation of the AnMBR. Influent and effluent pH for the column was 7.6 and
7.2, respectively. The column was capable of treating 500 BV of wastewater containing 4
mg/l PO4-P before effluent PO4-P exceeded 0.075 mg/l. Breakthrough of 0.075 mg/l PO4-
P was selected as strict regulations begin to be implemented nationwide. Total mass of P
exchanged before breakthrough was 73.9 mg; this is equivalent to 2000 mg P/LBV.
Volume of resin including the material and void space is denoted as LBV. This number
provides design criteria for PO4-P IX beds with LayneRT™
; 2000 mg P/LBV explains that
a liter of LayneRT™
BV will remove 2 g of P before column breakthrough occurs. The
results for this column are similar to those by Sengupta and Pandit (2011) that found that
LayneRT™
could treat 625 BV of 2.75 mg/l P solution before breakthrough.

75
Figure 16: LayneRT™ column effluent PO4-P vs BV treated.
Dow-Cu was tested in a column for comparison to LayneRT™
since it resulted in
the greatest PO4-P removal during spiked PO4-P batch testing. Influent PO4-P
concentration was slightly greater, 5.6 mg/l vs. 4.0 mg/l, for Dow-Cu than the LayneRT™
column. Effluent PO4-P data is depicted in Figure 17. Influent and effluent pH were 8.7
and 8.1, respectively; the pH was greater than expected AnMBR permeate, but was not
extreme. Breakthrough occurred at about 82 BV of treated wastewater resulting in about
16.8 mg of P exchange after 82 BV. Therefore, Dow-Cu has a PO4-P exchange capacity
prior to breakthrough of 455 mg PO4-P/LBV. This resin has less than 25% of the capacity
of LayneRT™
which contradicts batch test results. However, these results are similar to
work by Kumar et al. (2007) in which capacity of LayneRT™
was found to be
approximately 5 times that of Dow-Cu. The benefit to Dow-Cu is that regeneration
requires an acidic solution (pH=4.3) that may not require as much pH adjustment as
LayneRT™
which uses a regenerant with pH>14.
0
1
2
3
4
5
0 200 400 600
PO
4-P
(m
g/l)
Bed Volumes Treated
Effluent PO4-P
0.075 mg PO4-P/L
Influent PO4-P
BV=37 mL
Influent concentration:
PO4-P=4.0 mg/l
Cl-=177 mg/l
Alk.=267 mg/l as CaCO3
SO4-2-S=26 mg/l
NO3--N=4.5 mg/l
Points are single
measurement

76
Figure 17: Dow-Cu cycle 1 column effluent PO4-P vs BV treated
The capacity of Dow-Cu was much less than LayneRT™
and the influent pH for
Dow-Cu cycle 1 was about 8.7; in order to test whether the pH affected capacity, a
second IX cycle was conducted. In addition, a second IX cycle provided the change in IX
capacity between cycle 1 and 2 which is variable depending on P desorption percent and
Cu2+
leaching. In this test, the influent pH was reduced to 7.4 and the influent PO4-P
concentration was 5.9 mg/l; effluent pH was 7.1. Effluent PO4-P data is shown in Figure
18. In the second cycle, breakthrough of PO4-P occurred at about 68 BV; the total
exchanged P during the first 68 BV was 14.7 mg. Exchange capacity was reduced by
12% indicating insufficient regeneration of the resin, irreversible fouling, or copper
leaching. Regeneration of the resin will be discussed in the next section, including % P
desorption and regenerant Cu leaching. Previous work has claimed the resin can be
0
1
2
3
4
5
6
7
0 20 40 60 80 100 120
Effl
ue
nt
PO
4-P
(m
g/l)
Bed Volumes
Effluent PO4-P
0.075 mg/l PO4-P
Influent PO4-P
BV=37 mL
Influent concentration:
PO4-P=5.6 mg/l
Cl-=182 mg/l
Alk.=267 mg/l as CaCO3
SO4-2-S=26 mg/l
NO3--N=4.5 mg/l
Points are single
measurement

77
utilized for more than 100 cycles without significant loss in capacity (Zhao and Sengupta,
1998).
Copper leaching was found to be significant in both Dow-Cu column runs. Four
samples were taken from each IX cycle to determine effluent Cu concentration; metal
leaching data from anion IX runs are in Table A9. In both cases effluent Cu was around
3-3.5 mg/l initially and then reduced to about 1 mg/l at the end of the test. Copper
leaching may be more significant in initial column runs due to weakly bonded Cu or
could be attributed to difference in preparation methods. For example, in Zhao and
Sengupta (1996) the resin is dried at 45 °C, whereas, in our study it is dried at 35 °C. In
contrast, no metals were found to leach in significant concentrations from the LayneRT™
column. Therefore, capacity of LayneRT™
should not change significantly due to loss of
surface ions as could be the case for Dow-Cu.
Figure 18: Dow-Cu cycle 2 column effluent PO4-P vs BV treated
0.0
1.0
2.0
3.0
4.0
5.0
6.0
7.0
0 20 40 60 80 100 120
PO
4-P
(m
g/l)
Bed Volumes Treated
Effluent PO4-P
Influent PO4-P
Breakthrough PO4-P
BV=37 mL
Influent Concentration:
PO4-P=5.9 mg/l
Cl-=182 mg/l
Alk.=267 mg/l as CaCO3
SO4-2-S=26 mg/l
NO3--N=4.5 mg/l
Points are single
measurement

78
Dowex M4195 resin loaded with Fe and Cu (DowFeCu) was tested in column
mode with an influent PO4-P concentration of 6.7 mg/l. Breakthrough of this resin
occurred at 237 BV of wastewater treated as shown in Figure 19. P exchanged during this
period was 55.3 mg which is 1490 mg P/LBV. This is essentially 75% of the capacity of
LayneRT™
, a more promising result than that of Dow-Cu. Previous work showed that the
capacity of Dow-HFO-Cu was twice as great as LayneRT™
(Sengupta and Pandit, 2011).
Upon further reading, it was discovered that Dow-HFO-Cu was prepared without the acid
and base treatment step and therefore, the author of the present work denoted the acid and
base treated resin as Dow-FeCu to distinguish the two (Sengupta, 2013). Preparation of
Dow-FeCu requires four steps whereas LayneRT™
can be purchased ready-to-use;
however, data indicate efficient regeneration of Dow-FeCu at a neutral pH which would
provide cost savings in operation through reduced acid addition for pH adjustment.
Preparation of Dow-HFO-Cu instead of Dow-FeCu will reduce the steps required and
should improve exchange capacity of the resin as the acid and base treatment likely
removes some hydrated ferric oxide (HFO) particles from the resin surface.

79
Figure 19: Dow-FeCu effluent PO4-P concentration vs BV treated
3.5 Desorption of Phosphate from Lab-Scale Ion Exchange Columns
Since the goal is not just P removal, but P recovery, desorption of P from the
media is important. In order to test the P desorption, regeneration of the IX columns was
conducted. Regeneration of the LayneRT™
IX column was accomplished with 2% NaCl
+ 2% NaOH (pH=14). Total desorption of PO4-P was 78 mg or 89% of influent P
exchanged. Effluent P versus BV passed is displayed in Figure 20. As illustrated, most of
the PO4-P desorption occurred within the first 6 BV. Previous work claimed similar
regeneration results of >90% PO4-P desorption in less than 10 BV. With a substantial
portion of PO4-P remaining on the resin, exchange capacity during cycle 2 is likely to be
reduced. A long-term study is necessary to determine the impact on capacity after many
IX cycles; the resin has been tested for 10 cycles, however, data has not been published
or only partial regeneration was conducted (Martin et al., 2009; Sengupta and Pandit,
0.0
1.0
2.0
3.0
4.0
5.0
6.0
7.0
8.0
0 100 200 300 400
PO
4-P
(m
g/l)
Bed Volumes Treated
Effluent PO4-P
Breakthrough PO4-P
Influent PO4-P
BV=35 mL
Influent Concentration:
PO4-P=6.7 mg/l
Cl-=182 mg/l
Alk.=267 mg/l as CaCO3
SO4-2-S=26 mg/l
NO3--N=3.9 mg/l
Points are single
measurement

80
2011). Using regression curves, the estimated concentration of PO4-P after 4 BV was
calculated. If 4 BV of regenerant were used, the concentration of PO4-P would be 490
mg/l. After 4 BV, only 82% of PO4-P is desorbed; however, the loss in capacity may not
be an issue as regenerating more often with less solution is potentially less costly than
regenerating to complete desorption each cycle. LayneRT™
regenerant cation
concentrations from the first 250 mL of regenerant are listed in Table A10. Iron leaching
was not significant; however, aluminum leaching was 155 mg/l. High concentrations of
Al3+
will cause issues when precipitating struvite as aluminum hydroxides and aluminum
phosphates will form which are not as amenable to fertilizer application due to limited
bioavailability of P and Al3+
toxicity (Mossor-Pietraszewska, 2001; Peret et al., 2011).
Measured PO4-P concentration was 536 mg/l which is slightly greater than the estimated
value, indicating that desorption was greater than calculated. The concentration factor for
P is greater than 130 times. LayneRT™
PO4-P exchange and desorption performance is
excellent, but requires extreme pH (14) to regenerate.

81
Figure 20: LayneRT™ regeneration effluent PO4-P vs BV passed
Regeneration of Dow-Cu was performed following both IX cycles for
comparison; desorption may change between cycles if P is not completely removed
during the previous regeneration or there is a change in the P removed during IX.
Regeneration of Dow-Cu was similar for both cycles; effluent PO4-P concentration
versus BV passed is shown in Figure 21. The regenerant was 6% NaCl at a pH of 4.3.
Total PO4-P desorption was 97% and 90% during cycle 1 and 2, respectively. Effluent
PO4-P in the initial regenerant was much greater during IX cycle 1 than 2; however, as
the test progressed, the effluent concentration became more similar. In both cycles, PO4-P
concentration in the first 1.5 BV of regenerant is about 325-350 mg/l. Percent PO4-P
desorption after 1.5 BV is 88% and 83% for regeneration cycle 1 and 2, respectively.
Just as with LayneRT™
, complete desorption of the resin is unnecessary as it requires
large volumes of chemical solution to desorb the last 10-15% of PO4-P. Data from Table
A10 show that measured PO4-P concentration is about 150 mg/l in the first 4 BV of
0
200
400
600
800
1000
1200
0 2 4 6 8 10 12 14
PO
4-P
(m
g/l)
Bed Volumes Passed
2% NaCl + 2% NaOH
Points are single
measurement

82
regenerant for both regeneration cycles. Regenerant effluent pH during the first 4 BV was
9.90. This is likely caused by uptake of hydrogen protons by PO4-P. Copper
concentration in the first 4 BV of cycle 1 and 2 regenerant was 7 and 26 mg/l,
respectively. For reasons undetermined, copper leaching was much greater during
regeneration cycle 2. A possible solution for copper leaching is to add 10-30 mg/l Cu2+
to
the regenerant in an attempt to limit Cu2+
release from the resin; another solution would
be to place virgin resin containing at the bottom of the column to capture Cu2+
.
Desorption of Dow-Cu is effective with less volume of solution than LayneRT™
;
however, regeneration would be necessary more often and the concentration factor is
about 58 instead of 130. This resin provides a brine PO4-P solution with a pH ideal for
struvite precipitation.
Figure 21: DOW-Cu regenerant PO4-P concentration vs BV passed during cycle 1
and 2
0
100
200
300
400
500
600
700
0 1 2 3 4 5 6
Re
gen
era
nt
PO
4-
P (
mg/
l)
Bed Volumes Passed
DOW-Cu 2
DOW-Cu 1
6% NaCl pH=4.3
Points are single
measurement

83
Regeneration of Dow-FeCu was conducted for comparison to Dow-Cu and
LayneRT™
. Dow-FeCu was regenerated using 6% NaCl at a pH of 8 based on successful
P desorption during batch testing. Greater than 90% desorption of PO4-P was
accomplished with 5 BV and within the first 1.3 BV, 83% PO4-P desorption occurred.
Peak regenerant concentration was 1500 mg/l PO4-P and the concentration in the first 4
BV was 506 mg/l; regeneration eluate PO4-P concentration vs. BV treated is depicted in
Figure 22. The concentration factor is 76, but would likely be much greater if the influent
PO4-P concentration was only dosed to 4 mg/l instead of 6.7 mg/l. Regeneration eluate
pH was 9.6 in the first 4 BV which is within range of typical pH used for operation of
struvite precipitation. Leaching of Cu2+
was significant with 30 mg/l Cu2+
in the first 4
BV of regenerant. Methods to offset the loss of Cu2+
should be considered as discussed
for Dow-Cu in the previous section. Dow-FeCu provides nearly the same capacity as
LayneRT™
with the benefit of regeneration effectiveness at neutral pH. Improving this
resin's capacity to match previous research by Sengupta and Pandit (2011) will make
Dow-FeCu the optimal resin for PO4-P IX in municipal wastewater.

84
Figure 22: Dow-FeCu regenerant effluent PO4-P concentration vs BV passed
3.6 Ammonium Exchange in a Lab-Scale Zeolite Column
Zeolite was tested as the cation exchange media for NH4+ removal from
secondary effluent pre-treated by a column with LayneRT™
media. The column influent
was effluent from the LayneRT™
anion exchange column to simulate dual IX for P and N
removal. Effluent NH4-N versus BV treated for IX cycle 1 are depicted in Figure 23.
Influent cations are listed in Figure 23 as these concentrations will substantially impact
the NH4-N exchange capacity of zeolite. Breakthrough for zeolite was considered 1.5
mg/l NH4-N and the column maintained effluent less than this concentration for 128 BV.
The exchange capacity prior to breakthrough for zeolite was 4050 mg NH4-N/LBV.
Therefore the exchange capacity in eq-N/L is 0.29 which is within the range of 0.2-0.5
eq/L reported by the USEPA (1993) for wastewater applications. Although the zeolite
column reaches breakthrough (effluent NH4-N>1.5 mg/l or PO4-P>0.075 mg/l) before
0
200
400
600
800
1000
1200
1400
1600
0.0 2.0 4.0 6.0 8.0 10.0 12.0 14.0 16.0
PO
4-P
(m
g/l)
Bed Volumes Passed
6% NaCl pH=8
Points are single
measurement

85
LayneRT™
and Dow-FeCu, complete exhaustion of the zeolite bed (influent NH4-
N=effluent NH4-N) occurs more slowly following breakthrough. Zeolite media provided
treatment for about a quarter of the wastewater that LayneRT™
did, which means that the
cation column will require regeneration more often.
Figure 23: Zeolite column effluent NH4-N vs BV treated (cycle 1)
The zeolite column was operated for a second cycle following regeneration in
order to determine the change in exchange capacity. Cation exchange capacity of the
media may change between cycles if complete desorption of N does not occur during
regeneration or the material properties are changed by the regenerant. A substantial
difference in performance between cycle 1 and 2 occurred; effluent NH4-N concentration
remained around 1 mg/l for the first 184 BV instead of nearly 0 mg/l as was the case in
cycle 1; results are shown in Figure 24. This may be attributed to a change in surface
0
5
10
15
20
25
30
35
0 20 40 60 80 100
NH
4-N
(m
g/l)
Time (hr)
Effluent NH4-N
1.5 mg/l NH4-N
Influent NH4-N
NH4-N=32 mg/l
Na+=158 mg/l
K+=9 mg/l
Ca2==79 mg/l
Mg2==36 mg/l
Points are single
measurement

86
characteristics due to the high pH regenerant; however, further studies are necessary.
Using a breakthrough of 1.5 mg/l NH4-N, the column treated 191 BV of wastewater
before breakthrough with an exchange capacity of 6190 mg NH4-N/LBV or 0.4 meq-N/L.
NH4-N exchange capacity was about 50% greater cycle 2. Influent cation concentrations
were unexpectedly lower in cycle 2, likely resulting in increased exchange capacity of
NH4-N. In previous work, it was predicted that specific surface area of the mineral
increased during the first two regenerations due to expansion of macropores which in turn
increased exchange capacity (Turan and Celik, 2003). Treatment of wastewater for many
cycles should be conducted to better determine if capacity changes are caused by
regeneration or variability of the wastewater cations.
Figure 24: Zeolite column effluent NH4-N vs BV treated (cycle 2)
0
5
10
15
20
25
30
35
0 50 100 150 200 250 300
NH
4-N
(m
g/l)
Bed Volumes
Effluent NH4-N
1.5 mg/l NH4-N
Influent NH4-N
NH4-N=34 mg/l
Na+=117 mg/l
K+=9 mg/l
Ca2+=45 mg/l
Mg2+=24 mg/l
Points are single
measurement

87
Cations in the effluent were tested in order to determine the amount of each ion
being exchanged. Design of columns is dependent upon uptake of other cations; the more
K+, Ca
2+, etc. in the wastewater, the more media that is necessary. Determining uptake of
each cation will determine which cations to consider during design as well as which
cations may be desorbed in the regenerant. Metals were measured in every third sample
tested for NH4-N concentration in the zeolite column effluent. Concentrations of K+, Na
+,
Mg2+
, Ca2+
, and NH4-N in zeolite column effluent for IX cycle 1 and 2 are found in
Figures A1 and A2, respectively. In the first cycle, effluent K+ concentration equaled
influent concentration initially and then rose over time until near equilibrium at which
point K+ was discharged at 4 times the influent concentration. This is likely explained by
K+ attached to the zeolite surface that was not released during preconditioning. However,
during the second cycle, K+ was exchanged until near equilibrium at which point influent
equaled the effluent. Therefore difference in preconditioning and regeneration of zeolite
greatly impacts the exchange process; these results were also found in batch testing.
Magnesium was exchanged for the first 25 BV of cycle 1, but then was not exchanged for
the rest of cycle 1 or in cycle 2. Calcium is significantly exchanged early in the IX cycles,
but then gradually increases until it is equivalent to the influent. Therefore, Ca2+
concentration will greatly impact exchange capacity of NH4-N, but Mg2+
will not. Upon
analysis of the metals data, K+ and Ca
2+ have the greatest impact on exchange capacity of
zeolite.
Heavy metals exchanged onto the zeolite surface were of interest as there is the
potential for them to desorb in the regenerant and precipitate in the recovered solids.
Most heavy metals were below detection range for this wastewater, as shown in Table

88
A8. However, Al3+
was detectable and according to the data in Figure A3, Al3+
is
completely exchanged after the first 30 BV of wastewater. The effect on NH4+ exchange
is minimal due to the low concentration of Al3+
; however, in other wastewaters this could
become an issue for zeolite NH4+ exchange.
3.7 Ammonium desorption during Lab-Scale Zeolite Regeneration
Regeneration of zeolite was conducted to determine the percent desorption of N
and to perform subsequent IX. Desorption of N is critical for maintaining N removal
during successive IX and capturing N for recovery. Zeolite was regenerated in column
mode using 6% NaCl (pH=11) for both regeneration cycles. Regenerant eluate NH4-N
concentration versus BV passed is displayed in Figure 25. Peak NH4-N concentration
during regeneration cycle 2 was almost twice as great as during cycle 1. Total desorption
of NH4-N during cycle 1 was 74% with 55% desorption within the first 8 BV.
Concentration of NH4-N in the first 8 BV was 460 mg/l which is a concentration factor of
14. During regeneration cycle 2, 68% of NH4-N attached the zeolite surface was
desorbed. During the 2nd
cycle, regenerant NH4-N in the first 8 BV was 870 mg/l; this is a
concentration factor of 26. Regeneration with 8 BV is ideal as beyond this point excess
solution is required to desorb a much smaller fraction of NH4-N from the zeolite surface.
Regeneration eluate characteristics were evaluated such as pH and cation
concentrations. The pH of the regeneration eluate will determine the need for pH
adjustment prior to ammonia recovery. Metals contained in the regeneration eluate will
impact the solids formed during struvite precipitation. Ion concentrations in the first 7 BV
of regenerant can be found in Table A10. The first 7 BV of regeneration eluate had a pH

89
of 8.7 and 7.7 in cycle 1 and 2, respectively. For vacuum ammonia distillation, the pH
should be about 11 which mean that chemicals must be added to raise the pH. Future tests
should be conducted with regeneration of zeolite at pH=12 to determine improvement in
desorption and increase in regeneration eluate pH. Regenerant from the first 7 BV of
cycle 1 and 2 contained 660 and 320 mg/l of K+, respectively; these solutions also had
350 and 390 mg/l Ca2+
, respectively. Therefore, when utilizing this solution for struvite
precipitation, there will be the potential to form calcium phosphates which inhibit struvite
crystal growth; in addition, reducing Ca/Mg will increase P removal (Hwang and Choi,
1998; Wang et al., 2005). Calcium solids formation could be prevented by operating
struvite precipitation at pH less than 8.5 (Hao et al., 2013).
Figure 25: Zeolite regenerant NH4-N concentration versus BV passed (cycle 1 and 2)
0
200
400
600
800
1000
1200
1400
1600
1800
0 5 10 15 20
Re
gen
era
nt
NH
4-N
(m
g/l)
Bed Volumes Passed
Zeolite Reg. 1
Zeolite Reg. 2
6% NaCl pH=11
Points are single
measurement

90
3.8 Struvite Precipitation
Potassium and N recovery through struvite precipitation is possible by combining
the anion and cation regeneration streams. The resulting precipitate can be beneficially
used as a fertilizer. Struvite and K-struvite precipitation studies using synthetic solutions
were conducted in order to determine optimal pH for P removal. K-struvite could be
formed using the same process if K recovery is desired. Precipitation of N-struvite is well
defined in the literature; however, it was tested here for direct comparison to K-struvite.
In K-struvite precipitation, the ratio of Mg:P:K was set to 1:1:1 and the initial solution
was found to be within 2% of this target. Maximum P, Mg2+
, and K+ removal was at a pH
of 12 as shown in Figure 26. Magnesium removal was 100% at pH=12 which means that
it was the limiting ion in K-struvite precipitation. Based on a polynomial regression
curve, the optimal pH for K-struvite precipitation was 11, which agrees with previous
research (Xu et al., 2011). The research conducted by Xu et al. (2011) also found that the
Mg:K:P ratio should be 2:1:2 which explains the low P removal in the present study. K-
struvite precipitation should be targeted if NH4-N has been removed from the system.
Therefore, the anion regenerant and liquid from vacuum ammonia distillation could be
combined for K-struvite precipitation.

91
Figure 26: K-struvite precipitation vs pH using synthetic solution (Mg:P:N of 2:2:1)
During N-struvite precipitation, the ratio of Mg:P:N was 2:2:1. Removal of PO4-P
was greatest at pH=10 with about 97% removal as shown in Figure 27. Removal of PO4-
P was nearly 90% at pH 11 and 12, but then decreased significantly at pH=13.
Magnesium appeared to be the limiting ion at pH>10 as 99% of magnesium was
removed. Previous work has utilized Mg:P ratios of 1.3:1 or greater to achieve complete
PO4-P removal (Bhuiyan et al., 2008). A wide range of pH have been reported for
precipitation of struvite with 8.5-9 being optimal and greater than 90% removal possible
at pH’s as low as 7.3 (Wang et al., 2005; Adnan et al., 2003). N removal was only about
20% at pH’s greater than 10. This is because as pH increases, precipitates other than
struvite are formed in greater amounts (Hao et al., 2013).
0
10
20
30
40
50
60
70
80
90
100
8 9 10 11 12 13 14
% Io
n R
em
ova
l
pH
P
Mg
K
Points are single
measurement

92
Figure 27: N-struvite precipitation vs pH using synthetic solutions
When operating struvite precipitation reactors, the reactor is typically seeded with
struvite and can be operated based on the conditional solubility product (Britton et al.,
2005). Struvite conditional solubility product is calculated using Equation 5 which is
described in Britton et al. (2005).
[ ] [
] [ ] Equation (5)
Where,
Ps=Struvite conditional solubility product (mol3/L
3)
[Mg2+
]e=Equilibrium magnesium concentration (mol/L)
[NH4+-N]e= Equilibrium NH4-N concentration (mol/L)
[PO4-3
-P]e= Equilibrium PO4-P concentration (mol/L)
The greater the conditional solubility product, the more struvite that potentially will be
precipitated. This parameter is a function of pH. The –log10(Ps) denoted as pPs is graphed
0
10
20
30
40
50
60
70
80
90
100
8 9 10 11 12 13 14
% Io
n r
em
ova
l
pH
P
Mg
N
Points are single
measurement

93
versus pH in Figure A4. The graph fits a second degree polynomial with an R2 of 0.9223;
line-of-best fit for this data is given in eqn. 4 and is similar to work done by Britton et al.
(2005).
Equation (6)
Where,
pPs=-log10(Ps)
Conditional solubility product can be calculated using on-site using laboratory tests such
as the batch testing conducted in this work. From eqn. 4, the optimal pH of the system
based on given, Mg2+
, NH4-N, and PO4-P concentrations can be determined.
After precipitation of struvite from synthetic solutions, struvite was precipitated
directly from zeolite regenerant, anion regenerant, and MgCl2 solution. These batch tests
will determine the amount of P that can be removed with a given Mg input as well as the
impurities contained in the solids. Impurities can reduce the value of the recoverable.
Solutions were added in a predetermined ratio to obtain an initial Mg:N:P ratio of 1:1:1.
The pH in each precipitation reactor was adjusted to 10 after addition of all 3 solutions.
Initial ion concentration and percent removal of each ion are listed in Table 11. Zeolite
regenerant had large concentrations of NH4+, Mg
2+, Ca
2+, Na
+ and K
+ while the anion
regenerants contained PO4-3
, Al3+
, Fe2+
, and Cu2+
. All of these ions were of interest
during precipitation reactions due to the potential of forming K-struvite and magnesium,
calcium, sodium, aluminum, and iron phosphates in addition to the targeted solid, N-
struvite. According to the data, 71% of P was recovered in the LayneRT™
precipitate.
However, previous work has shown greater than 90% recovery (Sengupta and Pandit,
2011). This is likely due to limiting concentrations of Mg2+
for struvite precipitation as

94
96% of Mg2+
was removed. Magnesium limitation of struvite precipitation may also
explain the low removal of NH4+. The solution started with Al
3+ and Ca
2+ concentration
of 78 and 71 mg/l, respectively. Most Al3+
and Ca2+
were precipitated and therefore if
aluminum and calcium phosphates are precipitating, the amount of struvite that forms
will be limited. In the Dow-Cu regenerant precipitation reactions, less than 30% of P was
removed. This may be caused by a limitation in reaction kinetics due to the low
concentration of Mg2+
or other cations. Removal of Mg2+
, Ca2+
, and Fe2+
was still
significant and may be in the hydroxide forms. Less than 15% of K+ was removed in all
systems, showing that K-struvite precipitation is not significant, but may be occurring.
PO4-P removal with Dow-FeCu regenerant struvite precipitation was 74%. Removal of N
from Dow-FeCu + Zeolite regenerants was 21% which is lower than expected just as with
the other precipitation tests.

95
Table 11: Removal % and initial ion concentration for anion + zeolite regenerant
precipitation
Regeneration Eluate
Source:
LayneRT™
DOW-
Cu 1
DOW-
Cu 2
DOW-
FeCu
% Removal %
Removal
%
Removal
%
Removal
PO4-P 71 13 28 74
NH4-N 19 10 16 21
Mg2+
96 72 66
Ca2+
81 38 45
Al3+
92 39 58
Fe2+
76 80 79
Cu2+
59 13 9
K+ 6 9 12
PO4-P 270 124 120 229
NH4-N 121 54 53 103
Mg2+
172 86 84 273
Ca2+
71 32 31 65
Al3+
78 0.2 0.3 0.1
Fe2+
5.8 7.0 7.3 5.2
Cu2+
0.28 6 21 12
K+ 132 59 58 54
Composition of solids from struvite precipitation of LayneRT™
and Dow-Cu 2
regenerant was analyzed by digesting the solids in nitric acid. Results are shown in Table
12 along with the composition of pure struvite for comparison. P content was similar to
pure struvite for both regenerants; however, N content was only about 25% and 50% of
pure struvite for LayneRT™
and Dow-Cu 2, respectively. Magnesium content was higher
than pure struvite for LayneRT™
regenerant and Ca2+
and Al3+
were a significant portion
of the solids. The magnesium to calcium ratio is about 2:1 in LayneRT™
precipitates.
Calcium precipitation made up more than 25% of the solids content for Dow-Cu 2 and
magnesium content was lower than pure struvite. Formation of calcium and aluminum

96
phosphates reduces the amount of struvite precipitated and therefore explains the lower N
removal with respect to P removal. From the data, it can be concluded that a significant
portion of solids precipitated from LayneRT™
will contain Ca2+
and Al3+
thereby
reducing the purity of the fertilizer and therefore the value. Calcium precipitation is even
more significant in Dow-Cu 2 solids, which poses a concern for the value of the
recoverable.
Table 12: Average solids composition for LayneRT™ and Dow-Cu 2 precipitation
P N Mg Ca K Fe Al Cu Na
% % % % % % % % %
LayneRT™
13.1 1.6 15.7 7 0.1 0.1 8.6 0.0 0.0
Dow-Cu 2 13.2 3.3 5.2 29 0.0 0.8 2.2 0.3 0.0
Pure Struvite 12.6 5.7 9.9 0 0 0 0 0 0

97
4 Conclusions
Conclusions from the batch and column IX testing as well as struvite precipitation
are discussed below. The most significant findings from each testing method are listed in
bullet points, with a detailed description of the conclusions following the bullet points.
4.1 Phosphate Ion Exchange Batch Testing Conclusions
Batch testing greatest removal of P: Dow-Cu>Dow-FeCu> LayneRT™
During batch testing of anion media, it was determined that Dow-Cu, Dow-FeCu,
LayneRT™
, Dow-NAB-Cu, and Dow-HFO were the most effective with greater than
50% PO4-P removal at an initial concentration of 100 mg/l PO4-P. Dow-Cu out-
performed all other resins with 76% removal of PO4-P, the next closest being Dow-FeCu
with 64% removal. Based upon previous column testing research, Dow-FeCu was
expected to exchange the most PO4-P; however, the lower removal may be due the
acid/base pretreatment that removed iron particles from the resin or the kinetics of batch
testing. For the Cu2+
loaded resins, eliminating the acid-base treatment step caused
significant change in adsorptive capacity as Dow-NAB-Cu removed only 53% compared
to the 76% of Dow-Cu; therefore, the extra chemicals required for preparation are likely
worth the expense and time.
Batch desorption of P (%): Dow-FeCu>Dow-Cu>LayneRT™
Regeneration pH: Dow-FeCu (8), Dow-Cu (4.3), LayneRT™
(14)
Regeneration of the anion media following the 100 mg/l PO4-P exchange cycle
showed that greater than 49% of PO4-P could be desorbed from Dow-Cu, Dow-FeCu,
and LayneRT™
. However, each of these resins requires a different regenerant solution.

98
LayneRT™
requires a high pH (14) solution for regeneration; batch testing with NaCl
solution at pH=10, showed inadequate (<1%) PO4-3
desorption during regeneration of
LayneRT™
. Previous work has shown that Dow-Cu and Dow-FeCu require a high salt
concentration solution at pH=4.3. However, a neutral (pH=8) solution was used to
regenerate Dow-FeCu in order to reduce acid requirements and meet the pH required for
struvite precipitation. From the batch test results, the neutral pH was successful in
regenerating Dow-FeCu. These conclusions raise a few questions such as: Is it possible to
regenerate Dow-Cu at a neutral pH?; Is there more copper leaching with neutral pH
regeneration?; What is the effect on subsequent IX capacity? A long-term batch or
column study, greater than 15 cycles, would provide the answers to these questions.
4.2 Zeolite Ion Exchange Batch Testing Conclusions
There is little difference in IX exchange capacity and NH4-N desorption with 5%,
8%, and 10% NaCl regenerants.
Regenerants with a pH>13 negatively impacted subsequent IX capacity of zeolite.
Regenerants containing only Ca(OH)2 or NaOH negatively impact subsequent IX
capacity.
Regenerants 8% NaCl (pH=8) and 7.5% NaCl (pH=12) provided statistically
similar NH4-N exchange and desorption.
NH4-N exchange batch testing with zeolite showed that 5% NaCl concentration
was a slightly less effective regenerant than 8% and 10% NaCl and that regenerant pH
greater than 13 negatively affects subsequent IX capacity. NH4-N removal after 3 IX
cycles was 75%, 85%, and 83% for 5% NaCl, 8% NaCl, and 10% NaCl, respectively.

99
After 7 IX cycles, 7.5% NaCl + 0.5% NaOH was almost as effective as 8% NaCl
solution. However, during intermediate cycles 7.5% NaCl + 0.5% NaOH was not nearly
as effective. Calcium hydroxide was determined to be an ineffective regenerant as high
concentrations resulted in calcium precipitates clogging the media and low concentrations
were ineffective in regeneration. During mixed cation batch testing, exchange capacity of
zeolite during all 7 cycles was similar for 8% NaCl and 7.5% NaCl (pH=12). A focus of
future study may be to reduce the NaCl concentration from 7.5% while keeping the pH of
12 and determining if N exchange and desorption remain similar to the results of the
present study.
4.3 Column Phosphate Ion Exchange Conclusions
Exchange capacity of media: LayneRT™
>Dow-FeCu>Dow-Cu
Dow-HFO-Cu should be tested for comparison
All three anionic resins were able to sustain less than 0.075 mg/l effluent PO4-P
for more than 75 BV of influent wastewater containing approximately 4-6.5 mg/l PO4-P.
Prior to breakthrough (PO4-P>0.075 mg/l), exchange capacity during column testing was
2000, 1490, and 455 mg P/LBV for LayneRT™
, Dow-FeCu, and Dow-Cu, respectively.
LayneRT™
is purchased ready-to-use whereas the other resins must be prepared in the
lab. However, LayneRT™
requires excessive amounts of NaOH to regenerate which may
not be optimal for downstream processes and must be neutralized for disposal. Therefore,
more chemical will be needed to neutralize the highly basic solution (pH>14). Leaching
of metals is not significant with LayneRT™
; however, Dow-Cu leaches copper up to 4
mg/l. Further testing should be conducted to determine the change in exchange capacity

100
over numerous cycles. Also, Dow-HFO-Cu should be tested in column mode as it should
have twice the capacity of LayneRT based on the literature.
Desorption of P: LayneRT™
(89%), Dow-FeCu (91%), Dow-Cu (97%)
Estimated (using regression curves) regeneration volume and PO4-P concentration
after 80% P desorption: LayneRT™
(3.5 BV, 550 mg/l P), Dow-FeCu (3BV, 650
mg/l P), Dow-Cu (1.1 BV, 400 mg/l P)
Regeneration eluate pH: LayneRT™
(7 BV, pH=14), Dow-FeCu (4 BV, pH=9.6),
Dow-Cu (4 BV, pH=9.9)
The most significant leaching for each media was 155 mg/l Al3+
for LayneRT™
, 7
mg/l Cu2+
for Dow-Cu, and 30 mg/l Cu2+
for Dow-FeCu.
Greater than 89% of PO4-P exchanged was desorbed during regeneration of
LayneRT™
, Dow-Cu, and Dow-FeCu. In the first 7 BV, LayneRT regenerant PO4-P
concentration was 536 mg/l and the pH was 14. Therefore, IX with LayneRT™
concentrated PO4-P by a factor of 130. Dow-Cu regenerant had a concentration of 150
mg/l PO4-P in the first 4 BV; however, if only 1.5 BV of regenerant was used, the PO4-P
concentration would have been around 330 mg/l based on regression analysis. Dow-FeCu
regenerant PO4-P concentration was 559 mg/l after 4 BV; however, this concentration
would be greater if less regenerant was utilized. With all resins there is a point of
diminishing return. In other words, there is an optimal volume of regenerant at which
enough PO4-P has been desorbed to provide sufficient IX capacity for the next cycle and
the PO4-P concentration of the regenerant has not been diluted by passing excess
regenerant through the column. Regeneration effluent pH in the first 4 BV was around
9.6-9.9 for both Dow-Cu and Dow-FeCu despite the difference in initial regenerant pH.

101
Aluminum leaching was 155 mg/l for LayneRT™
regenerant while copper leaching was 7
and 30 mg/l for Dow-Cu and Dow-Fe Cu, respectively. Leaching could cause decreased
exchange capacity and impurities in struvite precipitates. According to the data, both
Dow-FeCu and Dow-Cu provide regenerants near optimal pH for struvite precipitation,
while LayneRT™
regenerant would require acid addition. Dow-FeCu requires the least
pH adjustment chemicals; however, there is increased Cu leaching as compared to Dow-
Cu.
4.4 Zeolite Ion Exchange Column Conclusions
Zeolite NH4-N exchange capacity: cycle 1 (4 g/LBV), cycle 2 (6 g/LBV)
Effluent NH4-N was less than 0.2 mg/l during cycle 1 and >0.75 mg/l, but less
than 1.5 mg/l during cycle 2.
Zeolite had an NH4-N exchange capacity of 3.9 and 6.1 g/LBV during IX cycle 1
and 2, respectively. In both cycles the influent NH4-N concentration was about 32-34
mg/l and breakthrough occurred at 120 and 198 BV, respectively. Difference in IX
capacity can mostly be attributed to the difference in influent cations; cycle 2 contained
36% less eq/l of K+, Ca
2+, and Mg
2+ combined. Exchange capacity difference may also be
attributed to the difference in surface ions available for exchange. During IX cycle 1,
there was a release of Na+ and K
+ from the zeolite surface, whereas in cycle 2 only Na
+
was released from the surface. There was also a difference in effluent quality. During IX
cycle 1 effluent NH4-N was maintained well below 0.2 mg/l while IX cycle 2 was
maintained above 0.75 mg/l, but below 1.5 mg/l. Column testing with more cycles may

102
be necessary to provide additional data to determine if IX capacity change is from
variation in ion concentration or regeneration characteristics.
Desorption of NH4-N: cycle 1 (74%), cycle 2 (68%)
Regeneration eluate characteristics: cycle 1 (7 BV, NH4-N=600 mg/l, pH=8.7),
cycle 2 (7 BV, NH4-N=740 mg/l, pH=7.7)
Greater than 74% NH4-N desorption was found during regeneration cycle 1 and 2
using 6% NaCl (pH=11). The resulting brine solutions after 7 BV during cycle 1 and 2
contained 602 and 744 mg/l NH4-N, respectively. Regenerant concentration likely
increased due to increased NH4-N exchange in IX cycle 2 and adsorbed NH4-N
remaining after regeneration cycle 1. Solution pH was 8.7 after cycle 1 and 7.7 after cycle
2. Therefore, pH adjustment may be necessary to meet struvite precipitation conditions
and must be adjusted to about 11 for vacuum ammonia distillation. Future work should
include multiple regeneration cycles to determine if effluent pH continues to be less than
9. Also, a column should be operated with regeneration at an increased pH, such as 12 or
maybe 12.5, to determine the effect on regeneration effluent pH and subsequent IX
capacity.
4.5 Struvite Precipitation Conclusions
PO4-P and NH4-N removal (%) during batch struvite precipitation with zeolite
regenerant, anion regenerant, and Mg2+
solution: LayneRT Regen. (P=74%,
N=19%), Dow-FeCu Regen. (P=71%, N=21%), Dow-Cu Regen. 1 (P=13%,
N=10%), Dow-Cu Regen. 2 (P=28%, N=16%)

103
Solid precipitates P, N, Ca, Mg, Al, and Cu content (% m/m) for batch struvite
precipitation with zeolite regenerant, anion regenerant, and Mg2+
solution:
LayneRT Regen. (P=13%, N=2%, Mg=16%, Ca=7%, Al=9%), Dow-Cu Regen. 2
(P=13%, N=3%, Mg=5%, Ca=29%, Cu=0.3%)
Struvite precipitation in synthetic solutions was determined to be optimal at
pH=10 and therefore anion and cation regenerants were mixed and adjusted to this pH for
batch struvite precipitation. PO4-P removal was 74%, 71%, 13%, and 28% for Dow-
FeCu, LayneRT™
, Dow-Cu 1, and Dow-Cu 2, respectively. Removal percentages may be
limited by batch kinetics as the Dow-Cu precipitation flasks had initial PO4-P
concentration of about 120 mg/l, whereas the other two were greater than 200 mg/l. N
removal was 19% and 21% for LayneRT™
and Dow-FeCu, respectively; however, for the
two regenerants from Dow-Cu it was 10% and 16%. Based on the stoichiometrics, N
removal should equal P removal if struvite was the precipitate. Therefore, other
phosphate precipitates likely exist such as aluminum, calcium, and magnesium
phosphates. Solids analysis revealed that the P content in LayneRT™
and Dow-Cu 2
precipitates were 13% which is similar to the 12.6% pure struvite contains; however, N
content was only 3.3% and 1.6% in Dow-Cu 2 and LayneRT™
solids, respectively,
whereas it should be 5.7%. Mg, Ca, and Al make up a large percentage of the LayneRT™
precipitates. The Al content is 9% which is likely much greater than desired for fertilizer
use. Mg and Ca are the only other solids found in significant concentrations in Dow-Cu
precipitate. More extensive precipitation studies are necessary to determine typical solids
composition during precipitation reactions. This would include testing regenerants from
many column cycles and testing regenerants at a range of pH’s.

104
4.6 Final Conclusions
In conclusion, IX with struvite precipitation is capable of removing P and N to
meet low discharge limits while subsequently recovering P and N. However, the system
must be improved from the current state of this research to be economical and applicable.
Anion exchange media should be investigated further to determine the ability of DOW-
HFO-Cu to remove P and be regenerated at a neutral pH. Long-term small-scale column
studies should be conducted for comparison of IX capacity change in LayneRT™
and
Dow-HFO-Cu. Regenerants should be similar to 2% NaCl + 2% NaOH, 6% NaCl
(pH=8), and 6% NaCl (pH=12) for LayneRT™
, Dow-FeCu, and zeolite, respectively.
Operation of a zeolite column long term would determine change in IX capacity and
regenerant characteristics in various cycles. Regenerant should be recycled in order to
reduce chemical costs. Struvite precipitation should be improved to reduced impurities
and improve P and N removal. Struvite precipitation of column regenerant should be
conducted for many regenerant cycles and at a pH less than 9 using a seeded reactor.
Solids content should be compared to desired fertilizer quality in various agricultural
sectors. Lab-scale vacuum ammonia distillation tests should be conducted using sulfuric
acid or water. The final pH and NH4-N content should be determined during these
studies. Ion exchange with recovery appears to be a technically feasible process;
however, cost estimates for all processes will be necessary to determine the expense in
comparison to conventional nutrient removal methods.

105
5 Bibliography
Adam, C., Peplinski, B.. Michaelis, M., Kley, G., Simon, F. G. (2009) Thermochemical
Treatment of Sewage Sludge Ashes for Phosphorus Recovery. Waste Mgt, 29,
1122-1128.
Adnan, A., Koch, F. A., Mavinic, D. S. (2003) Pilot-scale Study of Phosphorus Recovery
Through Struvite Crystallization – II: Applying In-reactor Supersaturation Ratio
as a Process Control Parameter. Env. Eng. Sci., 2(6), 473-483
Ames, Jr., L. L., Dean, R. B. (1970) Phosphorus Removal from Effluents in Alumina
Columns. J. Wat. Poll. Control Fed., 42(5), R161-R172.
Arbib, Z., Ruiz, J., Alvarez-Diaz, P., Garrido-Perez, C. Barragan, J., Perales J. A. (2013)
Long Term Outdoor Operation of a Tubular Airlift Pilot Photobioreactor and a
High Rate Algal Pond as Tertiary Treatment of Urban Wastewater. Eco. Eng., 52,
143-153.
Barnard, J. L. (2006) Biological Nutrient Removal: Where We Have Been, Where are
We Going? In Proceedings of The Water Environment Federation, WEFTEC
2006, Dallas, Texas, USA, October 21-25, 2006.
Beler-Baykal, B.; Kocaturk, N. P.; Allar, A. D.; Sari, B. (2009) The Effect of Initial
Loading on the Removal of Ammonium and Potassium from Source-separated
Human Urine via Clinoptilolite. Wat. Sci. Tech., 60(10), 2515-2520.
Beler-Baykal, B., Allar, A. D., Bayram, S. (2011) Nitrogen recovery from source-
separated human urine using clinoptilolite and preliminary results of its use as
fertilizer. Wat. Sci. Tech., 63(4), 811-817.
Bhuiyan, M. I. H., Mavinic, D. S., Koch, F. A. (2008) Phosphorus Recovery from
Wastewater Through Struvite Formation in Fluidized Bed Reactors: A
Sustainable Approach. Wat. Sci. Tech., 57(2), 175-181.
Blaney, L. M., Cinar, S., Sengupta, A. K. (2007) Hybrid Anion Exchanger for Trace
Phosphate Removal from Water and Wastewater, Wat. Res., 41, 1603-1613.
Britton, A., Koch, F. A., Mavinic, D. S., Adnan, A., Oldham, W. K., Udala, B. (2005)
Pilot-scale Struvite Recovery from Anaerobic Digester Supernatant at an
Enhanced Biological Phosphorus Removal Wastewater Treatment Plant. Env.
Eng. Sci., 4(4), 265-277.

106
Cai, T., Park, S. Y., Li, Y. (2013) Nutrient Recovery from Wastewater Streams by
Microalgae: Status and Prospects. Renewable & Sustainable Energy Reviews, 19,
360-369.
Canler, J. P.; Perret, J. M. (1994) Biological Aerated Filters: Assessment of the Process
Based on 12 Sewage Treatment Plants. Wat. Sci. Tech., 29(10/11), 13-22.
Camargo, J. A., Alonso, A. (2006) Ecological and Toxicological Effects of Inorganic
Nitrogen Pollution in Aquatic Ecosystems: A Global Assessment. Env.
International, 32, 831-849.
Christenson, L. B., Sims, R. C. (2012) Rotating Algal Biofilm Reactor and Spool
Harvester for Wastewater Treatment with Biofuels By-products. Biotech. Bioeng.,
109(7), 1674-1684.
Clean Water Services. Durham houses first full-scale commercial nutrient recovery
facility in the nation.
http://www.cleanwaterservices.org/AboutUs/WastewaterAndStormwater/Ostara.a
spx (accessed November 14, 2013).
Cordell, D., Drangert, J., White, S. (2009) The Story of Phosphorus: Global Food
Security and Food for Thought. Global Env. Change, 19, 292-305.
Cremaschi, L., Barve, A., Wu, X. (2012) Effect of Condensation Temperature and Water
Quality on Fouling of Brazed-Plate Heat Exchangers. ASHRAE Trans., 118(1),
1086-1100.
Daigger, G. T., Boltz, J. P. (2011) Trickling Filter and Trickling Filter – Suspended
Growth Process Design and Operation: A State-of-the-Art Review. Wat. Env.
Res., 83(5), 388-404.
Diaz, R. J., Rosenberg, R. (2008). Spreading Dead Zones and Consequences for Marine
Ecosystems. Science, 321, 926-929.
DOW. (2013) Dowex Marathon WBA-2. Form No. 177-01788-0310.
Du, Q., Liu, S., Cao, Z., Wang, Y. (2005) Ammonia Removal from Aqueous Solution
Using Natural Chinese Clinoptilolite. Sep. & Purification Tech., 44, 229-234.
Eckenfelder, J., W. W., Ford, D. L., Englande, Jr., A. J. Industrial Water Quality,
McGraw Hill, 4th
edition, 2009, ISBN 978-0-07-154866-3.
El-Bourawi, M. S., Khayet, M., Ma, R., Ding, Z., Li, Z., Zhang, X. (2007) Application of
Vacuum Membrane Distillation for Ammonia Removal. J. Membrane Sci., 301,
200-209

107
European Commission. (2001) Disposal and recycling routes for sewage sludge: Part 3 –
Scientific and technical report.
http://ec.europa.eu/environment/waste/sludge/pdf/sludge_disposal3.pdf (accessed
August 28, 2013).
Evans, T. D.(2009) Recovering Ammonium and Struvite Fertilisers from Digested
Sludge Dewatering Liquors. In Resource Recovery Not Wastewater Treatment.
London, UK, January 22, 2009.
EvTEC. (2000) Verficiation Report for Ammonia Recovery Process. CERF Report
#40458; Environmental Technology Evaluation Center: USA.
Forrest, A. L., Fatah, K. P., Mavinic, D. S., Koch, F. A. (2008) Optimizing Struvite
Production for Phosphate Recovery in WWTP. J. Environ. Eng., 134(5), 395-402.
Gasiunas, V.; Askinis, S. Additional Removal of Phosphorus Using Coagulant by
Purification of Wastewater in Sand Filters. In Research for Rural Development
2011: Annual 17th International Scientific Conference Proceedings.
Gimenez, J. B., Robles, A., Carretero, L., Duran, F., Ruano, M. V., Gatti, M. N., Ribes,
J., Ferrer, J., Seco, A. (2011). Experimental Study of the Anaerobic Urban
Wastewater Treatment in a Submerged Hollow-fibre Membrane Bioreactor at
Pilot Scale. Bioresource Tech., 102, 8799-8806.
Gleason, G. H., Loonam, A. C. (1933) The Development of a Chemical Process for
Treatment of Sewage. Sewage Works J., 5(1), 61-73
Grundestam, J., Hellstrom, D. (2007) Wastewater Treatment with Anaerobic Membrane
Bioreactor and Reverse Osmosis. Wat. Sci. Tech., 55(5), 211-217.
Haandel, A. C., van der Lubbe, J. G. M. Handbook of Wastewater Treatment, Design and
Optimisation of Activated Sludge Systems, IWA Publishing, 2nd
Edition, 2012,
ISBN 9781780400006.
Hao, X., Wang, C., van Loosdrecht, M. C. M., Hu, Y. (2013) Looking Beyond Struvite
for P-Recovery. Env. Sci. Tech., 47, 4965-4966.
Hedstrom, A. (2001) Ion Exchange of Ammonium in Zeolites: A Literature Review. J.
Env. Eng., 127, 673-681.
Hwang, H.; Choi, E. (1998) Nutrient Control with Other Sludges in Anaerobic Digestions
of BPR Sludge. Wat. Sci. Tech., 38(1), 295-302.
Ippersiel, D., Mondor, M., Lamarche, F., Tremblay, F., Dubreuil, J., Masse, L. (2012)
Nitrogen Potential Recovery and Concentration of Ammonia from Swine Manure
Using Electrodialysis Couple with Air Stripping. J. Env. Mgt., 95, 165-169.

108
Jetten, M. S. M., Horn, S. J., van Loosdrecht, M. C. M. (1997) Towards a More
Sustainable Municipal Wastewater Treatment System. Wat. Sci. Tech., 35(9),
171-180.
Johnston, A. E., Richards, I. R. (2004) Effectiveness of Different Precipitated Phosphates
as Phosphorus Sources for Plants. Phosphorus Research Bulletin, 15, 52-59.
Jorgensen, T. C., Weatherley, L. R. (2003) Ammonia Removal from Wastewater by Ion
Exchange in the Presence of Organic Contaminants. Wat. Res., 37, 1723-1728.
Karapinar, N., Hoffmann, E.; Hahn, H. H. (2004). Magnetite Seeded Precipitation of
Phosphate. Wat. Res., 38, 3059-3066.
Karapinar, N., Hoffman, E., Hahn, H.H. (2006) P-Recovery by Secondary Nucleation
and Growth of Calcium Phosphates on Magnetite Mineral. Wat. Res., 40, 1210-
1216.
Kim, J., Kim, K., Ye, H., Lee, E., Shin, C., McCarty, P. L., Bae, J.. (2011) Anaerobic
Fluidized Bed Membrane Bioreactor for Wastewater Treatment. Environ. Sci.
Technol., 45, 576-581.
Kitsopoulos, K. P. (1999) Cation-exchange capacity (CEC) of Zeolitic Volcaniclastic
Materials: Applicability of the Ammonium Acetate Saturation (AMAS) Method.
Clays & Clay Minerals, 47(6), 688-696.
Koon, J. H., Kaufman, W. J. (1975) Ammonia Removal from Municipal Wastewater by
Ion Exchange. J. Water Poll. Control Fed., 47(3), 448-465.
Kumar, M., Badruzzaman, M., Adham, S., Oppenheimer, J. (2007) Beneficial Phosphate
Recovery from Reverse Osmosis Concentrate of an Integrated Membrane System
Using Polymeric Ligand Exchanger. Wat. Res., 41, 2211-2219.
Langlier, W. F. (1936) The Analytical Control of Anti-Corrosion Water Treatment”, J.
American Water Works Assoc., 28, 1500-1521.
Liberti, L., Boari, G., Passino, R. Method for Removing and Recovering Nutrients from
Wastewater. US Patent 4,477,355, October 16, 1984.
Martin, B. D., Parson, S. A., Jefferson, B. (2009) Removal and Recovery of Phosphate
From Municipal Wastewaters Using a Polymeric Anion Exchanger Bound with
Hydrated Ferric Oxide Nanoparticles. Wat. Sci. Tech., 60(10), 2637-2645.

109
Martinez-Sosa, D., Helmreich, B., Netter, T., Paris, S., Bischof, F., Horn, H. (2011)
Anaerobic Submerged Membrane Bioreactor (AnSMBR) for Municipal
Wastewater Treatment under Mesophilic and Psychrophilic Temperature
Conditions. Bioresource Tech., 102, 10377-10385.
Maurer, M., Pronk, W., Larsen, T. A. (2006) Treatment Processes for Source-separated
Urine. Wat. Res., 40, 3151-3166.
Mavinic, D. S., Koch, F.A., Huang, H., Lo, K. V. (2007) Phosphorus Recovery from
Anaerobic Digester Supernatants Using a Pilot-scale Struvite Crystallization
Process. J. Environ. Eng. Sci., 6, 561-571
Metcalf and Eddy, Wastewater Engineering: Treatment and Reuse, McGraw-Hill, 4th
edition, 2003, ISBN 0-07-014878-0.
McCarty, P. L., Bae, J., Kim, J. (2011) Domestic Wastewater Treatment as a Net Energy
Producer-Can This be Achieved? Env. Sci. Tech., 45, 7100-7106.
Mossor-Pietraszewska, T. (2001) Effect of Aluminium on Plant Growth and Metabolism.
Acta. Biochim. Pol., 48(3), 673-686.
Multiform Harvest. Simple and effective nutrient recovery.
http://www.multiformharvest.com/ (accessed November 14, 2013).
Munch, E. V., Barr, K. (2001) Controlled Struvite Crystallization for Removing
Phosphorus from Anaerobic Digester Sidestreams. Wat. Res., 35(1), 151-159.
Muster, T. H., Douglas, G. B., Sherman, N., Seeber, A., Wright, N., Guzukara, Y. (2013)
Towards Effective Phosphorus Recycling from Wastewater: Quantity and
Quality. Chemosphere, 91, 676-684.
Neethling, J. B., Bakke, B., Benisch, M., Gu, A., Stephens, H., Stensel, H. D., Moore, R.
(2005) Factors Influencing the Reliability of Enhanced Biological Phosphorus
Removal. Alexandria, VA: WERF and IWA Publishing.
Newcombe, R. L., Strawn, D. G., Grant, T. M., Childers, S. E., Moller, G. (2008).
Phosphorus Removal from Municipal Wastewater by Hydrous Ferric Oxide
Reactive Filtration and Coupled Chemically Enhanced Secondary Treatment: Part
II-Mechanism. Wat. Env. Res., 80(3), 248-256.
Ni, S., Zhang, J. (2013) Anaerobic Ammonium Oxidation: From Laboratory to Full-Scale
Application. BioMed Res. International, vol. 2013, Article ID 469360, 10 pages.
O’Neal, J. A., Boyer, T. H. (2013) Phosphate Recovery Using Hybrid Anion Exchange:
Applications to Source-Separated Urine and Combined Wastewater Streams. Wat.
Res., 47, 5003-5017.

110
Orentlicher, M., Brown, S., Hall, C. (2007) Centrate Ammonia Reduction with ARP®:
Pilot Data with Synthetic and Actual Wastewaters. In Proceedings of The Water
Environment Federation, Nutrient 2009, Washington, District of Columbia, USA,
June 28 – July 1, 2009.
Orentlicher, M. (2012) Overview of Nitrogen Removal Technologies and
Application/Use of Associated End Products. In Proceedings of Got Manure?
Enhancing Environmental and Economic Sustainability Conference, Liverpool,
New York, USA, March 28-29, 2012.
Pan, B., Wu, J., Pan, B., Lv, L., Zhang, W., Xiao, L., Wang, X., Tao, X., Zheng, S.
(2009) Development of Polymer-based Nanosized Hydrated Ferric Oxides
(HFOs) for Enhanced Phosphate Removal from Waste Effluents. Wat. Res., 43,
4421-4429.
Peret, B., Clement, M., Nussaume, L., Desnos, T. (2011) Root Developmenetal
Adaptation to Phosphate Starvation: Better Safe than Sorry. Trends in Plant Sci.,
16(8), 442-450.
Petruzzelli, D., De Florio, L., Dell’Erba, A., Liberti, L., Notarnicola, M., Sengupta, A. K.
(2003) A New Phosphate-selective Sorbent for the Rem Nut Process. Laboratory
Investigation and Field Experience at a Medium Size Wastewater Treatment
Plant. Wat. Sci. Tech., 48(1), 179-184.
Petruzzelli, D., Dell-Erba, A., Liberti, L., Notarnicola, M., Sengupta, A. K. (2004). A
Phosphate-selective Sorbent for the REM NUT Process: Field Experience at
Massafra Wastewater Treatment Plant. Reactive & Functional Polymers, 60, 195-
202.
Reynolds, T. D., Richards, P. A. (1996) Unit Operations and Processes in Environmental
Engineering, PWS Publishing Co., 2nd
edition, 1996, ISBN 0-534-94884-7.
Rittmann, B. E., Mayer, B., Westerhoff, P., Edwards, M. (2011) Capturing the Lost
Phosphorus. Chemosphere, 84, 846-853
Sedlak, R. I. Phosphorus and Nitrogen Removal from Municipal Wastewater Principles
and Practice, Lewis Publishers, 2nd
edition, 1991, ISBN 0-87371-683-3.
Sendrowski, A., Boyer, T. H. (2013) Phosphate Removal from Urine Using Hybrid
Anion Exchange Resin. Desalination, 322, 104-112.
Sengupta, A., Zhao, D. Selective Removal of Phosphates and Chromates from
Contaminated Water by Ion Exchange. US Patent 6,136,199, October 24, 2000.

111
Sengupta, A. K., Cumbal, H. Hybrid Anion Exchanger for Selective Removal of
Contaminating Ligands from Fluids and Method of Manufacture Thereof. US
Patent 7,291,578, November 6, 2007.
Sengupta, A. K., Cumbal, L. H. Hybrid Anion Exchanger for Selective Removal of
Contaminating Ligands from Fluids and Method of Manufacture Thereof. U.S.
Patent 7,291,578, November 6, 2007.
Sengupta, S., Pandit, A. (2011) Selective Removal of Phosphorus from Wastewater
Combined with its Recovery as a Solid-phase Fertilizer. Wat. Res., 45, 3318-
3330.
Sengputa, S. (2013) Macronutrient Removal and Recovery from Tertiary Treatment of
Wastewater. Novel Solutions to Water Pollution, 1123, Ch. 10, pp. 167-187.
Shu, L., Schneider, P., Jegatheesan, V., Johnson, J. (2006) Economic Evaluation of
Phosphorus Recovery as Struvite from Digester Supernatant. Bioresource Tech.,
97, 2211-2216.
Singh, G., Thomas, P. B. (2012) Nutrient Removal from Membrane Bioreactor Permeate
Using Microalgae and in a Microalgae Membrane Photoreactor. Bioresource.
Tech., 117, 80-85.
Smith, A. L., Stadler, L. B., Love, N. G., Skerlos, S. J., Raskin, L. (2012) Perspectives on
Anaerobic Membrane Bioreactor Treatment of Domestic Wastewater: A Critical
Review. Bioresource Tech., 122, 149-159.
Smith, B. E. (2002) Nitrogenase Reveals its Inner Secrets. Sci., 297, 1654-1655.
Takahashi, M., Kato, S., Shima, H., Sarai, E., Ichioka, T., Hatyakawa, S., Miyajiri, H.
(2001) Technology for Recovering Phosphorus from Incinerated Wastewater
Treatment Sludge. Chemosphere, 44, 23-29.
Teli, A., Antonelli, M., Bonomo, L., Malepi, F. (2012) MBR Fouling Control and
Permeate Quality Enhancement by Polyaluminium Chloride Dosage: A Case
Study. Wat. Sci. Tech., 66(6), 1289-1295.
Turan, M., Celik, M. S. (2003) Regenerability of Turkish Clinoptilolite for use in
Ammonia Removal from Drinking Water. Wat. Sci. Tech., 52(1), 59-66.
Turovskiy, I. S. and P. K. Mathai, Wastewater Sludge Processing, John Wiley & Sons,
Inc., 2006, ISBN 978-0-471-70054-8
USEPA. (1979) Process Design Manual: Sludge Treatment and Disposal; EPA-625/1-
79-011, USEPA:Cincinnati, OH.

112
USEPA. (1980) Innovative and Alternative Technology Assessment Manual; EPA-430/9-
78-009; USEPA: Washington, DC.
USEPA. (1993) Nitrogen Control; EPA/625/R-93/010; USEPA: Washington, DC.
USEPA. (1997) Sidestreams in Wastewater Treatment Plants. J. Wat. Poll. Control Fed.,
59(1), 54-59.
USEPA. (2000a) Wastewater Technology Fact Sheet: Ammonia Stripping; EPA 832-F-
00-019; USEPA: Washington, DC.
USEPA. (2000b) Wastewater Technology Fact Sheet: Chemical Precipitation; EPA 832-
F-00-018; USEPA: Washington, DC.
USEPA. (2010) Nutrient Control Design Manual; EPA/600/R-10/100; USEPA,
Watertown, MA.
USEPA. State Development of Numeric Criteria for Nitrogen and Phosphorus Pollution.
http://cfpub.epa.gov/wqsits/nnc-development/ (accessed Oct 14, 2013).
Uysal, A., Yilmazel, Y. D., Demirer, G. N. (2010) The Determination of Fertilizer
Quality of the Formed Struvite from Effluent of a Sewage Sludge Anaerobic
Digester. J. Haz. Mat., 181, 248-254.
Van der Steen, P., Brenner, A., van Buuren, J., Oron, G. (1998) Post-treatment of UASB
Reactor Effluent in an Integrated Duckweed and Stabilization Pond System. Wat.
Res., 33(3), 615-620.
van Dongen, U., Jetten, M. S. M., van Loosdrecht, M. C. M. (2001) The SHARON-
Anammox Process for Treatment of Ammonium Rich Wastewater. Wat. Sci.
Tech., 44(1), 153-160.
van Loosdrecht, M. C. M., Hao, X., Jetten, M. S. M., Abma, W. (2009) Use of Anammox
in Urban Wastewater Treatment. Wat. Sci. Tech., 41(1), 87-94.
Wang, J., Burken, J. G., Zhang, X., Surampalli, R. (2005). Engineered Struvite
Precipitation: Impacts of Component-Ion Molar Ratios and pH. J. Env. Eng., 131,
1433-1440.
Weatherley, L. R., Miladinovic, N. D. (2004) Comparison of the Ion Exchange Uptake of
Ammonium Ion onto New Zealand Clinoptilolite and Mordenite. Wat. Res., 38,
4305-4312.
Weber, Jr., W. J. Physiochemical Processes for Water Quality Control, John Wiley &
Sons, 1st ed., 1972, ISBN 0-471-92435-0.

113
Wirthensohn, T., Waeger, F., Jelinek, L., Fuchs, W. (2009) Ammonium removal from
anaerobic digester effluent by ion exchange. Wat. Sci. Tech., 60(1), 201-210.
Wu, R. S. S., Lam, K. H., Lee, J. M. N., Lau, T. C. (2007) Removal of Phosphate from
Water by a Highly Selective La(III)-chelex Resin. Chemosphere, 69, 289-294.
Xu, K., Wang, C., Liu, H., Qian, Y. (2011). Simultaneous Removal of Phosphorus and
Potassium from Synthetic Urine Through the Precipitation of Magnesium
Potassium Phosphate. Chemosphere, 84, 207-212.
Yilmazel, Y. D., Demirer, G. N. (2011). Removal and Recovery of Nutrients as Struvite
from Anaerobic Digestion Residues of Poultry Manure. Env. Tech., 32(7), 783-
794.
Yoo, R., Kim, J., McCarty, P. L., Bae, J. (2012) Anaerobic Treatment of Municipal
Wastewater with a Staged Anaerobic Fluidized Membrane Bioreactor (SAF-
MBR) System. Bioresource Tech., 120, 133-139.
Zhang, L., Jiang, J., Yang, J., Hira, D., Furukawa, K. (2012) High Rate Nitrogen
Removal by the CANON Process at Ambient Temperature. Wat. Sci. Tech.,
65(10), 1826-1833.
Zhao, D., Sengupta, A. K. (1996) Selective Removal and Recovery of Phosphate in a
Novel Fixed-bed Process. Wat. Sci. Tech., 33(10-11), 139-147.
Zhao, D., Sengupta, A. K. (1997) Ultimate Removal of Phosphate from Wastewater
Using a New Class of Polymeric Ion Exchangers. Wat. Res., 32(5), 1613-1625.
Zhu, X., Jyo, A. (2005) Column-mode Phosphate Removal by a Novel Highly Selective
Adsorbent. Wat. Res., 39, 2301-2308.

114
Appendix A
Table A1: Nitrogen removal technology list
Nitrogen Removal Technology Recoverables
Ammonia Distillation Ammonium sulfate
Ammonia stripping Ammonium sulfate
Vacuum membrane distillation Ammonium sulfate
Algae Biomass
Biological aerated filter Biomass
Downflow-hanging sponge Biomass
Fluidized bed bioreactor (FBBR) Biomass
Moving bed biofilm reactor
(MBBR) Biomass
Rotating biological contactor Biomass
Sequencing batch reactor Biomass
SHARON-Anammox Biomass
Trickling filter Biomass
Upflow submerged Biomass
Electrodialysis
Concentrated
solution
Ion Exchange
Concentrated
solution
Breakpoint chlorination None
Electrochemical Oxidation None
Duckweed Plant biomass
Struvite Struvite

115
Table A2: Phosphorus removal technology list
Phosphorus Removal Technology Recoverables
Algae Biomass
Enhanced biological phosphorus
removal Biomass
Adsorption Concentrated solution
Electrodialysis Concentrated solution
Ion exchange Concentrated solution
Iron-Oxide Coated Filtration
Ferric phosphate
sludge
Precipitation w/ alum, ferric, lime,
PACl
Metal phosphate
sludge
Ballasted Flocculation Phosphate sludge
Thermal-metallurgical Phosphorus ash
Wet chemical Phosphorus ash
Duckweed Plant biomass
Struvite Struvite
Table A3: Student t-test results for zeolite IX in mixed cation solution (IX cycle 5)
P-values 0.1% NaOH 8% NaCl 7.5% NaCl
pH=12
8% NaCl 0.026
7.5% NaCl
pH=12
0.014 0.735
0.1% Ca(OH)2 0.002 0.0008 0.0004
Table A4: P-values for F-test of zeolite IX in mixed cation solution (IX cycle 5)
P-values 0.1% NaOH 8% NaCl 7.5% NaCl
pH=12
8% NaCl 0.0065
7.5% NaCl
pH=12
0.812 0.0044
0.1% Ca(OH)2 0.299 0.036 0.215

116
Table A5: P-values for F-test of spiked phosphate IX
DOW-
Acid/Base-
Cu
DOW-
FeCu LayneRT
DOW-
Cu
DOW-
HFO
AA
neutral
AA
basic
DOW-FeCu 0.15
LayneRT 0.13 0.86
DOW-Cu 0.21 0.70 0.58
DOW-HFO 0.41 0.45 0.39 0.60
AA neutral 0.15 1.00 0.87 0.70 0.45
AA basic 0.20 0.75 0.63 0.94 0.57 0.75
DOW-Mn-
Alum 0.28 0.45 0.36 0.70 0.79 0.45 0.65
Table A6: Student t-test p-values for spiked phosphate regeneration
DOW -
Cu
DOW-
FeCu
LayneRT™
DOW-
NAB-
Cu
DOW-
HFO
AA
neutral
DOW-FeCu 0.30
LayneRT™
0.080 0.0063
DOW-Cu 0.0089 0.0005 0.015
DOW-HFO 0.0061 0.0002 0.0009 0.0011
AA neutral 0.0061 0.0004 0.0048 0.076 0.0053
AA basic 0.55 0.22 0.72 0.16 0.047 0.075
Table A7: P-values for F-test of spiked phosphate regeneration
DOW-
Acid/Base-
Cu
DOW-
FeCu LayneRT
DOW-
Cu
DOW-
HFO
AA
neutral
DOW-
FeCu 0.42
LayneRT 0.40 0.96
DOW-Cu 0.25 0.69 0.72
DOW-
HFO 0.30 0.58 0.60 0.78
AA neutral 0.12 0.36 0.38 0.59 0.91
AA basic 0.96 0.45 0.43 0.28 0.31 0.13

117
Table A8: SSWRF Secondary Effluent Characteristics
NH4-N mg/l 1.5 Be µg/l ND2
TP mg/l 0.4 Cr µg/l ND
PO4-P mg/l 0.2 Mn µg/l ND
orgP mg/l 0.2 Fe mg/l ND
Alkalinity
mg/l as
CaCO3 267 Co µg/l ND
BOD5 mg/l 12 Ni µg/l ND
BODL mg/l 18 Cu µg/l 18
Cl- mg/l 90 Zn µg/l ND
SO4-S mg/l 26 As µg/l ND
S2-
mg/l 7 Se µg/l ND
NO3-N mg/l 3.9 Mo µg/l ND
K+ mg/l 79 Ag µg/l ND
Ca2+
mg/l 9 Cd µg/l ND
Mg2+
mg/l 36 Hg µg/l ND
Na+ mg/l 158 Pb µg/l ND
Al µg/l 124
2 ND-Non detect or below detection limit

118
Table A9: Anion IX effluent metals
LayneRT™
Na Mg Al K Ca Mn Cu
BV mg/l mg/l µg/l mg/l mg/l µg/l µg/l
0 123.5 26.2 44.9 7.7 68.0 9.0 36.0
238 117.6 27.2 35.8 7.1 60.2 4.6 35.6
475 122.6 28.3 22.7 7.5 66.9 4.2 39.5
DOW-Cu
1 130.1 29.7 49.1 9.8 67.1 105.1 2949.3
127.9 29.4 26.7 9.6 65.8 103.3 1238.0
127.6 29.3 70.3 9.5 65.7 84.2 1340.9
127.1 29.1 47.1 9.5 65.5 72.0 919.8
Dow-Cu 2 127.4 29.4 116.4 9.5 66.5 89.9 3603.0
128.4 29.3 54.5 9.5 65.3 84.4 1092.1
128.7 29.5 37.3 9.6 65.9 80.8 1274.4
130.3 29.9 489.4 9.8 65.9 72.5 1036.0

119
Table A10: Ion concentrations in anion and zeolite regenerants
Volume PO4-P Al Cu Fe Na Ca
mL mg/l mg/l mg/l mg/l mg/l mg/l
LayneRT™
250 536 155 0.49 8.0 12873 0.1
DOW-Cu
1 140
151 0.23 6.7 7.6
17155
0.1
DOW-Cu
2 140
150 0.33 26 8.2
16707
0.1
DOW-
FeCu 140
559 0.25 30 9.1
17130
11
Zeolite 1 250 0.22 0.15 8.6 13323 353
Zeolite 2 250 0.23 0.16 11 16239 392
Volume NH4-N Mg K Mn Ni Mo
mL mg/l mg/l mg/l µg/l µg/l µg/l
LayneRT™
250 0.40 0 51 482 417
DOW-Cu
1 140
1.5
0
78 255 223
DOW-Cu
2 140
1.8
0
46 125 164
DOW-
FeCu 140
2.5 0
x 107 x
Zeolite 1 250 602 23 655 80 121 0
Zeolite 2 250 744 24 318 74 155 x

120
Figure A1: Zeolite IX cycle 1 effluent cations vs BV treated.
Figure A2: Zeolite IX cycle 2 effluent cations vs BV treated
0
50
100
150
200
250
300
350
400
0 50 100 150 200 250 300
Effl
ue
nt
Co
nce
ntr
atio
n (
mg/
l)
Bed Volumes Treated
NH4-N
K+
Ca2+
Mg2+
Na+
0
20
40
60
80
100
120
140
160
180
200
0 50 100 150 200 250 300
Effl
ue
nt
Co
nce
ntr
atio
n (
mg/
l)
Bed Volumes
NH4-N
K+
Ca2+
Mg2+
Na+

121
Figure A3: Zeolite IX cycle 1 effluent metals vs BV treated
Figure A4: Conditional struvite solubility product vs pH for synthetic solution N-
struvite precipitation
0
20
40
60
80
100
120
140
0 50 100 150 200 250 300
Co
nce
ntr
atio
n (μ
g/l)
Bed Volumes Treated
Al
Mn
Cu
Mo
Pb
y = -0.2351x2 + 5.4567x - 22.59 R² = 0.9223
0.0
1.0
2.0
3.0
4.0
5.0
6.0
7.0
8.0
9.0
10.0
8 9 10 11 12 13 14
pP
s
pH