iowa fine particulate monitoring network design values ... · 2012-2014. iowa dnr . ambient air...
TRANSCRIPT

Iowa Fine Particulate Monitoring Network Design Values
2012-2014
Iowa DNR Ambient Air Monitoring
Group

The term “particulate matter” (PM) includes both solid particles and liquid droplets (excluding water droplets) that are found in outdoor air. Particulate matter may be emitted directly into the air or can form from pollutants that react in the atmosphere. Small particles tend to pose the greatest health concern because they can be inhaled into and accumulate in the respiratory system.
Particles of less than 2.5 microns in diameter are referred to as fine particulate or PM2.5.
Sources of PM2.5 emissions include all types of combustion (motor vehicles, power plants, wood burning, etc.) and some industrial processes. Secondary PM2.5 is produced in the atmosphere away from sources through atmospheric chemistry.
What is Fine Particulate Matter (PM2.5)?

What are the Design Values for PM2.5?
Design values for PM2.5 are numbers that are calculated from three years of data gathered at a particular monitoring site. If a design value is greater than the associated standard, the monitor is said to “fail the attainment test”. The annual standard for PM2.5 is 12.0 µg/m3 and the twenty-four hour standard is 35 µg/m3. The design value for the 24-hour PM2.5 standard is the three year average of the annual 98th percentile values measured at a monitoring site. The design value for the annual PM2.5 standard is the three year average of the annual averages measured at a monitoring site. Additional details about design value calculations are contained in 40 CFR Part 50 Appendix N.

Data Completeness and Validation
If a monitor records 75% of the scheduled samples in each quarter of the year, the year’s data is considered complete. EPA allows the use of data substitution in some cases where data is close to the 75% goal. Data used in this report includes all monitors with complete data for 2012-2014 as well as data from four sites where substitution was performed.
All values in this report should be considered preliminary. Data values will be certified in May, 2015 and EPA will calculate design values for determination of compliance with the National Ambient Air Quality Standards (NAAQS) later this year.
All Iowa monitoring sites currently have annual and 24-hour design values less than the NAAQS.

What Types of PM2.5 Monitoring Data May be Used to Calculate Design Values?
Iowa currently operates two different types of PM2.5 samplers. One type collects fine particles by drawing ambient air through a filter over a 24-hour period. The filters are then returned to an analytical laboratory where they are weighed. Provided EPA protocols for handling and weighing the filters are followed, these manual samplers produce data that may be used for design value calculations. Although manual samplers provide accurate concentrations, the data produced is not available in real time, and so EPA has encouraged States to use automated continuous samplers to inform the public of current air quality levels.
EPA has approved the use of certain types of continuous samplers for computing design values, but advises States to conduct ongoing evaluations of the comparability of the data from these samplers to filter samplers. Iowa's humid summers and wintertime nitrate episodes represent a challenging environment in which to demonstrate this comparability. Iowa continues to evaluate the performance of continuous samplers with designs that are similar to those approved by EPA, but, to date, has not been able to consistently demonstrate comparability of the data generated from continuous samplers to filter sampler data.

Iowa PM2.5 Monitors (2014) AQS Site ID Site Name Location County
190130009 Water Tower Waterloo Blackhawk 190450019 Chancy Park Clinton Clinton 190450021 Rainbow Park Clinton Clinton 190550001 Backbone State Park Rural Site Buchanan 191032001 Hoover Sch. Iowa City Johnson 191110008 Fire Station Keokuk Lee 191130040 Public Health Cedar Rapids Linn 191370002 Viking Lake State Park Rural Site Montgomery 191390015 Muscatine HS E Campus (Garfield) Muscatine Muscatine 191390016 Muscatine, Greenwood Cemetery Muscatine Muscatine 191390018 Muscatine, Franklin School Muscatine Muscatine 191390020 Muscatine, Musser Park Muscatine Muscatine 191471002 Iowa Lakes Community College Emmetsburg Palo Alto 191530030 Public Health Des Moines Polk 191532510 Indian Hills School Clive Polk 191550009 Franklin Sch. Council Bluffs Pottawattamie 191630015 Jefferson School Davenport Scott 191630018 Adams Sch. Davenport Scott 191630020 Hayes School Davenport Scott 191770006 Lake Sugema Rural Site Van Buren 191930019 Bryant School Sioux City Woodbury

Iowa PM2.5 Design Values 2014 – Preliminary Until May 2015
County Site Name City EPA Site Id Year
Annual 98th Percentile
(μg/m3)
Daily Design Value
(μg/m3)
Annual Mean
(μg/m3)
Annual Design Value
(μg/m3) Black Hawk Water Tower Waterloo 19-013-0009 2012 22.5 9.9
2013 18.0 9.3 2014 21.1 21 9.3 9.5
Clinton Chancy Park Clinton 19-045-0019 2012 23.7 10.7 2013 25.6 10.7 2014 28.2 26 10.4 10.6**
Clinton Rainbow Park Clinton 19-045-0021 2012 22.9 9.7 2013 22.6 9.5 2014 24.8* 23 9.3* 9.5
Buchanan Backbone State Park Not in a City 19-055-0001 2012 19.8 9.0 2013 20.5 8.9 2014 23.6 21 9.0 9.0
Johnson Hoover Sch. Iowa City 19-103-2001 2012 21.8 9.6 2013 20.5 9.0 2014 23.8* 22 9.0* 9.2
Lee Fire Station Keokuk 19-111-0008 2012 22.7* 11.0* 2013 24.8 10.7 2014 24.8 24 10.7 10.8
Linn Public Health Cedar Rapids 19-113-0040 2012 22.5 9.5 2013 21.8 9.5 2014 24.1 23 9.7 9.5
Montgomery Viking Lake State Park Not in a City 19-137-0002 2012 20.5 8.8 2013 21.0 8.3 2014 18.4 20 7.7 8.3
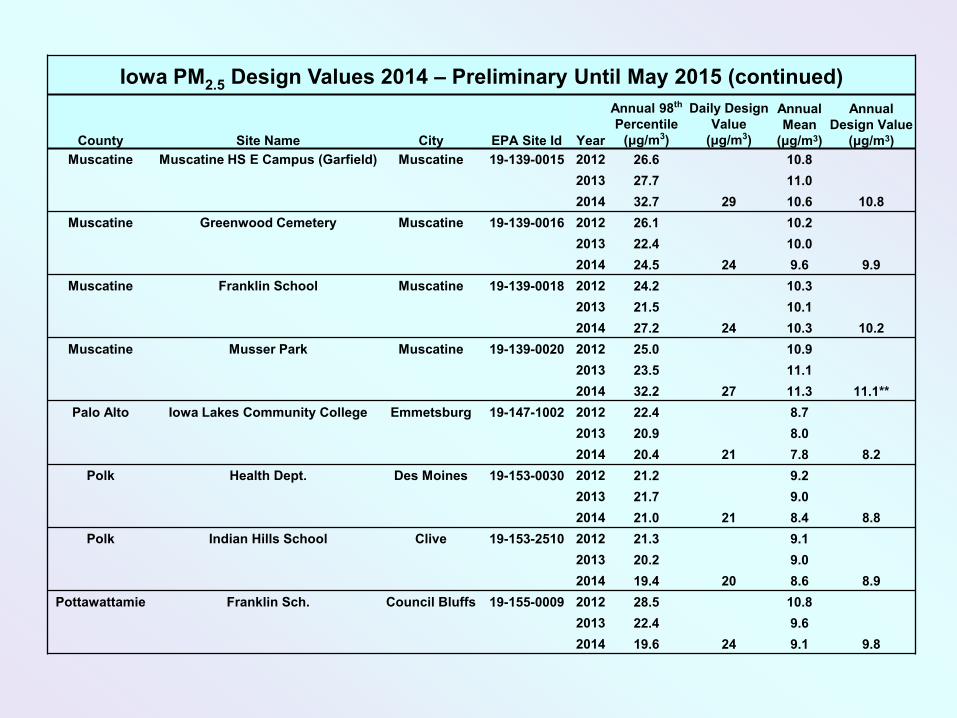
Iowa PM2.5 Design Values 2014 – Preliminary Until May 2015 (continued)
County Site Name City EPA Site Id Year
Annual 98th Percentile
(μg/m3)
Daily Design Value
(μg/m3)
Annual Mean
(μg/m3)
Annual Design Value
(μg/m3) Muscatine Muscatine HS E Campus (Garfield) Muscatine 19-139-0015 2012 26.6 10.8
2013 27.7 11.0 2014 32.7 29 10.6 10.8
Muscatine Greenwood Cemetery Muscatine 19-139-0016 2012 26.1 10.2 2013 22.4 10.0 2014 24.5 24 9.6 9.9
Muscatine Franklin School Muscatine 19-139-0018 2012 24.2 10.3 2013 21.5 10.1 2014 27.2 24 10.3 10.2
Muscatine Musser Park Muscatine 19-139-0020 2012 25.0 10.9 2013 23.5 11.1 2014 32.2 27 11.3 11.1**
Palo Alto Iowa Lakes Community College Emmetsburg 19-147-1002 2012 22.4 8.7 2013 20.9 8.0 2014 20.4 21 7.8 8.2
Polk Health Dept. Des Moines 19-153-0030 2012 21.2 9.2 2013 21.7 9.0 2014 21.0 21 8.4 8.8
Polk Indian Hills School Clive 19-153-2510 2012 21.3 9.1 2013 20.2 9.0 2014 19.4 20 8.6 8.9
Pottawattamie Franklin Sch. Council Bluffs 19-155-0009 2012 28.5 10.8 2013 22.4 9.6 2014 19.6 24 9.1 9.8

Iowa PM2.5 Design Values 2014 – Preliminary Until May 2015 (continued)
County Site Name City EPA Site Id Year
Annual 98th Percentile
(μg/m3)
Daily Design Value
(μg/m3)
Annual Mean
(μg/m3)
Annual Design Value
(μg/m3) Scott Jefferson School Davenport 19-163-0015 2012 22.0 9.8
2013 23.4 9.7 2014 24.3 23 9.4 9.6
Scott Adams Sch. Davenport 19-163-0018 2012 21.7 10.0 2013 22.4 9.8 2014 24.8 23 10.3 10.0
Scott Hayes School Davenport 19-163-0020 2012 24.6 10.4 2013 26.1 10.4 2014 26.6* 26 10.0* 10.3
Van Buren Lake Sugema Not in a City 19-177-0006 2012 20.6 8.5 2013 18.2 8.2 2014 22.0 20 8.6 8.4
Woodbury Bryant School Sioux City 19-193-0019 2012 24.9 9.7 2013 21.5 9.3 2014 24.5 24 8.4 9.1
Three -year averages greater than 12.05 μg/m3 indicate non-attainment with the NAAQS. *Data did not meet completeness requirements, but annual and daily design values passed substitution tests and are considered valid.
**Source-oriented site. Therefore annual design values are not applicable to the NAAQS.

Iowa PM2.5 24-hour Design Values 2012-2014 (NAAQS Standard is 35 µg/m3)

24-hour PM2.5 Design Values 2012-2014 (NAAQS Standard is 35 µg/m3)
0
5
10
15
20
25
30
353
-ye
ar a
vera
ge µ
g/m
3

Iowa PM2.5 Annual Design Values 2012-2014 (NAAQS Standard is 12.0 µg/m3)
* = Source Oriented Site (Annual Standard Does Not Apply)

Annual PM2.5 Design Values 2012-2014 (NAAQS Standard is 12.0 µg/m3)
0
2
4
6
8
10
123
-ye
ar a
vera
ge µ
g/m
3

0
5
10
15
20
25
30
35
40
45
50
55
60
65
70
2003-2005 2004-2006 2005-2007 2006-2008 2007-2009 2008-2010 2009-2011 2010-2012 2011-2013 2012-2014
Des
ign
Valu
e (µ
g/m
3 )
Three Year Period
Median PM2.5 24-Hour Design Values in Iowa PM2.5 Monitoring Network
Median EPA Standard

8
9
10
11
12
13
14
15
16
17
18
2003-2005 2004-2006 2005-2007 2006-2008 2007-2009 2008-2010 2009-2011 2010-2012 2011-2013 2012-2014
Des
ign
Valu
e (µ
g/m
3 )
Three Year Period
Median PM2.5 Annual Design Values in Iowa PM2.5 Monitoring Network (source oriented monitoring sites are not included)
Median EPA NAAQS

Web Resources
Calculation of the PM2.5 Design Values is treated in Appendix N of 40 CFR Pt. 50:
http://www.ecfr.gov/cgi-bin/text-idx?tpl=/ecfrbrowse/Title40/40cfr50_main_02.tpl
EPA’s Design Value calculations for PM2.5 and other pollutants: http://www.epa.gov/airtrends/values.html
Information from EPA on PM2.5 standards: http://www.epa.gov/airquality/particlepollution/actions.html#dec12
Historical Air Pollution Data for Iowa and Other States: http://www.epa.gov/airdata/
Web links listed are as accessed on 2/16/2015.