ipho
DESCRIPTION
45th IPhoTRANSCRIPT

Theoretical competition14.07.2014
Problem 1 – 9 points
Problem 2 – 12 points
Problem 3 – 9 points
Problem 1
This problem consists of three independent parts:
Part A – mechanics;
Part B – molecular physics;
Part C – electricity.
Problem 1. Part A
Problem 1. Part A
Problem 1. Part A
Problem 1. Part B
Competence in thermodynamics; equation for small oscillations
Question B1
Question B2
Problem 1. Part C
Competence in LC circuits; vector diagrams
Problem 1. Part C
Problem 1. Part C
Problem 1. Part C
Problem 1. Part C
Theoretical competition. Tuesday, 15 July 2014 1/1
Problem 1 (9 points) This problem consists of three independent parts.
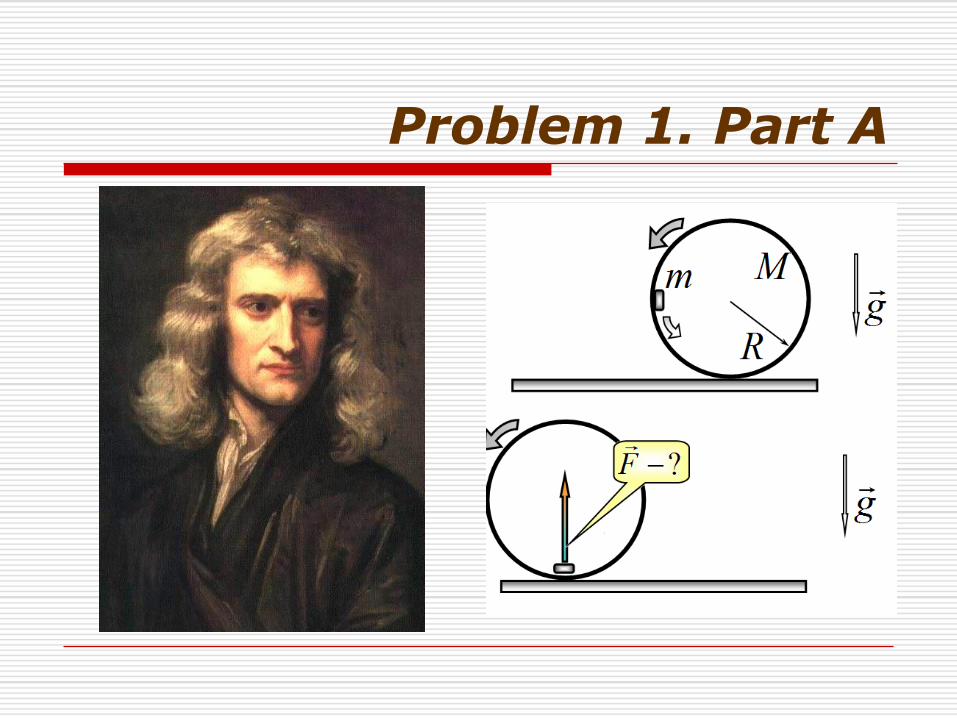
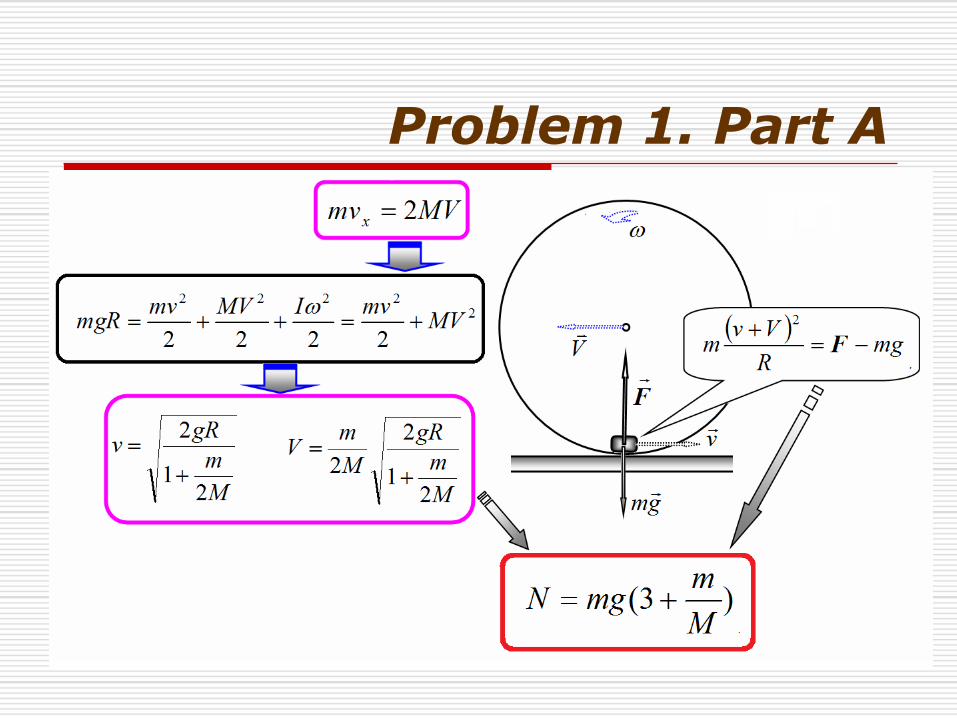
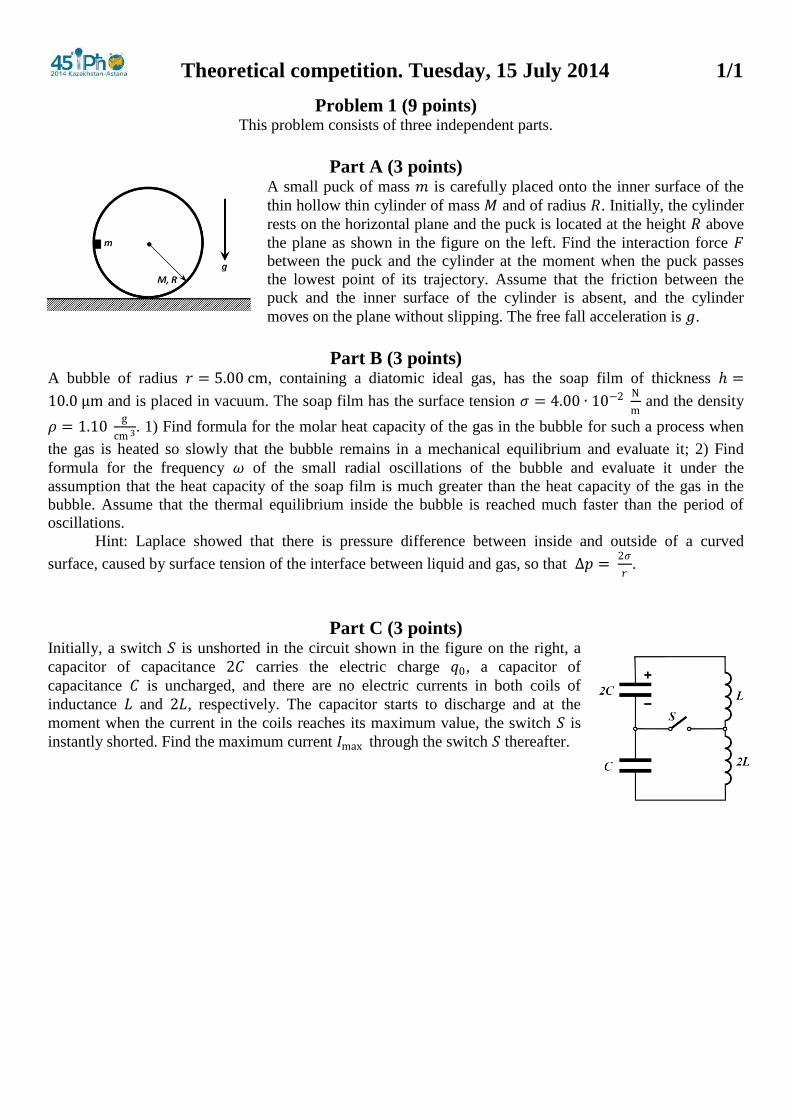
Part A (3 points) A small puck of mass 𝑚 is carefully placed onto the inner surface of the
thin hollow thin cylinder of mass 𝑀 and of radius 𝑅. Initially, the cylinder
rests on the horizontal plane and the puck is located at the height 𝑅 above
the plane as shown in the figure on the left. Find the interaction force 𝐹
between the puck and the cylinder at the moment when the puck passes
the lowest point of its trajectory. Assume that the friction between the
puck and the inner surface of the cylinder is absent, and the cylinder
moves on the plane without slipping. The free fall acceleration is 𝑔.
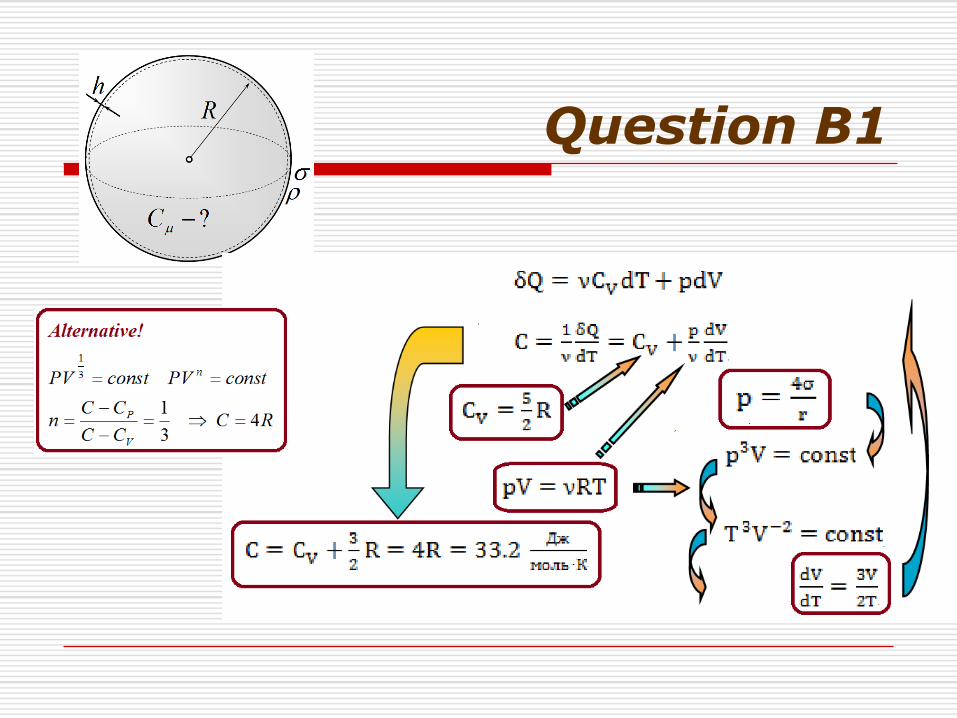
Part B (3 points) A bubble of radius 𝑟 = 5.00 cm, containing a diatomic ideal gas, has the soap film of thickness ℎ =
10.0 μm and is placed in vacuum. The soap film has the surface tension 𝜎 = 4.00 ∙ 10−2 N
m and the density
𝜌 = 1.10 g
cm 3. 1) Find formula for the molar heat capacity of the gas in the bubble for such a process when
the gas is heated so slowly that the bubble remains in a mechanical equilibrium and evaluate it; 2) Find
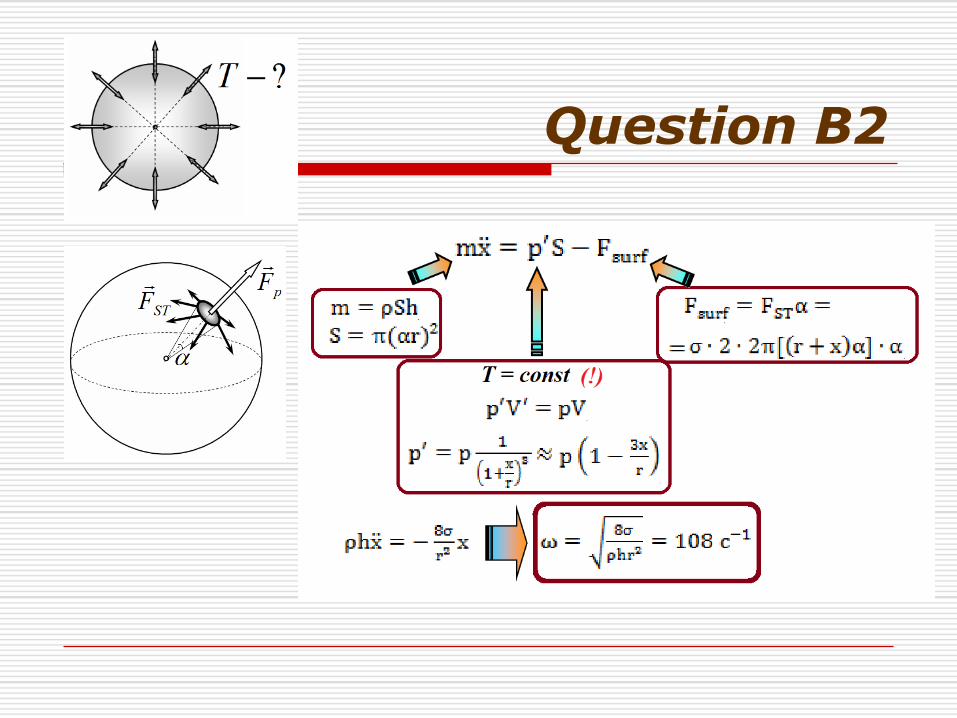
formula for the frequency 𝜔 of the small radial oscillations of the bubble and evaluate it under the
assumption that the heat capacity of the soap film is much greater than the heat capacity of the gas in the
bubble. Assume that the thermal equilibrium inside the bubble is reached much faster than the period of
oscillations.
Hint: Laplace showed that there is pressure difference between inside and outside of a curved
surface, caused by surface tension of the interface between liquid and gas, so that ∆𝑝 = 2𝜎
𝑟.
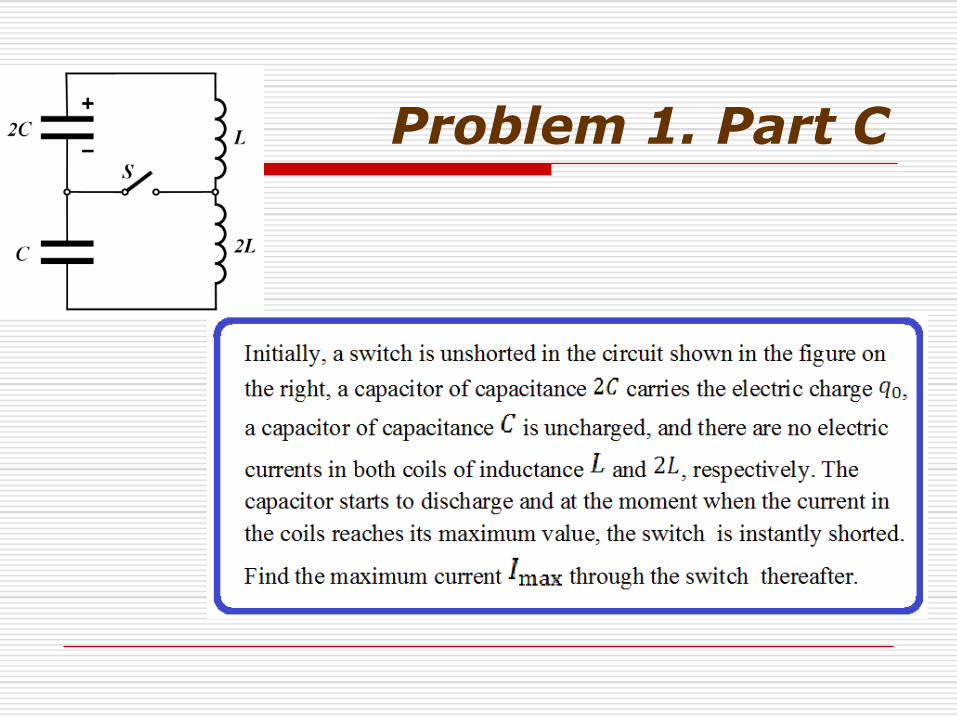
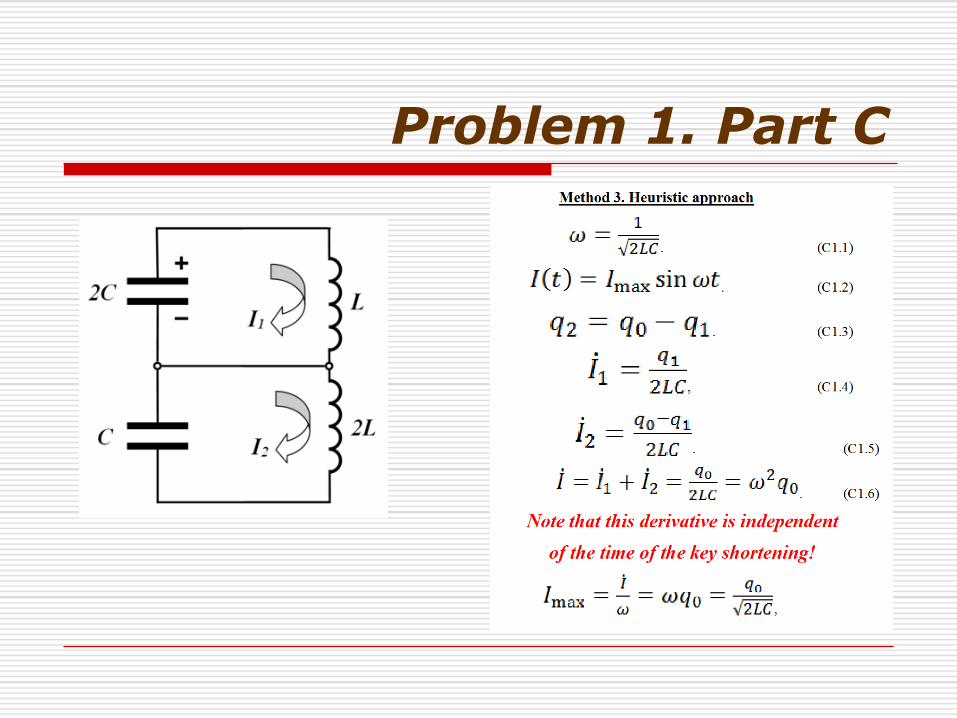
Part C (3 points) Initially, a switch 𝑆 is unshorted in the circuit shown in the figure on the right, a
capacitor of capacitance 2𝐶 carries the electric charge 𝑞0, a capacitor of
capacitance 𝐶 is uncharged, and there are no electric currents in both coils of
inductance 𝐿 and 2𝐿, respectively. The capacitor starts to discharge and at the
moment when the current in the coils reaches its maximum value, the switch 𝑆 is
instantly shorted. Find the maximum current 𝐼max through the switch 𝑆 thereafter.
Theoretical competition. Tuesday, 15 July 2014 1/4
Problem 1 Solution
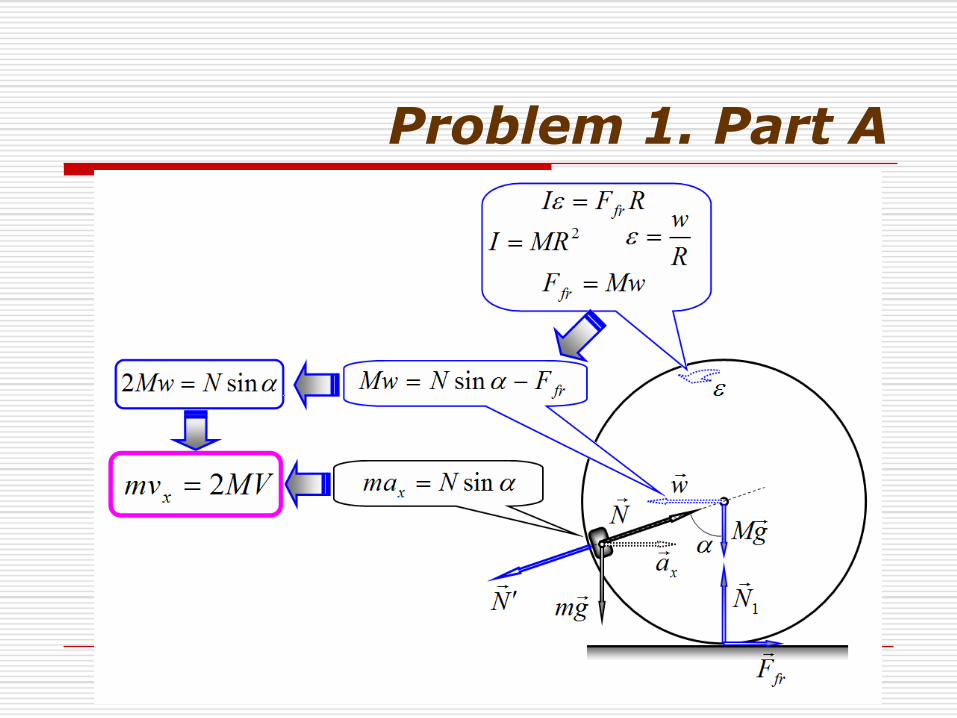
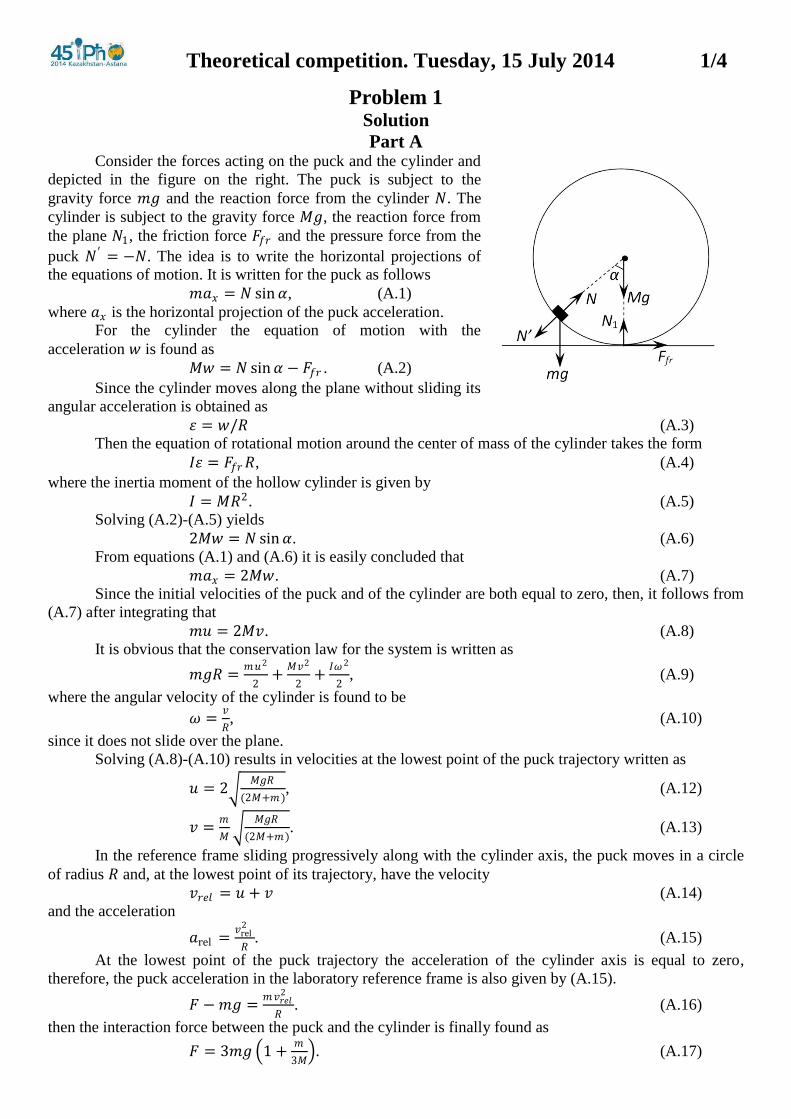
Part A Consider the forces acting on the puck and the cylinder and
depicted in the figure on the right. The puck is subject to the
gravity force 𝑚𝑔 and the reaction force from the cylinder 𝑁. The
cylinder is subject to the gravity force 𝑀𝑔, the reaction force from
the plane 𝑁1, the friction force 𝐹𝑓𝑟 and the pressure force from the
puck 𝑁′ = −𝑁. The idea is to write the horizontal projections of
the equations of motion. It is written for the puck as follows
𝑚𝑎𝑥 = 𝑁 sin𝛼, (A.1)
where 𝑎𝑥 is the horizontal projection of the puck acceleration.
For the cylinder the equation of motion with the
acceleration 𝑤 is found as
𝑀𝑤 = 𝑁 sin𝛼 − 𝐹𝑓𝑟 . (A.2)
Since the cylinder moves along the plane without sliding its
angular acceleration is obtained as
휀 = 𝑤/𝑅 (A.3)
Then the equation of rotational motion around the center of mass of the cylinder takes the form
𝐼휀 = 𝐹𝑓𝑟𝑅, (A.4)
where the inertia moment of the hollow cylinder is given by
𝐼 = 𝑀𝑅2. (A.5)
Solving (A.2)-(A.5) yields
2𝑀𝑤 = 𝑁 sin𝛼. (A.6)
From equations (A.1) and (A.6) it is easily concluded that
𝑚𝑎𝑥 = 2𝑀𝑤. (A.7)
Since the initial velocities of the puck and of the cylinder are both equal to zero, then, it follows from
(A.7) after integrating that
𝑚𝑢 = 2𝑀𝑣. (A.8)
It is obvious that the conservation law for the system is written as
𝑚𝑔𝑅 =𝑚𝑢2
2+
𝑀𝑣2
2+
𝐼𝜔2
2, (A.9)
where the angular velocity of the cylinder is found to be
𝜔 =𝑣
𝑅, (A.10)
since it does not slide over the plane.
Solving (A.8)-(A.10) results in velocities at the lowest point of the puck trajectory written as
𝑢 = 2 𝑀𝑔𝑅
(2𝑀+𝑚), (A.12)
𝑣 =𝑚
𝑀
𝑀𝑔𝑅
(2𝑀+𝑚). (A.13)
In the reference frame sliding progressively along with the cylinder axis, the puck moves in a circle
of radius 𝑅 and, at the lowest point of its trajectory, have the velocity
𝑣𝑟𝑒𝑙 = 𝑢 + 𝑣 (A.14)
and the acceleration
𝑎rel =𝑣rel
2
𝑅. (A.15)
At the lowest point of the puck trajectory the acceleration of the cylinder axis is equal to zero,
therefore, the puck acceleration in the laboratory reference frame is also given by (A.15).
𝐹 −𝑚𝑔 =𝑚𝑣𝑟𝑒𝑙
2
𝑅. (A.16)
then the interaction force between the puck and the cylinder is finally found as
𝐹 = 3𝑚𝑔 1 +𝑚
3𝑀 . (A.17)
Theoretical competition. Tuesday, 15 July 2014 2/4
Part B 1) According to the first law of thermodynamics, the amount of heat transmitted 𝛿𝑄 to the gas in the
bubble is found as
𝛿𝑄 = 𝑣𝐶𝑉𝑑𝑇 + 𝑝𝑑𝑉, (B.1)
where the molar heat capacity at arbitrary process is as follows
𝐶 =1
𝑣
𝛿𝑄
𝑑𝑇= 𝐶𝑉 +
𝑝
𝑣
𝑑𝑉
𝑑𝑇. (B.2)
Here 𝐶𝑉 stands for the molar heat capacity of the gas at constant volume, 𝑝 designates its pressure, 𝑣 is the
total amount of moles of gas in the bubble, 𝑉 and 𝑇 denote the volume and temperature of the gas,
respectively.
Evaluate the derivative standing on the right hand side of (B.2). According to the Laplace formula,
the gas pressure inside the bubble is defined by
𝑝 =4𝜍
𝑟, (B.3)
thus, the equation of any equilibrium process with the gas in the bubble is a polytrope of the form
𝑝3𝑉 = const. (B.4)
The equation of state of an ideal gas has the form
𝑝𝑉 = 𝑣𝑅𝑇, (B.5)
and hence equation (B.4) can be rewritten as
𝑇3𝑉−2 = const. (B.6)
Differentiating (B.6) the derivative with respect to temperature sought is found as
𝑑𝑉
𝑑𝑇=
3𝑉
2𝑇. (B.7)
Taking into account that the molar heat capacity of a diatomic gas at constant volume is
𝐶𝑉 =5
2𝑅, (B.8)
and using (B.5) it is finally obtained that
𝐶 = 𝐶𝑉 +3
2𝑅 = 4𝑅 = 33.2
J
mole ∙K. (B.9)
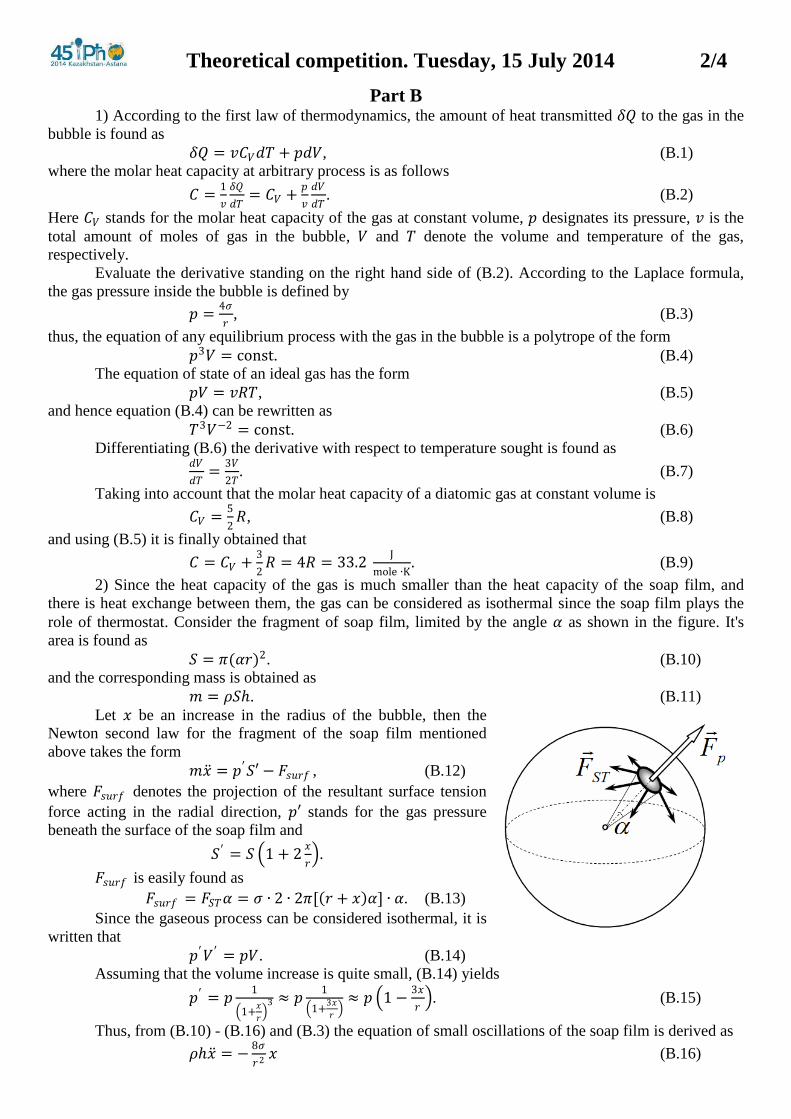
2) Since the heat capacity of the gas is much smaller than the heat capacity of the soap film, and
there is heat exchange between them, the gas can be considered as isothermal since the soap film plays the
role of thermostat. Consider the fragment of soap film, limited by the angle 𝛼 as shown in the figure. It's
area is found as
𝑆 = 𝜋(𝛼𝑟)2. (B.10)
and the corresponding mass is obtained as
𝑚 = 𝜌𝑆. (B.11)
Let 𝑥 be an increase in the radius of the bubble, then the
Newton second law for the fragment of the soap film mentioned
above takes the form
𝑚𝑥 = 𝑝′𝑆′ − 𝐹𝑠𝑢𝑟𝑓 , (B.12)
where 𝐹𝑠𝑢𝑟𝑓 denotes the projection of the resultant surface tension
force acting in the radial direction, 𝑝′ stands for the gas pressure
beneath the surface of the soap film and
𝑆′ = 𝑆 1 + 2𝑥
𝑟 .
𝐹𝑠𝑢𝑟𝑓 is easily found as
𝐹𝑠𝑢𝑟𝑓 = 𝐹𝑆𝑇𝛼 = 𝜍 ∙ 2 ∙ 2𝜋[ 𝑟 + 𝑥 𝛼] ∙ 𝛼. (B.13)
Since the gaseous process can be considered isothermal, it is
written that
𝑝′𝑉 ′ = 𝑝𝑉. (B.14)
Assuming that the volume increase is quite small, (B.14) yields
𝑝′ = 𝑝1
1+𝑥
𝑟
3 ≈ 𝑝1
1+3𝑥
𝑟 ≈ 𝑝 1 −
3𝑥
𝑟 . (B.15)
Thus, from (B.10) - (B.16) and (B.3) the equation of small oscillations of the soap film is derived as
𝜌𝑥 = −8𝜍
𝑟2𝑥 (B.16)
Theoretical competition. Tuesday, 15 July 2014 3/4
with the frequency
𝜔 = 8𝜍
𝜌𝑟2= 108 s−1. (B.17)
Part C The problem can be solved in different ways. Herein several possible solutions are considered.
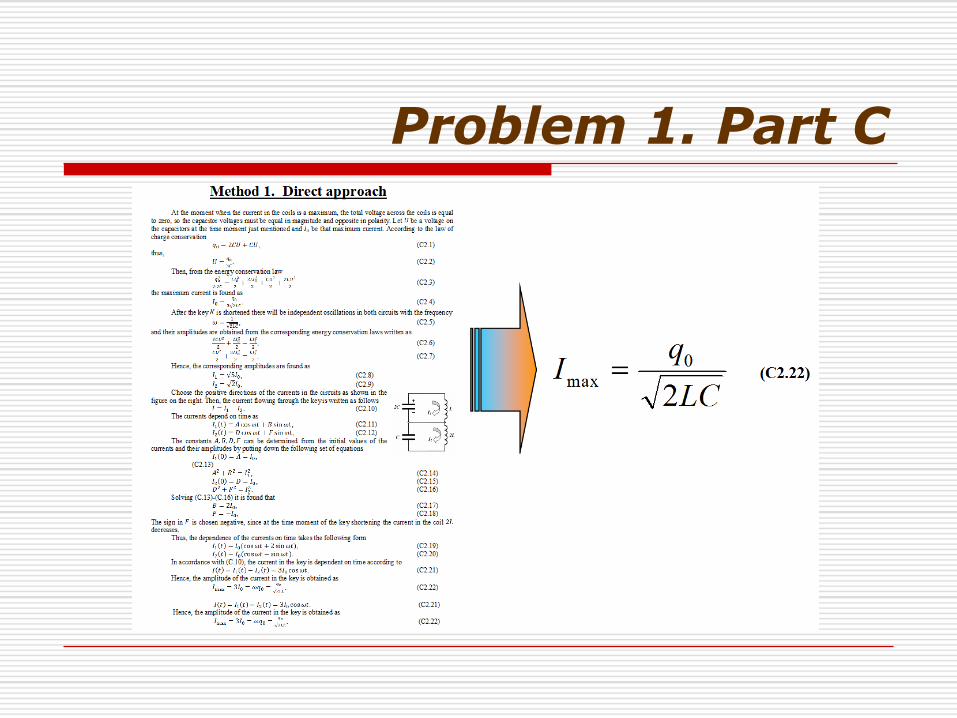
Method 1. Direct approach
At the moment when the current in the coils is a maximum, the total voltage across the coils is equal
to zero, so the capacitor voltages must be equal in magnitude and opposite in polarity. Let 𝑈 be a voltage on
the capacitors at the time moment just mentioned and 𝐼0 be that maximum current. According to the law of
charge conservation
𝑞0 = 2𝐶𝑈 + 𝐶𝑈, (C1.1)
thus,
𝑈 =𝑞0
3𝐶. (C1.2)
Then, from the energy conservation law
𝑞0
2
2∙2𝐶=
𝐿𝐼02
2+
2𝐿𝐼02
2+
𝐶𝑈2
2+
2𝐶𝑈2
2 (C1.3)
the maximum current is found as
𝐼0 =𝑞0
3 2𝐿𝐶. (C1.4)
After the key 𝐾 is shortened there will be independent oscillations in both circuits with the frequency
𝜔 =1
2𝐿𝐶, (C1.5)
and their amplitudes are obtained from the corresponding energy conservation laws written as
2𝐶𝑈2
2+
𝐿𝐼02
2=
𝐿𝐽12
2, (C1.6)
𝐶𝑈2
2+
2𝐿𝐼02
2=
2𝐿𝐽22
2. (C1.7)
Hence, the corresponding amplitudes are found as
𝐽1 = 5𝐼0, (C1.8)
𝐽2 = 2𝐼0. (C1.9)
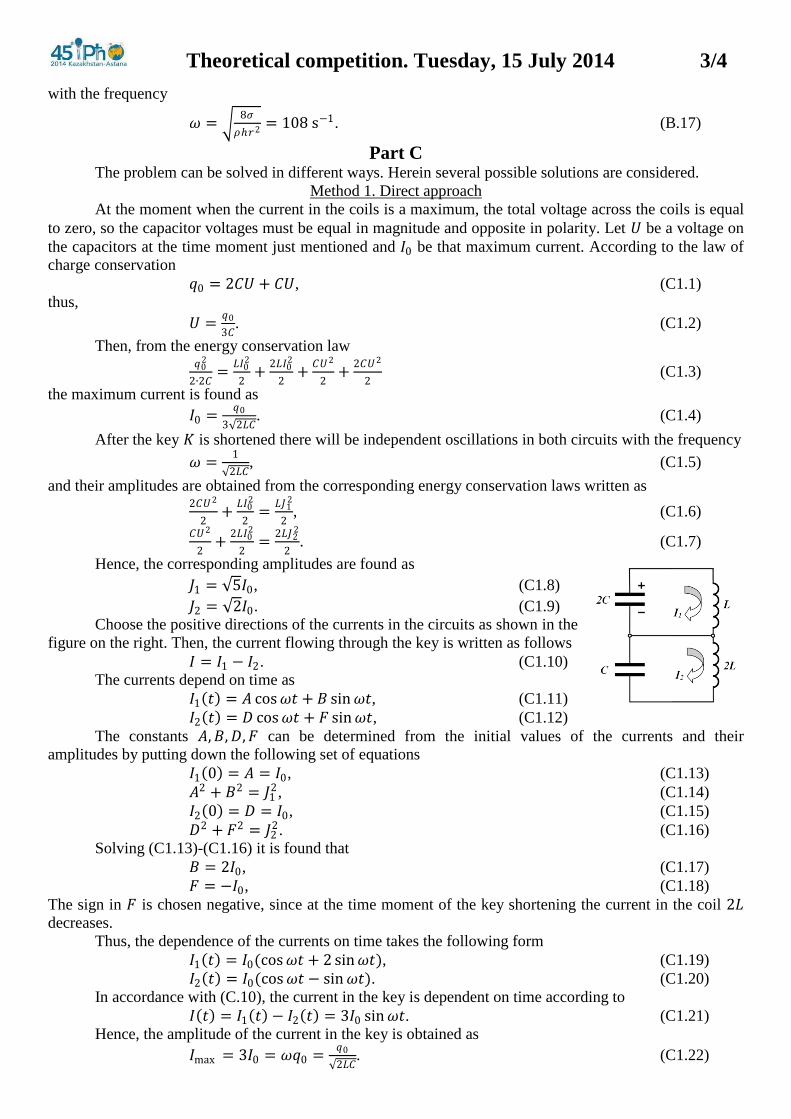
Choose the positive directions of the currents in the circuits as shown in the
figure on the right. Then, the current flowing through the key is written as follows
𝐼 = 𝐼1 − 𝐼2. (C1.10)
The currents depend on time as
𝐼1 𝑡 = 𝐴 cos𝜔𝑡 + 𝐵 sin𝜔𝑡, (C1.11)
𝐼2 𝑡 = 𝐷 cos𝜔𝑡 + 𝐹 sin𝜔𝑡, (C1.12)
The constants 𝐴,𝐵,𝐷,𝐹 can be determined from the initial values of the currents and their
amplitudes by putting down the following set of equations
𝐼1 0 = 𝐴 = 𝐼0, (C1.13)
𝐴2 + 𝐵2 = 𝐽12, (C1.14)
𝐼2 0 = 𝐷 = 𝐼0, (C1.15)
𝐷2 + 𝐹2 = 𝐽22. (C1.16)
Solving (C1.13)-(C1.16) it is found that
𝐵 = 2𝐼0, (C1.17)
𝐹 = −𝐼0, (C1.18)
The sign in 𝐹 is chosen negative, since at the time moment of the key shortening the current in the coil 2𝐿
decreases.
Thus, the dependence of the currents on time takes the following form
𝐼1 𝑡 = 𝐼0(cos𝜔𝑡 + 2 sin𝜔𝑡), (C1.19)
𝐼2 𝑡 = 𝐼0(cos𝜔𝑡 − sin𝜔𝑡). (C1.20)
In accordance with (C.10), the current in the key is dependent on time according to
𝐼 𝑡 = 𝐼1 𝑡 − 𝐼2 𝑡 = 3𝐼0 sin𝜔𝑡. (C1.21)
Hence, the amplitude of the current in the key is obtained as
𝐼max = 3𝐼0 = 𝜔𝑞0 =𝑞0
2𝐿𝐶. (C1.22)
Theoretical competition. Tuesday, 15 July 2014 4/4
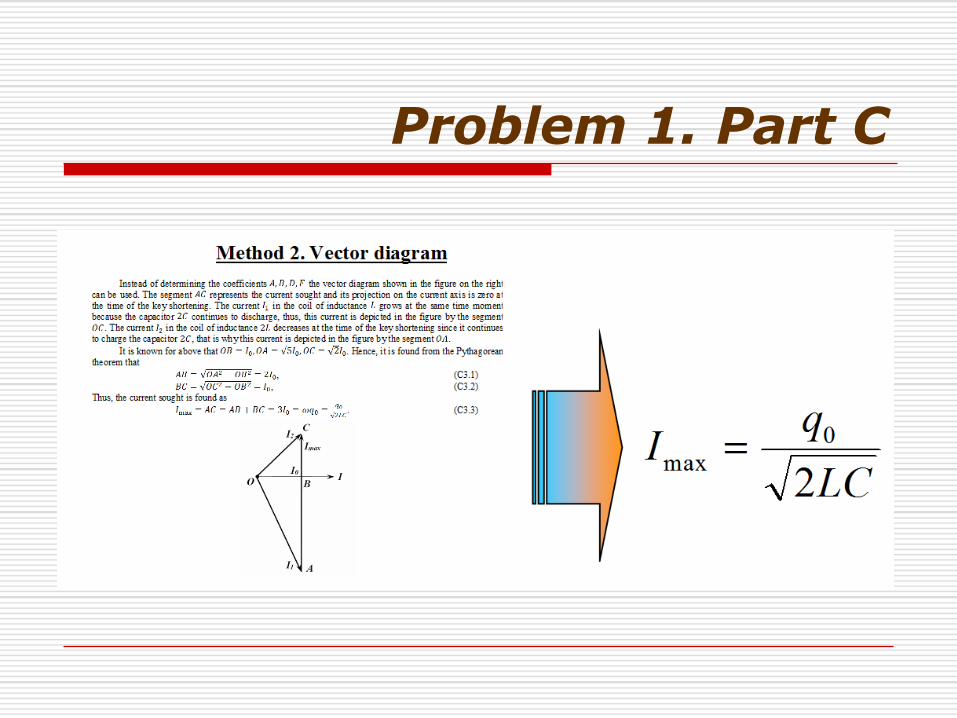
Method 2. Vector diagram
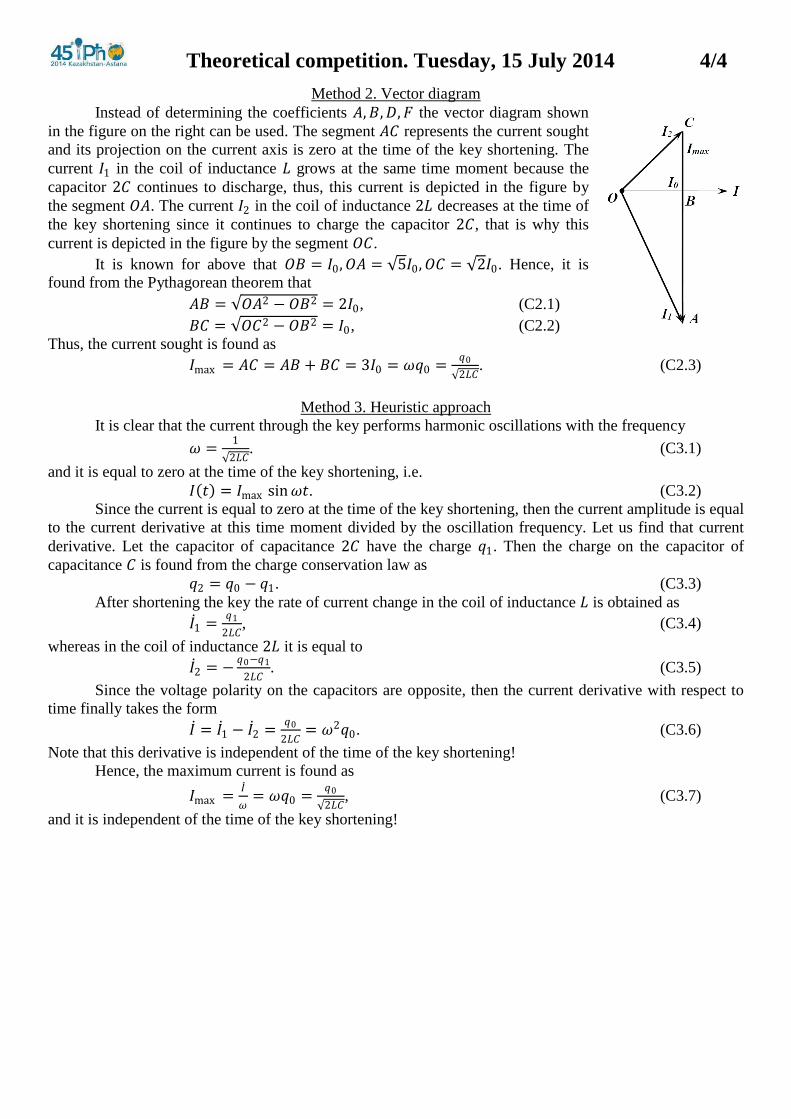
Instead of determining the coefficients 𝐴,𝐵,𝐷,𝐹 the vector diagram shown
in the figure on the right can be used. The segment 𝐴𝐶 represents the current sought
and its projection on the current axis is zero at the time of the key shortening. The
current 𝐼1 in the coil of inductance 𝐿 grows at the same time moment because the
capacitor 2𝐶 continues to discharge, thus, this current is depicted in the figure by
the segment 𝑂𝐴. The current 𝐼2 in the coil of inductance 2𝐿 decreases at the time of
the key shortening since it continues to charge the capacitor 2𝐶, that is why this
current is depicted in the figure by the segment 𝑂𝐶.
It is known for above that 𝑂𝐵 = 𝐼0,𝑂𝐴 = 5𝐼0,𝑂𝐶 = 2𝐼0. Hence, it is
found from the Pythagorean theorem that
𝐴𝐵 = 𝑂𝐴2 − 𝑂𝐵2 = 2𝐼0, (C2.1)
𝐵𝐶 = 𝑂𝐶2 − 𝑂𝐵2 = 𝐼0, (C2.2)
Thus, the current sought is found as
𝐼max = 𝐴𝐶 = 𝐴𝐵 + 𝐵𝐶 = 3𝐼0 = 𝜔𝑞0 =𝑞0
2𝐿𝐶. (C2.3)
Method 3. Heuristic approach
It is clear that the current through the key performs harmonic oscillations with the frequency
𝜔 =1
2𝐿𝐶. (C3.1)
and it is equal to zero at the time of the key shortening, i.e.
𝐼 𝑡 = 𝐼max sin𝜔𝑡. (C3.2)
Since the current is equal to zero at the time of the key shortening, then the current amplitude is equal
to the current derivative at this time moment divided by the oscillation frequency. Let us find that current
derivative. Let the capacitor of capacitance 2𝐶 have the charge 𝑞1. Then the charge on the capacitor of
capacitance 𝐶 is found from the charge conservation law as
𝑞2 = 𝑞0 − 𝑞1. (C3.3)
After shortening the key the rate of current change in the coil of inductance 𝐿 is obtained as
𝐼 1 =𝑞1
2𝐿𝐶, (C3.4)
whereas in the coil of inductance 2𝐿 it is equal to
𝐼 2 = −𝑞0−𝑞1
2𝐿𝐶. (C3.5)
Since the voltage polarity on the capacitors are opposite, then the current derivative with respect to
time finally takes the form
𝐼 = 𝐼 1 − 𝐼 2 =𝑞0
2𝐿𝐶= 𝜔2𝑞0. (C3.6)
Note that this derivative is independent of the time of the key shortening!
Hence, the maximum current is found as
𝐼max =𝐼
𝜔= 𝜔𝑞0 =
𝑞0
2𝐿𝐶, (C3.7)
and it is independent of the time of the key shortening!
Problem 2. Van der Waals equation of state
The main idea of this
problem is to express
all properties of
gaseous and liquid
states of matter in
terms of just two
constants a and b.
Question A1
Question A2
Questions A2-A3

Part B. Properties of gas and liquid
Part B. Properties of gas and liquid. But…
Part B. Properties of gas…

Question B1
Question B2
Question B3
Part B. Properties of… liquid
Question B4

Questions B5-B7
Question B8
Part С. Liquid-gas systemQuestion C1
Question C1,C2
Question C3
Question C4
Question C4

Question C4
Theoretical competition. Tuesday, 15 July 2014 1/3
Problem 2. Van der Waals equation of state (11 points) In a well-known model of an ideal gas, whose equation of state obeys the Clapeyron-Mendeleev law,
the following important physical effects are neglected. First, molecules of a real gas have a finite size and,
secondly, they interact with one another. In all parts of this problem one mole of water is considered.
Part А. Non-ideal gas equation of state (2 points) Taking into account the finite size of the molecules, the gaseous equation of state takes the form
𝑃 𝑉 − 𝑏 = 𝑅𝑇, (1)
where 𝑃,𝑉,𝑇 stands for the gas pressure, its volume per mole and temperature, respectively, 𝑅 denotes the
universal gas constant, and 𝑏 is a specific constant extracting some volume.
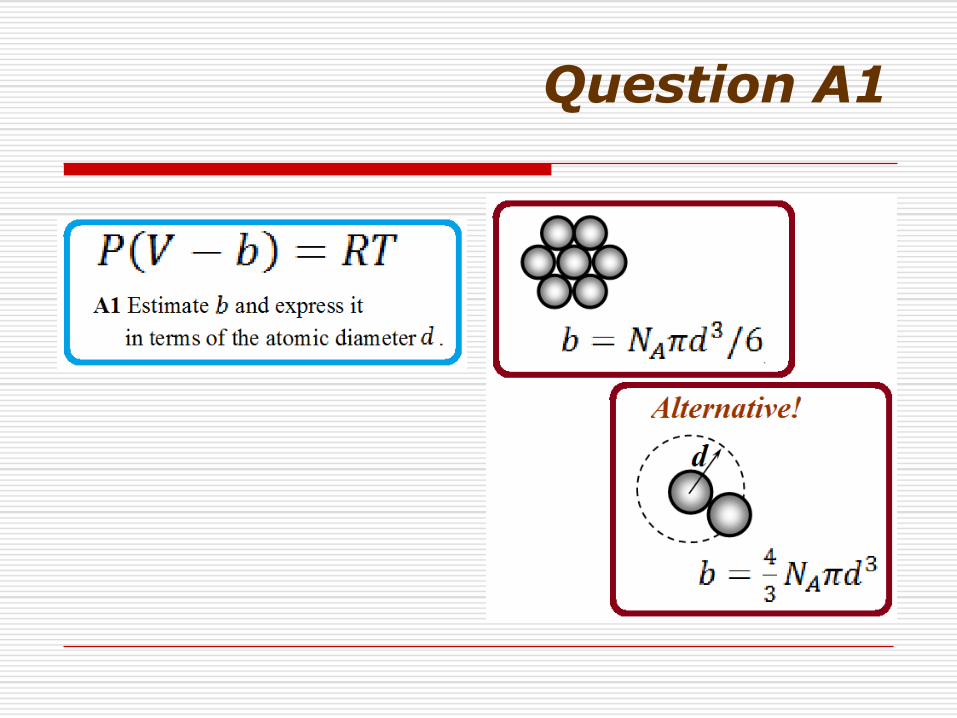
A1 Estimate 𝑏 and express it in terms of the diameter of the molecules 𝑑. (0.3 points)
With account of intermolecular attraction forces, van der Waals proposed the following equation of
state that neatly describes both the gaseous and liquid states of matter
𝑃 +𝑎
𝑉2 𝑉− 𝑏 = 𝑅𝑇. (2)
where 𝑎 is another specific constant.
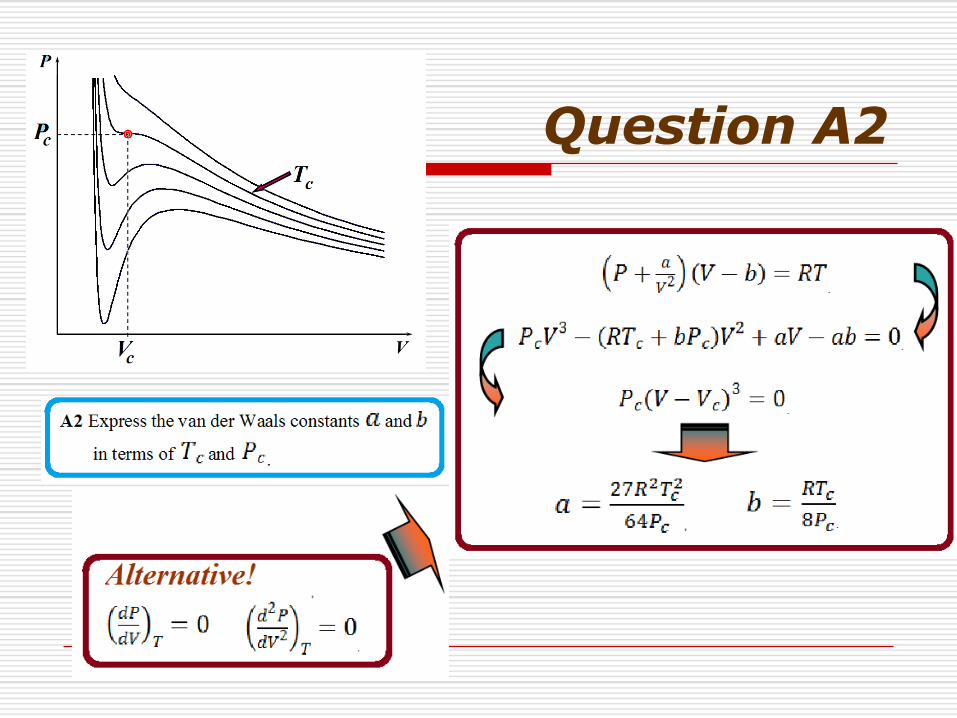
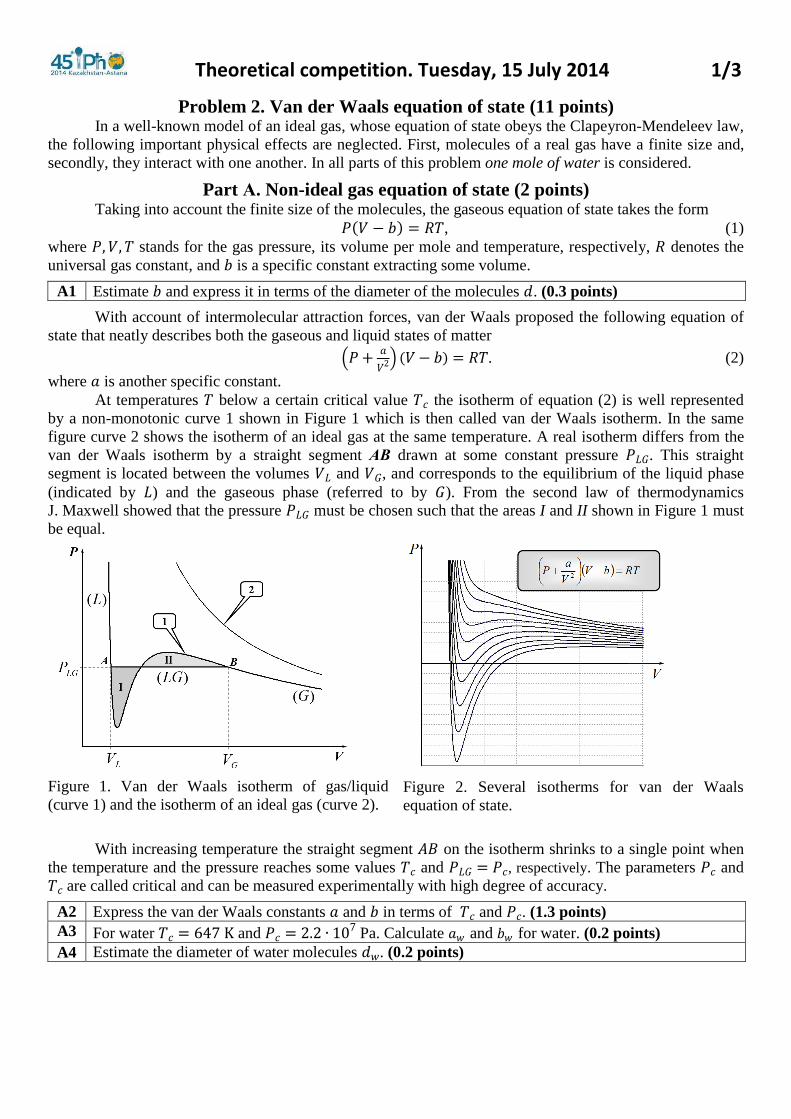
At temperatures 𝑇 below a certain critical value 𝑇𝑐 the isotherm of equation (2) is well represented
by a non-monotonic curve 1 shown in Figure 1 which is then called van der Waals isotherm. In the same
figure curve 2 shows the isotherm of an ideal gas at the same temperature. A real isotherm differs from the
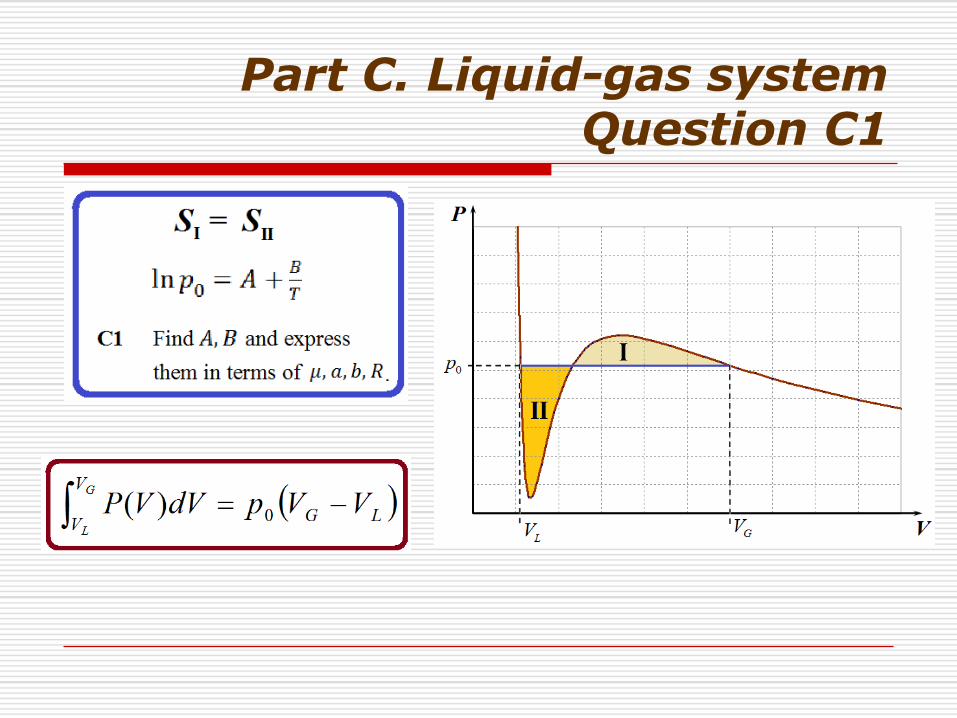
van der Waals isotherm by a straight segment АВ drawn at some constant pressure 𝑃𝐿𝐺. This straight
segment is located between the volumes 𝑉𝐿 and 𝑉𝐺, and corresponds to the equilibrium of the liquid phase
(indicated by 𝐿) and the gaseous phase (referred to by 𝐺). From the second law of thermodynamics
J. Maxwell showed that the pressure 𝑃𝐿𝐺 must be chosen such that the areas I and II shown in Figure 1 must
be equal.
Figure 1. Van der Waals isotherm of gas/liquid
(curve 1) and the isotherm of an ideal gas (curve 2).
Figure 2. Several isotherms for van der Waals
equation of state.
With increasing temperature the straight segment 𝐴𝐵 on the isotherm shrinks to a single point when
the temperature and the pressure reaches some values 𝑇𝑐 and 𝑃𝐿𝐺 = 𝑃𝑐, respectively. The parameters 𝑃𝑐 and
𝑇𝑐 are called critical and can be measured experimentally with high degree of accuracy.
A2 Express the van der Waals constants 𝑎 and 𝑏 in terms of 𝑇𝑐 and 𝑃𝑐. (1.3 points)
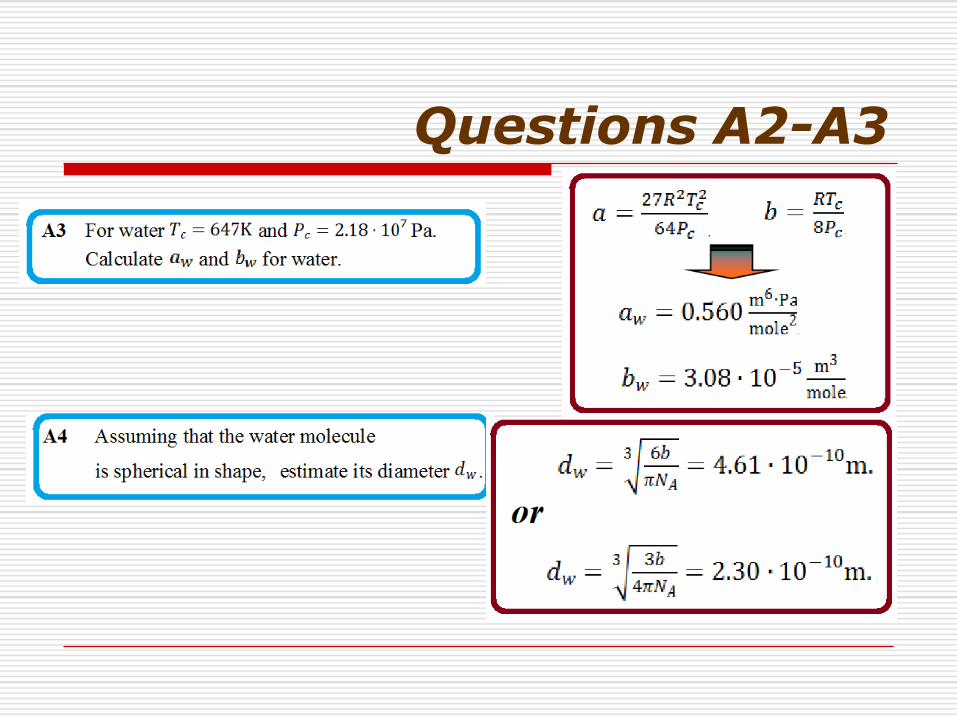
A3 For water 𝑇𝑐 = 647 K and 𝑃𝑐 = 2.2 ∙ 107 Pa. Calculate 𝑎𝑤 and 𝑏𝑤 for water. (0.2 points)
A4 Estimate the diameter of water molecules 𝑑𝑤. (0.2 points)

Theoretical competition. Tuesday, 15 July 2014 2/3
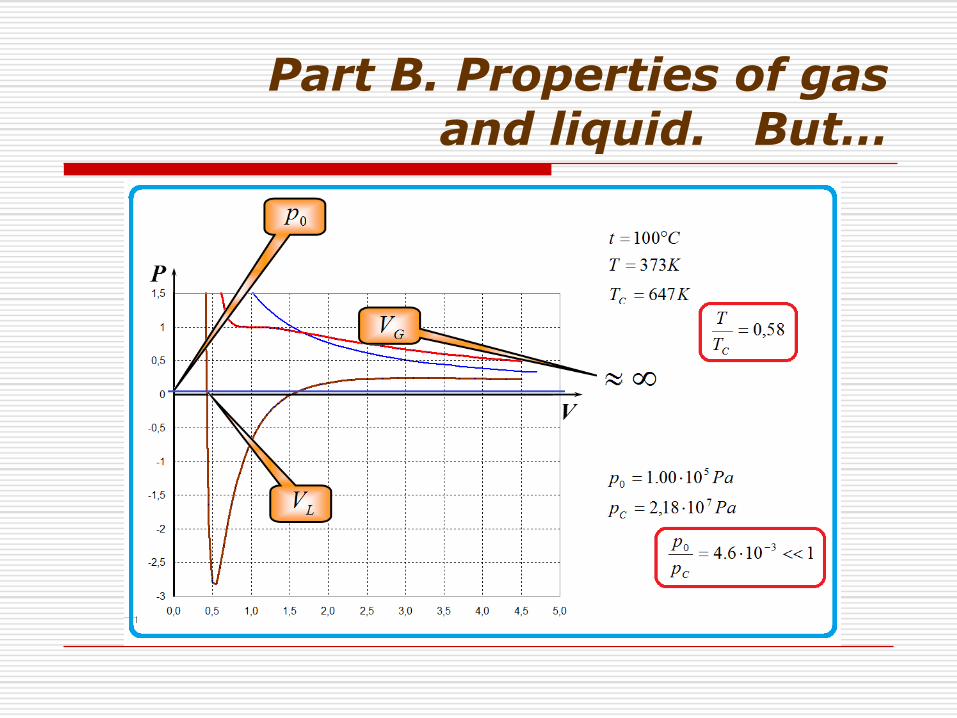
Part B. Properties of gas and liquid (6 points) This part of the problem deals with the properties of water in the gaseous and liquid states at
temperature 𝑇 = 100 °C. The saturated vapor pressure at this temperature is known to be 𝑝𝐿𝐺 = 𝑝0 = 1.0 ∙
105 Pa, and the molar mass of water is 𝜇 = 1.8 ∙ 10−2
kg
mole.
Gaseous state
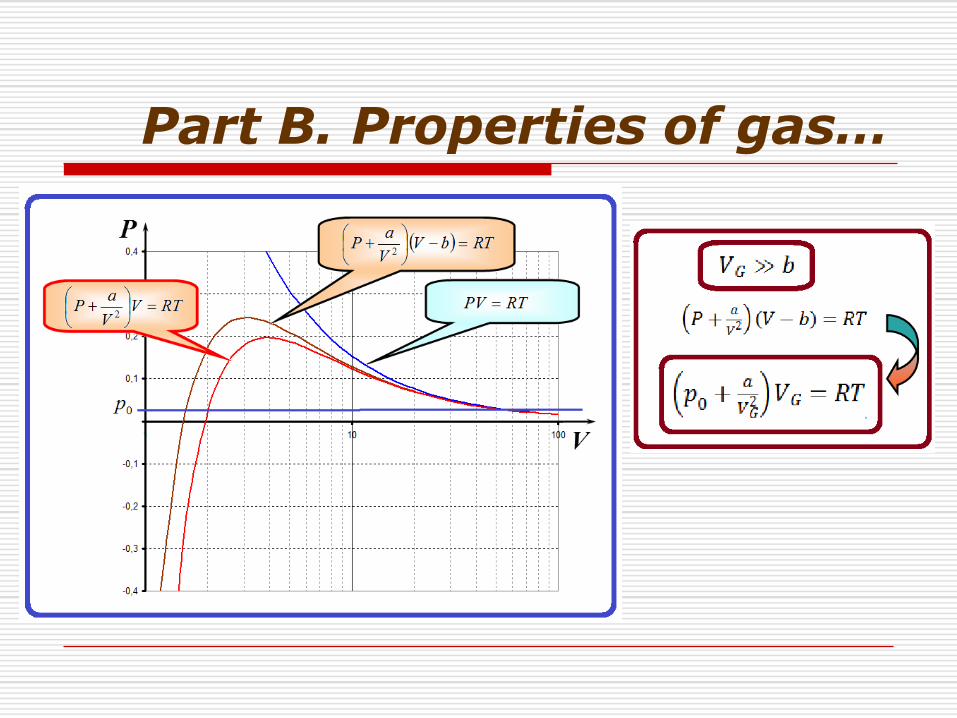
It is reasonable to assume that the inequality 𝑉𝐺 ≫ 𝑏 is valid for the description of water properties in
a gaseous state.
B1 Derive the formula for the volume 𝑉𝐺 and express it in terms of 𝑅,𝑇, 𝑝0, and 𝑎. (0.8 points)
Almost the same volume 𝑉𝐺0 can be approximately evaluated using the ideal gas law.
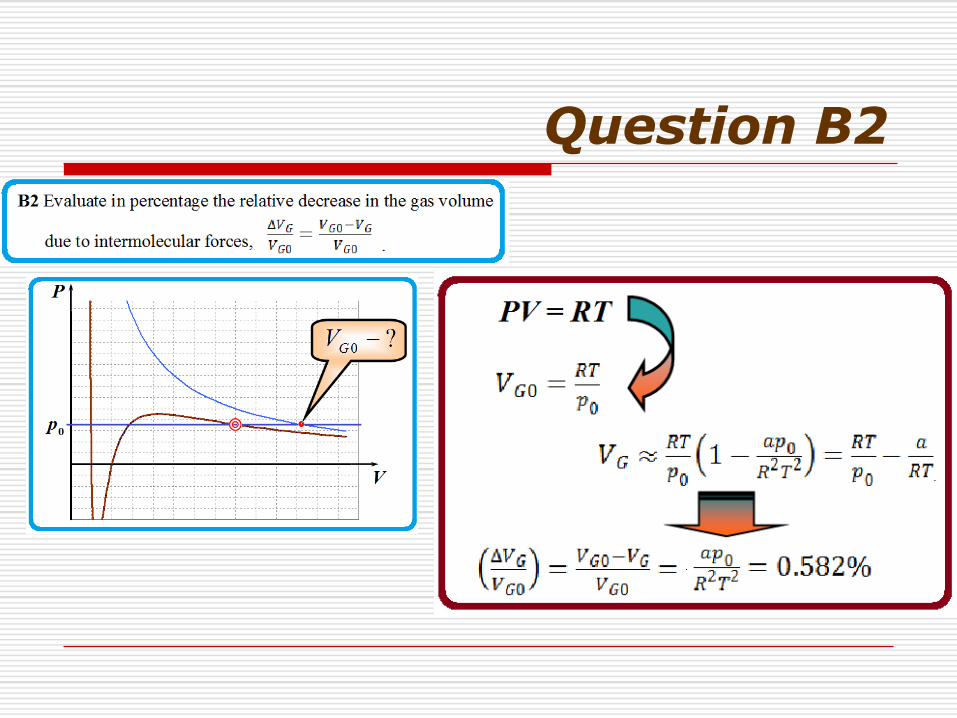
B2 Evaluate in percentage the relative decrease in the gas volume due to intermolecular forces, ∆𝑉𝐺𝑉𝐺0
=𝑉𝐺0−𝑉𝐺𝑉𝐺0
. (0.3 points)
If the system volume is reduced below 𝑉𝐺, the gas starts to condense. However, thoroughly purified
gas can remain in a mechanically metastable state (called supercooled vapor) until its volume reaches a
certain value 𝑉𝐺min.
The condition of mechanical stability of supercooled gas at constant temperature is written as: 𝑑𝑃
𝑑𝑉<
0.
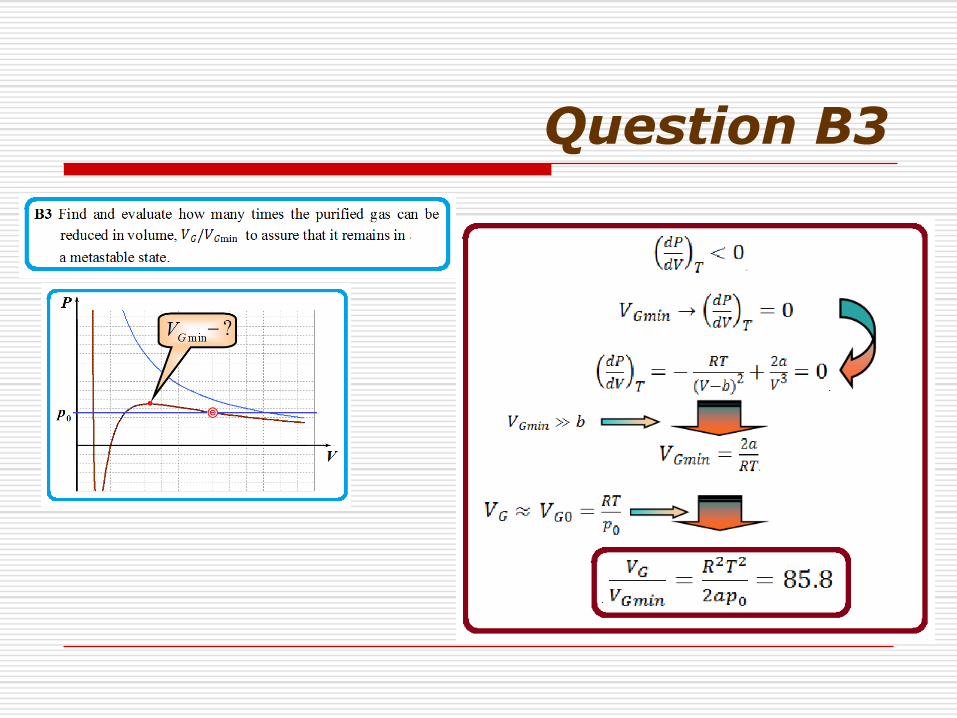
В3 Find and evaluate how many times the volume of water vapor can be reduced and still remains in a
metastable state. In other words, what is 𝑉𝐺/𝑉𝐺min? (0.7 points)
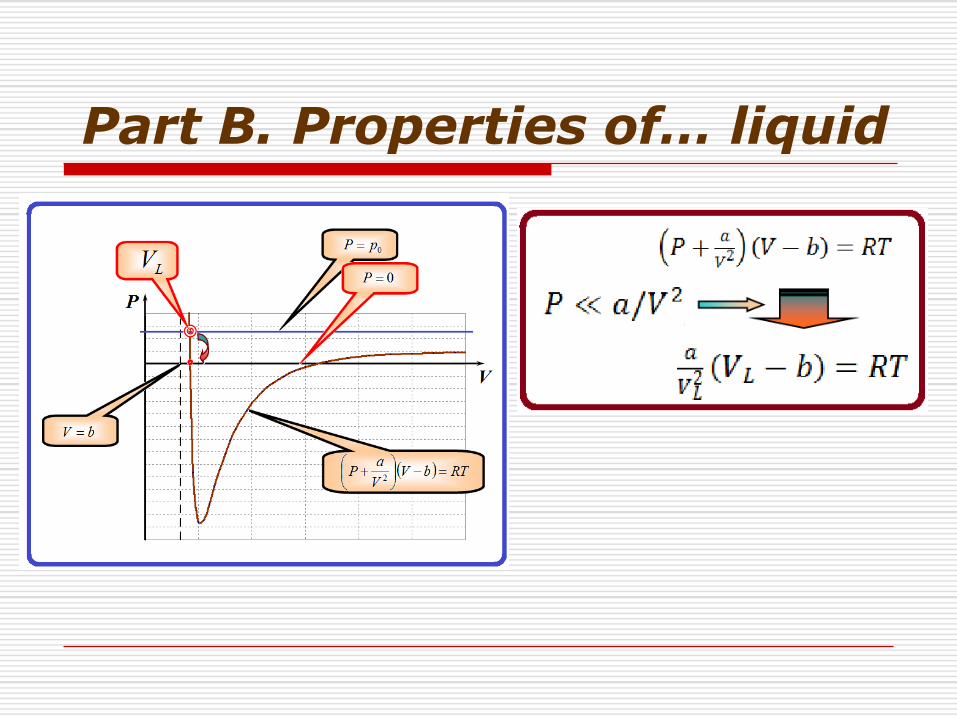
Liquid state
For the van der Waals’ description of water in a liquid state it is reasonable to assume that the
following inequality holds 𝑃 ≪ 𝑎/𝑉2.
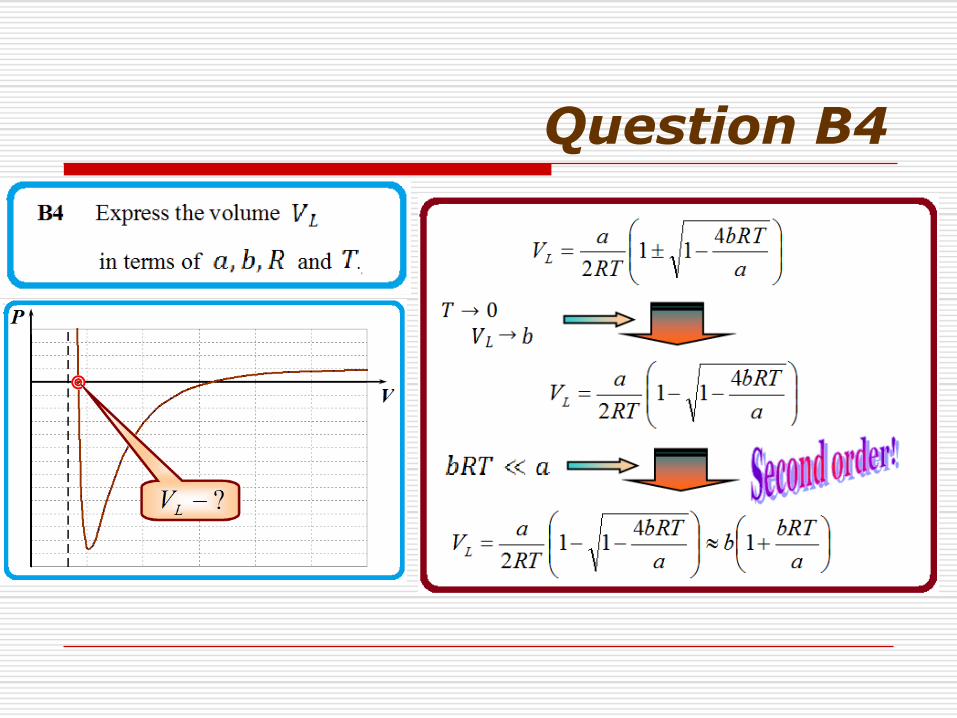
B4 Express the volume of liquid water 𝑉𝐿 in terms of 𝑎, 𝑏,𝑅, and 𝑇. (1.0 points)
Assuming that 𝑏𝑅𝑇 ≪ 𝑎, find the following characteristics of water. Do not be surprised if some of
the data evaluated do not coincide with the well-known tabulated values!
B5 Express the liquid water density 𝜌𝐿 in some of the terms of 𝜇,𝑎, 𝑏,𝑅 and evaluate it. (0.5 points)
B6 Express the volume thermal expansion coefficient 𝛼 =1
𝑉𝐿
∆𝑉𝐿
∆𝑇 in terms of 𝑎, 𝑏,𝑅, and evaluate it.
(0.6 points)
B7 Express the specific heat of water vaporization 𝐿 in terms of 𝜇, 𝑎, 𝑏,𝑅 and evaluate it. (1.1 points)
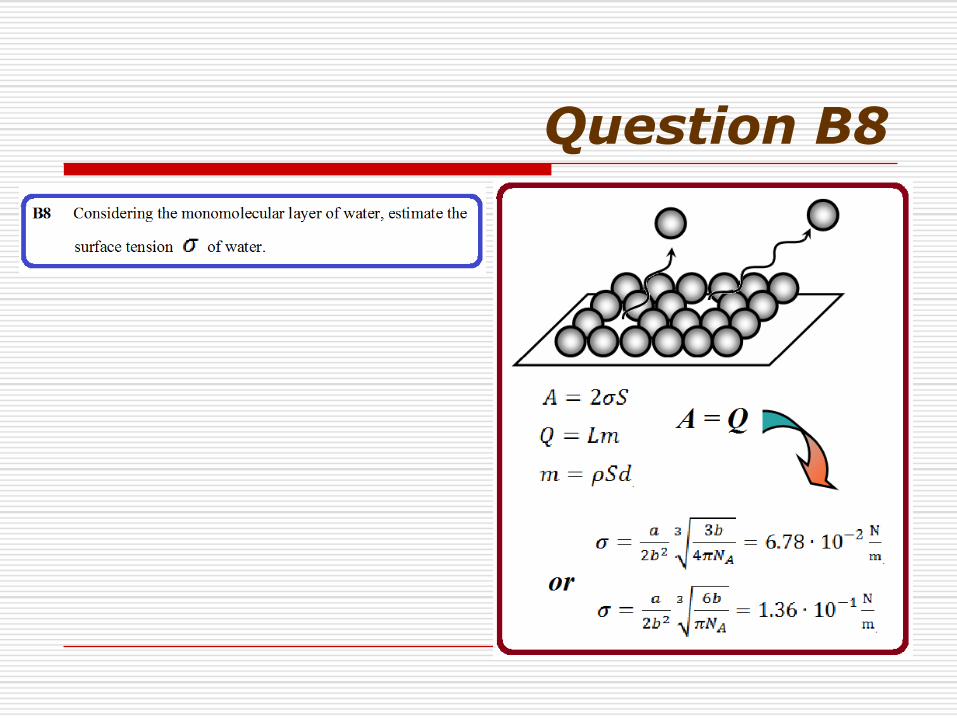
B8 Considering the monomolecular layer of water, estimate the surface tension 𝜎 of water. (1.2 points)
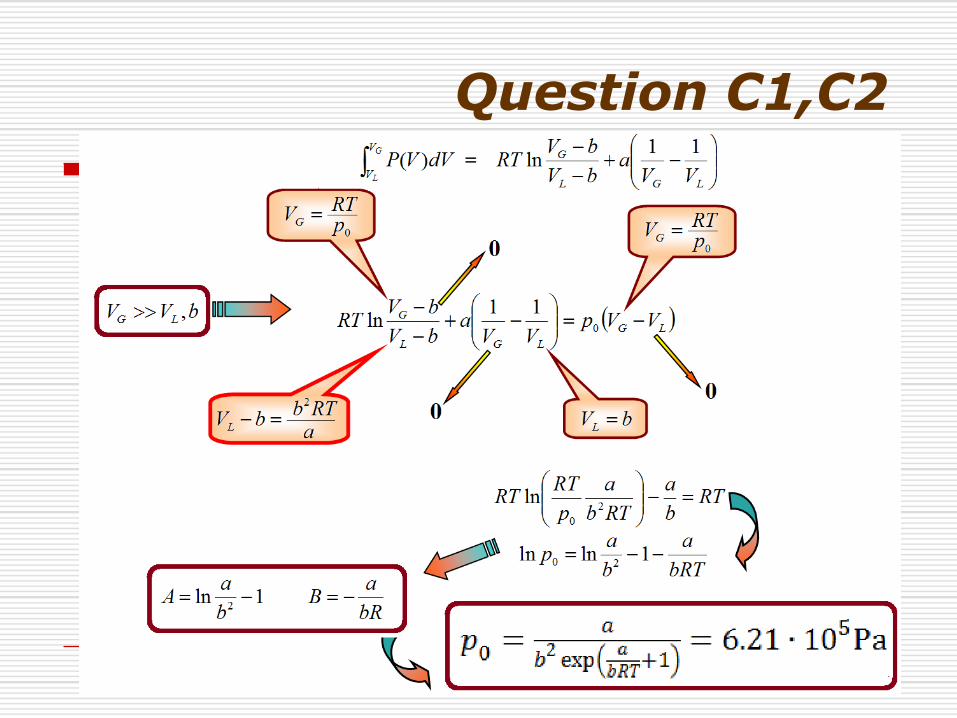
Part С. Liquid-gas system (3 points) From Maxwell’s rule (equalities of areas, by applying trivial integration) and the van der Waals’
equation of state together with the approximations made in Part B, it can be shown that the saturated vapor
pressure 𝑝𝐿𝐺 depends on temperature 𝑇 as follows
ln𝑝𝐿𝐺 = 𝐴 +𝐵
𝑇, (3)
where 𝐴 and 𝐵 are some constants, that can be expressed in terms of 𝑎 and 𝑏 as 𝐴 = ln 𝑎
𝑏2 − 1 ; 𝐵 = −
𝑎
𝑏𝑅

Theoretical competition. Tuesday, 15 July 2014 3/3
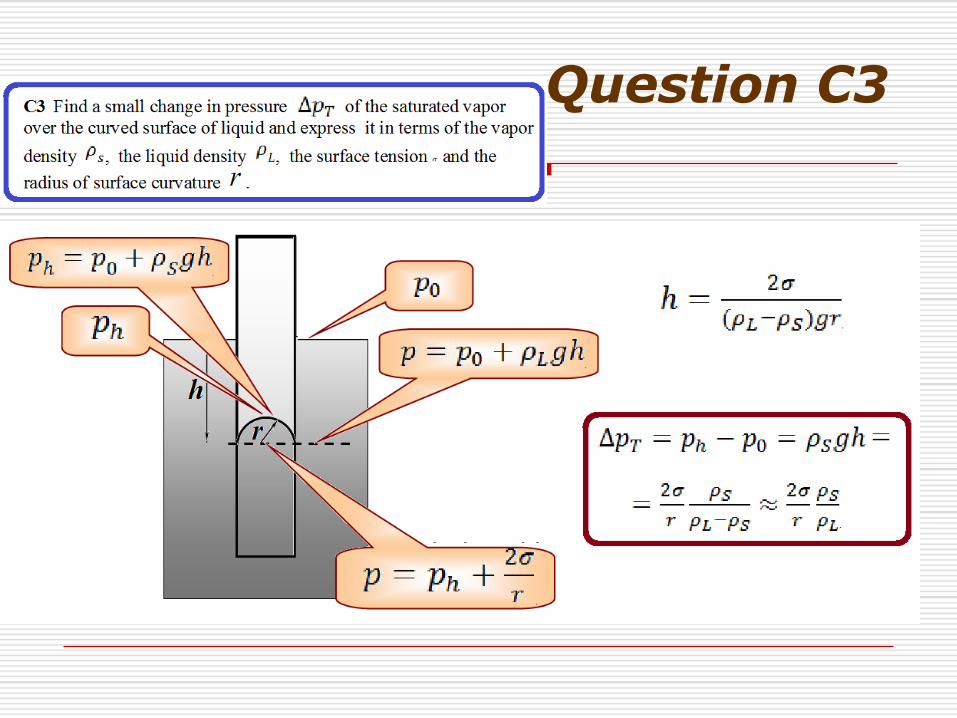
W. Thomson showed that the pressure of saturated vapor depends on the
curvature of the liquid surface. Consider a liquid that does not wet the material
of a capillary (contact angle 180°). When the capillary is immersed into the
liquid, the liquid in the capillary drops to a certain level because of the surface
tension (see Figure 3).
С1 Find a small change in pressure ∆𝑝𝑇 of the saturated vapor over the
curved surface of liquid and express it in terms of the vapor density 𝜌𝑠,
the liquid density 𝜌𝐿, the surface tension 𝜎 and the radius of surface
curvature 𝑟. (1.3 points)
Metastable states, considered in part B3, are widely used in real
experimental setups, such as the cloud chamber designed for registration of
elementary particles. They also occur in natural phenomena such as the
formation of morning dew. Supercooled vapor is subject to condensation by forming liquid droplets. Very
small droplets evaporate quickly but large enough ones can still grow.
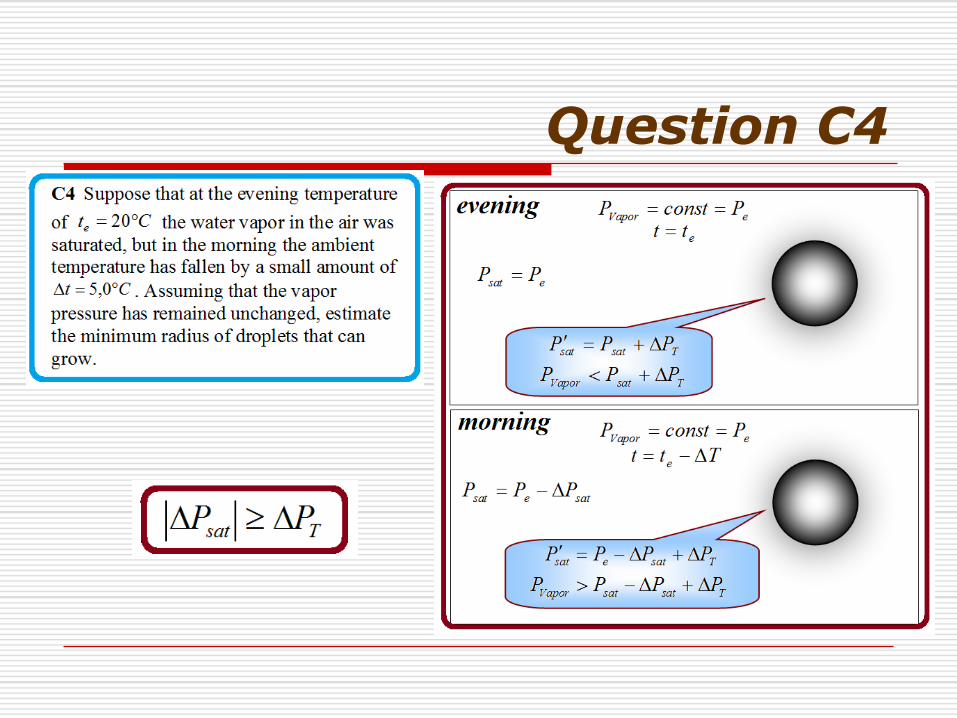
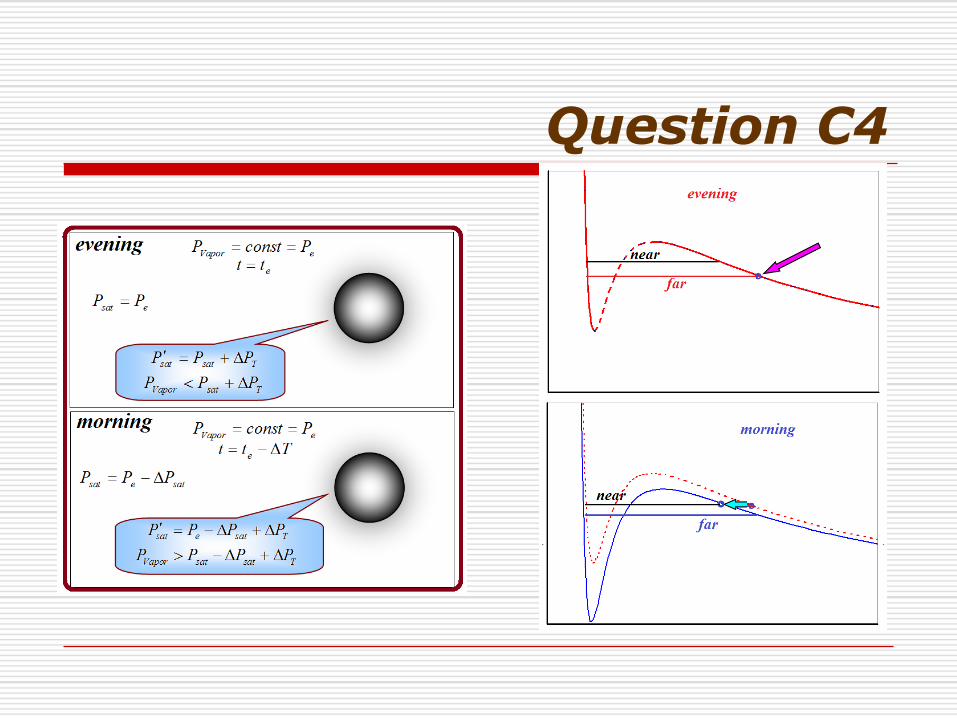
C2 Suppose that at the evening temperature of 𝑡𝑒 = 20 °C the water vapor in the air was saturated, but
in the morning the ambient temperature has fallen by a small amount of ∆𝑡 = 5.0 °C. Assuming that
the vapor pressure has remained unchanged, estimate the minimum radius of droplets that can grow.
Use the tabulated value of water surface tension 𝜎 = 7.3 ∙ 10−2 𝑁 𝑚 . (1.7 points)
Figure 3. Capillary
immersed in a liquid that
does not wet its material
Theoretical competition. Tuesday, 15 July 2014 1/3
Problem 2.Van der Waals equation of state Solution
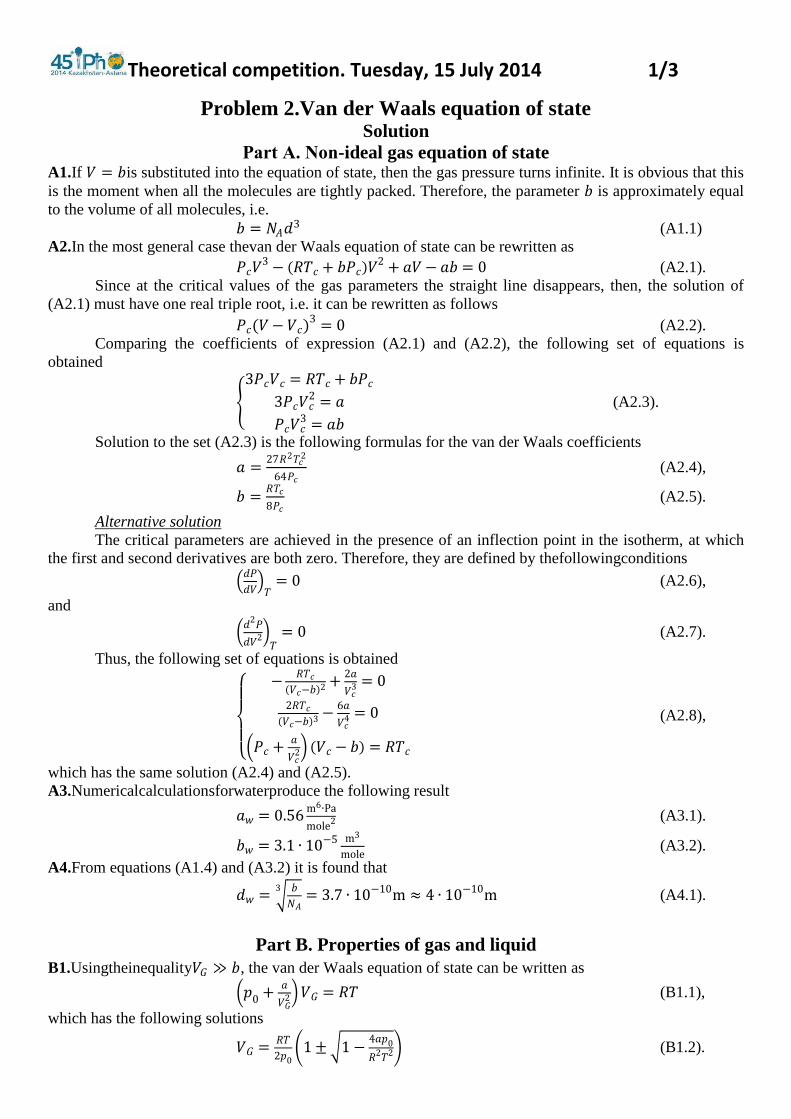
Part А. Non-ideal gas equation of state A1.If 𝑉 = 𝑏is substituted into the equation of state, then the gas pressure turns infinite. It is obvious that this
is the moment when all the molecules are tightly packed. Therefore, the parameter 𝑏 is approximately equal
to the volume of all molecules, i.e.
𝑏 = 𝑁𝐴𝑑3 (A1.1)
A2.In the most general case thevan der Waals equation of state can be rewritten as
𝑃𝑐𝑉3 − 𝑅𝑇𝑐 + 𝑏𝑃𝑐 𝑉
2 + 𝑎𝑉 − 𝑎𝑏 = 0 (A2.1).
Since at the critical values of the gas parameters the straight line disappears, then, the solution of
(A2.1) must have one real triple root, i.e. it can be rewritten as follows
𝑃𝑐(𝑉− 𝑉𝑐)3 = 0 (A2.2).
Comparing the coefficients of expression (A2.1) and (A2.2), the following set of equations is
obtained
3𝑃𝑐𝑉𝑐 = 𝑅𝑇𝑐 + 𝑏𝑃𝑐3𝑃𝑐𝑉𝑐
2 = 𝑎
𝑃𝑐𝑉𝑐3 = 𝑎𝑏
(A2.3).
Solution to the set (A2.3) is the following formulas for the van der Waals coefficients
𝑎 =27𝑅2𝑇𝑐
2
64𝑃𝑐 (A2.4),
𝑏 =𝑅𝑇𝑐
8𝑃𝑐 (A2.5).
Alternative solution
The critical parameters are achieved in the presence of an inflection point in the isotherm, at which
the first and second derivatives are both zero. Therefore, they are defined by thefollowingconditions
𝑑𝑃
𝑑𝑉 𝑇= 0 (A2.6),
and
𝑑2𝑃
𝑑𝑉2 𝑇= 0 (A2.7).
Thus, the following set of equations is obtained
−
𝑅𝑇𝑐 𝑉𝑐−𝑏 2
+2𝑎
𝑉𝑐3 = 0
2𝑅𝑇𝑐 𝑉𝑐−𝑏 3
−6𝑎
𝑉𝑐4 = 0
𝑃𝑐 +𝑎
𝑉𝑐2 𝑉𝑐 − 𝑏 = 𝑅𝑇𝑐
(A2.8),
which has the same solution (A2.4) and (A2.5).
A3.Numericalcalculationsforwaterproduce the following result
𝑎𝑤 = 0.56m6∙Pa
mole2 (A3.1).
𝑏𝑤 = 3.1 ∙ 10−5m3
mole (A3.2).
A4.From equations (A1.4) and (A3.2) it is found that
𝑑𝑤 = 𝑏
𝑁𝐴
3= 3.7 ∙ 10−10m ≈ 4 ∙ 10−10m (A4.1).
Part B. Properties of gas and liquid
B1.Usingtheinequality𝑉𝐺 ≫ 𝑏, the van der Waals equation of state can be written as
𝑝0 +𝑎
𝑉𝐺2 𝑉𝐺 = 𝑅𝑇 (B1.1),
which has the following solutions
𝑉𝐺 =𝑅𝑇
2𝑝0 1± 1−
4𝑎𝑝0
𝑅2𝑇2 (B1.2).

Theoretical competition. Tuesday, 15 July 2014 2/3
Smaller root in (B1.2) gives the volume in an unstable state on the rising branch of thevan der Waals
isotherm. The volume of gas is given by the larger root, since at 𝑎 = 0an expression for the volume of an
ideal gasshould be obtained, i.e.
𝑉𝐺 =𝑅𝑇
2𝑝0 1 + 1−
4𝑎𝑝0
𝑅2𝑇2 (B1.3).
For given values of the parameters the value𝑎𝑝0 𝑅𝑇 2
= 5.8 ∙ 10−3. It can therefore be assumed
that𝑎𝑝0 𝑅𝑇 2
≪ 1, then (B1.3)takes the form
𝑉𝐺 ≈𝑅𝑇
𝑝0 1−
𝑎𝑝0
𝑅2𝑇2 =
𝑅𝑇
𝑝0−
𝑎
𝑅𝑇 (B1.4).
B2. For an ideal gas
𝑉𝐺0 =𝑅𝑇
𝑝0 (B2.1),
hence,
∆𝑉𝐺𝑉𝐺0
=𝑉𝐺0−𝑉𝐺𝑉𝐺0
=1
2 1− 1−
4𝑎𝑝0
𝑅2𝑇2 ≈
𝑎𝑝0
𝑅2𝑇2= 0.58%. (B2.2)
B3.Mechanical stability of a thermodynamic system is inpower provided that
𝑑𝑃
𝑑𝑉 𝑇< 0. (B3.1)
The minimum volume, in which the mattercan still exist in the gaseous state, corresponds to a point
in which
𝑉𝐺𝑚𝑖𝑛 → 𝑑𝑃
𝑑𝑉 𝑇= 0 (B3.2).
Using the van der Waals equation of state (B3.2) is written as
𝑑𝑃
𝑑𝑉 𝑇= −
𝑅𝑇
(𝑉−𝑏)2+
2𝑎
𝑉3= 0 (B3.3).
From (B3.2) and (B3.3), and with the help of𝑉𝐺𝑚𝑖𝑛 ≫ 𝑏, it is found that
𝑉𝐺𝑚𝑖𝑛 =2𝑎
𝑅𝑇 (B3.4).
Thus, 𝑉𝐺
𝑉𝐺𝑚𝑖𝑛=
𝑅2𝑇2
2𝑎𝑝0= 86 (B3.5).
B4. Usingtheinequality𝑃 ≪ 𝑎/𝑉2, the van der Waals equation of state is written as
𝑎
𝑉𝐿2 𝑉𝐿 − 𝑏 = 𝑅𝑇, (B4.1)
whose solution is
𝑉𝐿 =𝑎
2𝑅𝑇 1± 1−
4𝑏𝑅𝑇
𝑎 (B4.2).
In this case, the smaller root shouldbe taken, since at𝑇 → 0the liquid volume𝑉𝐿 = 𝑏 must be obtained
according to (B4.1), i.e.
𝑉𝐿 =𝑎
2𝑅𝑇 1− 1−
4𝑏𝑅𝑇
𝑎 ≈ 𝑏 1 +
𝑏𝑅𝑇
𝑎 . (B4.3).
B5. Since (B4.3) givesthevolumeoftheonemoleofwaterits mass density is easily found as
𝜌𝐿 =𝜇
𝑉𝐿=
𝜇
𝑏 1+𝑏𝑅𝑇
𝑎 ≈
𝜇
𝑏= 5.8 ∙ 102
kg
m3 (B5.1).
B6. Inaccordancewith (B4.3) the volume thermal expansion coefficient is derived as
𝛼 =1
𝑉𝐿
∆𝑉𝐿
∆𝑇=
𝑏𝑅
𝑎+𝑏𝑅𝑇≈
𝑏𝑅
𝑎= 4.6 ∙ 10−4К−1 (B6.1).
B7.The heat, required to convert the liquid to gas, is used to overcome the intermolecular forces that create
negative pressure 𝑎/𝑉2, therefore,
𝐸 = 𝐿𝜇 ≈ 𝑎
𝑉2𝑑𝑉 = 𝑎
1
𝑉𝐿−
1
𝑉𝐺
𝑉𝐺
𝑉𝐿 (B7.1),
and using𝑉𝐺 ≫ 𝑉𝐿, (B7.1) yields
𝐿 =𝑎
𝜇𝑉𝐿=
𝑎
𝜇𝑏 1+𝑏𝑅𝑇
𝑎 ≈
𝑎
𝜇𝑏= 1.0 ∙ 106
J
kg (B7.2).

Theoretical competition. Tuesday, 15 July 2014 3/3
B8.Consider some water of volume𝑉. To make a monolayer of thickness 𝑑 out of it, the following work
must be done
𝐴 = 2𝜎𝑆 (B8.1).
Fabrication of the monomolecular layer may be interpreted as the evaporation of an equivalent
volume of water which requires the following amount of heat
𝑄 = 𝐿𝑚 (B8.2),
where the mass is given by
𝑚 = 𝜌𝑆𝑑 (B8.3).
Using (A4.1a), (B5.1)and(B7.2), one finally gets
𝜎 =𝑎
2𝑏2𝑑𝑤 = 0.12 ∙ 10−2
N
m (B8.4).
Part С. Liquid-gas systems
C1.At equilibrium, the pressure in the liquid and gas should be equalat all depths. The pressure𝑝in the fluid
at the depth ℎis related to the pressure of saturated vapor above the flat surface by
𝑝 = 𝑝0 + 𝜌𝐿𝑔ℎ (C1.1).
The surface tension creates additional pressure defined by the Laplace formula as
∆𝑝𝐿 =2𝜎
𝑟 (C1.2).
The same pressure𝑝inthefluidatthedepthℎ depends on the vapor pressure 𝑝ℎ over the curved liquid
surface and its radiusofcurvature as
𝑝 = 𝑝ℎ +2𝜎
𝑟 (C1.3).
Furthermore, the vapor pressure at different heights are related by
𝑝ℎ = 𝑝0 + 𝜌𝑆𝑔ℎ (C1.4).
Solving (C1.1)-(C1.4), it is found that
ℎ =2𝜎
(𝜌𝐿−𝜌𝑆)𝑔𝑟 (C1.5).
Hence,the pressure difference sought is obtained as
∆𝑝𝑇 = 𝑝ℎ − 𝑝0 = 𝜌𝑆𝑔ℎ =2𝜎
𝑟
𝜌𝑆
𝜌𝐿−𝜌𝑆≈
2𝜎
𝑟
𝜌𝑆
𝜌𝐿. (C1.6).
Note that the vapor pressure over the convex surface of the liquid is larger than the pressure above
the flat surface.
C2.Let 𝑃𝑒be vapor pressure at a temperature 𝑇𝑒, and 𝑃𝑒 − ∆𝑃𝑒be vapor pressure at a temperature 𝑇𝑒 − ∆𝑇𝑒. In accordance with equation (3) from problem statement, whentheambient temperature falls by an amount of
∆𝑇𝑒 the saturated vapor pressure changes by an amount
∆𝑃𝑒 = 𝑃𝑒𝑎
𝑏𝑅𝑇𝑒2 ∆𝑇𝑒 (C2.1).
In accordance with the Thomson formula obtained in part C1, the pressure of saturated vapor above
the droplet increases by the amountof ∆𝑝𝑇. While a droplet is small in size, the vapor above its surface
remains unsaturated. Whena droplet hasgrownuptoacertainminimumsize, thevaporaboveitssurface turns
saturated.
Since the pressure remains unchanged, the following condition must hold
𝑃𝑒 − ∆𝑃𝑒 + ∆𝑝𝑇 = 𝑃𝑒 (C2.2).
Assuming the vapor is almost ideal gas, its density can be found as
𝜌𝑆 =𝜇𝑃𝑒𝑅𝑇𝑒
≪ 𝜌𝐿 (C2.3).
From equations (C2.1)-(C2.3), (B5.1) and (C1.6) one finds
2𝜎
𝑟
𝜇𝑃𝑒
𝑅𝑇𝑒 𝜇
𝑏 = 𝑃𝑒
𝑎∆𝑇𝑒
𝑏𝑅𝑇𝑒2 (C2.4).
Thus, it is finally obtained that
𝑟 =2𝜎𝑏2𝑇𝑒
𝑎∆𝑇𝑒= 1.5 ∙ 10−8m (C2.5).
Problem 3. Simplest model of gas discharge
This problem is a tribute to my teacher in science, Prof. F. Baimbetov

Part А. Non self-sustained gas discharge
Question A1

Question A2
Question A3
Question A4
Part B. Self-sustainedgas discharge
Question B1
Question B2
Question B3-B5
Questions B6,B7
Theoretical competition. Tuesday, 15 July 2014 1/2
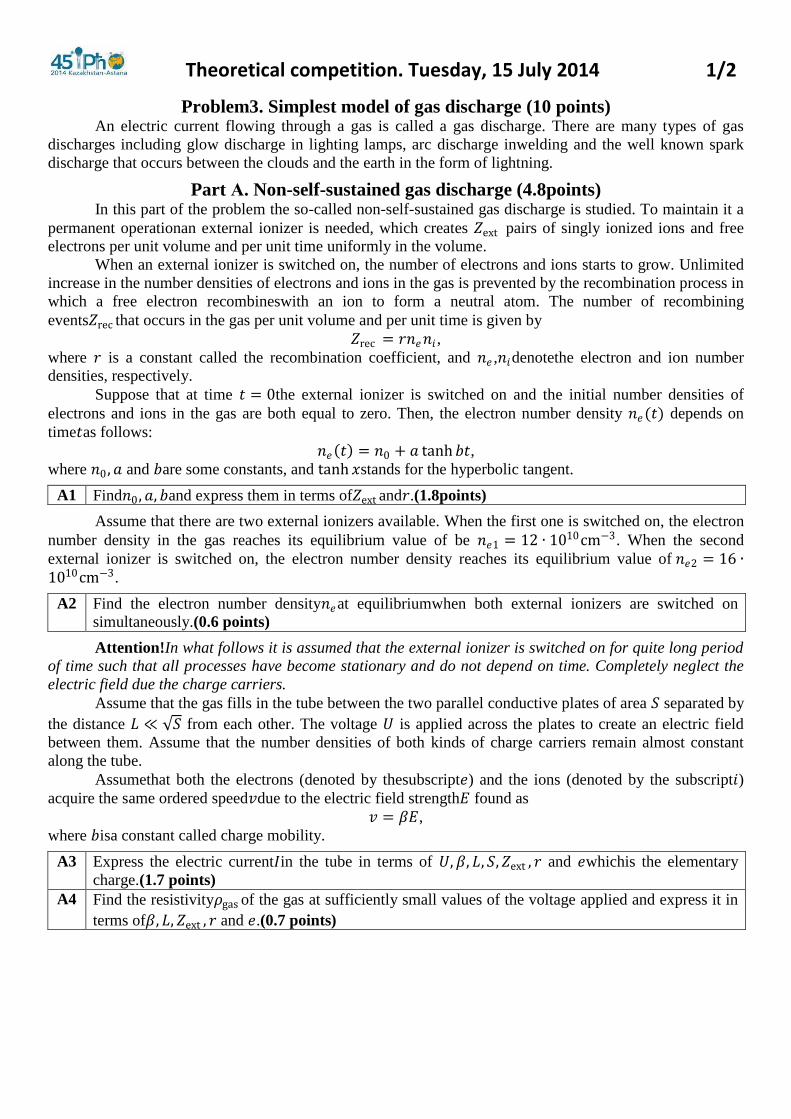
Problem3. Simplest model of gas discharge (10 points) An electric current flowing through a gas is called a gas discharge. There are many types of gas
discharges including glow discharge in lighting lamps, arc discharge inwelding and the well known spark
discharge that occurs between the clouds and the earth in the form of lightning.
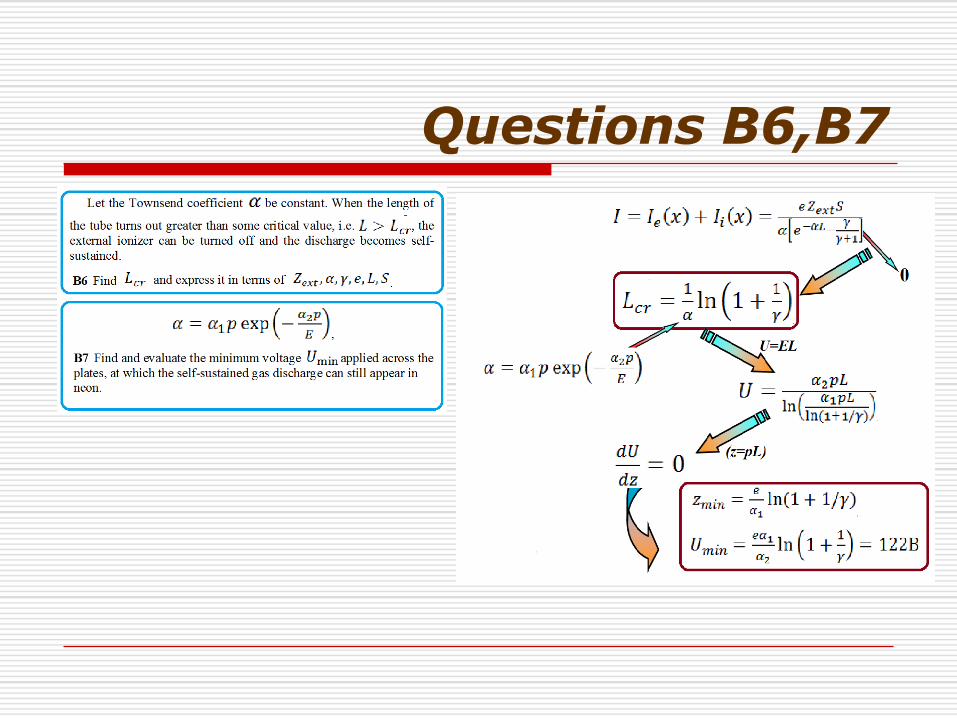
Part А. Non-self-sustained gas discharge (4.8points) In this part of the problem the so-called non-self-sustained gas discharge is studied. To maintain it a
permanent operationan external ionizer is needed, which creates 𝑍ext pairs of singly ionized ions and free
electrons per unit volume and per unit time uniformly in the volume.
When an external ionizer is switched on, the number of electrons and ions starts to grow. Unlimited
increase in the number densities of electrons and ions in the gas is prevented by the recombination process in
which a free electron recombineswith an ion to form a neutral atom. The number of recombining
events𝑍rec that occurs in the gas per unit volume and per unit time is given by
𝑍rec = 𝑟𝑛𝑒𝑛𝑖 ,
where 𝑟 is a constant called the recombination coefficient, and 𝑛𝑒 ,𝑛𝑖denotethe electron and ion number
densities, respectively.
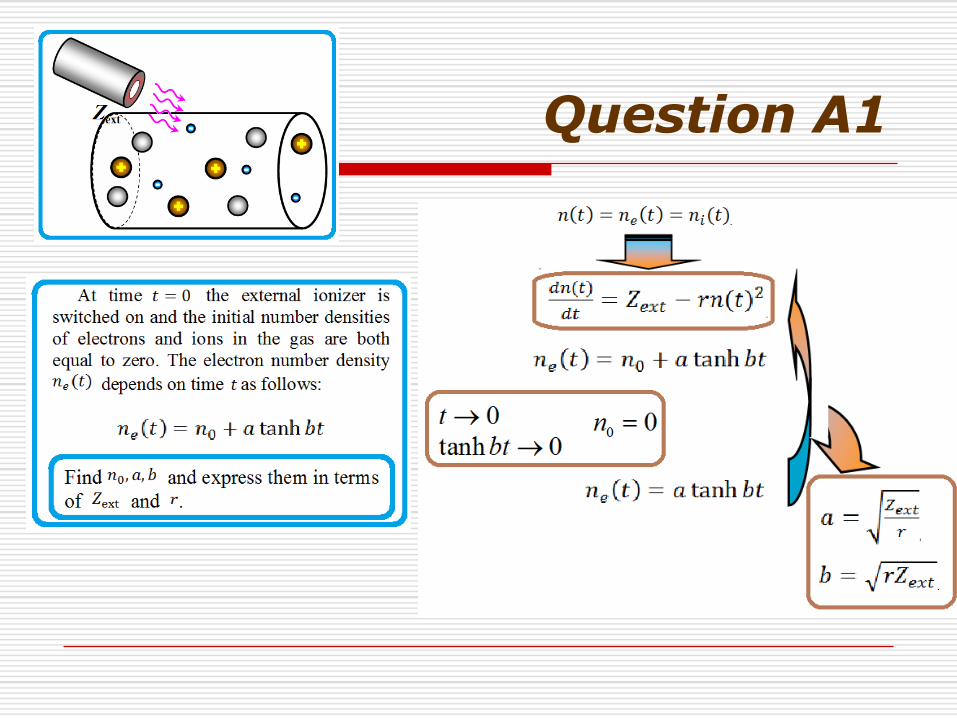
Suppose that at time 𝑡 = 0the external ionizer is switched on and the initial number densities of
electrons and ions in the gas are both equal to zero. Then, the electron number density 𝑛𝑒(𝑡) depends on
time𝑡as follows:
𝑛𝑒 𝑡 = 𝑛0 + 𝑎 tanh𝑏𝑡,
where 𝑛0 , 𝑎 and 𝑏are some constants, and tanh 𝑥stands for the hyperbolic tangent.
A1 Find𝑛0 , 𝑎, 𝑏and express them in terms of𝑍ext and𝑟.(1.8points)
Assume that there are two external ionizers available. When the first one is switched on, the electron
number density in the gas reaches its equilibrium value of be 𝑛𝑒1 = 12 ∙ 1010cm−3. When the second
external ionizer is switched on, the electron number density reaches its equilibrium value of 𝑛𝑒2 = 16 ∙1010cm−3.
A2 Find the electron number density𝑛𝑒at equilibriumwhen both external ionizers are switched on
simultaneously.(0.6 points)
Attention!In what follows it is assumed that the external ionizer is switched on for quite long period
of time such that all processes have become stationary and do not depend on time. Completely neglect the
electric field due the charge carriers.
Assume that the gas fills in the tube between the two parallel conductive plates of area 𝑆 separated by
the distance 𝐿 ≪ 𝑆 from each other. The voltage 𝑈 is applied across the plates to create an electric field
between them. Assume that the number densities of both kinds of charge carriers remain almost constant
along the tube.
Assumethat both the electrons (denoted by thesubscript𝑒) and the ions (denoted by the subscript𝑖) acquire the same ordered speed𝑣due to the electric field strength𝐸 found as
𝑣 = 𝛽𝐸,
where 𝑏isa constant called charge mobility.
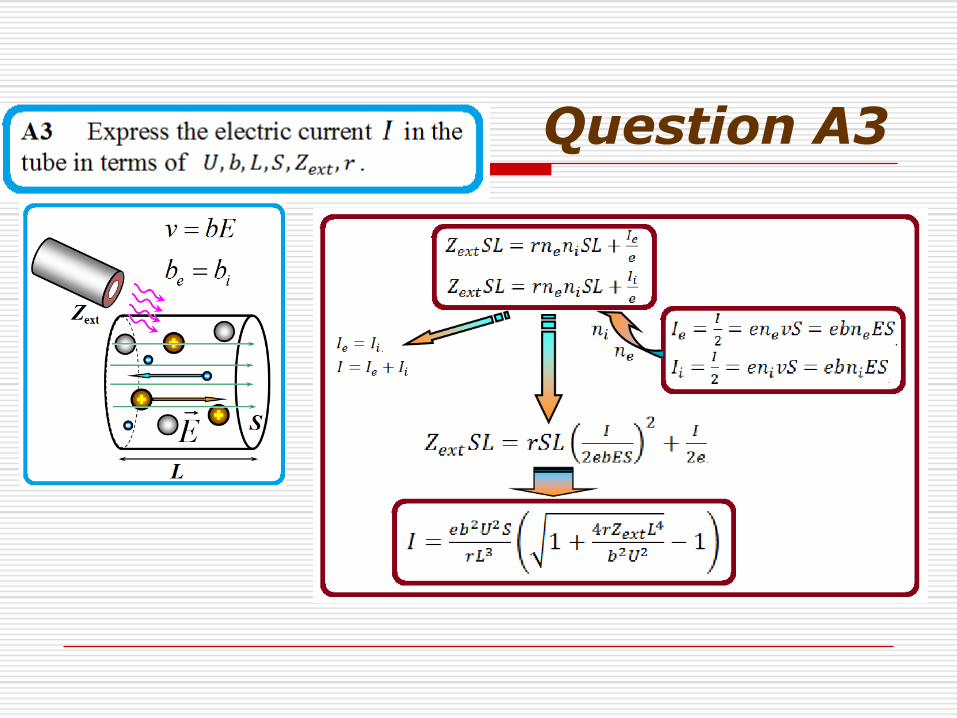
A3 Express the electric current𝐼in the tube in terms of 𝑈, 𝛽, 𝐿, 𝑆, 𝑍ext , 𝑟 and 𝑒whichis the elementary
charge.(1.7 points)
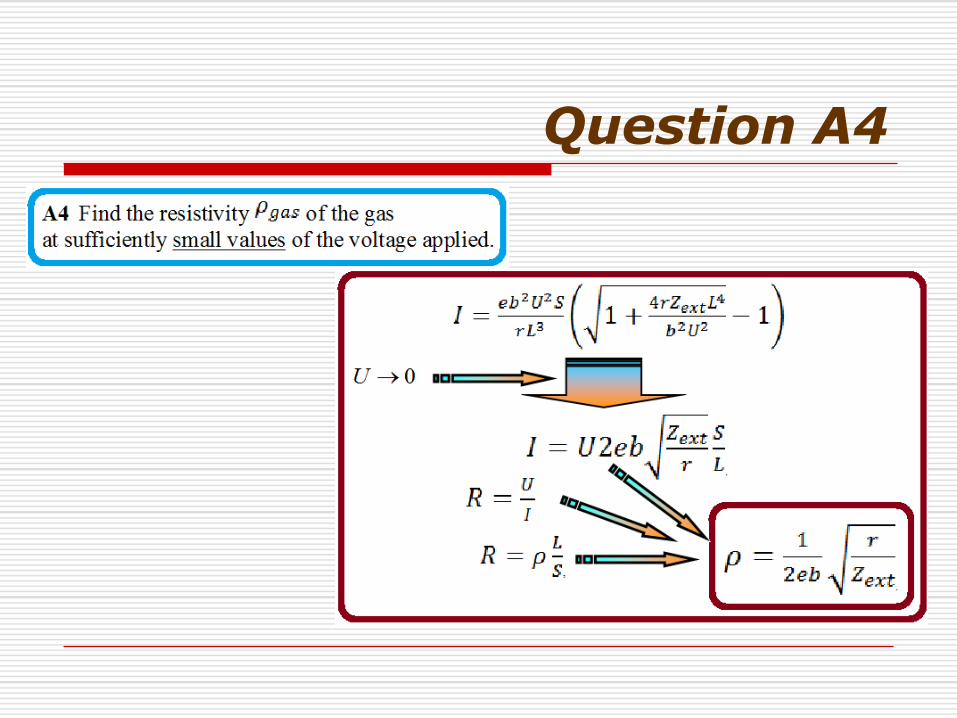
A4 Find the resistivity𝜌gas of the gas at sufficiently small values of the voltage applied and express it in
terms of𝛽, 𝐿, 𝑍ext , 𝑟 and 𝑒.(0.7 points)

Theoretical competition. Tuesday, 15 July 2014 2/2
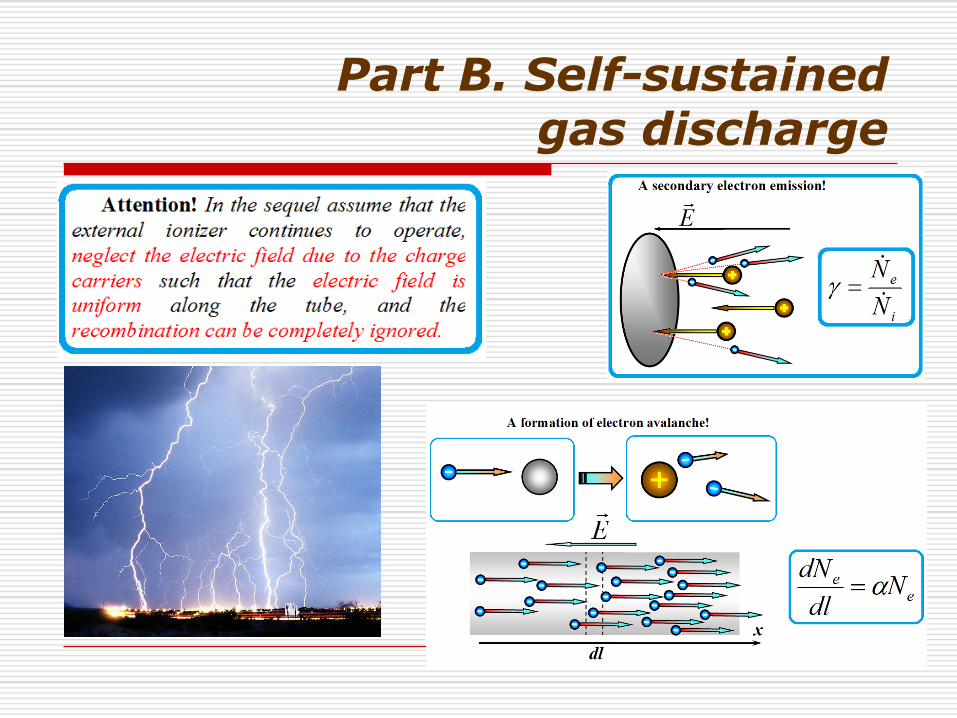
PartB. Self-sustained gas discharge (5.2 points) In this part of the problemthe ignition of the self-sustained gas discharge is consideredto show how
the electric current in the tube becomes self-maintaining.
Attention!In the sequel assume that the external ionizer continues to operatewith the same 𝑍ext rate,
neglect the electric field due to the charge carriers such that the electric field is uniform along the tube, and
the recombination can be completely ignored.
For the self-sustained gas discharge there are two
important processes not considered above. The first process
isasecondary electron emission, and the second one isa
formation of electron avalanche. The secondary electron
emission occurs when ions hit on the negative electrode,
called a cathode, and the electrons are knocked out of it to
move towards the positive electrode, called an anode. The
ratio of the number of the knocked electrons𝑁 𝑒per unit
timeto the number of ions𝑁𝑖 hitting the cathode per unit
time is called the coefficient of the secondary electron
emission,𝛾 = 𝑁 𝑒/𝑁𝑖 .The formation of the electron
avalanche isexplained as follows. The electric field accelerates free electrons which acquire enough kinetic
energy to ionize the atoms in the gas by hitting them. As a result the number of free electrons moving
towards the anodesignificantly increases. This process is described by the Townsend coefficient 𝛼, which
characterizes an increase in the number of electrons𝑑𝑁𝑒due to moving 𝑁𝑒 electrons that have passed the
distance𝑑𝑙, i.e. 𝑑𝑁𝑒
𝑑𝑙= 𝛼𝑁𝑒 .
The total current𝐼 in any cross section of the gas tube consists of the ion 𝐼𝑖(𝑥)and the electron𝐼𝑒(𝑥)
currents which, in the steady state, depend on the coordinate 𝑥, shown in the figureabove. The electron
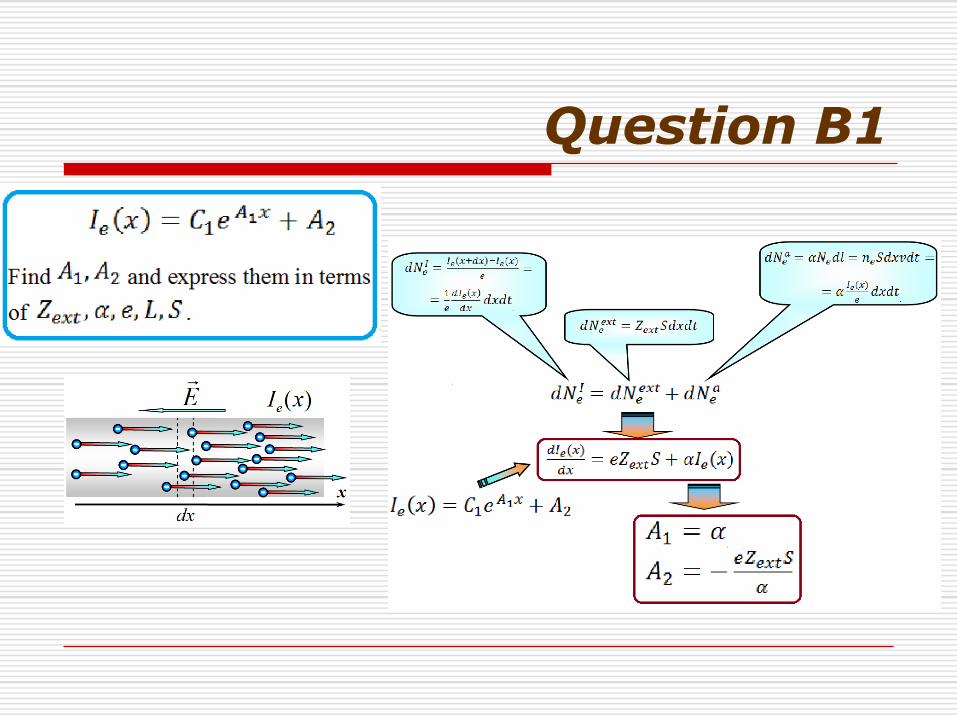
current 𝐼𝑒(𝑥) varies along the 𝑥-axis according to the formula
𝐼𝑒 𝑥 = 𝐶1𝑒𝐴1𝑥 + 𝐴2,
where 𝐴1 , 𝐴2, 𝐶1 are some constants.
B1 Find𝐴1 , 𝐴2and express them in terms of𝑍ext , 𝛼, 𝑒, 𝐿, 𝑆.(2 points)
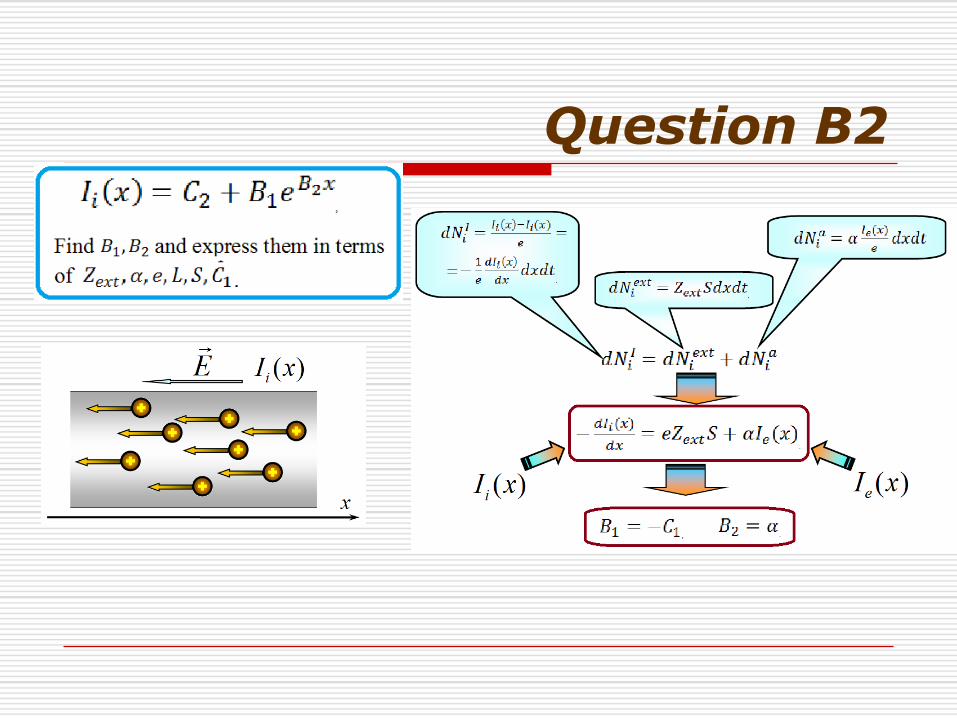
The ion current 𝐼𝑖(𝑥) varies along the 𝑥-axis according to the formula
𝐼𝑖 𝑥 = 𝐶2 + 𝐵1𝑒𝐵2𝑥 ,
where 𝐵1, 𝐵2,𝐶2 are some constants.
B2 Find𝐵1, 𝐵2and express them in terms of𝑍ext , 𝛼, 𝑒, 𝐿, 𝑆, 𝐶1.(0.6 points)
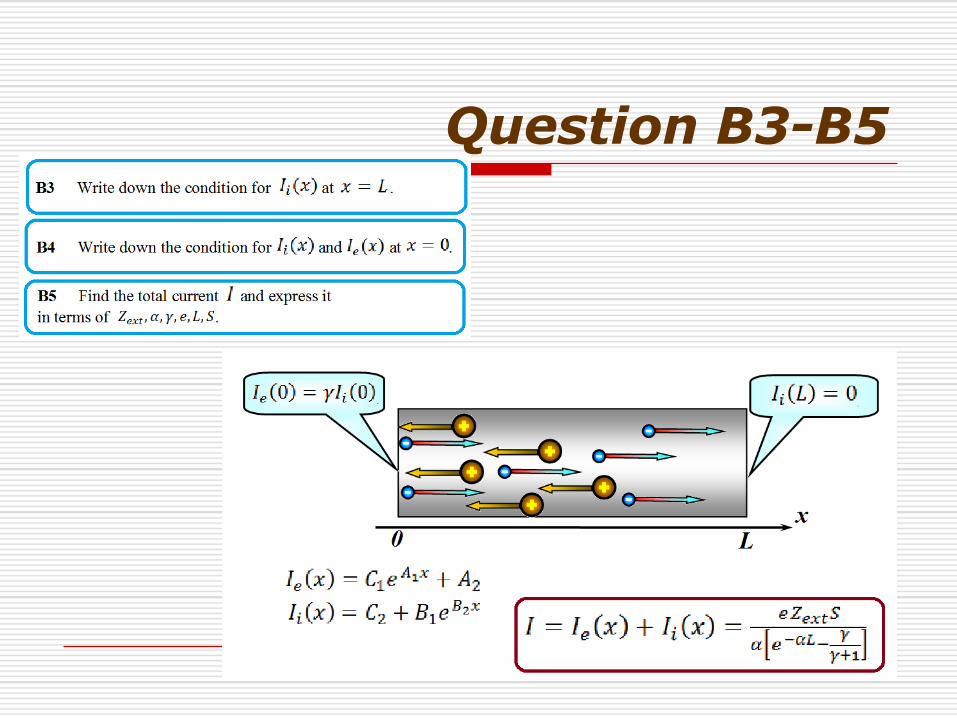
B3 Write down the condition for 𝐼𝑖(𝑥)at𝑥 = 𝐿.(0.3 points)
B4 Write down the condition for𝐼𝑖(𝑥)and𝐼𝑒(𝑥)at 𝑥 = 0.(0.6 points)
B5 Find the total current𝐼and express it in terms of𝑍ext , 𝛼, 𝛾, 𝑒, 𝐿, 𝑆.Assume that it remains finite
(1.2 points)
Let the Townsend coefficient 𝛼be constant. When the length of the tube turns out greater than some
critical value, i.e. 𝐿 > 𝐿cr , the external ionizer can be turned off and the discharge becomes self-sustained.
B6 Find𝐿𝑐𝑟and express it in terms of𝑍ext , 𝛼, 𝛾, 𝑒, 𝐿, 𝑆.(0.5 points)
Theoretical competition. Tuesday, 15 July 2014 1/3
Problem 3. Simplest model of gas discharge
Solution
Part А. Non-self-sustained gas discharge
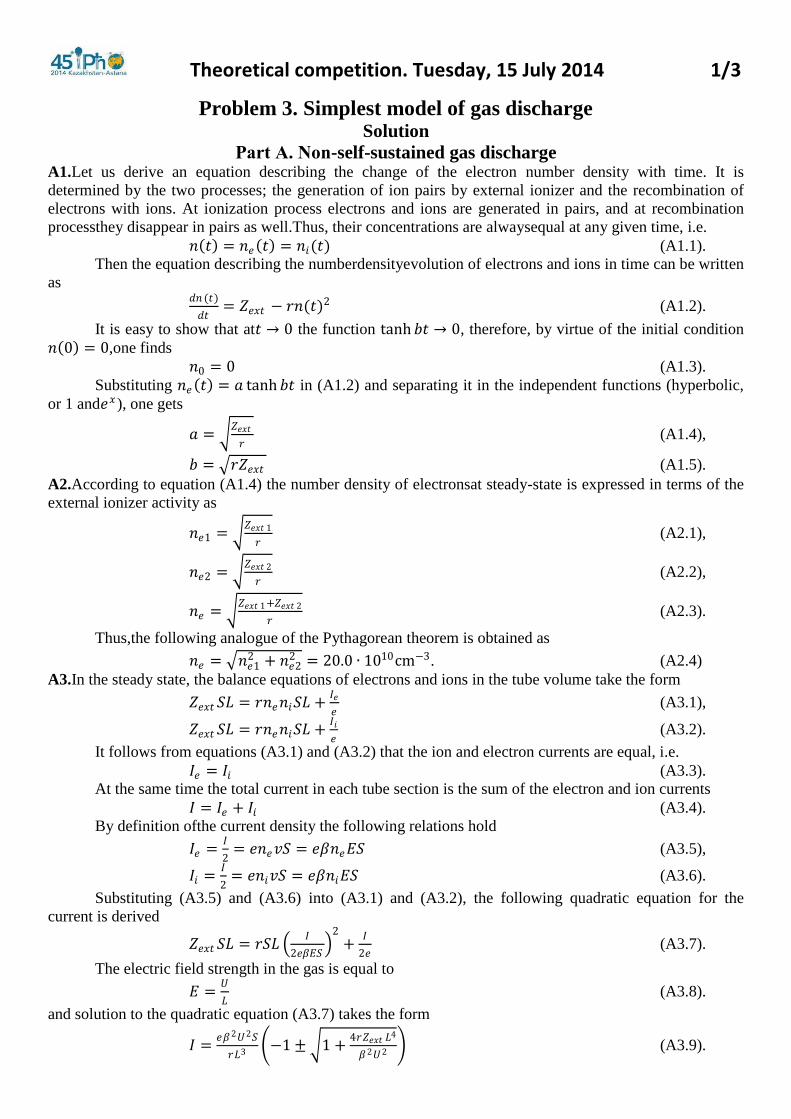
A1.Let us derive an equation describing the change of the electron number density with time. It is
determined by the two processes; the generation of ion pairs by external ionizer and the recombination of
electrons with ions. At ionization process electrons and ions are generated in pairs, and at recombination
processthey disappear in pairs as well.Thus, their concentrations are alwaysequal at any given time, i.e.
𝑛 𝑡 = 𝑛𝑒 𝑡 = 𝑛𝑖(𝑡) (A1.1).
Then the equation describing the numberdensityevolution of electrons and ions in time can be written
as
𝑑𝑛 (𝑡)
𝑑𝑡= 𝑍𝑒𝑥𝑡 − 𝑟𝑛(𝑡)2 (A1.2).
It is easy to show that at𝑡 → 0 the function tanh𝑏𝑡 → 0, therefore, by virtue of the initial condition
𝑛 0 = 0,one finds
𝑛0 = 0 (A1.3).
Substituting 𝑛𝑒 𝑡 = 𝑎 tanh𝑏𝑡 in (A1.2) and separating it in the independent functions (hyperbolic,
or 1 and𝑒𝑥 ), one gets
𝑎 = 𝑍𝑒𝑥𝑡
𝑟 (A1.4),
𝑏 = 𝑟𝑍𝑒𝑥𝑡 (A1.5).
A2.According to equation (A1.4) the number density of electronsat steady-state is expressed in terms of the
external ionizer activity as
𝑛𝑒1 = 𝑍𝑒𝑥𝑡 1
𝑟 (A2.1),
𝑛𝑒2 = 𝑍𝑒𝑥𝑡 2
𝑟 (A2.2),
𝑛𝑒 = 𝑍𝑒𝑥𝑡 1+𝑍𝑒𝑥𝑡 2
𝑟 (A2.3).
Thus,the following analogue of the Pythagorean theorem is obtained as
𝑛𝑒 = 𝑛𝑒12 + 𝑛𝑒2
2 = 20.0 ∙ 1010cm−3. (A2.4)
A3.In the steady state, the balance equations of electrons and ions in the tube volume take the form
𝑍𝑒𝑥𝑡 𝑆𝐿 = 𝑟𝑛𝑒𝑛𝑖𝑆𝐿 +𝐼𝑒
𝑒 (A3.1),
𝑍𝑒𝑥𝑡 𝑆𝐿 = 𝑟𝑛𝑒𝑛𝑖𝑆𝐿 +𝐼𝑖
𝑒 (A3.2).
It follows from equations (A3.1) and (A3.2) that the ion and electron currents are equal, i.e.
𝐼𝑒 = 𝐼𝑖 (A3.3).
At the same time the total current in each tube section is the sum of the electron and ion currents
𝐼 = 𝐼𝑒 + 𝐼𝑖 (A3.4).
By definition ofthe current density the following relations hold
𝐼𝑒 =𝐼
2= 𝑒𝑛𝑒𝑣𝑆 = 𝑒𝛽𝑛𝑒𝐸𝑆 (A3.5),
𝐼𝑖 =𝐼
2= 𝑒𝑛𝑖𝑣𝑆 = 𝑒𝛽𝑛𝑖𝐸𝑆 (A3.6).
Substituting (A3.5) and (A3.6) into (A3.1) and (A3.2), the following quadratic equation for the
current is derived
𝑍𝑒𝑥𝑡 𝑆𝐿 = 𝑟𝑆𝐿 𝐼
2𝑒𝛽𝐸𝑆 2
+𝐼
2𝑒 (A3.7).
The electric field strength in the gas is equal to
𝐸 =𝑈
𝐿 (A3.8).
and solution to the quadratic equation (A3.7) takes the form
𝐼 =𝑒𝛽2𝑈2𝑆
𝑟𝐿3 −1± 1 +
4𝑟𝑍𝑒𝑥𝑡 𝐿4
𝛽2𝑈2 (A3.9).
Theoretical competition. Tuesday, 15 July 2014 2/3
It is obvious that only positive root does make sense, i.e.
𝐼 =𝑒𝛽2𝑈2𝑆
𝑟𝐿3 1 +
4𝑟𝑍𝑒𝑥𝑡 𝐿4
𝛽2𝑈2− 1 (A3.10).
A4.At low voltages (A3.10) simplifies and gives the following expression
𝐼 = 2𝑈𝑒𝛽 𝑍𝑒𝑥𝑡
𝑟
𝑆
𝐿. (A4.1)
which is actually the Ohm law.
Using the well-known relation
𝑅 =𝑈
𝐼 (A4.2)
together with
𝑅 = 𝜌𝐿
𝑆 (A4.3),
one gets
𝜌 =1
2𝑒𝛽
𝑟
𝑍𝑒𝑥𝑡 (A4.4).
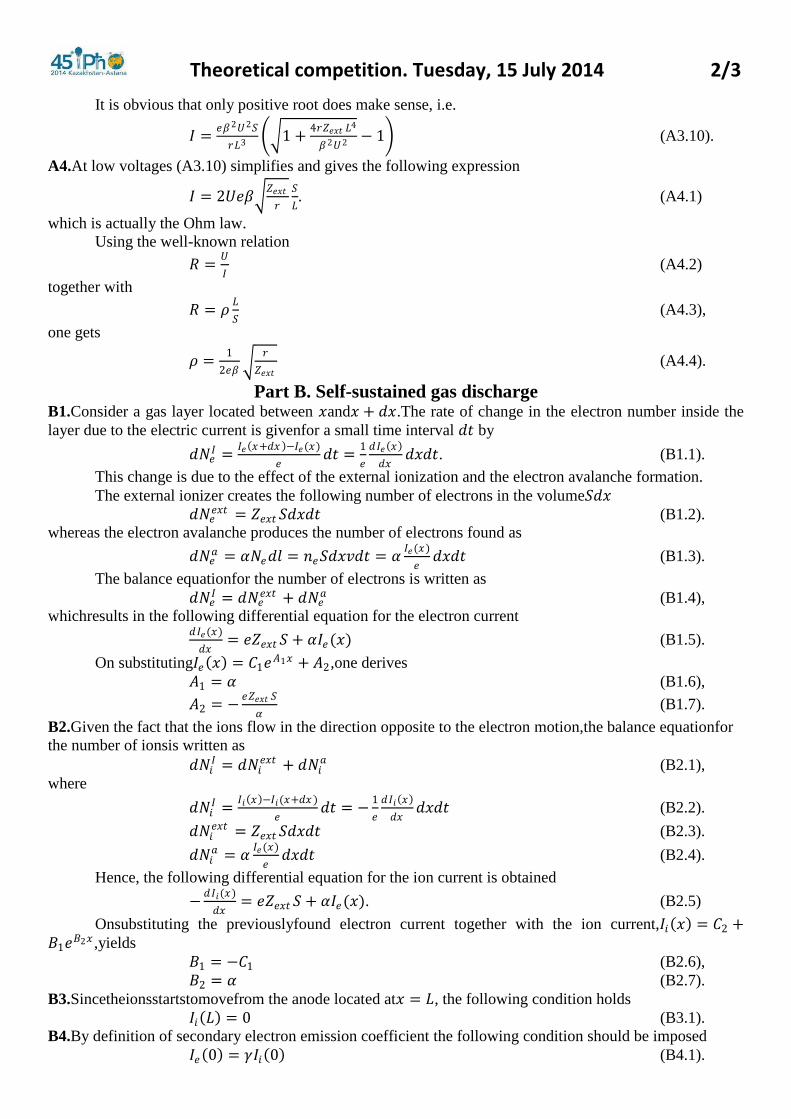
Part B. Self-sustained gas discharge
B1.Consider a gas layer located between 𝑥and𝑥 + 𝑑𝑥.The rate of change in the electron number inside the
layer due to the electric current is givenfor a small time interval 𝑑𝑡 by
𝑑𝑁𝑒𝐼 =
𝐼𝑒 𝑥+𝑑𝑥 −𝐼𝑒(𝑥)
𝑒𝑑𝑡 =
1
𝑒
𝑑𝐼𝑒 𝑥
𝑑𝑥𝑑𝑥𝑑𝑡. (B1.1).
This change is due to the effect of the external ionization and the electron avalanche formation.
The external ionizer creates the following number of electrons in the volume𝑆𝑑𝑥
𝑑𝑁𝑒𝑒𝑥𝑡 = 𝑍𝑒𝑥𝑡 𝑆𝑑𝑥𝑑𝑡 (B1.2).
whereas the electron avalanche produces the number of electrons found as
𝑑𝑁𝑒𝑎 = 𝛼𝑁𝑒𝑑𝑙 = 𝑛𝑒𝑆𝑑𝑥𝑣𝑑𝑡 = 𝛼
𝐼𝑒(𝑥)
𝑒𝑑𝑥𝑑𝑡 (B1.3).
The balance equationfor the number of electrons is written as
𝑑𝑁𝑒𝐼 = 𝑑𝑁𝑒
𝑒𝑥𝑡 + 𝑑𝑁𝑒𝑎 (B1.4),
whichresults in the following differential equation for the electron current
𝑑𝐼𝑒(𝑥)
𝑑𝑥= 𝑒𝑍𝑒𝑥𝑡 𝑆 + 𝛼𝐼𝑒(𝑥) (B1.5).
On substituting𝐼𝑒 𝑥 = 𝐶1𝑒𝐴1𝑥 + 𝐴2,one derives
𝐴1 = 𝛼 (B1.6),
𝐴2 = −𝑒𝑍𝑒𝑥𝑡 𝑆
𝛼 (B1.7).
B2.Given the fact that the ions flow in the direction opposite to the electron motion,the balance equationfor
the number of ionsis written as
𝑑𝑁𝑖𝐼 = 𝑑𝑁𝑖
𝑒𝑥𝑡 + 𝑑𝑁𝑖𝑎 (B2.1),
where
𝑑𝑁𝑖𝐼 =
𝐼𝑖 𝑥 −𝐼𝑖(𝑥+𝑑𝑥 )
𝑒𝑑𝑡 = −
1
𝑒
𝑑𝐼𝑖 𝑥
𝑑𝑥𝑑𝑥𝑑𝑡 (B2.2).
𝑑𝑁𝑖𝑒𝑥𝑡 = 𝑍𝑒𝑥𝑡 𝑆𝑑𝑥𝑑𝑡 (B2.3).
𝑑𝑁𝑖𝑎 = 𝛼
𝐼𝑒(𝑥)
𝑒𝑑𝑥𝑑𝑡 (B2.4).
Hence, the following differential equation for the ion current is obtained
−𝑑𝐼𝑖(𝑥)
𝑑𝑥= 𝑒𝑍𝑒𝑥𝑡 𝑆 + 𝛼𝐼𝑒(𝑥). (B2.5)
Onsubstituting the previouslyfound electron current together with the ion current,𝐼𝑖 𝑥 = 𝐶2 +𝐵1𝑒
𝐵2𝑥 ,yields
𝐵1 = −𝐶1 (B2.6),
𝐵2 = 𝛼 (B2.7).
B3.Sincetheionsstartstomovefrom the anode located at𝑥 = 𝐿, the following condition holds
𝐼𝑖 𝐿 = 0 (B3.1).
B4.By definition of secondary electron emission coefficient the following condition should be imposed
𝐼𝑒 0 = 𝛾𝐼𝑖 0 (B4.1).
Theoretical competition. Tuesday, 15 July 2014 3/3
B5.Total current in each tube section is the sum of the electron and ion currents:
𝐼 = 𝐼𝑒 + 𝐼𝑖 = 𝐶2 −𝑒𝑍𝑒𝑥𝑡 𝑆
𝛼 (B5.1).
Aftersubstituting the boundary conditions (B3.1) and (B4.1):
𝐶2 − 𝐶1𝑒𝛼𝐿 = 0 (B5.2)
and
𝐶1 −𝑒𝑍𝑒𝑥𝑡 𝑆
𝛼= 𝛾(𝐶2 − 𝐶1) (B5.3).
Solving (B5.2) and (B5.3) one can obtain:
𝐶2 =𝑒𝑍𝑒𝑥𝑡 𝑆
𝛼
1
𝑒−𝛼𝐿 (1+𝛾)−𝛾 (B5.4).
So the total current:
𝐼 =𝑒𝑍𝑒𝑥𝑡 𝑆
𝛼
1
𝑒−𝛼𝐿 (1+𝛾)−𝛾− 1 (B5.5).
B6.When the discharge gap length is increased, the denominator in formula (B5.1) decreases. At that
moment, when it turns zero, the electric current in the gas becomes self-sustaining and external ionizer can
be turned off. Thus,
𝐿𝑐𝑟 =1
𝛼ln 1 +
1
𝛾 (B6.1).

Experimental competition. Thursday, 17 July 2014 1/9
Experiment. To see invisible! (20 points)
Introduction
Many substances exhibit optical anisotropy resulting in that the refractive index turns out dependent
on the direction of light propagation and its polarization. Optical anisotropy can occur even in isotropic
media in the presence of mechanical stresses, nonuniform heating or application of external electric fields.
The direction in which the light propagates without the birefringentis called the optic axis of a crystal.
Consider a traditional optic scheme of experiments for studying the optical anisotropy (see Fig. 1),
which is to be used in this experimental problem.
Fig. 1. Optic scheme of an experiment for studying the optical anisotropy.
Let a light beamfall onto polarizer 1 whose transmission plane intersects its ownplane along the
straight line 𝑂1𝑂1′ . After passing polarizer 1 the light beam becomes linearly polarized and its electric field
strength vector 𝐸 0 oscillatesexactly in the transmition plane of polarizer 1. Then, the light beam falls onto
the anisotropic plate P oriented such that its optical axis𝑃𝑃′lies in the plate plane to makethe angle 45° with
the transmission plane of polarizer 1. Two kinds of light waves are then generated in the plate P: ordinary
𝐸 𝑜 , polarized perpendicular to the optical axis of the plate, and extraordinary 𝐸 𝑒 , polarized along the optical
axis of the plate. Refractive indices for these two waves are different and their difference is denoted as
∆𝑛 = 𝑛𝑜 − 𝑛𝑒 . This results in the appearanceof the phase difference ∆𝜑 = 2𝜋ℎ∆𝑛/𝜆(ℎ being the plate
thickness, λ being the wavelength of the incident light in vacuum) between the two waves on leaving the
plate. Therefore, the polarization of the outgoing light beam changes to be elliptically polarized. The light
beam then falls onto polarizer 2, whosetransmission plane 𝑂2𝑂2′ is perpendicular to the transmission plane of
polarizer 1.
A simple derivation shows that the intensity of the light beam transmitted through the plate P and
polarizer 2 is determined as
𝐼2 = 𝑘𝐼0 sin2 ∆𝜑
2, (1)
where𝐼0stands for the light intensity falling onto the plate,𝑘 denotes the light transmittance coefficient of the
plate P and polarizer 2, and ∆𝜑designates the phase difference between the ordinary and extraordinary
waves after passing the plate P.
In this experiment do not evaluate errors unlessasked to do so!
The description of the equipment in Appendix A

Experimental competition. Thursday, 17 July 2014 2/9
Part 1.Qualitative observations!(3.5 points)
Part 1.1.Polarizers(0.8 points)
1.1 Find the orientation(i.e. which of the diagonals) of the transmission plane of polarizer 1 and
polarizer 2. Show these planes in the figure in the Answer Sheet. (0.8 points)
Part 1.2.Rulers(1.0 points)
In this part of the experiment uselight emitting diodes(LED) as a light source.
Fix LED on a stand and connect it to its power supply. Set up both polarizers by their face sides
(indicated bynumbers 1 and 2) pointing towards the light source. Make sure that the polarizers are crossed,
i.e. the light beamcannot pass through them. Block the first polarizer by a sheet of white paperplacing it on
the face side as shown in Fig.1B in Appendix B.
Place the plastic ruler1between the polarizers. You can move the ruler with your hands.
1.2.1 Find the possible directions of the optical axis in thecenter of the plastic ruler. Show these
directions in the figure on the Answer Sheet. (0.4 points)
1.2.2 Determine approximately at what distance along the ruler 1 and along the two rulersstacked
together, the phase difference for the blue light changes to 2π. (0.6 points)
Part 1.3.Strip(0.8 points)
1.3.1 Find the possible directions of the optical axis of the strip. Show qualitatively them in the figure in
the Answer Sheet. (0.4 points)
Using the clamps fix a long flexible plastic strip on the screen so that the strip edges coincide with the
sсreenedges. The stripshould be curved (see Fig. 3B). Place the screen with the strip between the polarizers.
Shifting the screen, observe the color change of the strip. Measure x coordinates of strip points on the screen
scale, use the left edge of the screenholder as an origin as shown in Figure 3B.
Hereinafter coordinates are measured by the scale in the screen. As a pointer, use the left edge of the
holder, which indicated in Fig. 3B by the arrow!
1.3.2 Measure the coordinates of the middle points of two dark bands, the left 𝑥𝐿and the right 𝑥𝑅 ,
visible on the strip. (0.4 points)
Part 1.4.Liquid crystal cell(0.9 points)
Liquid crystal (LC) is a state of matter that is
intermediate between the crystalline solid and the amorphous
liquid. The orientation of its molecules can be easily aligned
and controlled by applying an electrical field. The LC cell
exhibits the optical anisotropy phenomenon with two principal
refractive indices. The magnitude of this effect depends on the
applied AC voltage. The Liquid Crystal Cell (LCC) is
composed of two glass plates 1 whose inner surface is coated
with a transparent conductive layer 2. Between the plates there
is a thin (approximately 10 microns) layer of the solution 3
which is in a liquid crystal state. Leads are soldered to the
plates for connecting to the AC power supply.
Place the liquid crystal cell (LCC) between the polarizers. Plug it into its power supply. Varying the
voltage across the LCC observe the changing colors of the light transmitted through it.
1.4.1 Find the possible directions of the optical axis of the LCC at zero and maximum voltageapplied
across it. Show these directions in the figure on the Answer Sheet. Z-axis is directed vertically.(0.6
points)
Experimental competition. Thursday, 17 July 2014 3/9
1.4.2 Measure the voltage𝑈𝑐𝑟 across the cell at which abrupt,with respect to voltage, reorientation of
liquid crystal molecules by 90° occur.Make sure that multimeter is on AC voltage mode.(0.3
points).
Part 2.Measure!(16.5 points)
Disconnect the LED from the power supply and remove it. Remove the sheet of white paper.
In this part of the work use laser as a light source, make sure you connect it to its power supply!
Fixthe laser, polarizer 1, the screen with the slit and a photodetector (a photodiode) in the holders.
Adjust the setting so that the laser beam passes through the polarizer andthe slit of the screen to fall strictly
onto the photodiode. Using the screw 5c for the beam width adjustment, make sure that the spot size on the
photodetectoris about 5-6 mm.
The laser emits a linearly polarized light. With the ring 5a designed for the laser reorientation,make
sure that the laser beam almost completely passes through the first polarizer and the major axis of the
elliptically-shaped spot is vertical. In the following,the orientations of the laser and the photodetectormust be
fixed with the screws 5d and15c. Set up polarizer 2. Make sure that the polarizers are crossed. Fig. 4B shows
the whole setup with the screen mounted.
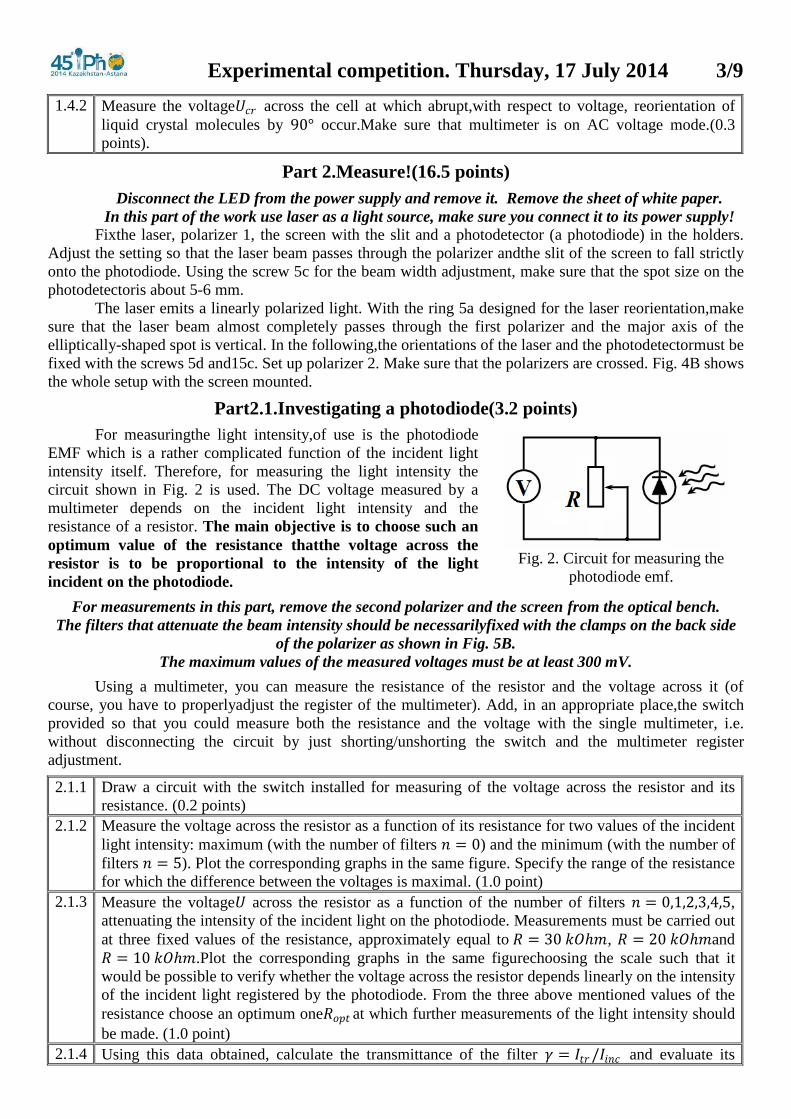
Part2.1.Investigating a photodiode(3.2 points)
For measuringthe light intensity,of use is the photodiode
EMF which is a rather complicated function of the incident light
intensity itself. Therefore, for measuring the light intensity the
circuit shown in Fig. 2 is used. The DC voltage measured by a
multimeter depends on the incident light intensity and the
resistance of a resistor. The main objective is to choose such an
optimum value of the resistance thatthe voltage across the
resistor is to be proportional to the intensity of the light
incident on the photodiode.
For measurements in this part, remove the second polarizer and the screen from the optical bench.
The filters that attenuate the beam intensity should be necessarilyfixed with the clamps on the back side
of the polarizer as shown in Fig. 5B.
The maximum values of the measured voltages must be at least 300 mV.
Using a multimeter, you can measure the resistance of the resistor and the voltage across it (of
course, you have to properlyadjust the register of the multimeter). Add, in an appropriate place,the switch
provided so that you could measure both the resistance and the voltage with the single multimeter, i.e.
without disconnecting the circuit by just shorting/unshorting the switch and the multimeter register
adjustment.
2.1.1 Draw a circuit with the switch installed for measuring of the voltage across the resistor and its
resistance. (0.2 points)
2.1.2 Measure the voltage across the resistor as a function of its resistance for two values of the incident
light intensity: maximum (with the number of filters 𝑛 = 0) and the minimum (with the number of
filters 𝑛 = 5). Plot the corresponding graphs in the same figure. Specify the range of the resistance
for which the difference between the voltages is maximal. (1.0 point)
2.1.3 Measure the voltage𝑈 across the resistor as a function of the number of filters 𝑛 = 0,1,2,3,4,5,
attenuating the intensity of the incident light on the photodiode. Measurements must be carried out
at three fixed values of the resistance, approximately equal to 𝑅 = 30 𝑘𝑂ℎ𝑚, 𝑅 = 20 𝑘𝑂ℎ𝑚and
𝑅 = 10 𝑘𝑂ℎ𝑚.Plot the corresponding graphs in the same figurechoosing the scale such that it
would be possible to verify whether the voltage across the resistor depends linearly on the intensity
of the incident light registered by the photodiode. From the three above mentioned values of the
resistance choose an optimum one𝑅𝑜𝑝𝑡 at which further measurements of the light intensity should
be made. (1.0 point)
2.1.4 Using this data obtained, calculate the transmittance of the filter 𝛾 = 𝐼𝑡𝑟/𝐼𝑖𝑛𝑐 and evaluate its
Fig. 2. Circuit for measuring the
photodiode emf.

Experimental competition. Thursday, 17 July 2014 4/9
error,with𝐼𝑡𝑟 being the intensity of the transmitted light, and 𝐼𝑖𝑛𝑐 being the intensity of the incident
light. You can make additional measurements if necessary. (1.0 point)
All subsequent measurements must be made at the optimal value of the resistor chosen!
It is assumed in what follows that the light intensityin relative units is equal to the voltage across the
resistor in mV.
Part 2.2 Light transmission through plastic rulers(5.4 points)
Place the plastic ruler between the polarizers. You can move the ruler with your hands. Then, secure
it with the clamps on the screen with a slit (see Fig. 2B). The lower edge of the ruler should coincide with a
line drawn on the screen, and its scale should be at the top. Make sure that both of the rulers provided
demonstrate the birefringence phenomenon. Observe a picture emerging when you put one ruler on the top
of the other so that light is to pass through both of them.
In this part use an optical scheme shown in Fig. 4B. Make sure that the rulersare fixed on the screen
at the position described in Part 1.2.
2.2.1 Measure the intensity of the transmitted light (in mV) as a functionof the coordinate𝑥 of the point
of the light incidence on the ruler in the range from 0 to 10 cm.. Measurements must be carried out
for each ruler provided and for the two rulers stacked together. In each case, measure the
maximum value of the voltage. Plot the corresponding graphs in the same figure. (2.0 points)
2.2.2 For each of the two rules calculate the values of the phase shift ∆𝜑 between the ordinary and
extraordinary waves in the range of 𝑥 from 0 to 7 cm.Plotthe correspondinggraphs∆𝜑(𝑥).Put down
the formula you have used for calculations. (1.2 points)
Note that the phase difference cannot unambiguously be determined from formula
(1),additional physical assumptions should be applied to determine it correctly.
2.2.3 Assuming that ∆𝜑(𝑥) is linear for each ruler
∆𝜑1 = 𝑎1𝑥 + 𝑏1,
∆𝜑2 = 𝑎2𝑥 + 𝑏2,
calculate the numerical values of theabove coefficients for rulers 1 and 2. (1.0 point)
2.2.4 Using those data obtained in parts 2.2.1-2.2.3, calculate the theoretical values of the intensity of
light passing through the two rulersstacked together. Put down the formula that you have used for
calculations. Plot the theoretical dependence in the same figure from part 2.2.1. (1.2 point)
Part 2.3 Liquid crystal cell(4.5 points)
Light transmission through LCC
Place the LCC between the polarizers as shown in Fig. 6B.
The experimental dependence under investigation is strongly nonmonotonicwith domains of quite abrupt
changes. Take this into account when taking measurements.
To measure the AC voltage of the cellpower supply and the DC voltage of the photodetector, connect the
appropriate leads directly to the multimeter.
2.3.1 Measure the intensity of the transmitted light as a function of the voltage across the LCC. Plot
the corresponding graph. (2.0 points)
2.3.2 Calculate the phase difference between the ordinary and extraordinary waves ∆𝜑0when the
power supply is disconnected with the LCC. (1.5 points)
2.3.3 In a sufficiently wide range of the voltage dropacross the LCC, the phase difference between the
ordinary and extraordinary waves depends on the voltage applied by the power law
∆𝜑 = 𝐶𝑈𝛽 .
Using the data obtained, plot the graphwhich allows one to determine the applicability range of
the above formula and calculate the exponent𝛽. Specify that range of applicability and evaluate
the numerical value of the parameter𝛽. (1.0 point)
Experimental competition. Thursday, 17 July 2014 5/9
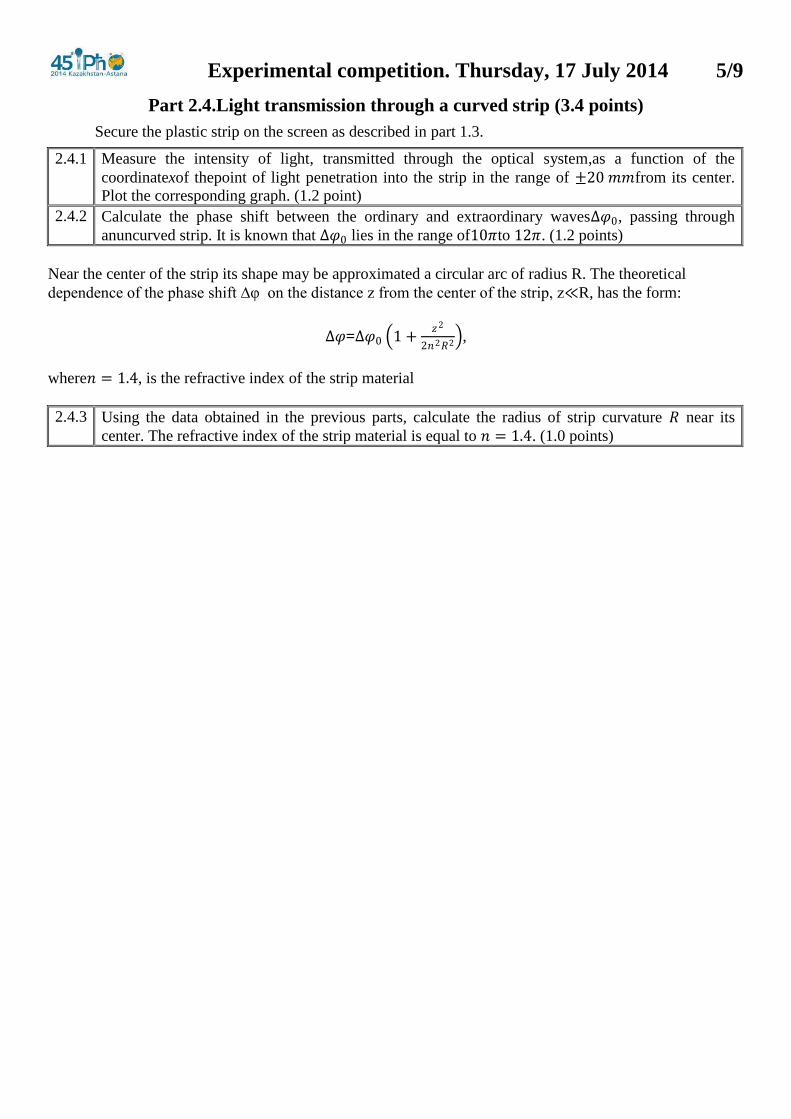
Part 2.4.Light transmission through a curved strip (3.4 points)
Secure the plastic strip on the screen as described in part 1.3.
2.4.1 Measure the intensity of light, transmitted through the optical system,as a function of the
coordinatexof thepoint of light penetration into the strip in the range of ±20 𝑚𝑚from its center.
Plot the corresponding graph. (1.2 point)
2.4.2 Calculate the phase shift between the ordinary and extraordinary waves∆𝜑0, passing through
anuncurved strip. It is known that ∆𝜑0 lies in the range of10𝜋to 12𝜋. (1.2 points)
Near the center of the strip its shape may be approximated a circular arc of radius R. The theoretical
dependence of the phase shift ∆φ on the distance z from the center of the strip, z≪R, has the form:
∆𝜑=∆𝜑0 1 +𝑧2
2𝑛2𝑅2 ,
where𝑛 = 1.4, is the refractive index of the strip material
2.4.3 Using the data obtained in the previous parts, calculate the radius of strip curvature 𝑅 near its
center. The refractive index of the strip material is equal to 𝑛 = 1.4. (1.0 points)
Experimental competition. Thursday, 17 July 2014 6/9
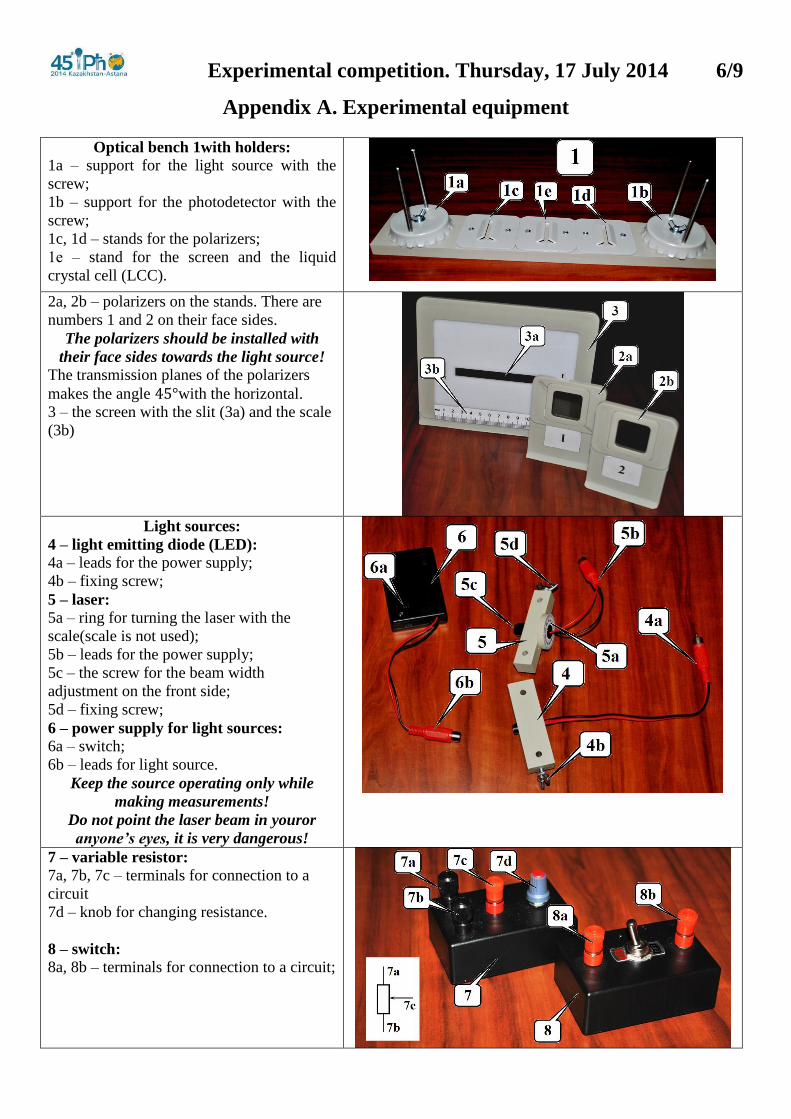
Appendix A. Experimental equipment
Optical bench 1with holders:
1a – support for the light source with the
screw;
1b – support for the photodetector with the
screw;
1c, 1d – stands for the polarizers;
1е – stand for the screen and the liquid
crystal cell (LCC).
2a, 2b – polarizers on the stands. There are
numbers 1 and 2 on their face sides.
The polarizers should be installed with
their face sides towards the light source! The transmission planes of the polarizers
makes the angle 45°with the horizontal.
3 – the screen with the slit (3a) and the scale
(3b)
Light sources:
4 – light emitting diode (LED):
4a – leads for the power supply;
4b – fixing screw;
5 – laser:
5a – ring for turning the laser with the
scale(scale is not used);
5b – leads for the power supply;
5c – the screw for the beam width
adjustment on the front side;
5d – fixing screw;
6 – power supply for light sources:
6a – switch;
6b – leads for light source.
Keep the source operating only while
making measurements!
Do not point the laser beam in youror
anyone’s eyes, it is very dangerous!
7 – variable resistor:
7a, 7b, 7c – terminals for connection to a
circuit
7d – knob for changing resistance.
8 – switch:
8a, 8b – terminals for connection to a circuit;
Experimental competition. Thursday, 17 July 2014 7/9
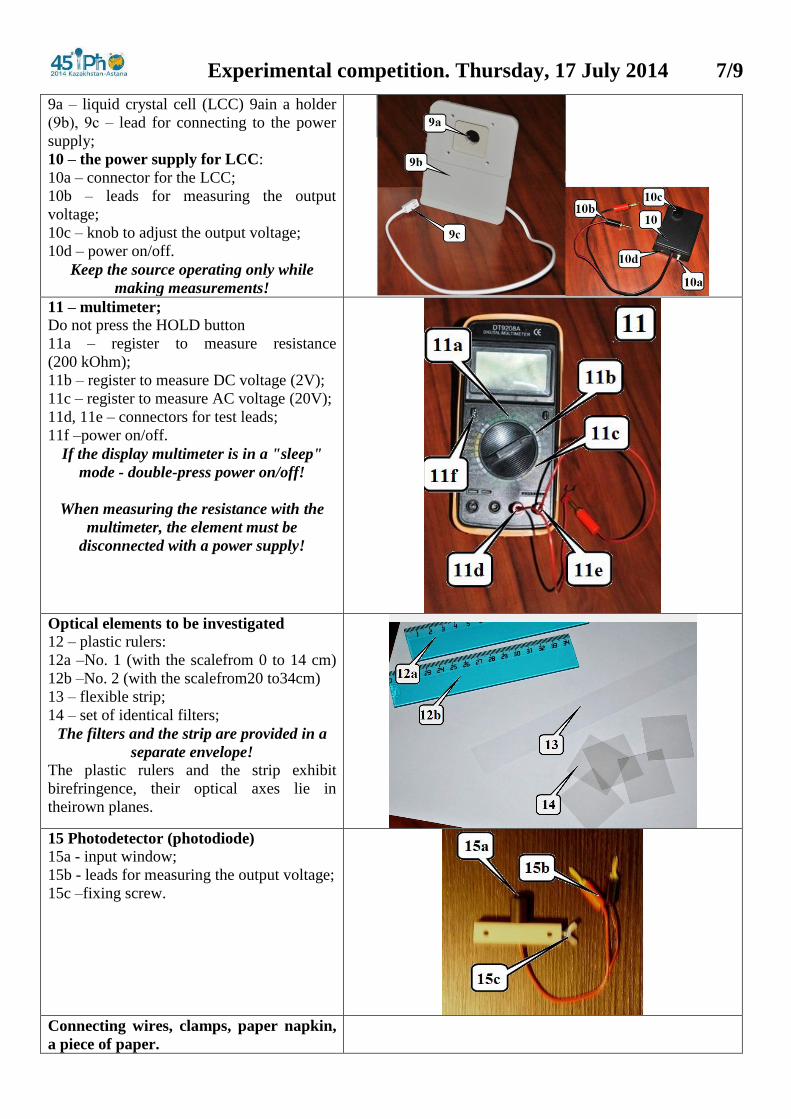
9a – liquid crystal cell (LCC) 9ain a holder
(9b), 9с – lead for connecting to the power
supply;
10 – the power supply for LCC:
10a – connector for the LCC;
10b – leads for measuring the output
voltage;
10c – knob to adjust the output voltage;
10d – power on/off.
Keep the source operating only while
making measurements! 11 – multimeter;
Do not press the HOLD button
11a – register to measure resistance
(200 kOhm);
11b – register to measure DC voltage (2V);
11c – register to measure AC voltage (20V);
11d, 11e – connectors for test leads;
11f –power on/off.
If the display multimeter is in a "sleep"
mode - double-press power on/off!
When measuring the resistance with the
multimeter, the element must be
disconnected with a power supply!
Optical elements to be investigated
12 – plastic rulers:
12a –No. 1 (with the scalefrom 0 to 14 cm)
12b –No. 2 (with the scalefrom20 to34cm)
13 – flexible strip;
14 – set of identical filters;
The filters and the strip are provided in a
separate envelope!
The plastic rulers and the strip exhibit
birefringence, their optical axes lie in
theirown planes.
15 Photodetector (photodiode)
15a - input window;
15b - leads for measuring the output voltage;
15c –fixing screw.
Connecting wires, clamps, paper napkin,
a piece of paper.
Experimental competition. Thursday, 17 July 2014 8/9
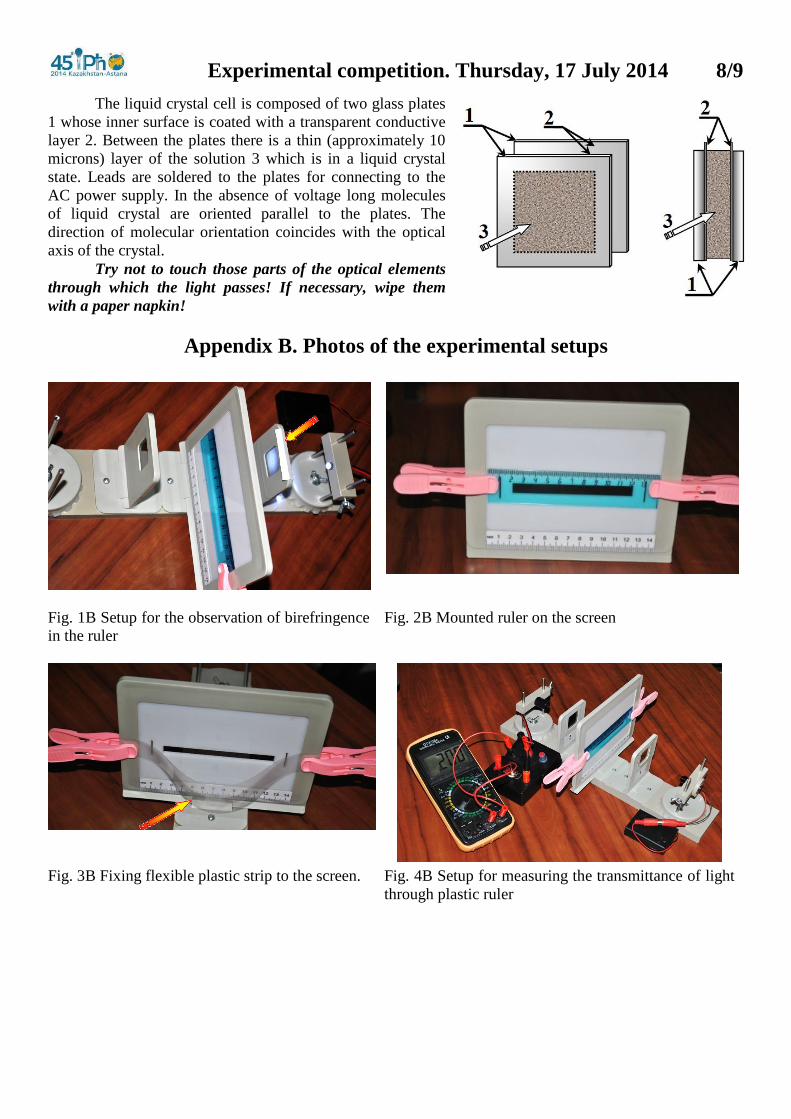
The liquid crystal cell is composed of two glass plates
1 whose inner surface is coated with a transparent conductive
layer 2. Between the plates there is a thin (approximately 10
microns) layer of the solution 3 which is in a liquid crystal
state. Leads are soldered to the plates for connecting to the
AC power supply. In the absence of voltage long molecules
of liquid crystal are oriented parallel to the plates. The
direction of molecular orientation coincides with the optical
axis of the crystal.
Try not to touch those parts of the optical elements
through which the light passes! If necessary, wipe them
with a paper napkin!
Appendix B. Photos of the experimental setups
Fig. 1B Setup for the observation of birefringence
in the ruler
Fig. 2B Mounted ruler on the screen
Fig. 3B Fixing flexible plastic strip to the screen. Fig. 4B Setup for measuring the transmittance of light
through plastic ruler
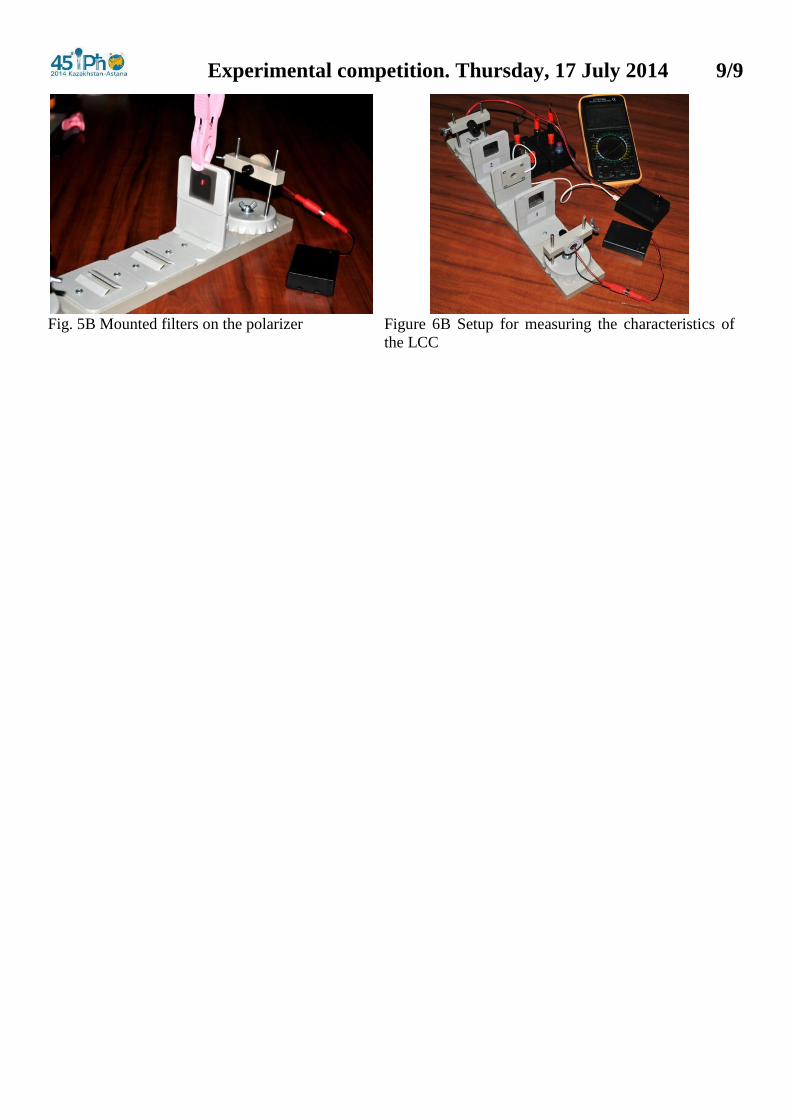
Experimental competition. Thursday, 17 July 2014 9/9
Fig. 5B Mounted filters on the polarizer Figure 6B Setup for measuring the characteristics of
the LCC
Experimental competition. Thursday, 17 July 2014 1/13
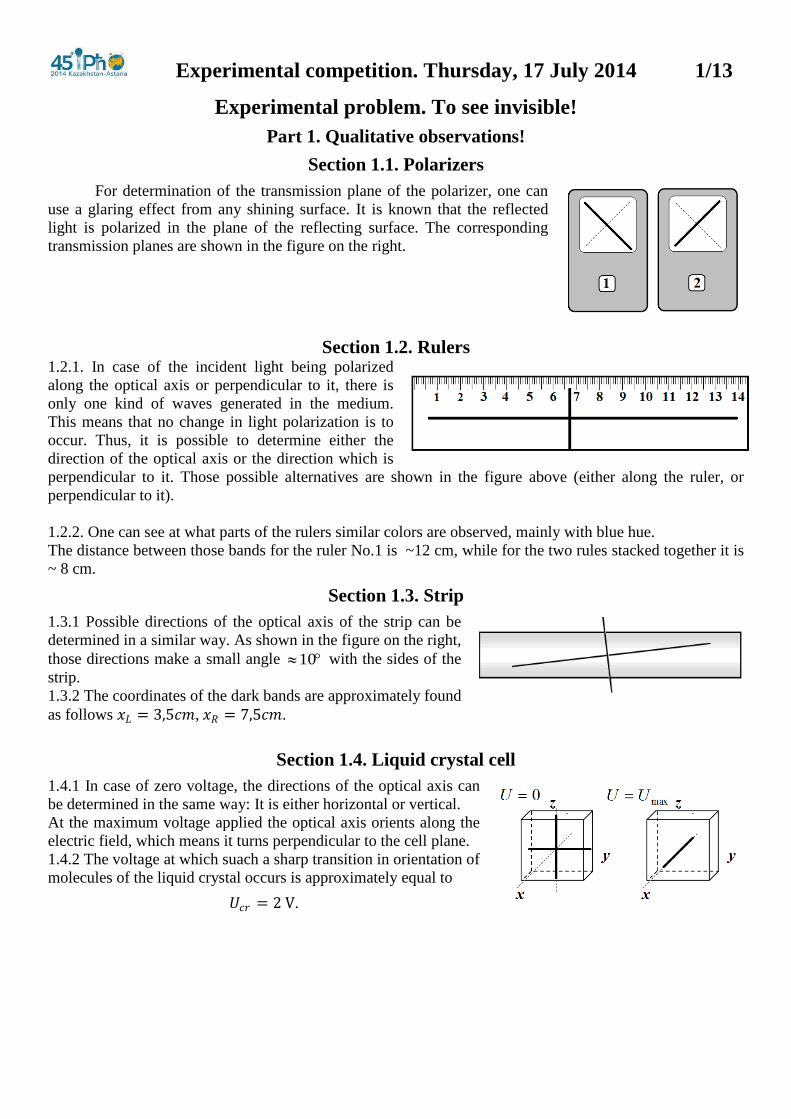
Experimental problem. To see invisible!
Part 1. Qualitative observations!
Section 1.1. Polarizers
For determination of the transmission plane of the polarizer, one can
use a glaring effect from any shining surface. It is known that the reflected
light is polarized in the plane of the reflecting surface. The corresponding
transmission planes are shown in the figure on the right.
Section 1.2. Rulers 1.2.1. In case of the incident light being polarized
along the optical axis or perpendicular to it, there is
only one kind of waves generated in the medium.
This means that no change in light polarization is to
occur. Thus, it is possible to determine either the
direction of the optical axis or the direction which is
perpendicular to it. Those possible alternatives are shown in the figure above (either along the ruler, or
perpendicular to it).
1.2.2. One can see at what parts of the rulers similar colors are observed, mainly with blue hue.
The distance between those bands for the ruler No.1 is ~12 cm, while for the two rules stacked together it is
~ 8 cm.
Section 1.3. Strip
1.3.1 Possible directions of the optical axis of the strip can be
determined in a similar way. As shown in the figure on the right,
those directions make a small angle 10 with the sides of the
strip.
1.3.2 The coordinates of the dark bands are approximately found
as follows 𝑥𝐿 = 3,5𝑐𝑚, 𝑥𝑅 = 7,5𝑐𝑚.
Section 1.4. Liquid crystal cell
1.4.1 In case of zero voltage, the directions of the optical axis can
be determined in the same way: It is either horizontal or vertical.
At the maximum voltage applied the optical axis orients along the
electric field, which means it turns perpendicular to the cell plane.
1.4.2 The voltage at which suach a sharp transition in orientation of
molecules of the liquid crystal occurs is approximately equal to
𝑈𝑐𝑟 = 2 V.
Experimental competition. Thursday, 17 July 2014 2/13
Part 2. Measure!
Section 2.1. Investigating a photodiode
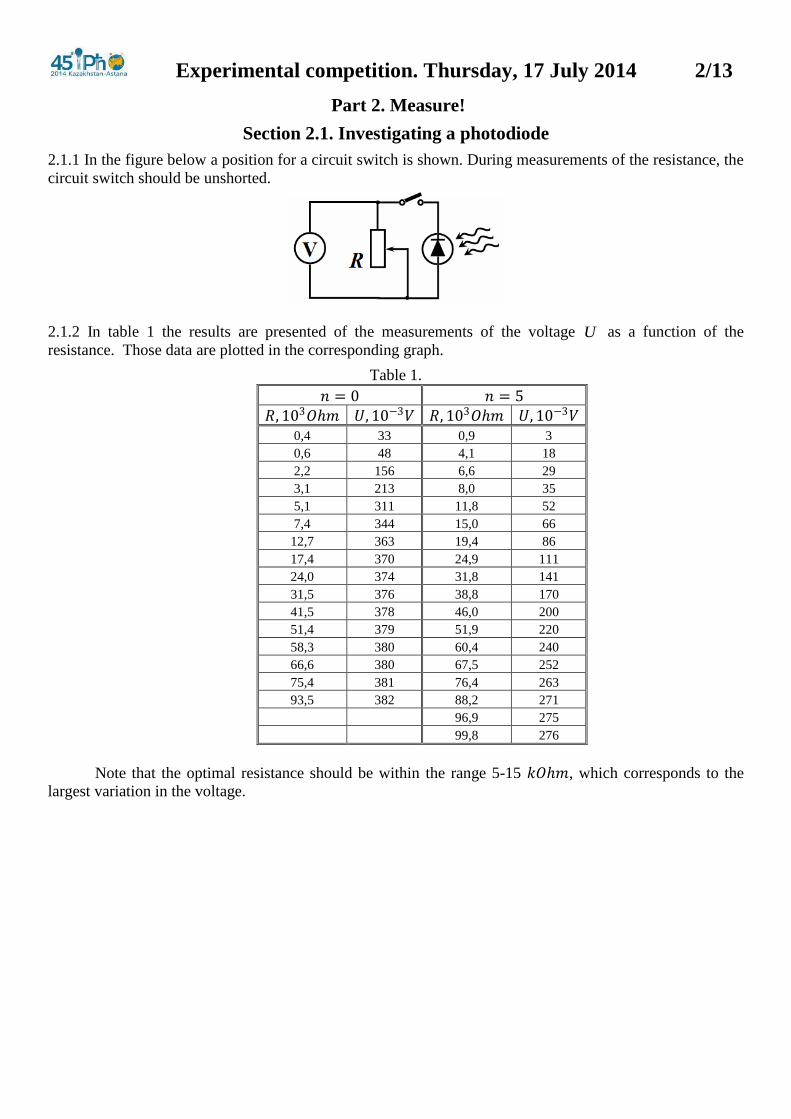
2.1.1 In the figure below a position for a circuit switch is shown. During measurements of the resistance, the
circuit switch should be unshorted.
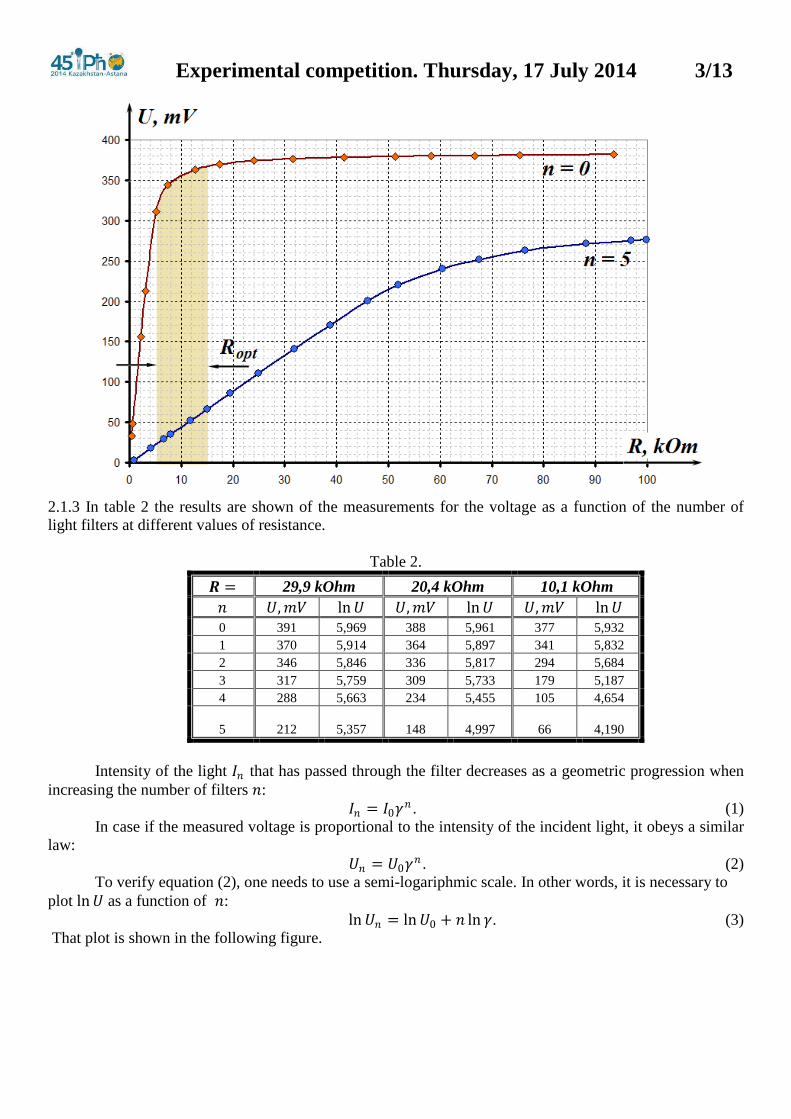
2.1.2 In table 1 the results are presented of the measurements of the voltage U as a function of the
resistance. Those data are plotted in the corresponding graph.
Table 1.
𝑛 = 0 𝑛 = 5
𝑅, 103𝑂ℎ𝑚 𝑈, 10−3𝑉 𝑅, 103𝑂ℎ𝑚 𝑈, 10−3𝑉 0,4 33 0,9 3
0,6 48 4,1 18
2,2 156 6,6 29
3,1 213 8,0 35
5,1 311 11,8 52
7,4 344 15,0 66
12,7 363 19,4 86
17,4 370 24,9 111
24,0 374 31,8 141
31,5 376 38,8 170
41,5 378 46,0 200
51,4 379 51,9 220
58,3 380 60,4 240
66,6 380 67,5 252
75,4 381 76,4 263
93,5 382 88,2 271
96,9 275
99,8 276
Note that the optimal resistance should be within the range 5-15 𝑘𝑂ℎ𝑚, which corresponds to the
largest variation in the voltage.
Experimental competition. Thursday, 17 July 2014 3/13
2.1.3 In table 2 the results are shown of the measurements for the voltage as a function of the number of
light filters at different values of resistance.
Table 2.
𝑹 = 29,9 kOhm 20,4 kOhm 10,1 kOhm
𝑛 𝑈, 𝑚𝑉 ln 𝑈 𝑈, 𝑚𝑉 ln 𝑈 𝑈, 𝑚𝑉 ln 𝑈
0 391 5,969 388 5,961 377 5,932
1 370 5,914 364 5,897 341 5,832
2 346 5,846 336 5,817 294 5,684
3 317 5,759 309 5,733 179 5,187
4 288 5,663 234 5,455 105 4,654
5 212
5,357 148 4,997 66 4,190
Intensity of the light 𝐼𝑛 that has passed through the filter decreases as a geometric progression when
increasing the number of filters 𝑛:
𝐼𝑛 = 𝐼0𝛾𝑛 . (1)
In case if the measured voltage is proportional to the intensity of the incident light, it obeys a similar
law:
𝑈𝑛 = 𝑈0𝛾𝑛 . (2)
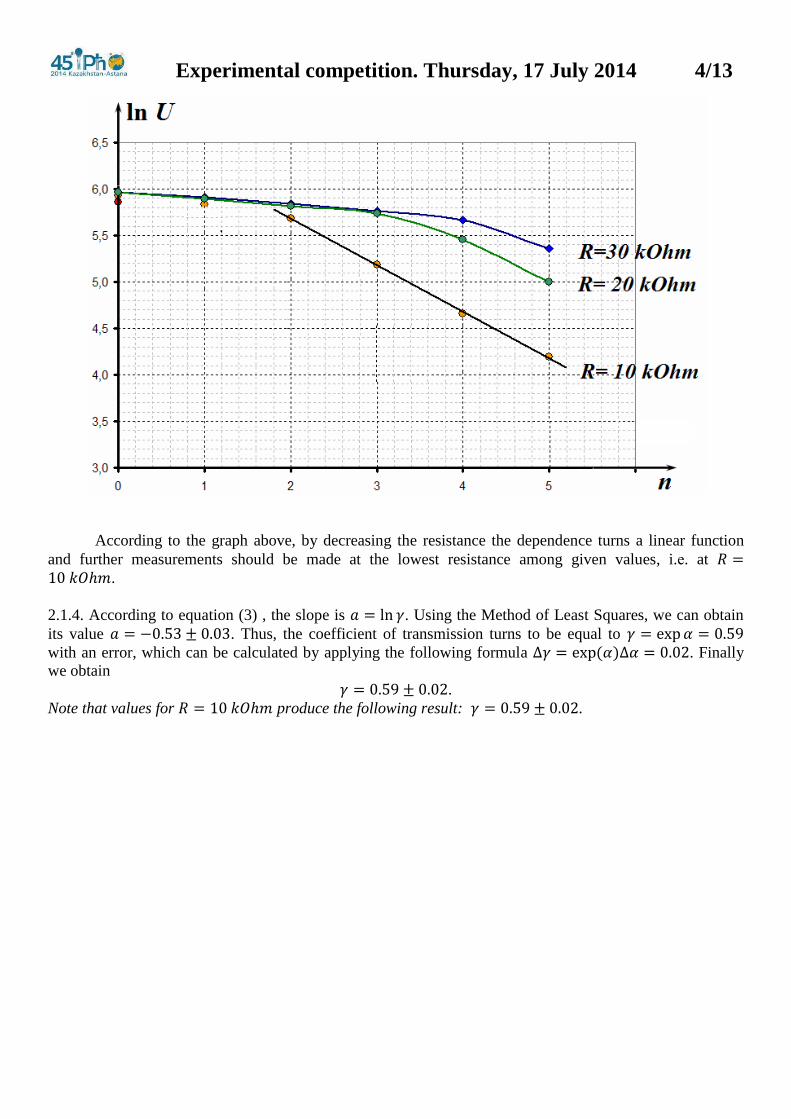
To verify equation (2), one needs to use a semi-logariphmic scale. In other words, it is necessary to
plot ln 𝑈 as a function of 𝑛:
ln 𝑈𝑛 = ln 𝑈0 + 𝑛 ln 𝛾. (3)
That plot is shown in the following figure.
Experimental competition. Thursday, 17 July 2014 4/13
According to the graph above, by decreasing the resistance the dependence turns a linear function
and further measurements should be made at the lowest resistance among given values, i.е. at 𝑅 =10 𝑘𝑂ℎ𝑚.
2.1.4. According to equation (3) , the slope is 𝑎 = ln 𝛾. Using the Method of Least Squares, we can obtain
its value 𝑎 = −0.53 ± 0.03. Thus, the coefficient of transmission turns to be equal to 𝛾 = exp𝛼 = 0.59
with an error, which can be calculated by applying the following formula ∆𝛾 = exp(𝛼)∆𝛼 = 0.02. Finally
we obtain
𝛾 = 0.59 ± 0.02.
Note that values for 𝑅 = 10 𝑘𝑂ℎ𝑚 produce the following result: 𝛾 = 0.59 ± 0.02.

Experimental competition. Thursday, 17 July 2014 5/13
Часть 2.2 Light transition through a plastic ruler
2.2.1 Results of measurements of the light intensity as a function of coordinates of transmission points
through ruler #1, #2 and both rulers, are shown in table 3 and in the graph below.
Table 3.
№1 №2 Both rulers
X,mm U,mV X,mm U,mV X,mm U,mV Ucalc
5 23 0,778 5 14 0,601 5 1 0,0
10 6 0,390 10 22 0,760 10 2 2,1
15 0 0,000 15 30 0,896 15 8 7,7
20 3 0,275 20 43 1,090 20 18 15,7
25 12 0,555 25 55 1,253 25 31 24,7
30 30 0,896 30 67 1,408 30 39 33,0
35 50 1,186 35 78 1,546 35 41 39,2
40 71 1,458 40 90 1,696 40 42 41,9
45 93 1,734 45 99 1,811 45 41 40,8
50 113 1,996 50 107 1,915 50 36 36,0
55 128 2,214 55 116 2,038 55 27 28,5
60 150 2,636 60 123 2,138 60 21 19,6
65 156 2,824 65 129 2,230 65 12 10,9
70 153 2,720 70 133 2,295 70 7 4,1
75 160 3,142 75 130 2,246 75 2 0,4
80 146 2,541 80 134 2,312 80 1 0,5
85 146 2,541 85 143 2,478 85 1 4,4
90 140 2,419 90 144 2,498 90 3 11,4
95 131 2,262 95 146 2,541 95 6 20,1
100 113 1,996 100 145 2,519 100 11 29,0
Experimental competition. Thursday, 17 July 2014 6/13
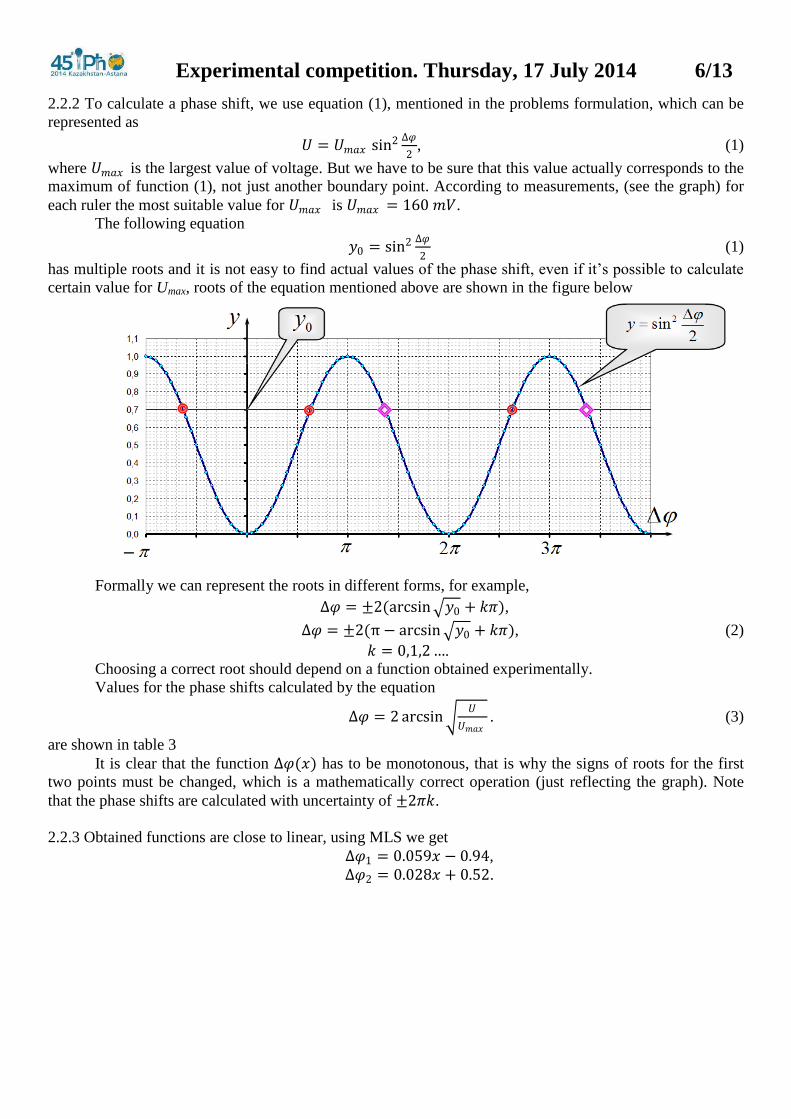
2.2.2 To calculate a phase shift, we use equation (1), mentioned in the problems formulation, which can be
represented as
𝑈 = 𝑈𝑚𝑎𝑥 sin2 ∆𝜑
2, (1)
where 𝑈𝑚𝑎𝑥 is the largest value of voltage. But we have to be sure that this value actually corresponds to the
maximum of function (1), not just another boundary point. According to measurements, (see the graph) for
each ruler the most suitable value for 𝑈𝑚𝑎𝑥 is 𝑈𝑚𝑎𝑥 = 160 𝑚𝑉.
The following equation
𝑦0 = sin2 ∆𝜑
2 (1)
has multiple roots and it is not easy to find actual values of the phase shift, even if it’s possible to calculate
certain value for Umax, roots of the equation mentioned above are shown in the figure below
Formally we can represent the roots in different forms, for example,
∆𝜑 = ±2(arcsin 𝑦0 + 𝑘𝜋),
∆𝜑 = ±2(π − arcsin 𝑦0 + 𝑘𝜋), (2)
𝑘 = 0,1,2….
Choosing a correct root should depend on a function obtained experimentally.
Values for the phase shifts calculated by the equation
∆𝜑 = 2 arcsin 𝑈
𝑈𝑚𝑎𝑥 . (3)
are shown in table 3
It is clear that the function ∆𝜑(𝑥) has to be monotonous, that is why the signs of roots for the first
two points must be changed, which is a mathematically correct operation (just reflecting the graph). Note
that the phase shifts are calculated with uncertainty of ±2𝜋𝑘.
2.2.3 Obtained functions are close to linear, using MLS we get
∆𝜑1 = 0.059𝑥 − 0.94,
∆𝜑2 = 0.028𝑥 + 0.52.

Experimental competition. Thursday, 17 July 2014 7/13
Graphs of those functions are shown below.
2.2.4 If two rulers are stacked together, then phase shifts simply add, and, theoretically, the intensity as
function of phase shifts can be written as
𝑈 = 𝑈𝑚𝑎𝑥 sin2 ∆𝜑1+∆𝜑2
2. (5)
Here 𝑈𝑚𝑎𝑥 is the largest value of voltage at the light transition through both rulers and can be obtained from
experimental data.
Results of the calculations are shown in table 3 and in the graph above. Consistency of theoretical
calculations and experimental data can clearly be seen.

Experimental competition. Thursday, 17 July 2014 8/13
Part 2.3 Liquid crystal cell
2.3.2 Light transmission through LCC
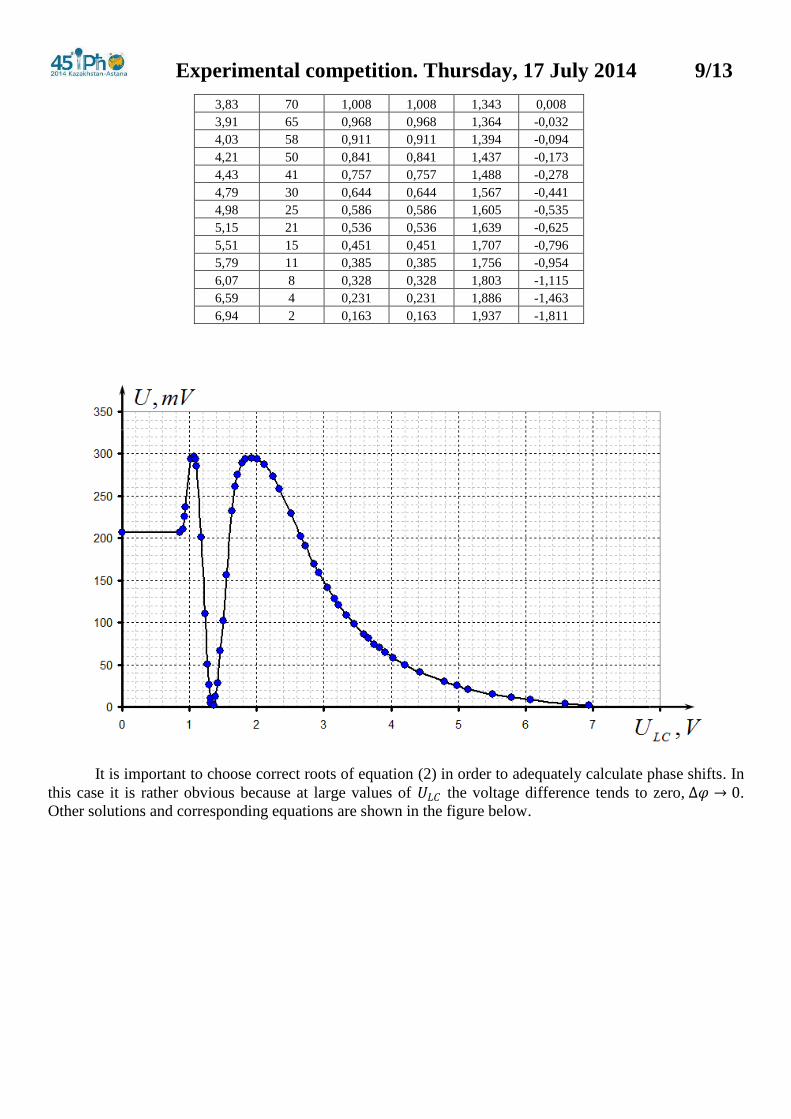
2.3.1 Results of the intensity measurements as a functions of voltage 𝑈𝐿𝐶 are shown in table 51. Graph of the
obtained function is drawn in the figure below.
Table 5.
𝑈𝐿𝐶 , 𝑉 𝑈, 𝑚𝑉 ∆𝜑 ′ ∆𝜑 ln 𝑈𝐿𝐶 ln ∆𝜑 0 207 1,961 10,606 - 2,361
0,86 207 1,961 10,606 -0,151 2,361
0,91 211 1,990 10,577 -0,094 2,359
0,93 226 2,102 10,464 -0,073 2,348
0,94 237 2,190 10,377 -0,062 2,340
1,02 294 2,858 9,709 0,020 2,273
1,07 297 2,941 9,625 0,068 2,264
1,09 294 2,858 9,709 0,086 2,273
1,11 285 2,691 8,974 0,104 2,194
1,18 201 1,918 8,201 0,166 2,104
1,23 110 1,301 7,584 0,207 2,026
1,27 51 0,850 7,133 0,239 1,965
1,29 26 0,598 6,881 0,255 1,929
1,31 10 0,367 6,650 0,270 1,895
1,32 5 0,259 6,542 0,278 1,878
1,36 2 0,163 6,447 0,307 1,864
1,39 12 0,403 5,880 0,329 1,772
1,42 28 0,621 5,662 0,351 1,734
1,46 66 0,976 5,307 0,378 1,669
1,5 102 1,245 5,038 0,405 1,617
1,55 156 1,611 4,672 0,438 1,542
1,63 232 2,149 4,134 0,489 1,419
1,68 261 2,404 3,879 0,519 1,356
1,71 275 2,556 3,727 0,536 1,316
1,78 289 2,756 3,527 0,577 1,260
1,83 294 2,858 3,425 0,604 1,231
1,93 295 2,883 3,401 0,658 1,224
2,01 294 2,858 2,858 0,698 1,050
2,11 287 2,722 2,722 0,747 1,001
2,24 273 2,532 2,532 0,806 0,929
2,34 258 2,375 2,375 0,850 0,865
2,51 229 2,125 2,125 0,920 0,754
2,65 202 1,925 1,925 0,975 0,655
2,72 191 1,848 1,848 1,001 0,614
2,85 169 1,698 1,698 1,047 0,529
2,92 159 1,631 1,631 1,072 0,489
3,05 141 1,511 1,511 1,115 0,413
3,16 128 1,424 1,424 1,151 0,353
3,22 121 1,376 1,376 1,169 0,319
3,34 109 1,294 1,294 1,206 0,258
3,45 98 1,217 1,217 1,238 0,196
3,59 86 1,130 1,130 1,278 0,122
3,66 81 1,093 1,093 1,297 0,089
3,75 74 1,039 1,039 1,322 0,039
1 We do not expect that participants can take the same number of measurements, 15-20 points are enough. It is principally
important to find the dip in the graph.
Experimental competition. Thursday, 17 July 2014 9/13
3,83 70 1,008 1,008 1,343 0,008
3,91 65 0,968 0,968 1,364 -0,032
4,03 58 0,911 0,911 1,394 -0,094
4,21 50 0,841 0,841 1,437 -0,173
4,43 41 0,757 0,757 1,488 -0,278
4,79 30 0,644 0,644 1,567 -0,441
4,98 25 0,586 0,586 1,605 -0,535
5,15 21 0,536 0,536 1,639 -0,625
5,51 15 0,451 0,451 1,707 -0,796
5,79 11 0,385 0,385 1,756 -0,954
6,07 8 0,328 0,328 1,803 -1,115
6,59 4 0,231 0,231 1,886 -1,463
6,94 2 0,163 0,163 1,937 -1,811
It is important to choose correct roots of equation (2) in order to adequately calculate phase shifts. In
this case it is rather obvious because at large values of 𝑈𝐿𝐶 the voltage difference tends to zero, ∆𝜑 → 0.
Other solutions and corresponding equations are shown in the figure below.

Experimental competition. Thursday, 17 July 2014 10/13
Results of calculation of ∆𝜑 ′ = arcsin 𝑈
𝑈𝑚𝑎𝑥 and correct values of phase shift ∆𝜑 are shown in the figure
below.
This figure is drawn for the sake of
understanding. (It’s not required to draw it
for participants).
2.3.2 The value of the phase shift at zero
voltage is ∆𝜑0 ≈ 10.6.
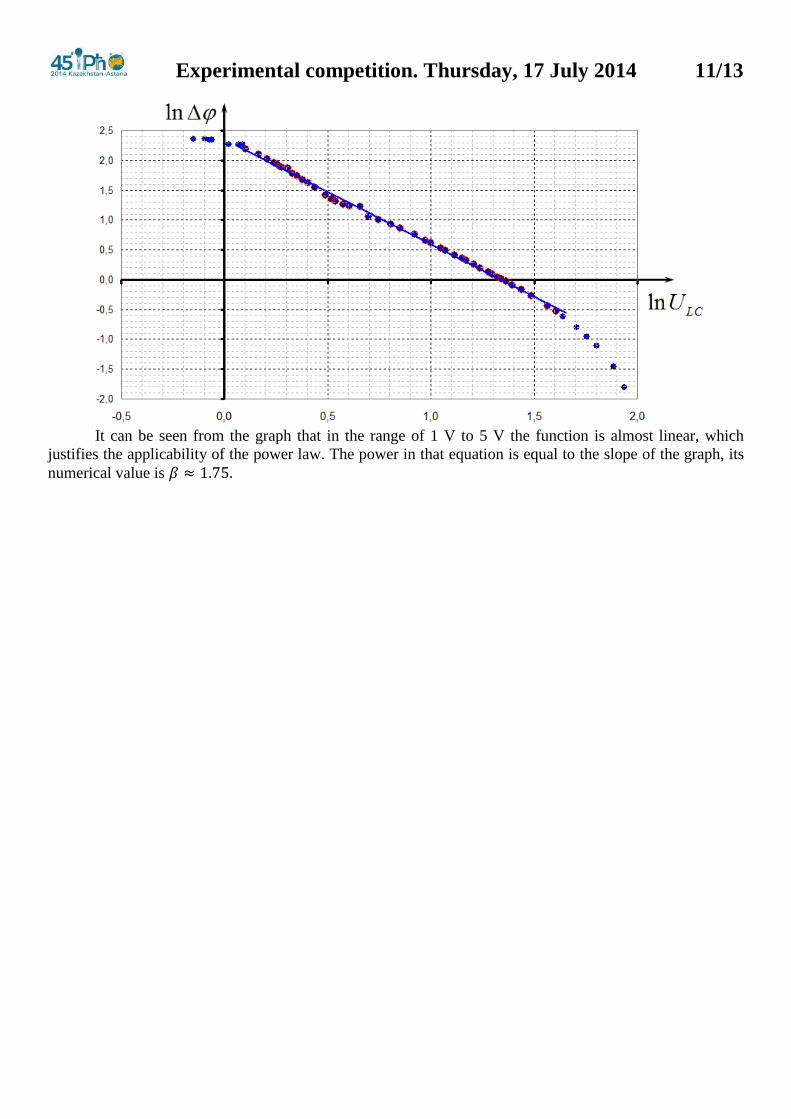
2.3.3 In order to check applicability of the
power function ∆𝜑 = 𝐶𝑈𝛽 it is
recommended to redraw the last graph logarithmically, as shown in the figure below.
Experimental competition. Thursday, 17 July 2014 11/13
It can be seen from the graph that in the range of 1 V to 5 V the function is almost linear, which
justifies the applicability of the power law. The power in that equation is equal to the slope of the graph, its
numerical value is 𝛽 ≈ 1.75.
Experimental competition. Thursday, 17 July 2014 12/13
Section 2.4 Light transmission through a curved strip
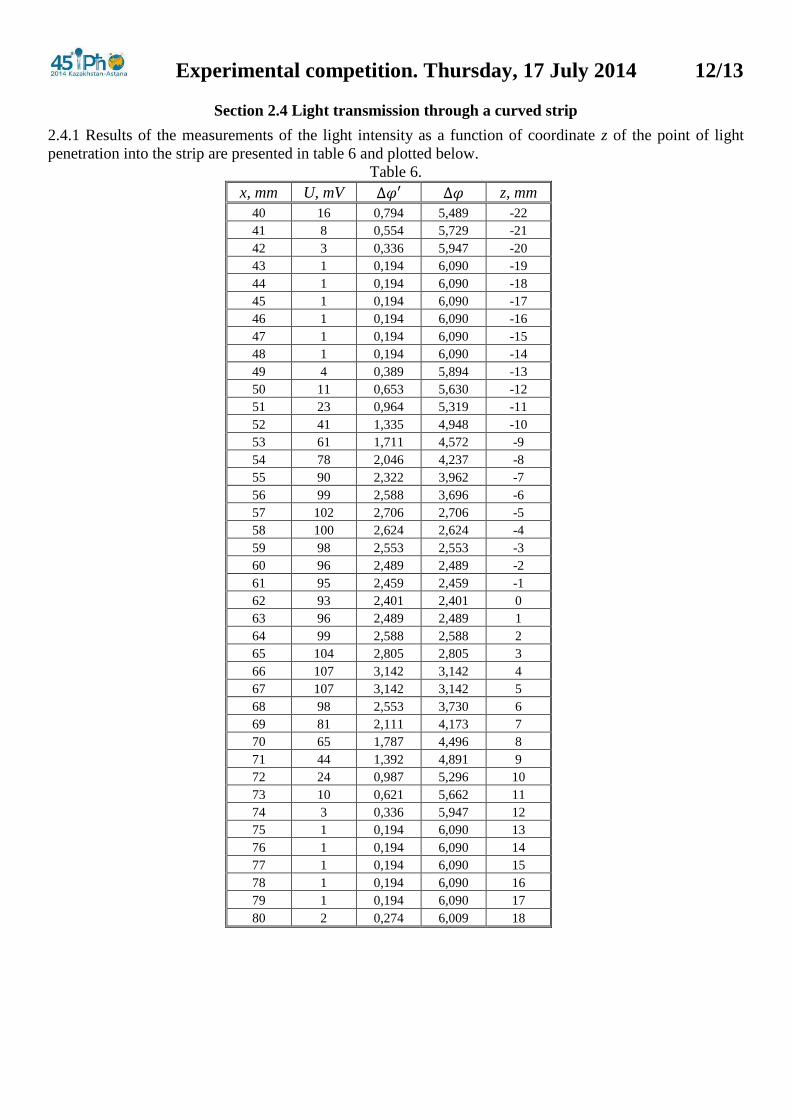
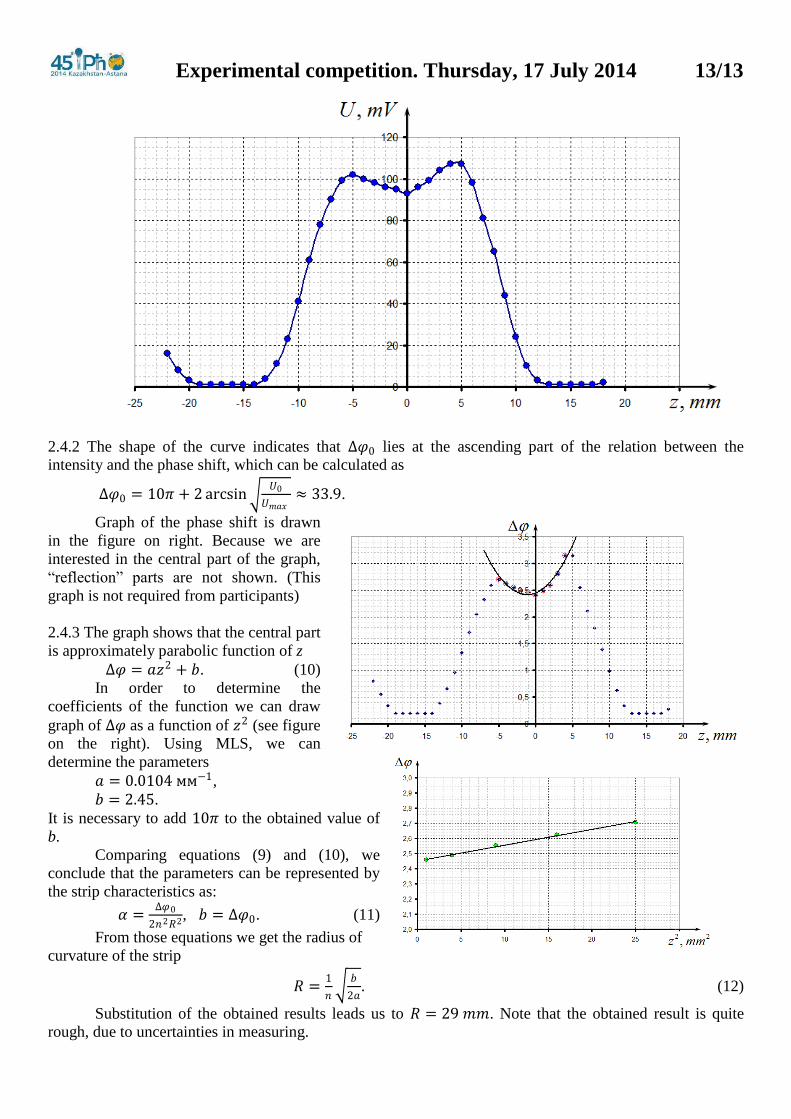
2.4.1 Results of the measurements of the light intensity as a function of coordinate z of the point of light
penetration into the strip are presented in table 6 and plotted below.
Table 6.
x, mm U, mV ∆𝜑′ ∆𝜑 z, mm
40 16 0,794 5,489 -22
41 8 0,554 5,729 -21
42 3 0,336 5,947 -20
43 1 0,194 6,090 -19
44 1 0,194 6,090 -18
45 1 0,194 6,090 -17
46 1 0,194 6,090 -16
47 1 0,194 6,090 -15
48 1 0,194 6,090 -14
49 4 0,389 5,894 -13
50 11 0,653 5,630 -12
51 23 0,964 5,319 -11
52 41 1,335 4,948 -10
53 61 1,711 4,572 -9
54 78 2,046 4,237 -8
55 90 2,322 3,962 -7
56 99 2,588 3,696 -6
57 102 2,706 2,706 -5
58 100 2,624 2,624 -4
59 98 2,553 2,553 -3
60 96 2,489 2,489 -2
61 95 2,459 2,459 -1
62 93 2,401 2,401 0
63 96 2,489 2,489 1
64 99 2,588 2,588 2
65 104 2,805 2,805 3
66 107 3,142 3,142 4
67 107 3,142 3,142 5
68 98 2,553 3,730 6
69 81 2,111 4,173 7
70 65 1,787 4,496 8
71 44 1,392 4,891 9
72 24 0,987 5,296 10
73 10 0,621 5,662 11
74 3 0,336 5,947 12
75 1 0,194 6,090 13
76 1 0,194 6,090 14
77 1 0,194 6,090 15
78 1 0,194 6,090 16
79 1 0,194 6,090 17
80 2 0,274 6,009 18
Experimental competition. Thursday, 17 July 2014 13/13
2.4.2 The shape of the curve indicates that ∆𝜑0 lies at the ascending part of the relation between the
intensity and the phase shift, which can be calculated as
∆𝜑0 = 10𝜋 + 2 arcsin 𝑈0
𝑈𝑚𝑎𝑥≈ 33.9.
Graph of the phase shift is drawn
in the figure on right. Because we are
interested in the central part of the graph,
“reflection” parts are not shown. (This
graph is not required from participants)
2.4.3 The graph shows that the central part
is approximately parabolic function of z
∆𝜑 = 𝑎𝑧2 + 𝑏. (10)
In order to determine the
coefficients of the function we can draw
graph of ∆𝜑 as a function of 𝑧2 (see figure
on the right). Using MLS, we can
determine the parameters
𝑎 = 0.0104 мм−1,
𝑏 = 2.45.
It is necessary to add 10𝜋 to the obtained value of
b.
Comparing equations (9) and (10), we
conclude that the parameters can be represented by
the strip characteristics as:
𝛼 =∆𝜑0
2𝑛2𝑅2, 𝑏 = ∆𝜑0. (11)
From those equations we get the radius of
curvature of the strip
𝑅 =1
𝑛
𝑏
2𝑎. (12)
Substitution of the obtained results leads us to 𝑅 = 29 𝑚𝑚. Note that the obtained result is quite
rough, due to uncertainties in measuring.