iraq operationalizing equity mics analysis & dissemination workshop, belgrade nov 2011...
TRANSCRIPT
IRAQOperationalizing Equity
MICS Analysis & Dissemination Workshop, Belgrade Nov 2011
Multidimensional Deprivation Analysis

IRAQMapping Child Well-being
Life-Cycle Multidimensional AnalysisUNICEF Iraq Country Office - December 2011
Erbil
Al Anbar
Al Basrah
Al S ulaymaniyah
Al Qadissiya
Al Muthanna
Babil
Baghdad
Dahuk
Najaf
Diyala
Thi-Qar
S alah Ad Din
Kerbala
Kirkuk
Missan
Ninewa
Wassit
4
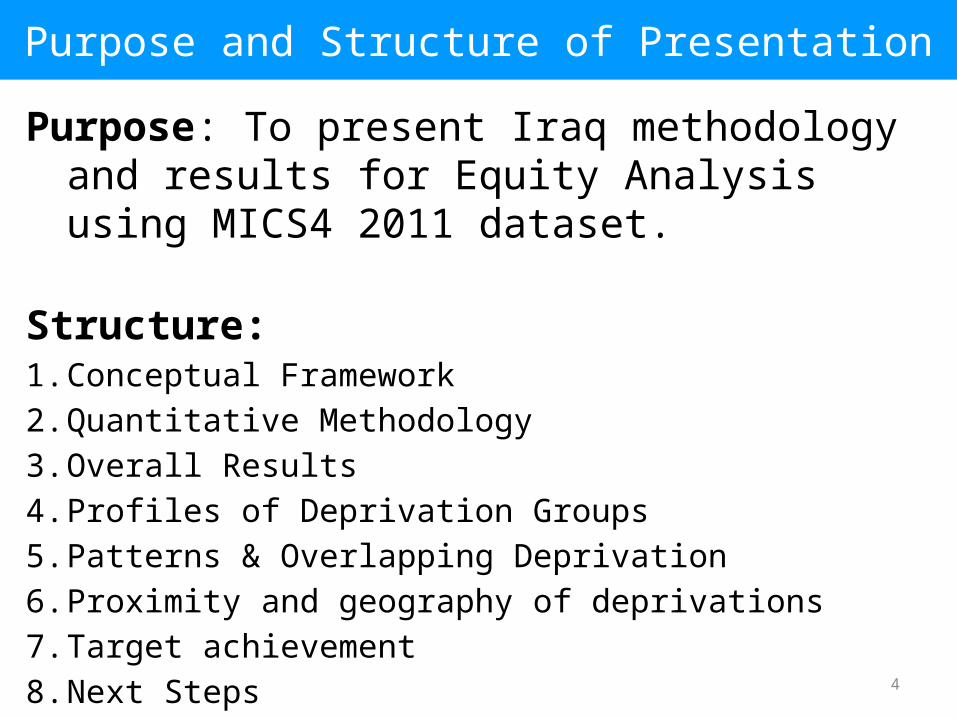
Purpose and Structure of PresentationPurpose: To present Iraq methodology and
results for Equity Analysis using MICS4 2011 dataset.
Structure:1. Conceptual Framework2. Quantitative Methodology3. Overall Results4. Profiles of Deprivation Groups5. Patterns & Overlapping Deprivation6. Proximity and geography of deprivations7. Target achievement8. Next Steps

Conceptual Framework

6
Objectives of the Methodology1) Build quantitative analysis on a clear conceptual framework
founded on CRC, MDG, WFFC and Iraq’s context
2) Operationalise UNICEF´s global equity focus
3) Accurately identify the most deprived children (and their deprivation patterns) without ignoring less deprived ones
4) Obtain results easily understandable and communicable to stakeholders
5) Provides an equity-focused quantitative assessment for Iraq’s Situation Analysis (SitAn)

7
UNICEF Equity Focus• Human Development Report (HDR) 2010: The past 20 years have seen
substantial progress in many aspects of human development and achievement of MDG targets.
• However, these years have also seen extreme inequality in progress -both within and across countries- and this is identified as a powerful brake on accelerated progress towards the MDGs.
• Definition of Child Equity: equal opportunities for all children to survive, develop and reach their full potential without discrimination, bias or favouritism.
• Why Equity?1. Right in Principle: moral imperative to respond to most disadvantaged and in-need
children2. Right in Logic: accelerates development towards attainment of national
development targets3. Right in Practice: Brings higher returns to investments in improving children’s lives
8
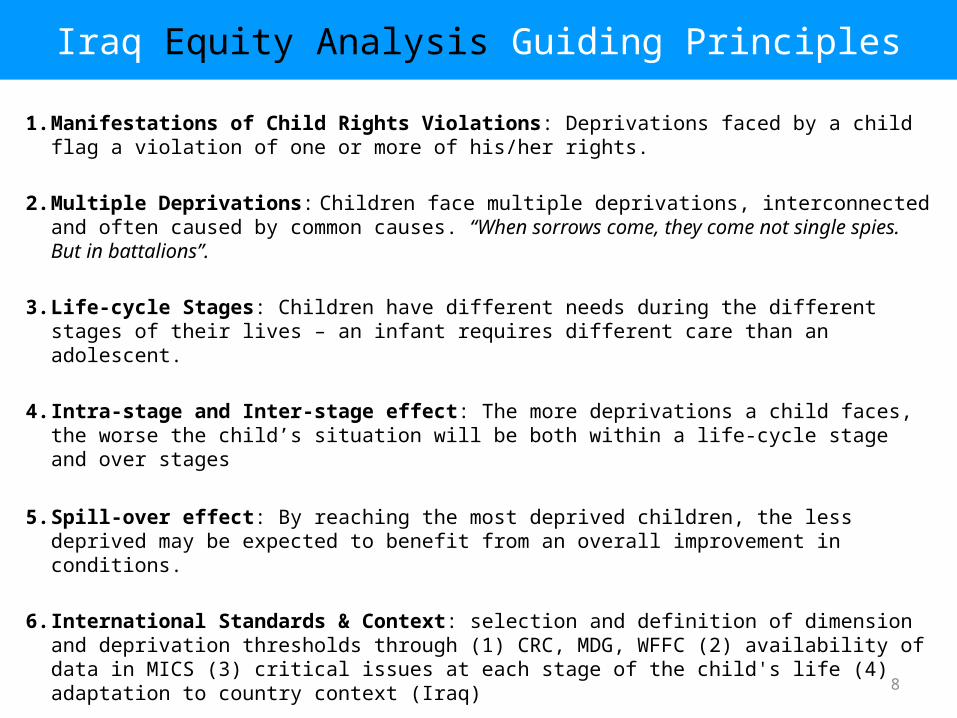
Iraq Equity Analysis Guiding Principles1. Manifestations of Child Rights Violations: Deprivations faced by a child flag a
violation of one or more of his/her rights.
2. Multiple Deprivations: Children face multiple deprivations, interconnected and often caused by common causes. “When sorrows come, they come not single spies. But in battalions”.
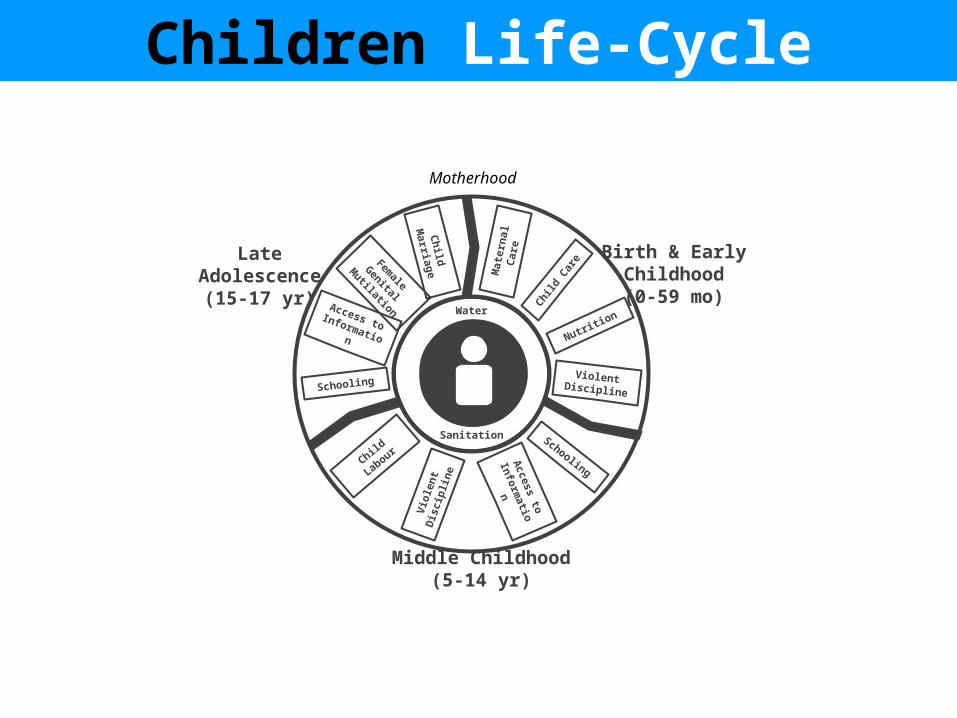
3. Life-cycle Stages: Children have different needs during the different stages of their lives – an infant requires different care than an adolescent.
4. Intra-stage and Inter-stage effect: The more deprivations a child faces, the worse the child’s situation will be both within a life-cycle stage and over stages
5. Spill-over effect: By reaching the most deprived children, the less deprived may be expected to benefit from an overall improvement in conditions.
6. International Standards & Context: selection and definition of dimension and deprivation thresholds through (1) CRC, MDG, WFFC (2) availability of data in MICS (3) critical issues at each stage of the child's life (4) adaptation to country context (Iraq)

Issue vs Child Centred Approaches
Out of School
Child Labour
Ahmed
Manal Sahar
Manal Amina
Manal Ahmed AminaSahar
Issu
e Ce
ntre
d 30% Deprived
20% Deprived
Child
Cen
tred
All ok (60%)
1 Deprivation 30%)
2 Deprivations (10%)
Out of School
Child Labour
9
10
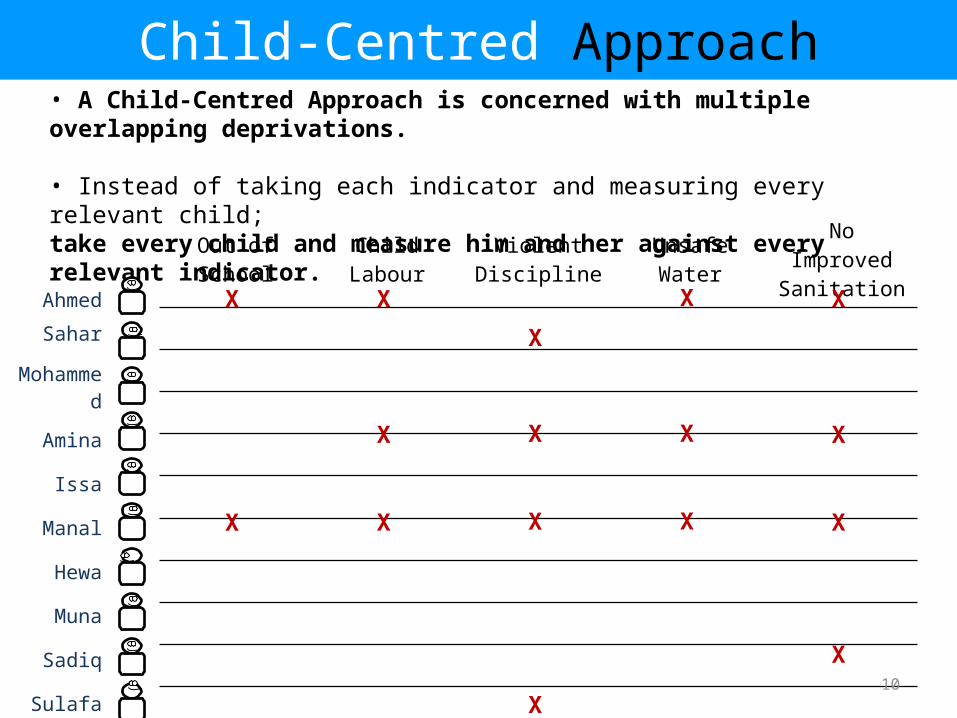
Out of School Child Labour Violent Discipline Unsafe Water No Improved
Sanitation
Child-Centred Approach• A Child-Centred Approach is concerned with multiple overlapping deprivations.
• Instead of taking each indicator and measuring every relevant child;take every child and measure him and her against every relevant indicator.
Ahmed
Sahar
Mohammed
Amina
Issa
Manal
Hewa
Muna
Sadiq
Sulafa
X X XX
X
XX XX
XX XXX
X
X

Child-Centred Approach: Equal Rights
No child has any deprivation!
• What does a child-centred approach mean for Equity?
11

Child-Centred Approach: 1 IndicatorOut of School:
All ok (80% of Population)
1 Deprivation (20%)
• 2 children out of the 10 are out of school.
12

Child-Centred Approach: 2 IndicatorsOut of School:
Child Labour:
All ok (60% of Population)
1 Deprivation (30%)
2 Deprivations (10%)
• 3 children out of the 10 are involved in child labour.
13

Child-Centred Approach: 3 IndicatorsOut of School:
Child Labour:
Violent Discipline:
All ok (50% of Population)
1 Deprivation (20%)
2 Deprivations (20%)
3 Deprivations(10%)
• 4 children out of the 10 suffer violent discipline.
14

Child-Centred Approach: 4 IndicatorsOut of School:
Child Labour:
Violent Discipline:
Unsafe Water
All ok (50% of Population)
1 Deprivation (20%)
3 Deprivations(20%)
4 Deprivations (10%)
• 3 children out of the 10 have unsafe water.
15

Child-Centred Approach: 5 IndicatorsOut of School:
Child Labour:
Violent Discipline:
Unsafe Water
No Improved Sanitation
All ok (40% of Population)
1 Deprivation (30%)
4 Deprivations (20%)
5 Deprivations (10%)
• 4 children out of the 10 don’t have improved sanitation.
16

Child-Centred Measure of Inequity
Best off 40% of all childrenHave no deprivations
Middle 30% of all childrenHave only 1 deprivation
Worst 30% of all childrenHave 4 or more deprivations
17
All ok (40% of Population)
1 Deprivation (30%)
4 Deprivations (20%)
5 Deprivations (10%)

Quantitative Methodology
Water
Sanitation
Mat
erna
l Car
e
Child
Care
Nutrition
Violent Discipline
Access to
Information
Child La
bour
Schooling
Access to Information
Female Genital
Mutilation
Child Marriage
Birth & EarlyChildhood(0-59 mo)
Middle Childhood (5-14 yr)
Late Adolescence(15-17 yr)
Motherhood
Viol
ent
Disc
iplin
eSchooling
Children Life-Cycle

Birth & EarlyChildhood(0-59 mo)
Middle Childhood(5-14 yr)
Late Adolescence
(15-17 yr)
Motherhood
Shelter
Water & Sanitation
Mat
erna
l Car
e
Child
Care
Nutrition
Violent Discipline
Access to
Information
Child La
bour
Schooling
Access to Information
Female Genital
Mutilation
Child Marriage
Viol
ent
Disc
iplin
e
Schooling
Children Life-Cycle (0-17 years)
UNICEF Iraq Country Office - December 2011

Water
Sanitation
Mat
erna
l Car
e
Child
Care
Nutrition
Violent Discipline
Birth & Early Childhood(0-59 mo)
Dimension Indicators Moderate Severe
Maternal Care
* Antenatal care coverage 4+* Skilled attendant at delivery
Not ANC 4+ or No Skilled attendant at delivery
Not ANC 4+ and No Skilled attendant at delivery
Child Care
* Immunization coverage for DPT (1,2,3) according to age* Oral rehydration therapy with continued feeding (Imp.)* Care-seeking for suspected pneumonia (Imp.)
(no DPT immunization) or (no appropriate treatment of diarrhoea or pneumonia)
(no DPT immunization) and (no appropriate treatment of diarrhoea or pneumonia)
Nutrition* Underweight* Stunting* Wasting
Stunting or Wasting or Underweight (all moderate <2SD)
Stunting or Wasting or Underweight (all severe <3SD)
Violent Discipline
* Psychological discipline* Physical discipline(Imp.)
Child suffered psychological abuse or any physical form as form of discipline
Child suffered severe physical abuse (hit with a stick, burned or bitten)
Birth & Early Childhood (0-59 months)

Water
Sanitation
Access to
Information
Child La
bour
Middle Childhood (5-14yr)
Viol
ent
Disc
iplin
e
Schooling
Dimension Child Labour Violent Discipline Access to Information Schooling
Indicators * Child Labour* Psychological discipline (Imp.)* Physical discipline
* Household assets ownership
* Attendance to early childhood education* Appropriate grade for age* Primary/Intermediate school attendance
Moderate
"Child is involved in labour for:* Age 5–11 years: At least 1 hour of economic work or 28 hours of domestic work per week.* Age 12–14 years: At least 14 hours of economic work or 28 hours of domestic work per week"
Child suffered psychological abuse or any physical form as form of discipline
Child does not have electricity, telephone (landline or mobile) or radio/TV - At least 2 of these.
* Child is 5 years old and not attending an early childhood education programme* child is 6-14 years old and in lower grade for age
Severe*Age 5–11yr: > 7 hours of economic work or> 28 hours of domestic work per week. * Age 12–14yr: >21 hours of economic work or >28 hours of domestic work per week"
Child suffered severe physical abuse (hit with a stick, burned or bitten)
Does not have electricity and telephone and radio/TV - All simultaneously.
* Child is 5 years old and not attending an early childhood education programme nor primary school* Child is 6-14 years old and not attending school at all;
Middle Childhood (5-14 yrs)

Water
Sanitation
Schooling
Access to Information
Female Genital
Mutilation
Child Marriage
Late Adolescence (15-17 yr)
Dimension Indicators Moderate Severe
Child Marriage and Domestic Violence
* Marriage before 18* Wife Beating Justified
Girl is 15-17 years old and currently or ever married
Girl is 15-17 years old and currently or ever married and reports wife beating is justified by any one reason
Female Genital Mutilation (FGM)
* Female genital mutilation/cutting (FGM/C) among women
* 15-17 years old girl reports to have undergone any form of female genital mutilation/cutting
* 15-17 years old girl reports to have undergone any form of FGM/C and thinks practice should be "continued" or "depends”
Access to Information
* Household assets ownership
Child does not have electricity, telephone (landline or mobile) or radio/TV - At least 2 of these unavailable.
Child does not have electricity and telephone (landline or mobile) and radio/TV - All simultaneously.
Schooling* Appropriate grade for age* Secondary school attendance
Child is not in appropriate grade for age
Child is not attending secondary school at all or in Level below (Primary or Intermediate) at least 2 years late
Late Adolescence (15-17 yrs)

Water
Sanitation
Water & Sanitation (0-17 yr)
Dimension Safe Water
Indicators* Use of improved drinking water sources * Treatment of water to make safe for drinking
Moderate Household using unimproved drinking water sources
SevereHousehold using unimproved drinking water and does not use treat water to make safe for drinking
Dimension Improved Sanitation
Indicators * Use of improved type of sanitation facility
Moderate Household using unimproved sanitation facility
Severe Household using No facility, Bush, Field as sanitation facility
Household (0-17 yrs): Water & Sanitation

25
Counting Deprivations (Moderate + Severe)5-14 yrs Education Child Labour Discipline Access to
Information Safe Water Improved Sanitation
Count(Mod +
Sev)
Sev Count
Child1 1 1 1 1 0 0 0 0 1 0 1 0 4 2
Child2 0 0 1 0 0 0 0 0 0 0 0 0 1 0
Child3 0 0 0 0 0 0 0 0 0 0 0 0 0 0
Child4 1 1 1 1 1 0 1 1 1 0 1 0 6 3
Child5 1 0 1 0 0 0 0 0 0 0 1 0 3 0
Child6 0 0 1 0 0 0 0 0 0 0 0 0 1 0
Child7 1 0 1 0 0 0 0 0 1 0 1 1 4 1
Child8 0 0 0 0 0 0 1 0 0 0 0 0 1 0
Child9 0 0 0 0 0 0 0 0 1 0 0 0 1 0
Child10 0 0 0 0 0 0 0 0 0 0 0 0 0 0
TOTAL 4 2 6 2 2 0 2 1 4 0 4 1 Child >2=4
Child >0=3

Overall Results

Actual Results from MICS4 (All Children)
All Children: 16.6 million children
1.7 million (10%)All ok (No deprivations)
4.6 million (28%)Low (1 deprivation)
5.8 million (35%)Med (2 deprivations)
4.5 million (27%)High (3+ deprivations)
= 250,000 children
27

28
Overall Results
Deprivation Level0%
10%
20%
30%
40%
50%
60%
70%
80%
90%
100%
27%
35%
28%
10%
45%
0%
100%
200%
300%
400%
500%
600%
700%
4.5
5.8 4.6
1.7
29
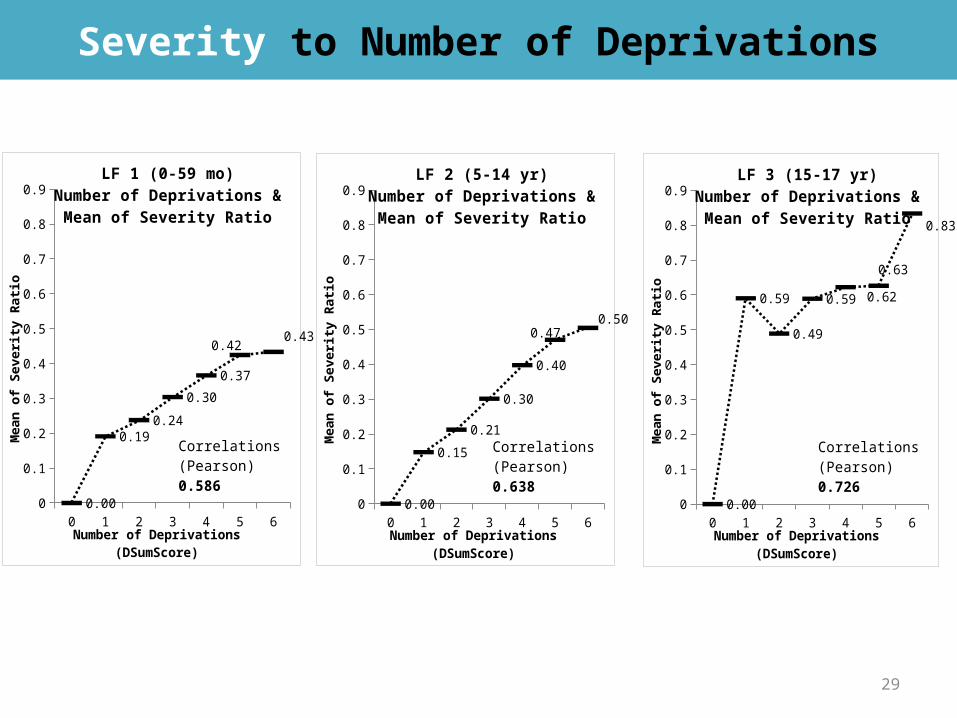
Severity to Number of Deprivations
0 1 2 3 4 5 60
0.1
0.2
0.3
0.4
0.5
0.6
0.7
0.8
0.9
0.00
0.190.24
0.30
0.37
0.420.43
LF 1 (0-59 mo)Number of Deprivations & Mean of
Severity Ratio
Number of Deprivations (DSumScore)
Mea
n of
Sev
erity
Rati
o
Correlations (Pearson) 0.586
0 1 2 3 4 5 60
0.1
0.2
0.3
0.4
0.5
0.6
0.7
0.8
0.9
0.00
0.15
0.21
0.30
0.40
0.470.50
LF 2 (5-14 yr)Number of Deprivations & Mean of
Severity Ratio
Number of Deprivations (DSumScore)
Mea
n of
Sev
erity
Rati
o
Correlations (Pearson) 0.638
0 1 2 3 4 5 60
0.1
0.2
0.3
0.4
0.5
0.6
0.7
0.8
0.9
0.00
0.59
0.49
0.59 0.62
0.63
0.83
LF 3 (15-17 yr)Number of Deprivations & Mean of
Severity Ratio
Number of Deprivations (DSumScore)
Mea
n of
Sev
erity
Rati
o
Correlations (Pearson) 0.726

30
Life-Cycle Stages
LF1 (0-59 mo) LF2 (5-14 yr) LF3 (15-17 yr)0%
100%
200%
300%
400%
500%
600%
700%
800%
900%
1000%
1.1
3.0
0.4
1.7
3.1
1.0
1.8
2.1
0.7
1.0
0.5
0.2
Deprivation Levels by Life-Cycle Stage

Profile Characteristics

32
Deprivation Levels by Urban/Rural
Rural Urban0%
10%
20%
30%
40%
50%
60%
70%
80%
90%
100%
41%
18%
34%
36%
20%
33%
5%13%
Deprivation Levels by Area

33
Deprivation Levels by Wealth Quintile
Q5 (Poorest) Q4 Q3 Q2 Q1 (Richest)0%
10%
20%
30%
40%
50%
60%
70%
80%
90%
100%
53%
30%21% 16%
9%
30%
40%
39%36%
30%
13%
23%30%
35%
41%
3% 7% 10% 13%20%
Deprivation Levels by Wealth Quintile
34
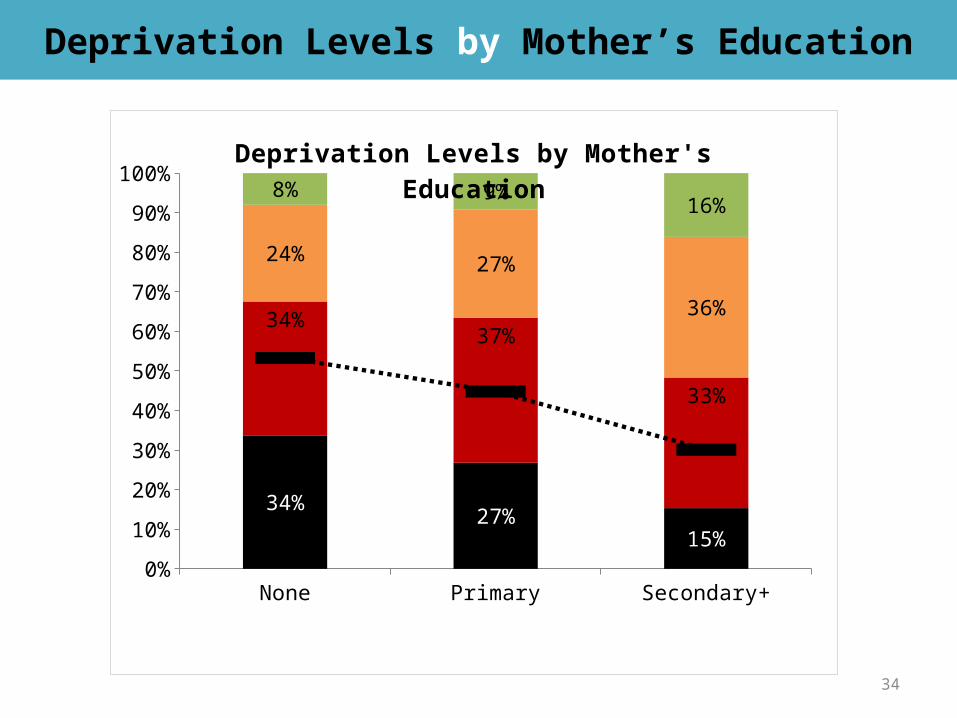
Deprivation Levels by Mother’s Education
None Primary Secondary+0%
10%
20%
30%
40%
50%
60%
70%
80%
90%
100%
34%27%
15%
34%37%
33%
24% 27%
36%
8% 9%16%
Deprivation Levels by Mother's Education

35
Deprivation Levels by Sex
Girls Boys0%
10%
20%
30%
40%
50%
60%
70%
80%
90%
100%
27% 27%
35% 35%
28% 28%
10% 10%
Overall Deprivation Levels by Sex
LF1 0-59 mo LF2 5-14 yr LF3 15-17 yr45%
50%
55%
60%
65%
70%
75%
50%
69% 65%
50%
71%
60%
Percentage Multiple-Deprived by Sex and Life-Cycle Stage
Girls Multiple DeprivedBoys Multiple Deprived

37
0 1 2 3 4 5 6 7 8 9 10 11 12 13 14 15 16 170%
10%
20%
30%
40%
50%
60%
70%
80%
90%
100%
0.0
0.1
0.2
0.3
0.4
0.5
0.6
0.7
0.8
0.9
1.0
19%
50% 45%
16% 19%
30% 46%
34%
35%
13%
28%
29%
17%
2%8% 7%
High Dep (3+) Med Dep (2) Single Dep (1) Well-Off (0)
Deprivation Levels by Age (year)

Patterns * Overlap
39
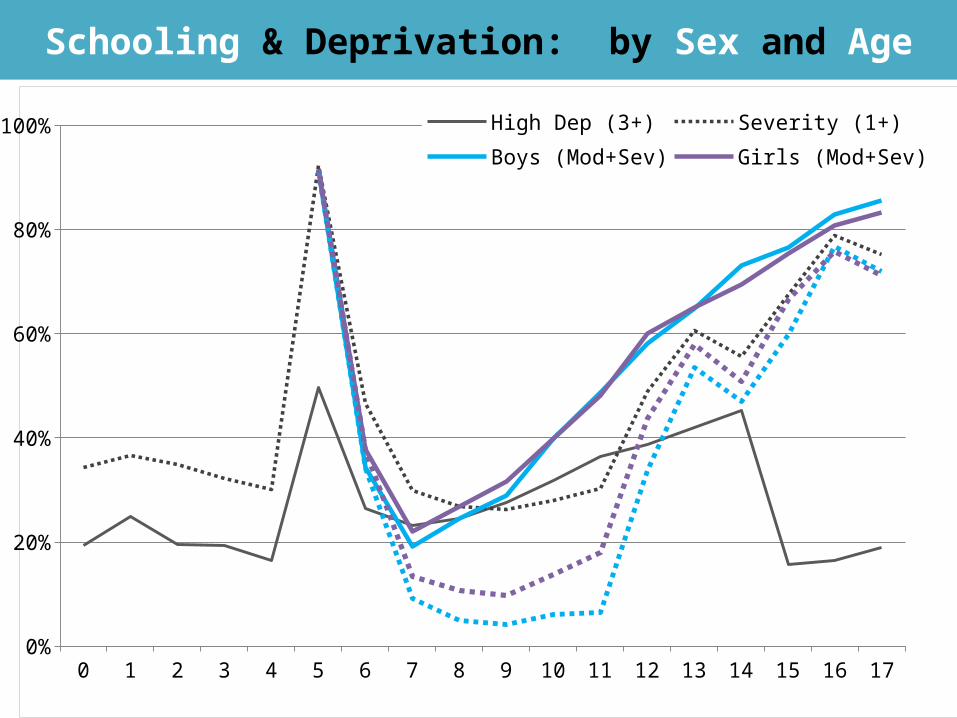
Schooling & Deprivation: by Sex and Age
0 1 2 3 4 5 6 7 8 9 10 11 12 13 14 15 16 170%
20%
40%
60%
80%
100% High Dep (3+) Severity (1+)Boys (Mod+Sev) Girls (Mod+Sev)Boys (SEV) Girls (SEV)
40
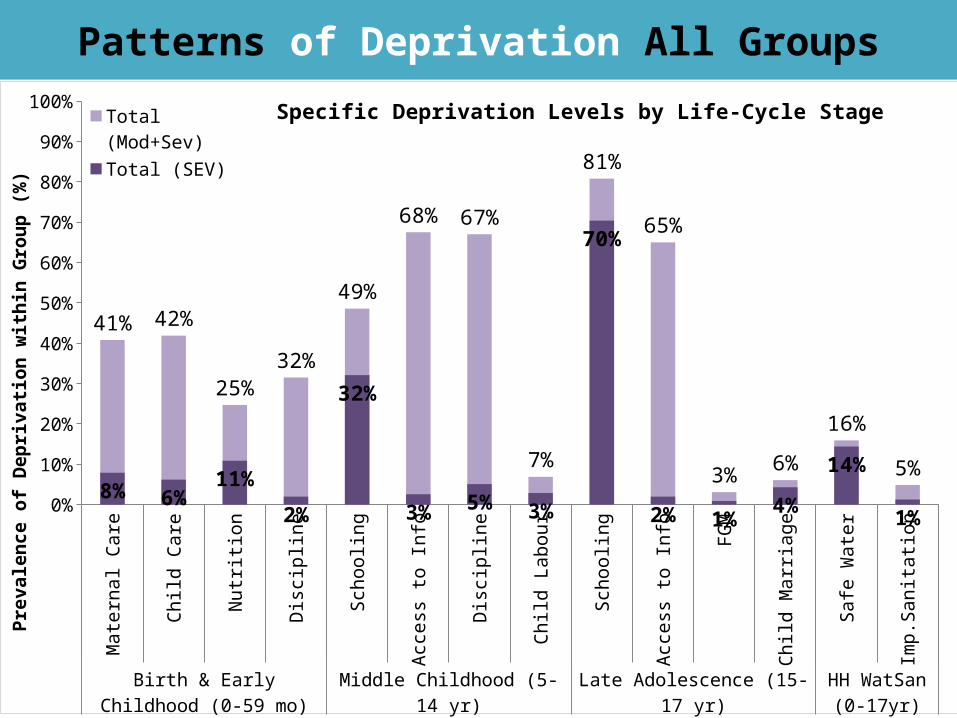
Patterns of Deprivation All GroupsM
ater
nal C
are
Child
Car
e
Nut
rition
Disc
iplin
e
Scho
olin
g
Acce
ss to
Info
Disc
iplin
e
Child
Lab
our
Scho
olin
g
Acce
ss to
Info
FGM
Child
Mar
riage
Safe
Wat
er
Imp.
Sani
tatio
n
Birth & Early Childhood (0-59 mo)
Middle Childhood (5-14 yr) Late Adolescence (15-17 yr) HH WatSan (0-17yr)
0%
10%
20%
30%
40%
50%
60%
70%
80%
90%
100%
41% 42%
25%32%
49%
68% 67%
7%
81%
65%
3% 6%
16%
5%8% 6%
11%
2%
32%
3% 5% 3%
70%
2% 1%4%
14%
1%
Specific Deprivation Levels by Life-Cycle StageTotal (Mod+Sev)
Total (SEV)
Prev
alen
ce o
f Dep
riva
tion
wit
hin
Gro
up (%
)

41
Patterns of Deprivation Well-OffM
ater
nal C
are
Child
Car
e
Nut
ritio
n
Dis
cipl
ine
Scho
olin
g
Acce
ss to
Info
Dis
cipl
ine
Child
Lab
our
Scho
olin
g
Acce
ss to
Info
FGM
Child
Mar
riag
e
Safe
Wat
er
Imp.
Sani
tatio
n
Birth & Early Childhood (0-59 mo) Middle Childhood (5-14 yr) Late Adolescence (15-17 yr) HH WatSan (0-17yr)
0%
10%
20%
30%
40%
50%
60%
70%
80%
90%
100%
Specific Deprivation Levels by Life-Cycle Stage(Well-Off 1.7m / 10%)
Well-Off (0)
Prev
alen
ce o
f Dep
riva
tion
wit
hin
Gro
up (%
)

42
Patterns of Deprivation Low Dep (1)M
ater
nal C
are
Child
Car
e
Nut
ritio
n
Dis
cipl
ine
Scho
olin
g
Acce
ss to
Info
Dis
cipl
ine
Child
Lab
our
Scho
olin
g
Acce
ss to
Info
FGM
Child
Mar
riag
e
Safe
Wat
er
Imp.
Sani
tatio
n
Birth & Early Childhood (0-59 mo) Middle Childhood (5-14 yr) Late Adolescence (15-17 yr) HH WatSan (0-17yr)
0%
10%
20%
30%
40%
50%
60%
70%
80%
90%
100%
26% 27%
15%
25%
15%
37%
46%
1%
67%
30%
2% 0%3% 1%
Specific Deprivation Levels by Life-Cycle Stage(Low Dep 4.6m / 28%)Single Dep (1)
1D Severe (1+)
Prev
alen
ce o
f Dep
riva
tion
wit
hin
Gro
up (%
)

43
Patterns of Deprivation Med Dep (2)M
ater
nal C
are
Child
Car
e
Nut
ritio
n
Dis
cipl
ine
Scho
olin
g
Acce
ss to
Info
Dis
cipl
ine
Child
Lab
our
Scho
olin
g
Acce
ss to
Info
FGM
Child
Mar
riag
e
Safe
Wat
er
Imp.
Sani
tatio
n
Birth & Early Childhood (0-59 mo) Middle Childhood (5-14 yr) Late Adolescence (15-17 yr) HH WatSan (0-17yr)
0%
10%
20%
30%
40%
50%
60%
70%
80%
90%
100%
54% 56%
30%
40%44%
75%71%
3%
97%
88%
3% 4%9%
2%
Specific Deprivation Levels by Life-Cycle Stage(Med Dep 5.8m / 35%)Med Dep (2)
MD Severe (1+)
Prev
alen
ce o
f Dep
riva
tion
wit
hin
Gro
up (%
)

44
Patterns of Deprivation High Dep (3+)M
ater
nal C
are
Child
Car
e
Nut
ritio
n
Dis
cipl
ine
Scho
olin
g
Acce
ss to
Info
Dis
cipl
ine
Child
Lab
our
Scho
olin
g
Acce
ss to
Info
FGM
Child
Mar
riag
e
Safe
Wat
er
Imp.
Sani
tatio
n
Birth & Early Childhood (0-59 mo) Middle Childhood (5-14 yr) Late Adolescence (15-17 yr) HH WatSan (0-17yr)
0%
10%
20%
30%
40%
50%
60%
70%
80%
90%
100%
80% 81%
53%56%
86%93%
89%
17%
100%97%
8%
26%
43%
15%
Specific Deprivation Levels by Life-Cycle Stage(High Dep 4.5m / 27%)High Dep (3+)
HD Severe 1+
Prev
alen
ce o
f Dep
riva
tion
wit
hin
Gro
up (%
)

45
Overlaps of Deprivation (LF1 0-59 mo)
No Deprivations
Child Care
Maternal Care
Discipline
Nutrition
Water
Sanitation
Maternal Care + Child Care +++
(Maternal Care) + Child Care + Nutrition ++
Maternal Care - (Child Care) + Nutrition ++
Discipline + Child Care
Others
-1
Dep
rivati
onM
ultip
le
0% 10% 20% 30% 40%
17%
9%
9%
8%
5%
2%
0%
20%
5%
5%
5%
15%
42%
41%
32%
25%
16%
5%
17%
33%30%
20%

46
Overlaps of Deprivation (LF2 5-14 yr)
No Deprivations
Access to Info
Discipline
Schooling
Safe Water
Child Labour
Improved Sanitation
Discipline + Access to Info + Schooling ++
Discipline + Access to Info - (Schooling) ++
Discipline - (Access to Info) + Schooling ++
(Discipline) + Access to Info + Schooling ++
Others
-1
Dep
rivati
onM
ultip
le
0% 10% 20% 30% 40% 50% 60% 70%
6%
9%
11%
4%
0%
0%
0%
24%
21%
9%
11%
5%
68%
67%
49%
16%
7%
5%
6%
24%
36%
34%

47
Overlaps of Deprivation (LF3 15-17 yr)
No Deprivations
Schooling
Access to Info
FGM
Safe Water
Improved Sanitation
Child Marriage
Schooling + Access to Info +++
Others
-1
Dep
rivati
onM
ultip
le
0% 10% 20% 30% 40% 50% 60% 70% 80%
8%
20%
9%
1%
0%
0%
0%
55%
7%
81%
65%
3%
15%
4%
6%
8%
30%
45%
17%

48
Overlaps of Deprivation (LF3 15-17 yr)
8%
30%
45%
17%
GIRLS 15-17 yrs Deprived by FGM (Moderate/Severe)
GovernorateNot Deprived
(Mod)Deprived
(Mod/Sev) Total
Duhuk 98.5% 1.5% / 0.7% 100%Nainwa 99.8% 0.2% / 0.0% 100%Sulimania 72.6% 27.4% / 5.6% 100%Kirkuk 90.5% 9.5% / 1.7% 100%Arbil 57.8% 42.2% / 14.8% 100%Diala 100% 100%Anbar 100% 100%Baghdad 100% 100%Babil 100% 100%Karbala 100% 100%Wasit 100% 100%Salahaladin 100% 100%Najaf 100% 100%Qadisya 100% 100%Almuthana 100% 100%Thiqar 100% 100%Misan 100% 100%Albasrah 100% 100%Total 93.7% 6.3% / 1.8% 100%
* Severe: believes should be continued
* Little overlap with Marriage (> 4% in KR)
•Example Erbil overlap (total 42.2%):- 7% Only FGM- 31.6% with Schooling ++- 19.9% with Access to Info ++
Proximity * Geography
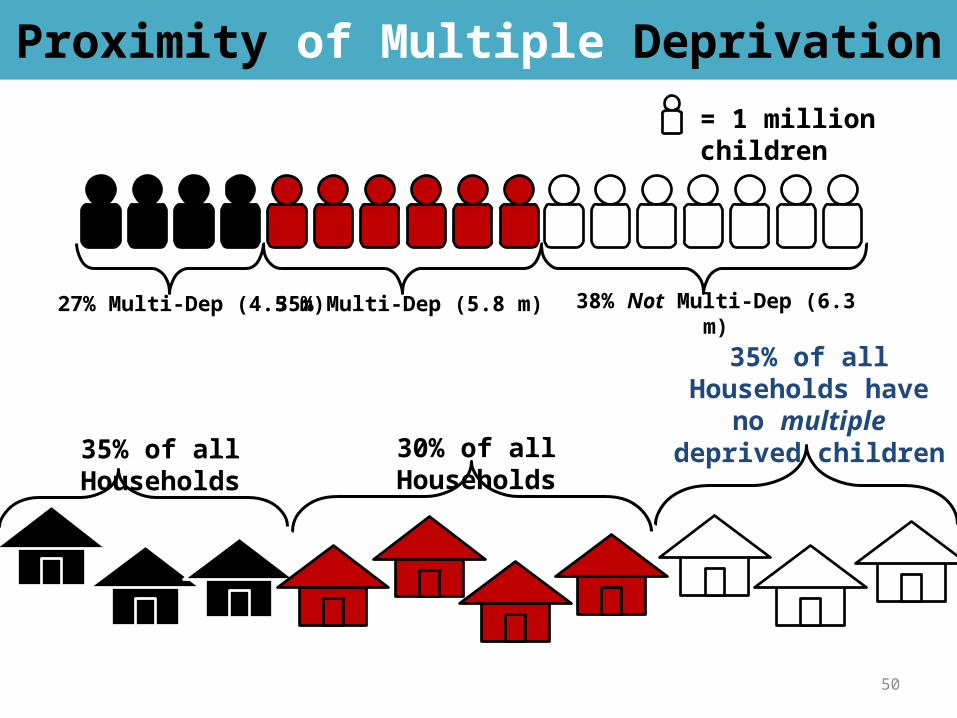
Proximity of Multiple Deprivation
50
= 1 million children
27% Multi-Dep (4.5 m)
35% of all Households
35% of all Households have no multiple deprived children
35% Multi-Dep (5.8 m)
30% of all Households
38% Not Multi-Dep (6.3 m)
51
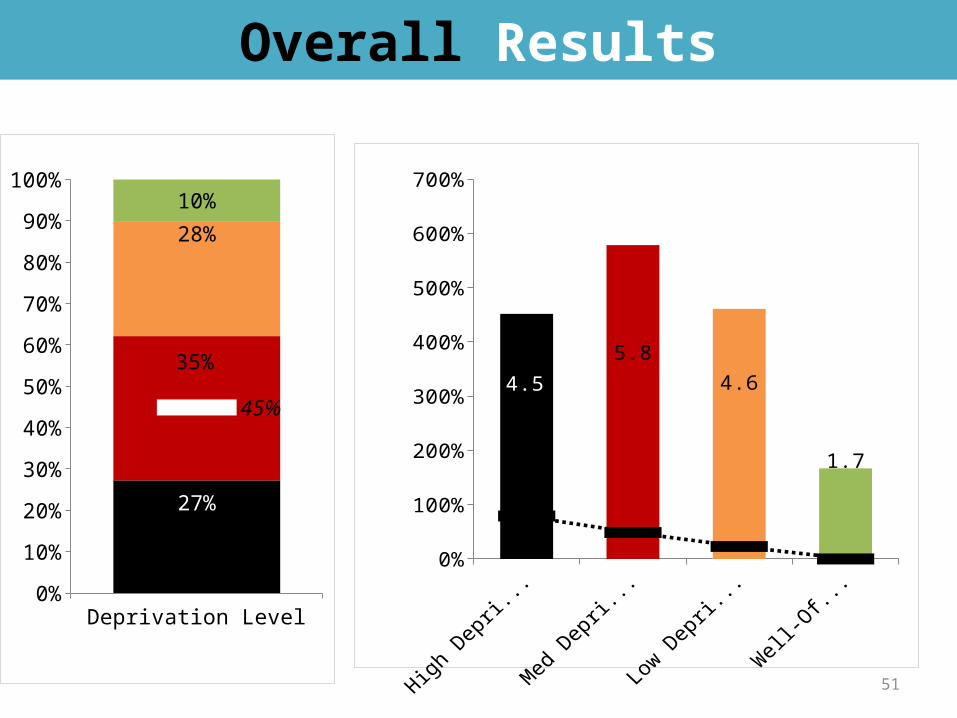
Overall Results
Deprivation Level0%
10%
20%
30%
40%
50%
60%
70%
80%
90%
100%
27%
35%
28%
10%
45%
0%
100%
200%
300%
400%
500%
600%
700%
4.5
5.8 4.6
1.7

0 50,000 100,000 150,000 200,000 250,000 300,000 350,0000%
20%
40%
60%
DohoukSuleymaniya
Kirkuk
Erbil
AnbarBabil
Kerbala
Muthana
Thi Qar
Misan
Basrah
Higher Number of Children High Deprived (3+)
Hig
her %
of C
hild
ren
Hig
h D
epri
ved
3+
Bagh-dad
(673,000 / 18%)
650,000
Nineveh(608,000 /
38%)
Geography of Multiple Deprivation
52
E rbil
Al Anbar
Al Basrah
Al S ulaymaniyah
Al Qadissiya
Al Muthanna
Babil
Baghdad
Dahuk
Najaf
Diyala
Thi-Qar
S alah Ad Din
Kerbala
Kirkuk
Missan
Ninewa
Was s it
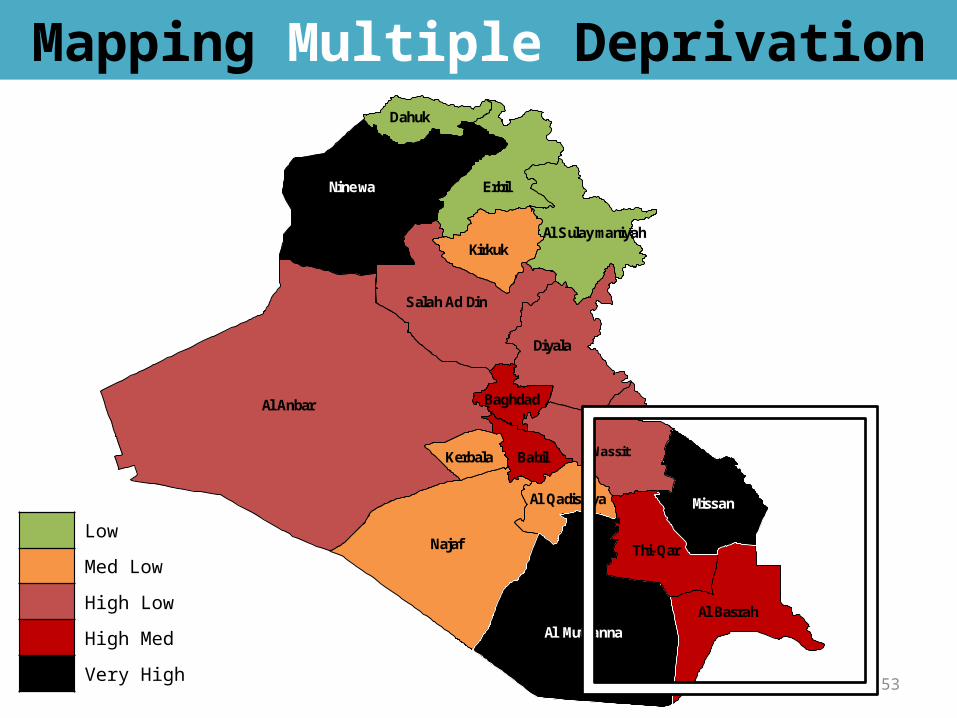
Low
Med Low
High Low
High Med
Very High53
Mapping Multiple Deprivation

BASRAH 280,000 (28%)
MISSAN 200,000 (43%)
THI-QAR 294,000 (32%)
54
Drilling Down Sub-Governorate
Low
Med Low
High Low
High Med
Very High
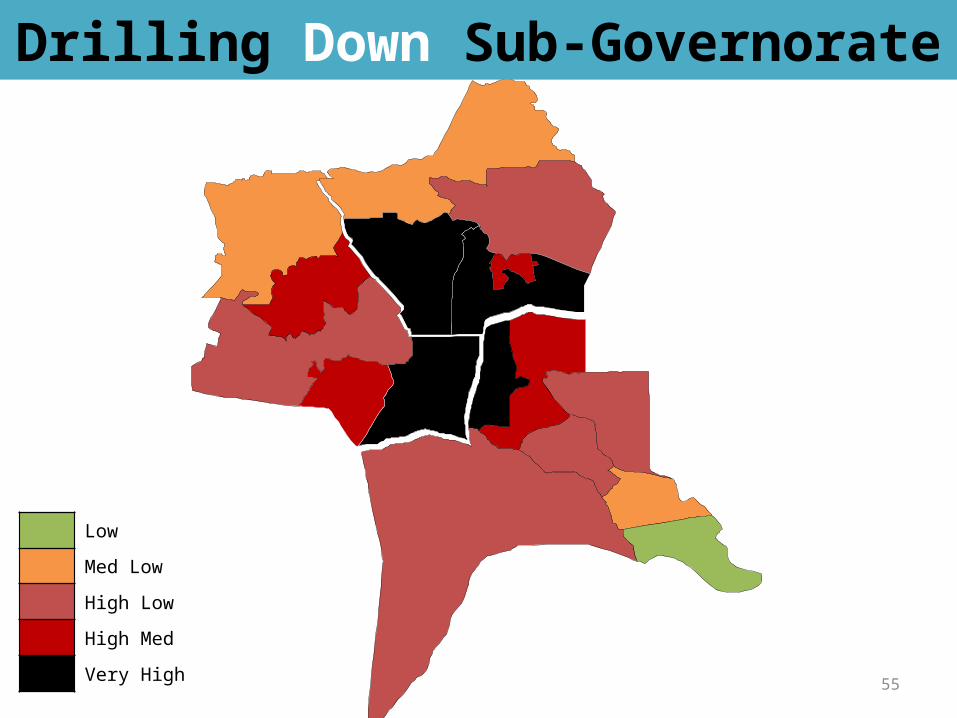
55
Drilling Down Sub-Governorate
Low
Med Low
High Low
High Med
Very High

Target Achievement
57
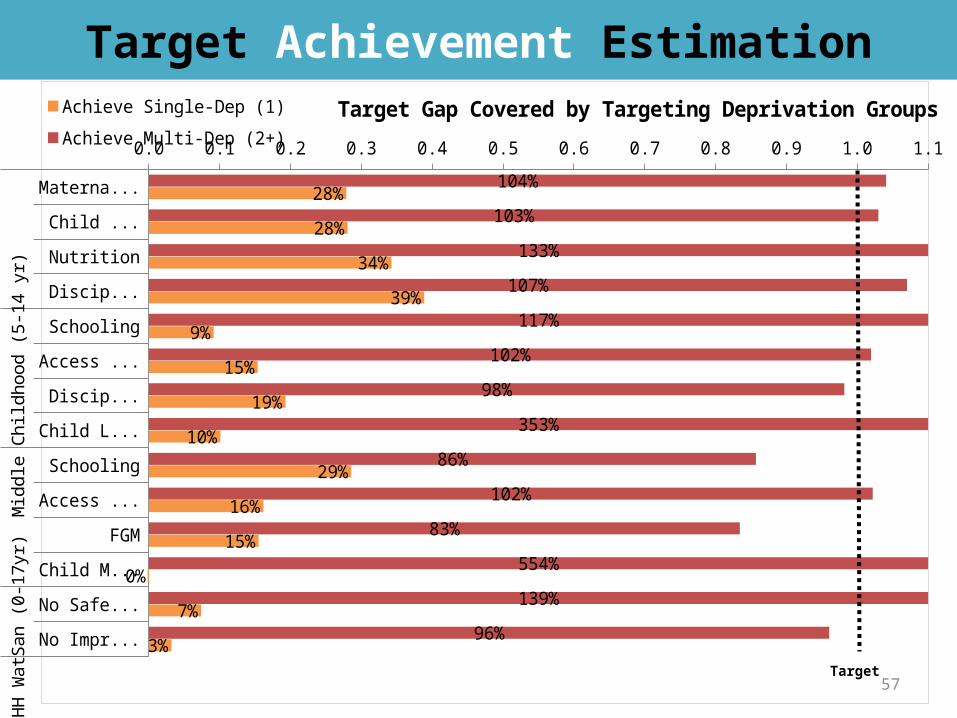
Target Achievement Estimation
Maternal ...
Child Care
Nutrition
Discipline
Schooling
Access to Info
Discipline
Child Labour
Schooling
Access to Info
FGM
Child Marr...
No Safe W...
No Improve...
Mid
dle
Child
hood
(5-1
4 yr
)H
H W
atSa
n (0
-17y
r)
0.0 0.1 0.2 0.3 0.4 0.5 0.6 0.7 0.8 0.9 1.0 1.1
104%
103%
133%
107%
117%
102%
98%
353%
86%
102%
83%
554%
139%
96%
28%
28%
34%
39%
9%
15%
19%
10%
29%
16%
15%
0%
7%
3%
Target Gap Covered by Targeting Deprivation GroupsAchieve Single-Dep (1)
Achieve Multi-Dep (2+)
Target

Thank you!
58