is coal to liquids fincially feasible in india
TRANSCRIPT
1
Is coal to liquids project financially feasible in
India?
2
TABLE OF CONTENT
Is coal to liquids project financially feasible in India? 1
Abstract 4
1. Introduction 6
2. Rationale for CTL in India 8
2.1. Growing crude oil prices vis-à-vis break-even CTL prices 8
2.2. Abundance of coal resources 8
2.3. Policy and fiscal support 9
2.4. Technology available for commercial scale CTL project 9
3. Case study of CTL project 10
3.1. Details of operations of SASOL 10
3.2. Financial analysis for SASOL 11
3.3. Capital cost estimates for CTL by world coal institute 15
4. CTL project conceptualization and financial analysis 16
4.1. Project conceptualisation 16
4.2. Financial analysis 18
4.3. Sensitivity to capital cost changes 21
4.4. Sensitivity to cost of production changes 21
4.5. Sensitivity on account of price of product changes 22
4.6. Sensitivity on account of carbon dioxide cost inclusion 22
5. Conclusion 24
6. Bibliography 25
6.1. Primary Sources 25
6.2. Secondary Source 26
TABLE OF TABLES
Table 1: SASOL’s CTL project summary ....................................................................................... 14
Table 2: CTL project conceptualization in India ............................................................................. 16
Table 3: Base case financial analysis for CTL project in India ....................................................... 19
Table 5: CCS Cost estimates ............................................................................................................ 23
3
TABLE OF FIGURES
Figure 1: Change in India’s primary energy mix (excluding bio-mass & waste) .............................. 6
Figure 2: Project price of crude oil vs. breakeven price of crude oil at which CTL is viable ........... 8
Figure 3: CTL product break-up of SASOL – 10 years average ..................................................... 10
Figure 4: SASOL’s CTL process at Secunda, South Africa ............................................................ 11
Figure 4: SASOL’s CTL product prices (average) vs global Brent prices ...................................... 12
Figure 6: SASOL’s CTL production cost structure ......................................................................... 13
Figure 6: Unconventional petroleum liquids capital investment ..................................................... 15
Figure 8: Benchmark gross refinery margin for Asian markets- Singapore Benchmark ................. 20
Figure 9: Changes in net revenue of Indian CTL project with capital cost changes ....................... 21
Figure 10: Changes in net revenue of Indian CTL project with changes in cost of production ...... 21
Figure 11: Changes in net revenue of Indian CTL project with product price changes .................. 22
Figure 12: Changes in net revenue of Indian CTL project with CCS cost ...................................... 22
4
Abstract
India needs to sustain it’s annual econmic growth rate around eight to ten percent which in turn is
dependent on availability of energy with lesser burden to economy. Liquid fuel availability could
be augumented through CTL technologies. This paper seeks to analyse the financial feasibility of
CTL projects in India by providing rationale of CTL projects followed by case study of successful
of CTL project in South Africa. Sensitivity of net revenue is presented with respect to changes in
capital costs, operating costs, product prices and application of carbon capture and sequestration.
Word Count: 2189

5
Abbreviations
BCOP Breakeven Crude Oil Price
bbl Barrel
BCF Billion cubic feet
bt Billion tons
CAGR Compounded Average Growth Rate
CCS Carbon Capture & Sequestration
CIL Coal India Limited
CMNA Coal Mines Nationalisation Act, 1973
CTL Coal to Liquids
DCL Direct Coal Liquefaction
DECC Department of Energy & Climate Change, Government of UK
DGH Directorate General of Hydrocarbons, Government of India
D&A Depreciation & Amortisation
FT Fisher-Tropsch
GDP Gross Domestic Product
GOI Government of India
ICL Indirect Coal Liquefaction
IEA International Energy Agency
INR Indian Rupee
ISP Indian Standard Procedure
MCL Mahanadi coalfields Limited
MDO Mine Developer and Operator
MoC Ministry of Coal. Government of India
MOPNG Ministry of Petroleum & Natural Gas, Government of India
Mtpa Million tons per annum
RBI Reserve Bank of India
6
1. Introduction
To alleviate poverty significantly and meet human development goals, India needs to sustain its
annual economic growth rate at around eight to ten percent (Planning Commission, Government
of India, hereinafter “PC, GOI” 2006). Further PC, GOI states:
“Meeting the energy challenge is of fundamental importance to India’s economic growth
imperatives and its efforts to raise its level of human development.”
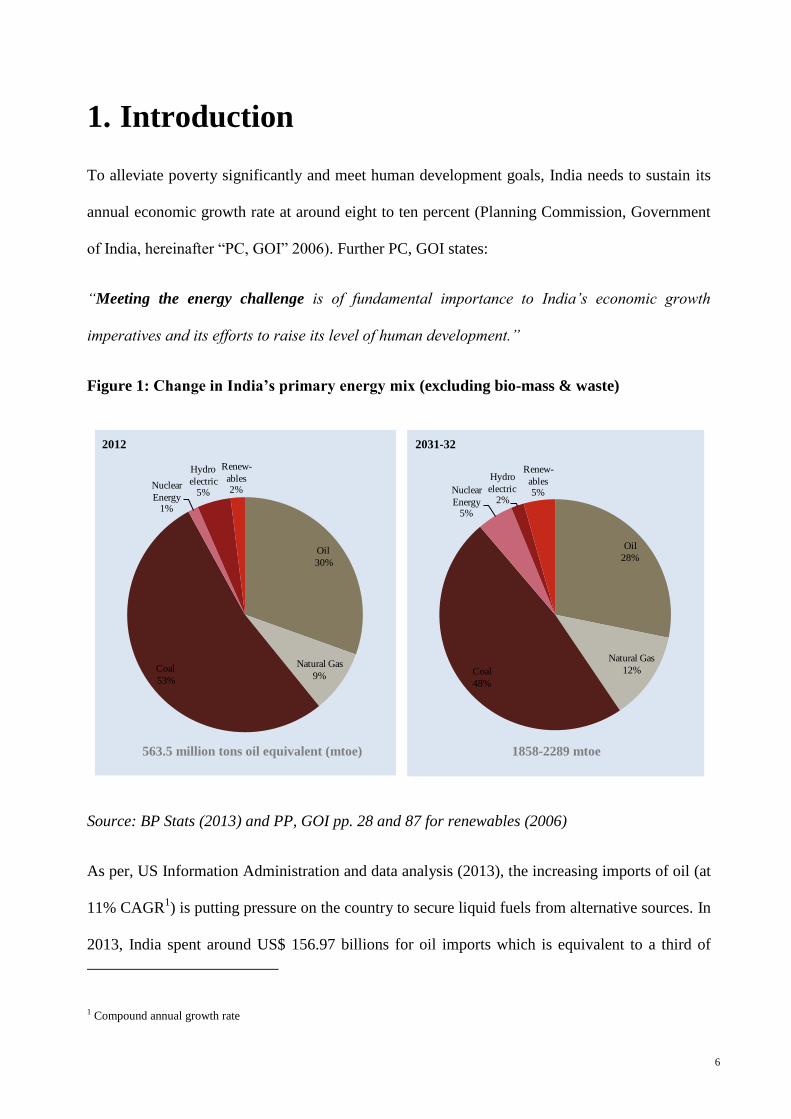
Figure 1: Change in India’s primary energy mix (excluding bio-mass & waste)
Source: BP Stats (2013) and PP, GOI pp. 28 and 87 for renewables (2006)
As per, US Information Administration and data analysis (2013), the increasing imports of oil (at
11% CAGR1) is putting pressure on the country to secure liquid fuels from alternative sources. In
2013, India spent around US$ 156.97 billions for oil imports which is equivalent to a third of
1 Compound annual growth rate
Oil
30%
Natural Gas
9%Coal
53%
Nuclear
Energy1%
Hydro
electric5%
Renew-
ables2%
2012
Oil
28%
Natural Gas
12%Coal
48%
Nuclear
Energy5%
Hydro
electric2%
Renew-
ables5%
2031-32
563.5 million tons oil equivalent (mtoe) 1858-2289 mtoe
7
India’s total import bill (Indian Express, 2013). Further as per EIA, India’s proven oil reserves
may exhaust in next 21 years with current production rate. So, India may look for producing
liquids fuels from coal by using Coal to Liquids (CTL) technologies.
This paper seeks to analyse the financial feasibility of CTL projects in India. The second chapter
provides the rationale for CTL projects. This is followed by case study on success of CTL project
in South Africa and then by financial feasibility of CTL project in India in fourth chapter. Fifth
chapter presents conclusion.
8
2. Rationale for CTL in India
2.1. Growing crude oil prices vis-à-vis break-even CTL prices
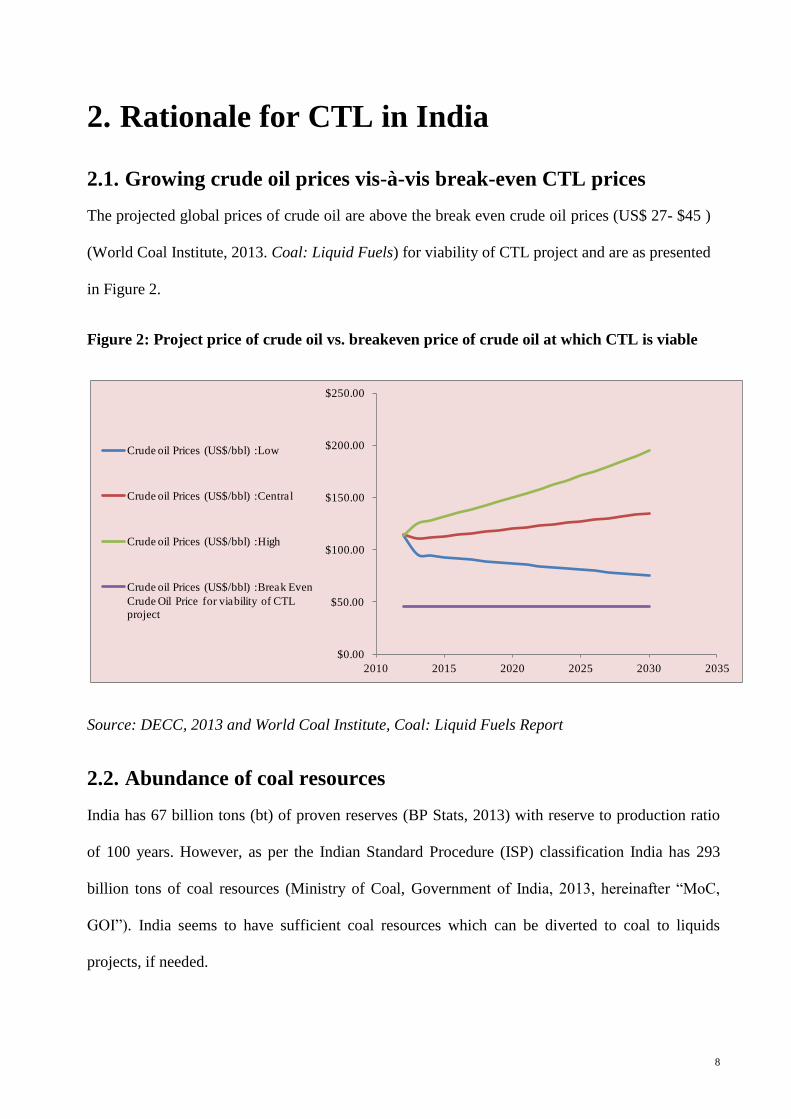
The projected global prices of crude oil are above the break even crude oil prices (US$ 27- $45 )
(World Coal Institute, 2013. Coal: Liquid Fuels) for viability of CTL project and are as presented
in Figure 2.
Figure 2: Project price of crude oil vs. breakeven price of crude oil at which CTL is viable
Source: DECC, 2013 and World Coal Institute, Coal: Liquid Fuels Report
2.2. Abundance of coal resources
India has 67 billion tons (bt) of proven reserves (BP Stats, 2013) with reserve to production ratio
of 100 years. However, as per the Indian Standard Procedure (ISP) classification India has 293
billion tons of coal resources (Ministry of Coal, Government of India, 2013, hereinafter “MoC,
GOI”). India seems to have sufficient coal resources which can be diverted to coal to liquids
projects, if needed.
$0.00
$50.00
$100.00
$150.00
$200.00
$250.00
2010 2015 2020 2025 2030 2035
Crude oil Prices (US$/bbl) :Low
Crude oil Prices (US$/bbl) :Central
Crude oil Prices (US$/bbl) :High
Crude oil Prices (US$/bbl) :Break Even
Crude Oil Price for viability of CTL
project
9
2.3. Policy and fiscal support
Coal to liquids is recognised end-use for captive consumption of coal: The Section 3 (3)
(a) (iii) of amended Coal Mines Nationalisation Act, 1973 (CMNA) (MoC, GOI)
provides for captive mining by entities engaged in surface & underground coal
gasification and CTL in India from July 12, 2007 (PIB, GOI)
Foreign Direct Investment (FDI) of 100% in coal sector: Coal mining sector allows
100% of FDI in captive mining projects (Reserve Bank of India, 2012).
2.4. Technology available for commercial scale CTL project
There are two different CTL technologies - direct coal liquefaction (DCL) and indirect coal
liquefaction (ICL). In DCL technology, partially synthetic crude is produced from coal which is
further refined to produce synthetic diesel, gasoline, LPG etc. In ICL technologies, firstly coal is
gassified to produce synthetic gas, and then syngas is used to produce synthetic fuels. (Williams,
R.H. and Larson, E. D., 2003). It may be important to note that
1. As per Williams et al (2003, pp 103), ICL is a commercially proven technology.
2. Sasol Synfuels (Pty) Ltd (SASOL) in South Africa operates the only commercial CTL
projet based on ICL technology.
3. PC, GOI (2006, pp 63 and 105) recommends establishing CTL plant on SASOL’s
technology for domestic coal on commercial scale.
4. Further, Williams et al (2003, pp 117 ) indicate that the green house gas (GHG)
management may be an anciliary benefit of using ICL technologies.
Based on above facts, in favour of ICL technology, the paper analyses financial feasibility of a
typical CTL project in India based on ICL technology. However, to build-up assumptions
SASOL’s CTL operations in analysed and presented in next chapter.
10
3. Case study of CTL project
3.1. Details of operations of SASOL
SASOL uses Fischer-Tropsch (FT) process based on ICL technology to produce around 7.5
million tons per annum (Mtpa) of output. As per the annual reports of company from 2004
through 2013, the key details of the project may be summarised as follows:
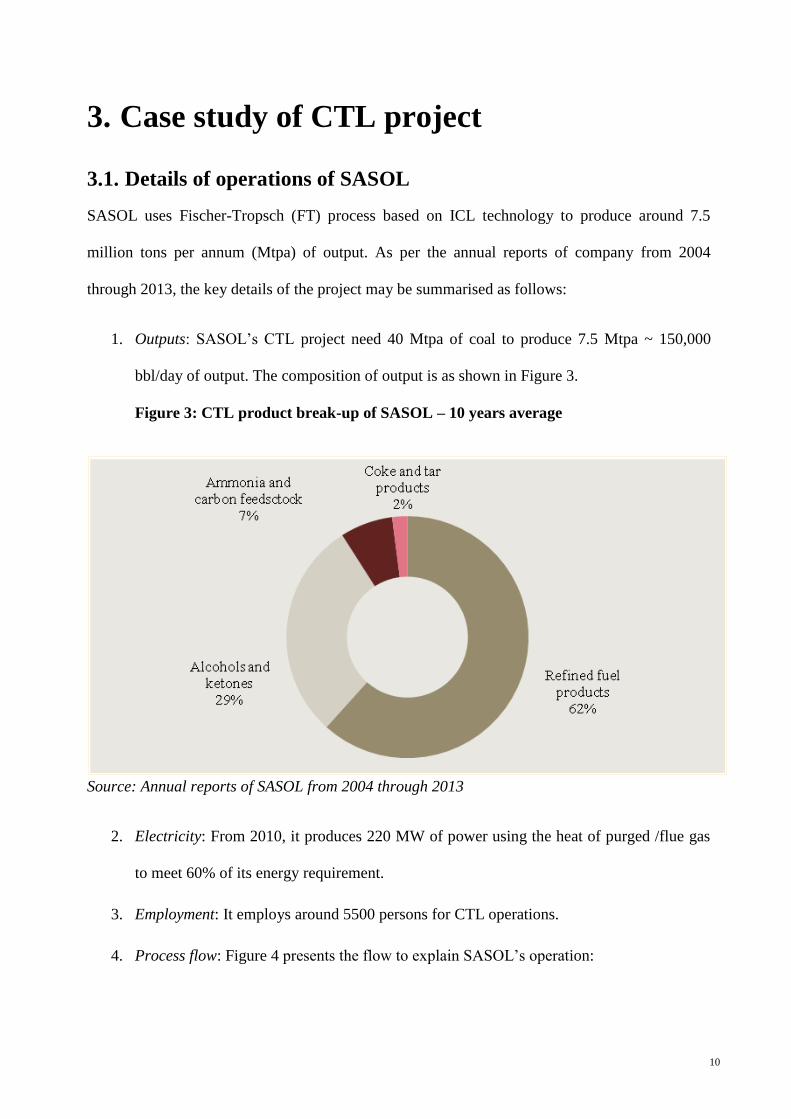
1. Outputs: SASOL’s CTL project need 40 Mtpa of coal to produce 7.5 Mtpa ~ 150,000
bbl/day of output. The composition of output is as shown in Figure 3.
Figure 3: CTL product break-up of SASOL – 10 years average
Source: Annual reports of SASOL from 2004 through 2013
2. Electricity: From 2010, it produces 220 MW of power using the heat of purged /flue gas
to meet 60% of its energy requirement.
3. Employment: It employs around 5500 persons for CTL operations.
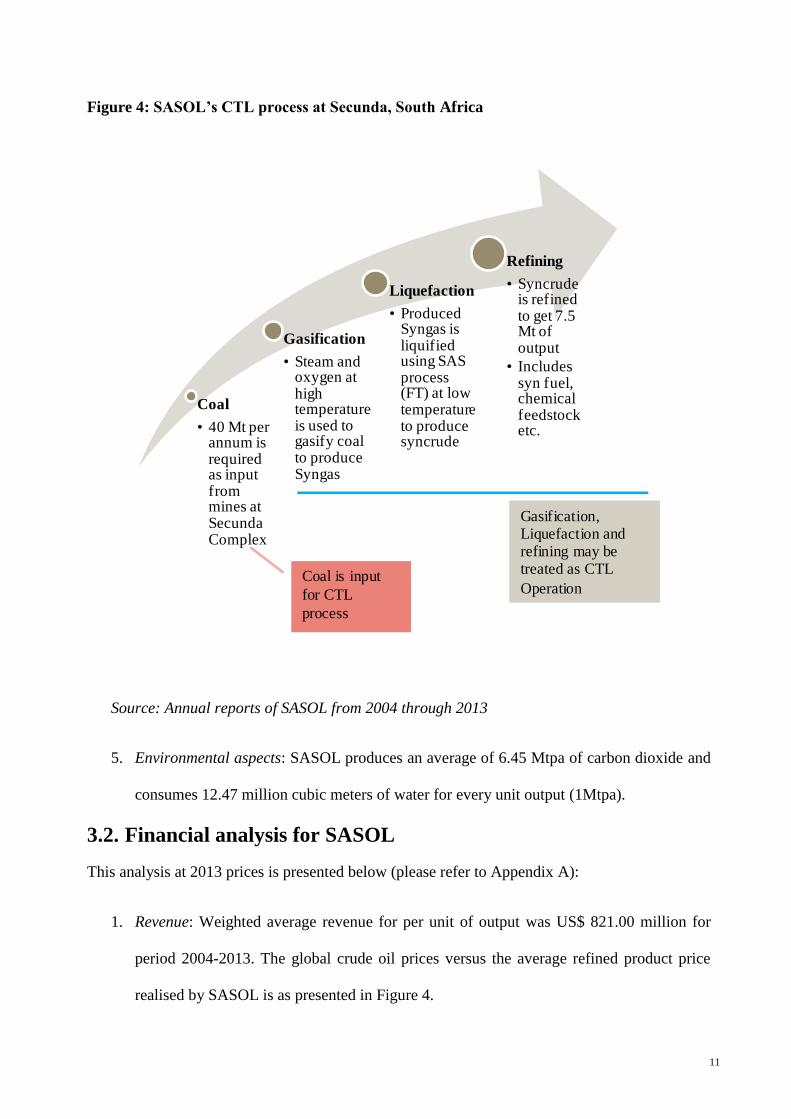
4. Process flow: Figure 4 presents the flow to explain SASOL’s operation:
11
Figure 4: SASOL’s CTL process at Secunda, South Africa
Source: Annual reports of SASOL from 2004 through 2013
5. Environmental aspects: SASOL produces an average of 6.45 Mtpa of carbon dioxide and
consumes 12.47 million cubic meters of water for every unit output (1Mtpa).
3.2. Financial analysis for SASOL
This analysis at 2013 prices is presented below (please refer to Appendix A):
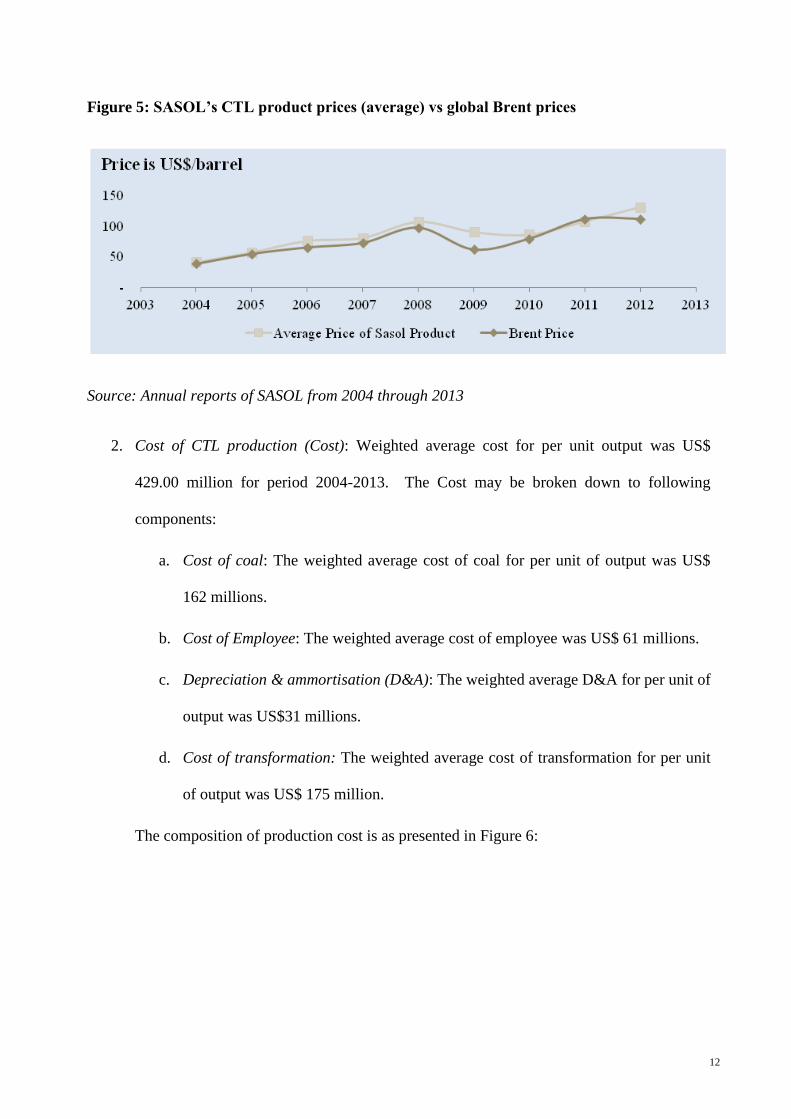
1. Revenue: Weighted average revenue for per unit of output was US$ 821.00 million for
period 2004-2013. The global crude oil prices versus the average refined product price
realised by SASOL is as presented in Figure 4.
Coal
• 40 Mt per annum is required as input from mines at Secunda Complex
Gasification
• Steam and oxygen at high temperature is used to gasify coal to produce Syngas
Liquefaction
• Produced Syngas is liquified using SAS process (FT) at low temperature to produce syncrude
Refining
• Syncrude is refined to get 7.5 Mt of output
• Includes syn fuel, chemical feedstock etc.
Gasification, Liquefaction and refining may be treated as CTL
Operation Coal is input
for CTL
process
12
Figure 5: SASOL’s CTL product prices (average) vs global Brent prices
Source: Annual reports of SASOL from 2004 through 2013
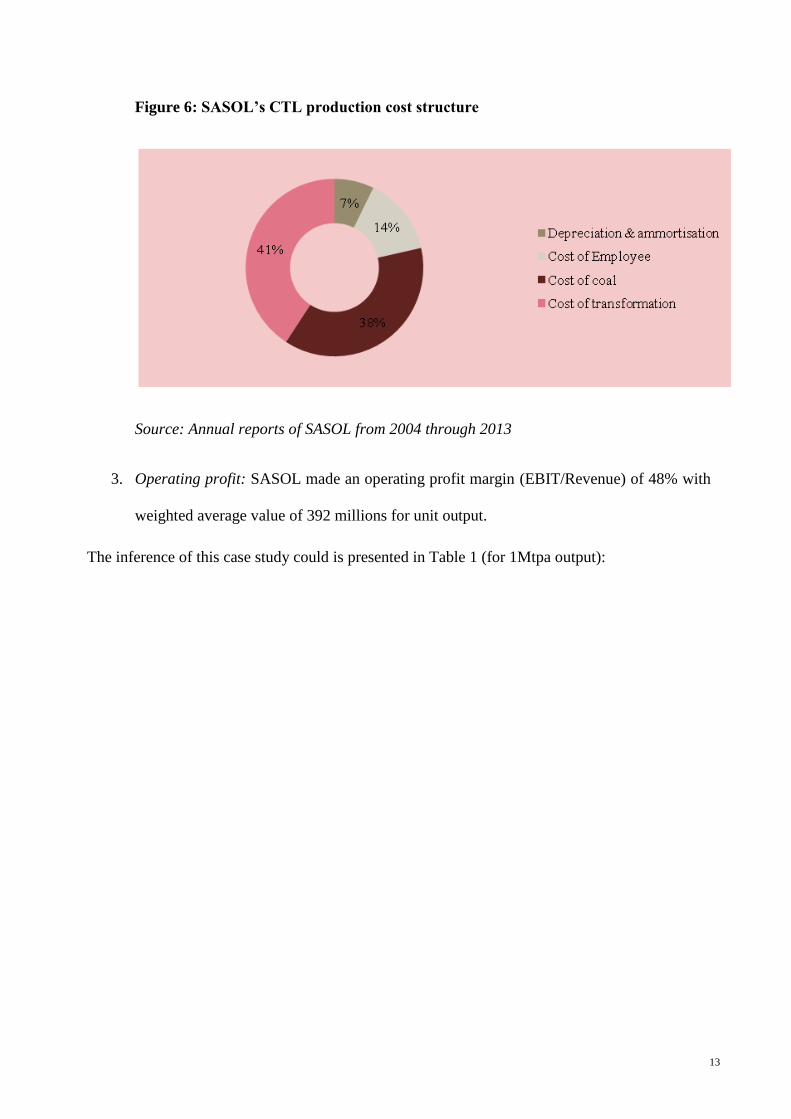
2. Cost of CTL production (Cost): Weighted average cost for per unit output was US$
429.00 million for period 2004-2013. The Cost may be broken down to following
components:
a. Cost of coal: The weighted average cost of coal for per unit of output was US$
162 millions.
b. Cost of Employee: The weighted average cost of employee was US$ 61 millions.
c. Depreciation & ammortisation (D&A): The weighted average D&A for per unit of
output was US$31 millions.
d. Cost of transformation: The weighted average cost of transformation for per unit
of output was US$ 175 million.
The composition of production cost is as presented in Figure 6:
13
Figure 6: SASOL’s CTL production cost structure
Source: Annual reports of SASOL from 2004 through 2013
3. Operating profit: SASOL made an operating profit margin (EBIT/Revenue) of 48% with
weighted average value of 392 millions for unit output.
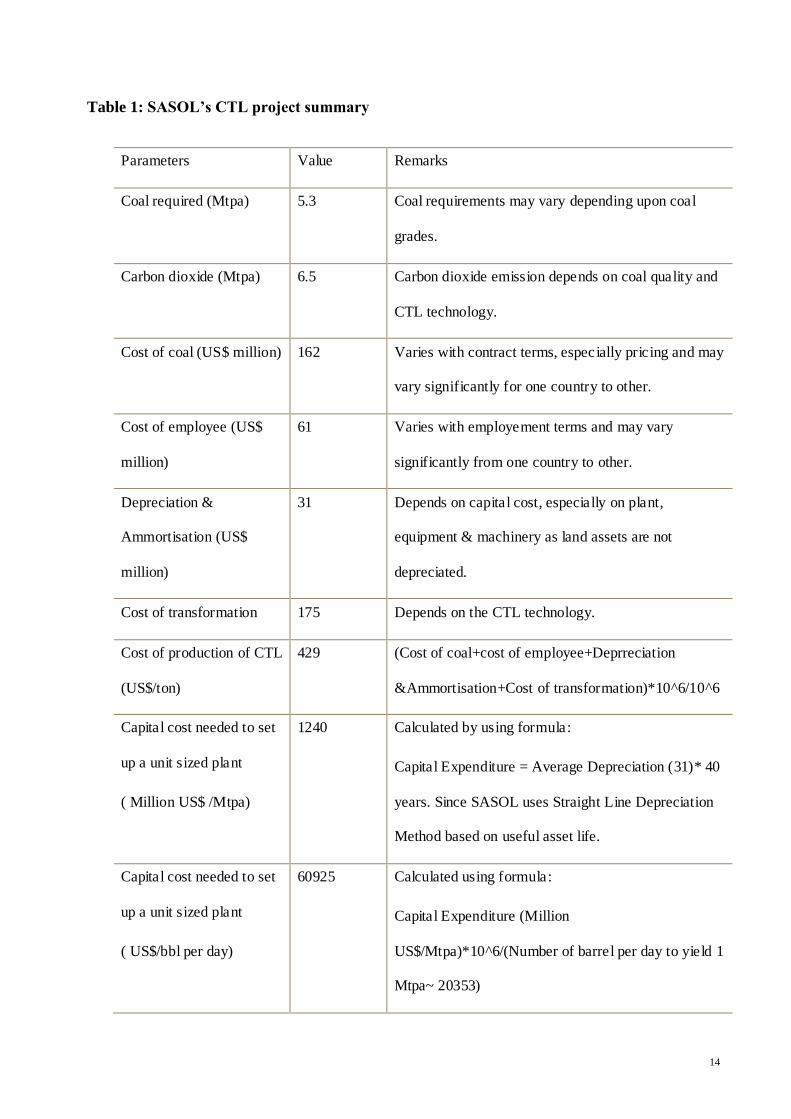
The inference of this case study could is presented in Table 1 (for 1Mtpa output):
14
Table 1: SASOL’s CTL project summary
Parameters Value Remarks
Coal required (Mtpa) 5.3 Coal requirements may vary depending upon coal
grades.
Carbon dioxide (Mtpa) 6.5 Carbon dioxide emission depends on coal quality and
CTL technology.
Cost of coal (US$ million) 162 Varies with contract terms, especially pricing and may
vary significantly for one country to other.
Cost of employee (US$
million)
61 Varies with employement terms and may vary
significantly from one country to other.
Depreciation &
Ammortisation (US$
million)
31 Depends on capital cost, especially on plant,
equipment & machinery as land assets are not
depreciated.
Cost of transformation 175 Depends on the CTL technology.
Cost of production of CTL
(US$/ton)
429 (Cost of coal+cost of employee+Deprreciation
&Ammortisation+Cost of transformation)*10^6/10^6
Capital cost needed to set
up a unit sized plant
( Million US$ /Mtpa)
1240 Calculated by using formula:
Capital Expenditure = Average Depreciation (31)* 40
years. Since SASOL uses Straight Line Depreciation
Method based on useful asset life.
Capital cost needed to set
up a unit sized plant
( US$/bbl per day)
60925 Calculated using formula:
Capital Expenditure (Million
US$/Mtpa)*10^6/(Number of barrel per day to yield 1
Mtpa~ 20353)
15
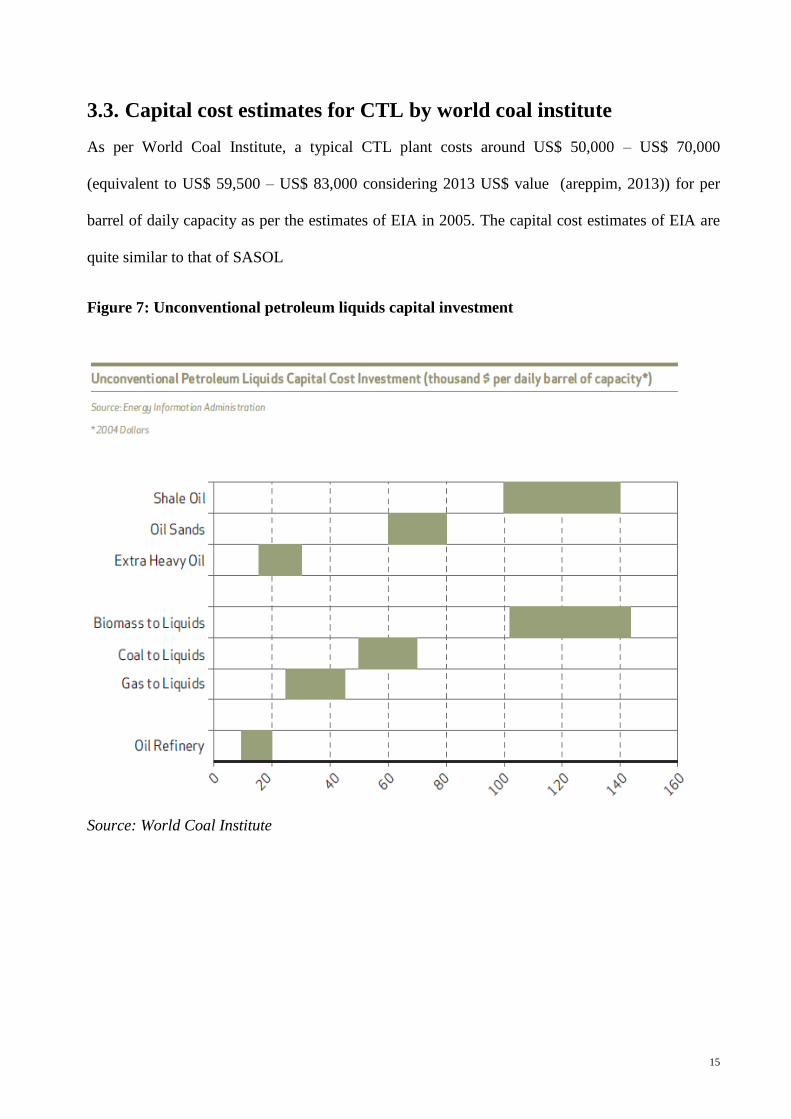
3.3. Capital cost estimates for CTL by world coal institute
As per World Coal Institute, a typical CTL plant costs around US$ 50,000 – US$ 70,000
(equivalent to US$ 59,500 – US$ 83,000 considering 2013 US$ value (areppim, 2013)) for per
barrel of daily capacity as per the estimates of EIA in 2005. The capital cost estimates of EIA are
quite similar to that of SASOL
Figure 7: Unconventional petroleum liquids capital investment
Source: World Coal Institute
16
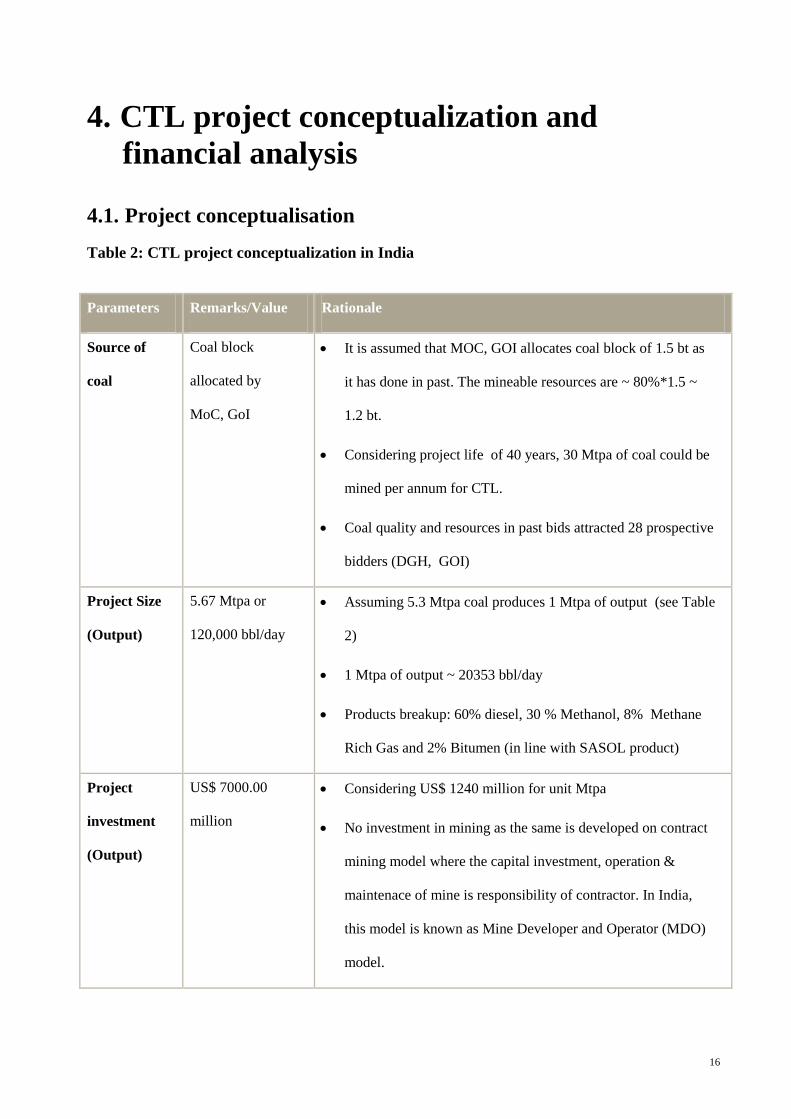
4. CTL project conceptualization and
financial analysis
4.1. Project conceptualisation
Table 2: CTL project conceptualization in India
Parameters Remarks/Value Rationale
Source of
coal
Coal block
allocated by
MoC, GoI
It is assumed that MOC, GOI allocates coal block of 1.5 bt as
it has done in past. The mineable resources are ~ 80%*1.5 ~
1.2 bt.
Considering project life of 40 years, 30 Mtpa of coal could be
mined per annum for CTL.
Coal quality and resources in past bids attracted 28 prospective
bidders (DGH, GOI)
Project Size
(Output)
5.67 Mtpa or
120,000 bbl/day
Assuming 5.3 Mtpa coal produces 1 Mtpa of output (see Table
2)
1 Mtpa of output ~ 20353 bbl/day
Products breakup: 60% diesel, 30 % Methanol, 8% Methane
Rich Gas and 2% Bitumen (in line with SASOL product)
Project
investment
(Output)
US$ 7000.00
million
Considering US$ 1240 million for unit Mtpa
No investment in mining as the same is developed on contract
mining model where the capital investment, operation &
maintenace of mine is responsibility of contractor. In India,
this model is known as Mine Developer and Operator (MDO)
model.

17
Parameters Remarks/Value Rationale
Revenue per
annum
US$ 4571.82 Average price of all products is US$ 115.45/bbl (=60%*Price
of Diesel+30%*Price of Methanol+8%*Price of Methane Rich
gas+2%*Price of Bitumen).
Price of Diesel: US$ 142.99/bbl (Ministry of Petroleum &
Natural Gas (MOPNG) 2013; 2006-2013 average)
Price of Methanol: US$ 51.25/bbl (Methanex, 2013; 2006-
2013 average)
Price of Methane Rich gas: US$ 121.87/bbl (MOPNG, 2013;
2006-2013 average; price assumed to be price of LPG)
Price of Bitument: US$ 226.64/bbl (MOPNG, 2013; 2006-
2013 average)
Operating
Cost per
annum
US$ 1666.15
millions
Cost of Transformation = US$ 992.25 million, (5.67*175, 175
is transformation cost considering commercial model of
SASOL (see Table 2)
Cost of Coal: US$ 593.90 million, Present prices are around
US$ 19.80/ton (MCL, 2013 and RBI @ Exchange Rate 1
US$= INR62.40 ) for 4300 to 4600 kcal/kg grade.
Cost of Employee: US$ 80.00 million, Considering 5000
persons with average salary of INR 1 million2 (CIL, 2013)
each.
2 This is about 40% more than the average salary offered to a Coal India Limited (CIL) employee. This is calculated by dividing
annual average total cost (of CIL is last three financial years – 2011, 2012 and 2013) for salaries, wages & employee benefits with
total number of employees of CIL.
18
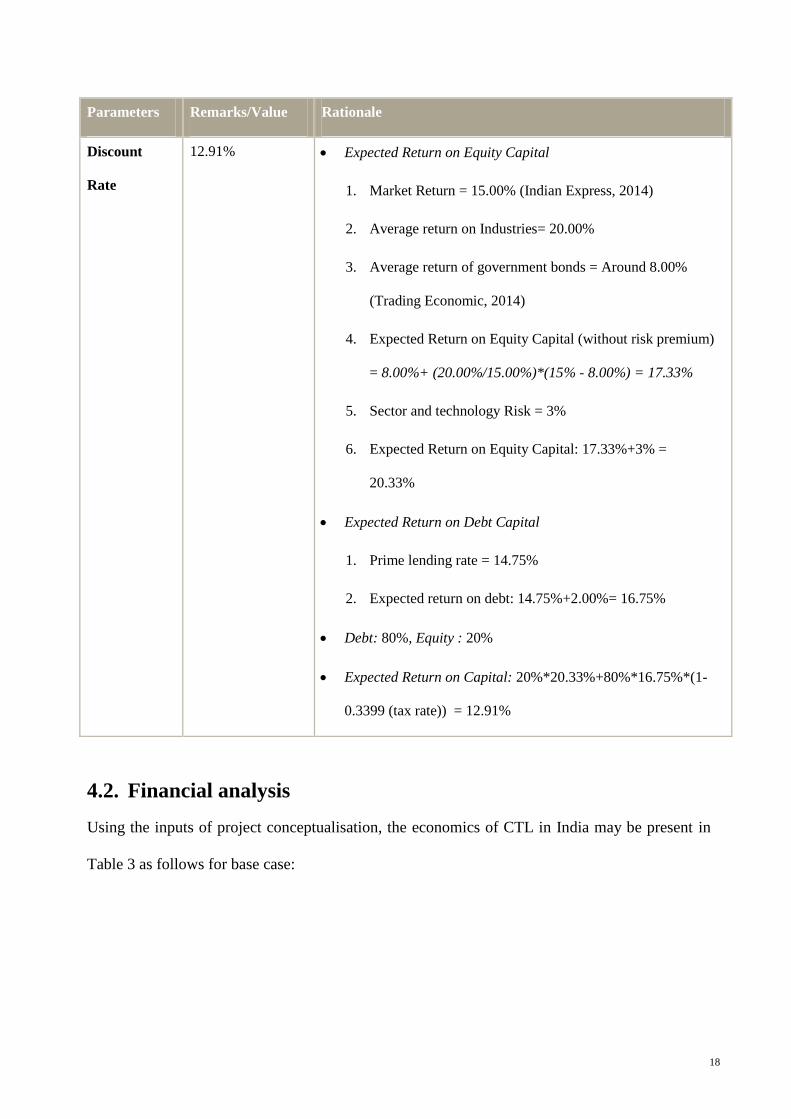
Parameters Remarks/Value Rationale
Discount
Rate
12.91% Expected Return on Equity Capital
1. Market Return = 15.00% (Indian Express, 2014)
2. Average return on Industries= 20.00%
3. Average return of government bonds = Around 8.00%
(Trading Economic, 2014)
4. Expected Return on Equity Capital (without risk premium)
= 8.00%+ (20.00%/15.00%)*(15% - 8.00%) = 17.33%
5. Sector and technology Risk = 3%
6. Expected Return on Equity Capital: 17.33%+3% =
20.33%
Expected Return on Debt Capital
1. Prime lending rate = 14.75%
2. Expected return on debt: 14.75%+2.00%= 16.75%
Debt: 80%, Equity : 20%
Expected Return on Capital: 20%*20.33%+80%*16.75%*(1-
0.3399 (tax rate)) = 12.91%
4.2. Financial analysis
Using the inputs of project conceptualisation, the economics of CTL in India may be present in
Table 3 as follows for base case:

19
Table 3: Base case financial analysis for CTL project in India
1. Break-even Crude Oil Price( BCOP): It is the price of crude oil above which the CTL
project is viable. It is given by following relation:
BCOP = Average cost of refined product – average refinery margin
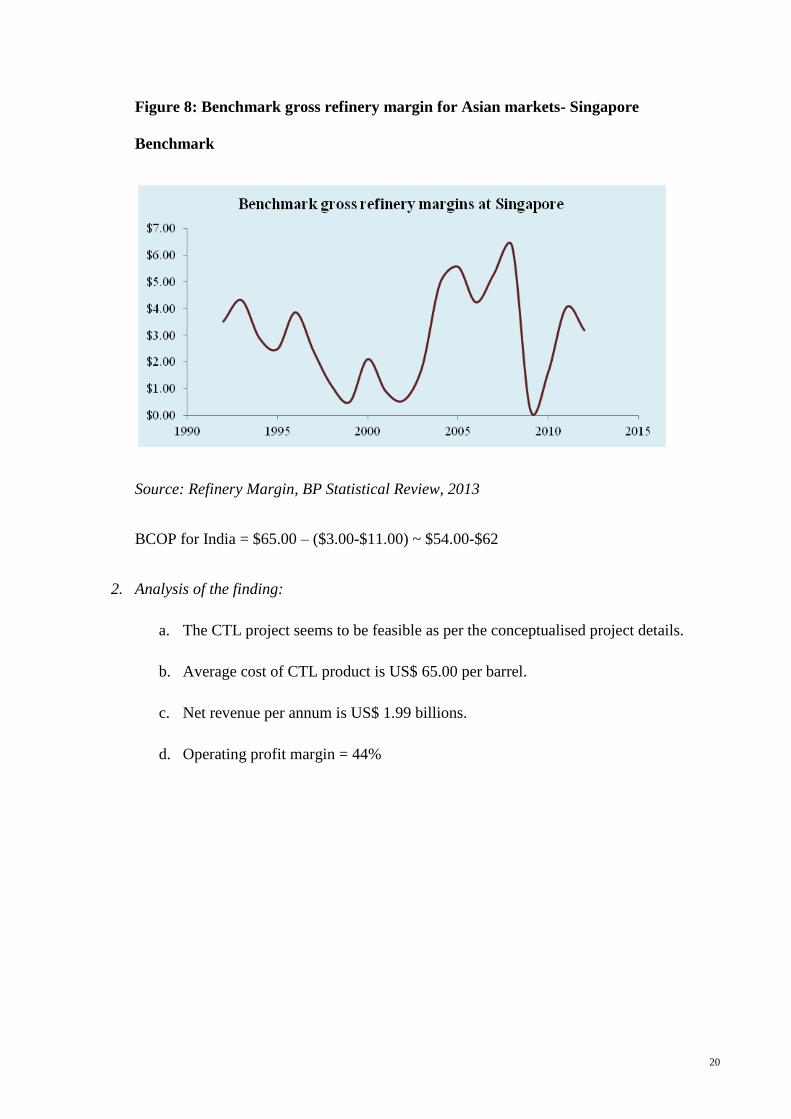
The average refinery margin for Asian market is captured at bechmark gross refinery
margin (GRM) in Singapore. The trend is shown in Figure 8. The average GRM is US$
3.00 per barrel since 1992. However, Indian refineries have displayed GRM of around
US$10-$11 per barrel as well (DNA, 2013).
Base Case Scenario
CTL plant technical details
Total product output (bbl/day) 120,000
CTL cost
Capital cost ($) $7,000,000,000
Interest rate 12.91%
Annual amortized capital cost ($) -$910,781,379
Annual operating cost ($) -$1,666,150,000
Average total cost ($/bbl) -$65.07
Cost at CTL plant mouth -$65
CTL Revenue
Price of product ($/bbl) 115.45
Total annual product outout (bbl) 39,600,000
Total annual average Revenue $4,571,820,000
CTL Net Revenue $1,994,888,621
20
Figure 8: Benchmark gross refinery margin for Asian markets- Singapore
Benchmark
Source: Refinery Margin, BP Statistical Review, 2013
BCOP for India = $65.00 – ($3.00-$11.00) ~ $54.00-$62
2. Analysis of the finding:
a. The CTL project seems to be feasible as per the conceptualised project details.
b. Average cost of CTL product is US$ 65.00 per barrel.
c. Net revenue per annum is US$ 1.99 billions.
d. Operating profit margin = 44%
21
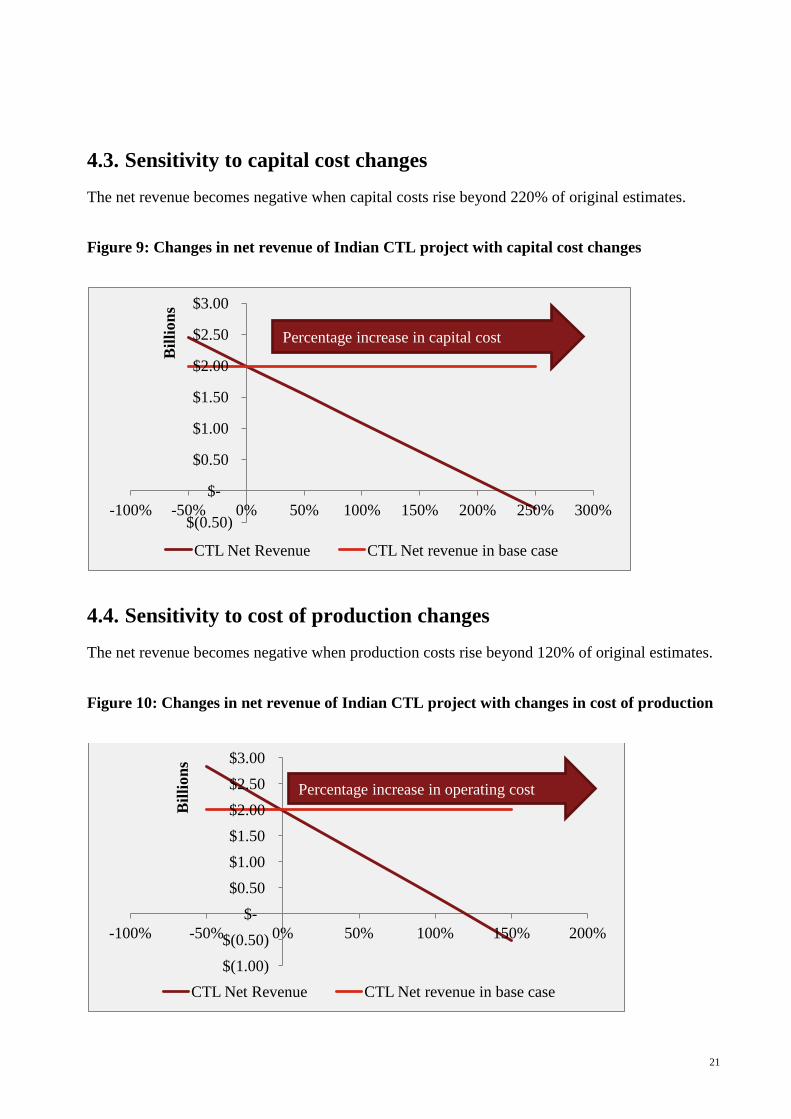
4.3. Sensitivity to capital cost changes
The net revenue becomes negative when capital costs rise beyond 220% of original estimates.
Figure 9: Changes in net revenue of Indian CTL project with capital cost changes
4.4. Sensitivity to cost of production changes
The net revenue becomes negative when production costs rise beyond 120% of original estimates.
Figure 10: Changes in net revenue of Indian CTL project with changes in cost of production
$(0.50)
$-
$0.50
$1.00
$1.50
$2.00
$2.50
$3.00
-100% -50% 0% 50% 100% 150% 200% 250% 300%
Bil
lion
s
CTL Net Revenue CTL Net revenue in base case
Percentage increase in capital cost
$(1.00)
$(0.50)
$-
$0.50
$1.00
$1.50
$2.00
$2.50
$3.00
-100% -50% 0% 50% 100% 150% 200%
Bil
lion
s
CTL Net Revenue CTL Net revenue in base case
Percentage increase in operating cost
22
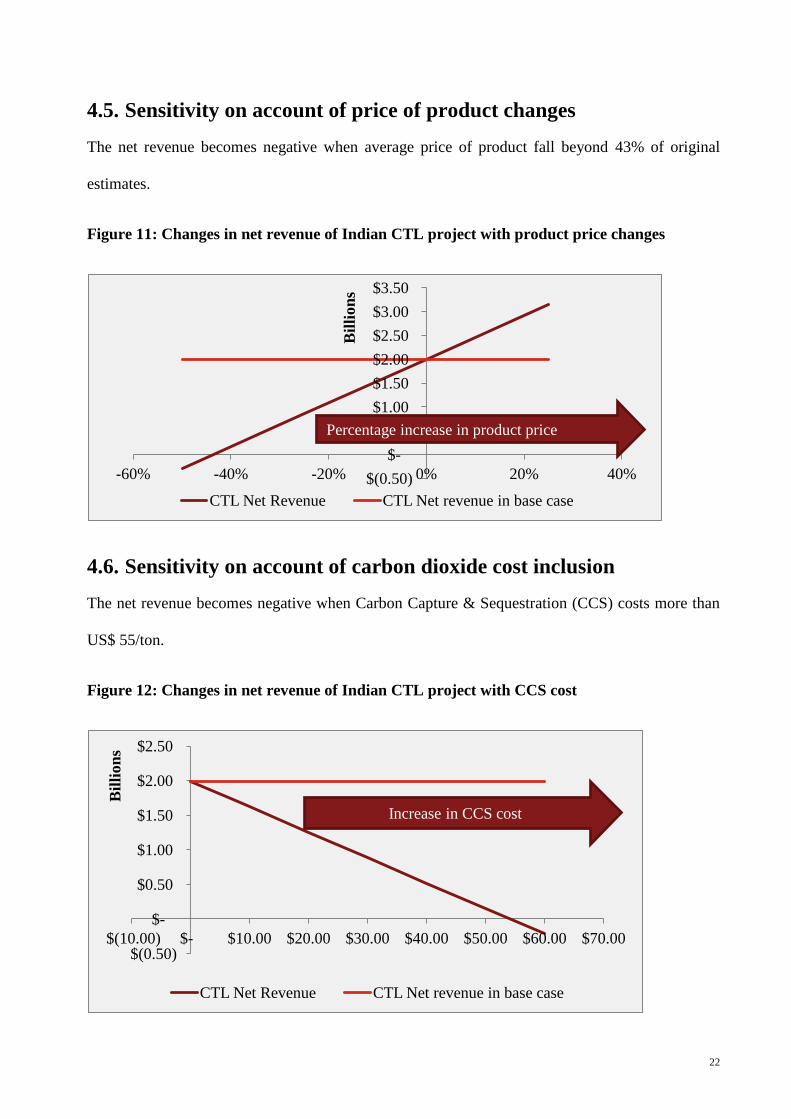
4.5. Sensitivity on account of price of product changes
The net revenue becomes negative when average price of product fall beyond 43% of original
estimates.
Figure 11: Changes in net revenue of Indian CTL project with product price changes
4.6. Sensitivity on account of carbon dioxide cost inclusion
The net revenue becomes negative when Carbon Capture & Sequestration (CCS) costs more than
US$ 55/ton.
Figure 12: Changes in net revenue of Indian CTL project with CCS cost
$(0.50)
$-
$0.50
$1.00
$1.50
$2.00
$2.50
$3.00
$3.50
-60% -40% -20% 0% 20% 40%
Bil
lion
s
CTL Net Revenue CTL Net revenue in base case
Percentage increase in product price
$(0.50)
$-
$0.50
$1.00
$1.50
$2.00
$2.50
$(10.00) $- $10.00 $20.00 $30.00 $40.00 $50.00 $60.00 $70.00
Bil
lion
s
CTL Net Revenue CTL Net revenue in base case
Increase in CCS cost
23
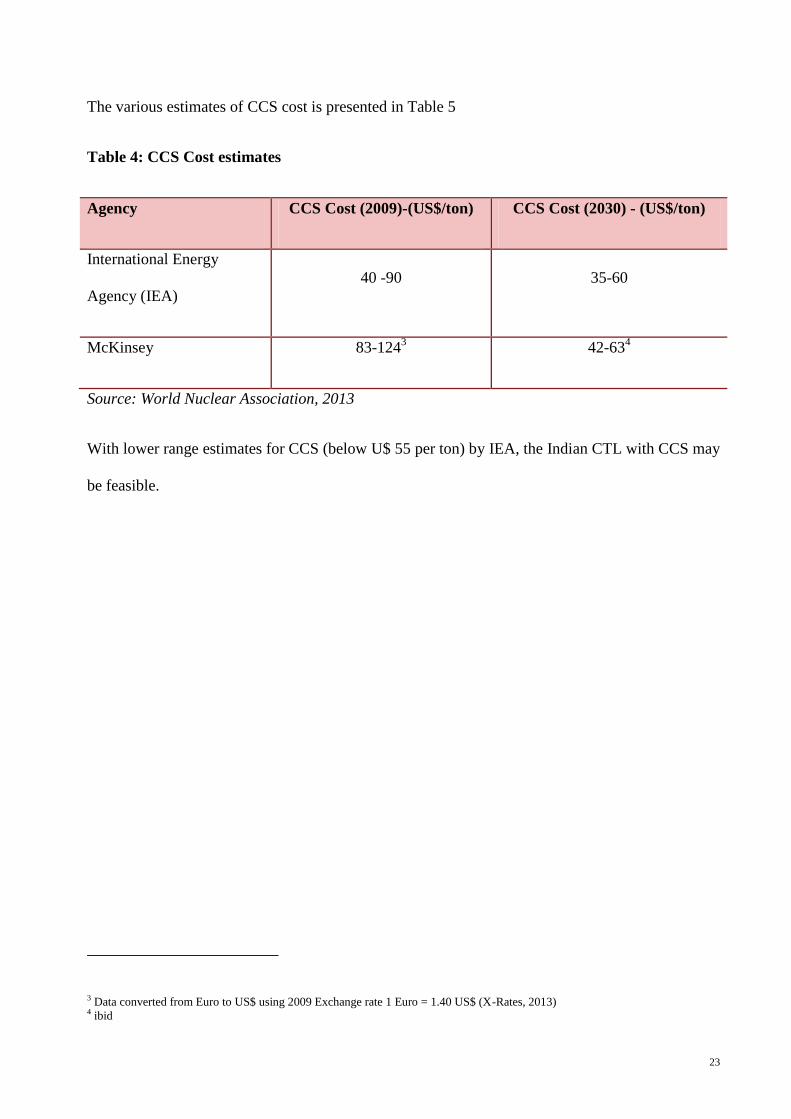
The various estimates of CCS cost is presented in Table 5
Table 4: CCS Cost estimates
Agency CCS Cost (2009)-(US$/ton) CCS Cost (2030) - (US$/ton)
International Energy
Agency (IEA)
40 -90 35-60
McKinsey 83-1243 42-63
4
Source: World Nuclear Association, 2013
With lower range estimates for CCS (below U$ 55 per ton) by IEA, the Indian CTL with CCS may
be feasible.
3 Data converted from Euro to US$ using 2009 Exchange rate 1 Euro = 1.40 US$ (X-Rates, 2013) 4 ibid
24
5. Conclusion
The financial viability of CTL project in India is dependent on many factors including the reserve
& grade of coal, global prices of crude oil, CCS and structure & method of financing. With present
regulatory regime for coal block allocation for CTL projects, projected global crude oil prices,
CTL projects with ICL technologies is financially viable in India. Further, when CCS is added at
later stages, the viability of project may be ensured by suitable floor pricing.

25
6. Bibliography
6.1. Primary Sources
Coal India Limited, 2013. Company-wise manpower for the month of november-2013:
Performance, [e-document], Available at: <https://www.coalindia.in/Performance.aspx?tab=0>
[Accessed on 04 January 2014]
Mahanadi Coalfields Limited, 2014: Price of different grade of non-coking coal, Available at:
< http://www.mcl.gov.in/Business/Files/Coal_price.pdf> [Accessed 04 January 2014]
Ministry of Coal, Government of India, Department of Coal: Acts & Notifications Government
of India, 2013. [online], Available at: < http://coal.nic.in/acts.htm> [Accessed 01 January
2014]
Ministry of Finance, Government of India, 2012. Budget 2012-2013 Speech of Pranab
Mukherjee, Minister of Finance March 16, 2012 [e-document], Available at:
http://indiabudget.nic.in/budget2012-2013/ub2012-13/bs/bs.pdf> [Accessed 01 January2014].
Planning Commission, Government of India, 2006. Integrated Energy Policy: Report of Expert
Committee, pp Overview -viii, Available at: <
http://planningcommission.gov.in/reports/genrep/rep_intengy.pdf> [Accessed 31 December
2013]
26
Reserve bank of India, 2012. Foreign Investment in India - Sector Specific conditions, Circular
No. 137 [e-document], Available at:
http://rbidocs.rbi.org.in/rdocs/notification/PDFs/CAPFISS280612.pdf> [Accessed 01
January2014].
Sasol Limited , 2013. Annual Integrated reports, Form 20-F and Analysts Handbook [e-
documents], Available at:
<http://www.sasol.co.za/investor-centre/publications/integrated-report-1>
<http://www.sasol.co.za/investor-centre/publications/archive/integrated-report>
<http://www.sasol.co.za/investor-centre/publications/form-20-f>
<http://www.sasol.co.za/investor-centre/publications/archive/form-20-f-1>
<http://www.sasol.co.za/investor-centre/publications/interim-financial-results-and-analyst-
book>
<http://www.sasol.co.za/investor-centre/publications/archive/interim-financial-results-and-
analyst-book>
[Accessed 01 January2014].
6.2. Secondary Source
6.2.1. Articles
Areppim, 2013, Current to Real Dollars Converter (using GDP deflator), Available at: <
http://stats.areppim.com/calc/calc_usdlrxdeflator.php> [Accessed 03 January 2014].
27
British Petroleum, 2013. Refinery Margin, Historical Data: Statistical Review of World Energy
2013: [online], Available at: < http://www.bp.com/en/global/corporate/about-bp/energy-
economics/statistical-review-of-world-energy-2013/review-by-energy-type/oil/refinery-
margins.html> [Accessed 06 January 2013].
Methanex, 2014: Methanol Price, [online] Available at: <
http://www.methanex.com/products/methanolprice.html> [Accessed 04 January 2014]
Ministry of Petroleum & Natural Gas, 2013, Indian Petroleum & Natural Gas Statistics: 2012-13,
[e-document] Available at: <http://petroleum.nic.in/pngstat.pdf> [Accessed 04 January 2014]
Coal India Limited, 2013. Annual Report 2013, [e-document], pp 26 Available at: <
http://www.coalindia.in/Documents/Coal_India_AR_Mail_2012_-_2013_06082013.pdf>
[Accessed on 04 January 2014]
X-RATES. Monthly Average, 2009 [online], Available at: < http://www.x-
rates.com/average/?from=EUR&to=USD&amount=1.00&year=2009> [Accessed on 04 January
2014]
DNA India, 2013. Refining margins may have just peaked out [online], Available at: <
http://www.dnaindia.com/money/report-refining-margins-may-have-just-peaked-out-1797943>
[Accessed 06 January 2013].
28
Press Information Bureau, Government of India, 2013, Seven coal blocks identified for
underground coal gasification [online] Available at : <
http://pib.nic.in/newsite/erelease.aspx?relid=101118> [ Accessed 1 January 2014].
Reserve Bank of India, 2014: Exchange Rates, [online] Available at: <
http://www.rbi.org.in/home.aspx#> [Accessed 04 January 2014]
Sinha G., Roy, A., 2009, Coal to Liquids: Clean Fuel Technology: Petroview, DGH, Government
of India, Volume 2, No. 1, [e-document], Available at: <
http://www.dghindia.org/pdf/AprilPDF09.pdf> [Accessed 03 January 2014]
The Indian Express, 2013: Sensex valuations mean long-term return expectation of 15%: PWC,
[online] Available at: < http://www.indianexpress.com/news/sensex-valuations-mean-longterm-
return-expectation-of-15--pwc/1102320/> [Accessed 04 January 2014]
Trading Economics, 2013: INDIA GOVERNMENT BOND 10Y, [online] Available at:
<http://www.tradingeconomics.com/india/government-bond-yield> [Accessed 04 January 2014]
World Nuclear Association, 2013. "Clean Coal" Technologies, Carbon Capture & Sequestration,
[online], Available at: < http://www.world-nuclear.org/info/Energy-and-Environment/-Clean-
Coal--Technologies/> [Accessed on 04 January 2014]
29
Wiliams, R. H., Larson., E.D., 2003. A comparison of direct and indirect liquefaction technologies
for making fluid fuels from coal, Energy for Sustainable Development, Volume VII No.,
Bangalore, India
6.2.2. Online Knowledge Repositories
British Petroleum, 2013. Historical data workbook: Statistical Review of World Energy 2013:
[online], Available at: < http://www.bp.com/en/global/corporate/about-bp/energy-
economics/statistical-review-of-world-energy-2013.html> [Accessed 31 December 2013].
U.S. Energy information Administration, 2013. Independent Statistics & Analysis [online],
Available at: < http://www.eia.gov/countries/> [Accessed 27 December 2013]. (hereinafter “EIA”)
World Bank, 2013, Inflation, GDP Deflator (annual %), [online], Available at:
http://data.worldbank.org/indicator/NY.GDP.DEFL.KD.ZG> [Accessed 03 January2014].

30
Appendix A. - 10 year financial performance of Sasol
This analysis is based on the Annual reports, Form 20-F and Analyst Books (Reports) for SASOL for a period of 2004 through 2013 (10 years). The data was
further improved for meaningful comparison using following steps:
Step 1: numbers were converted to US$ using the exchange rate mentioned in respective reports.
Step 2: to compare with current prices, data were adjusted to inflation. Inflation figures for South Africa were taken from world bank (GDP Deflator, World
Bank, 2013)
The following method was used for adjusting to inflation:
1. Multiplication factor M for year 2013 (M2013)was 1
2. Multiplying factor for M for any year ‘n’ (n being less than 2013) was obtained by using formula:
Mn = M(n+1)/(1-Inflation for year ‘n’)
3. Multiplying factor (Mn) was multiplied to financial data of year n.
4. Multiplying factor for different year are as follows:
2004 2005 2006 2007 2008 2009 2010 2011 2012 2013
1.89 1.77 1.67 1.56 1.44 1.32 1.21 1.13 1.06 1.00
Also average calculations were done as follows:
1. Weighted average WA = ∑(P*R)/ ∑P, where P is either year wise sales (for revenue) or year wise production (for cost) calculation;
2. Weighted average revenue (cost) for per unit of output = WA/(∑P/n), where ∑P/n is average annual sales or production of output as the case may be.

31
10 Years Performance of Sasol (prices are in US$)
2,004 2,005 2,006 2,007 2,008 2,009 2,010 2,011 2,012 2,013
Coal Sales to Secunda Plant (million tons) 40 39 40 40 40 39 39 38 38 40
Productions of CTLS from Secunda plant(million
tons)
8 8 8 7 7 7 7 7 7 7
Sales of CTL (million tons) 8 8 8 7 8 7 8 7 7 7
- - - - - - - - - -
10 9 9 9 8 7 6 6 6 5
Turnover (US$) 4,287 5,331 6,686 6,320 7,868 5,517 5,382 5,935 6,628 6,622
- - - - - - - - - -
Total operating costs (US$) 2,813 3,174 3,167 2,789 4,012 1,831 3,281 3,530 3,626 3,369
Cost of coal 1,106 1,261 1,204 1,124 1,292 1,072 1,105 1,227 1,284 1,256
Employee Cost 446 509 485 366 432 415 451 474 421 463
Cost of transformation 952 1,244 1,305 1,162 2,145 224 1,497 1,531 1,587 1,271
Depreciation & Ammortisation 309 160 172 137 143 119 229 299 335 379
- - - - - - - - - -
Operating profit (US$) 1,474 2,153 3,519 3,532 3,856 3,686 2,086 2,405 3,001 3,253
Addition to noncurrent asset (US$) 510 932 742 407 458 753 1,242 1,168 912 937
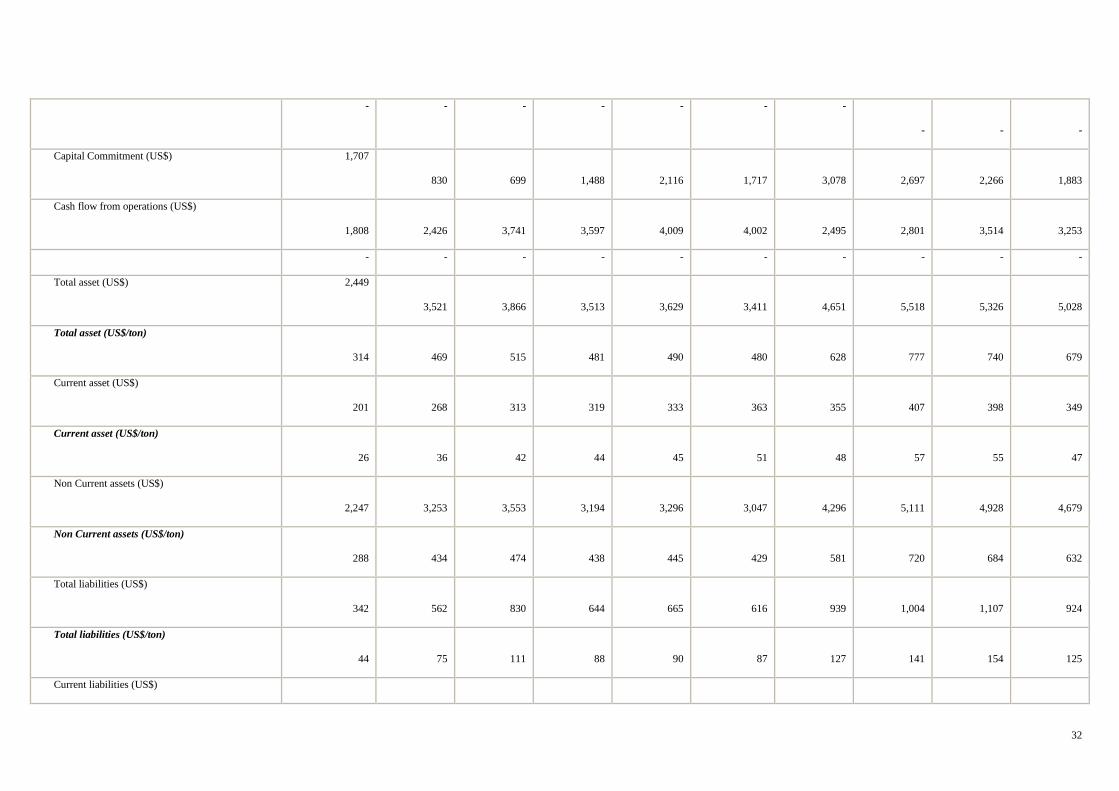
32
- - - - - - -
-
-
-
Capital Commitment (US$) 1,707
830
699
1,488
2,116
1,717
3,078
2,697
2,266
1,883
Cash flow from operations (US$)
1,808
2,426
3,741
3,597
4,009
4,002
2,495
2,801
3,514
3,253
- - - - - - - - - -
Total asset (US$) 2,449
3,521
3,866
3,513
3,629
3,411
4,651
5,518
5,326
5,028
Total asset (US$/ton)
314
469
515
481
490
480
628
777
740
679
Current asset (US$)
201
268
313
319
333
363
355
407
398
349
Current asset (US$/ton)
26
36
42
44
45
51
48
57
55
47
Non Current assets (US$)
2,247
3,253
3,553
3,194
3,296
3,047
4,296
5,111
4,928
4,679
Non Current assets (US$/ton)
288
434
474
438
445
429
581
720
684
632
Total liabilities (US$)
342
562
830
644
665
616
939
1,004
1,107
924
Total liabilities (US$/ton)
44
75
111
88
90
87
127
141
154
125
Current liabilities (US$)
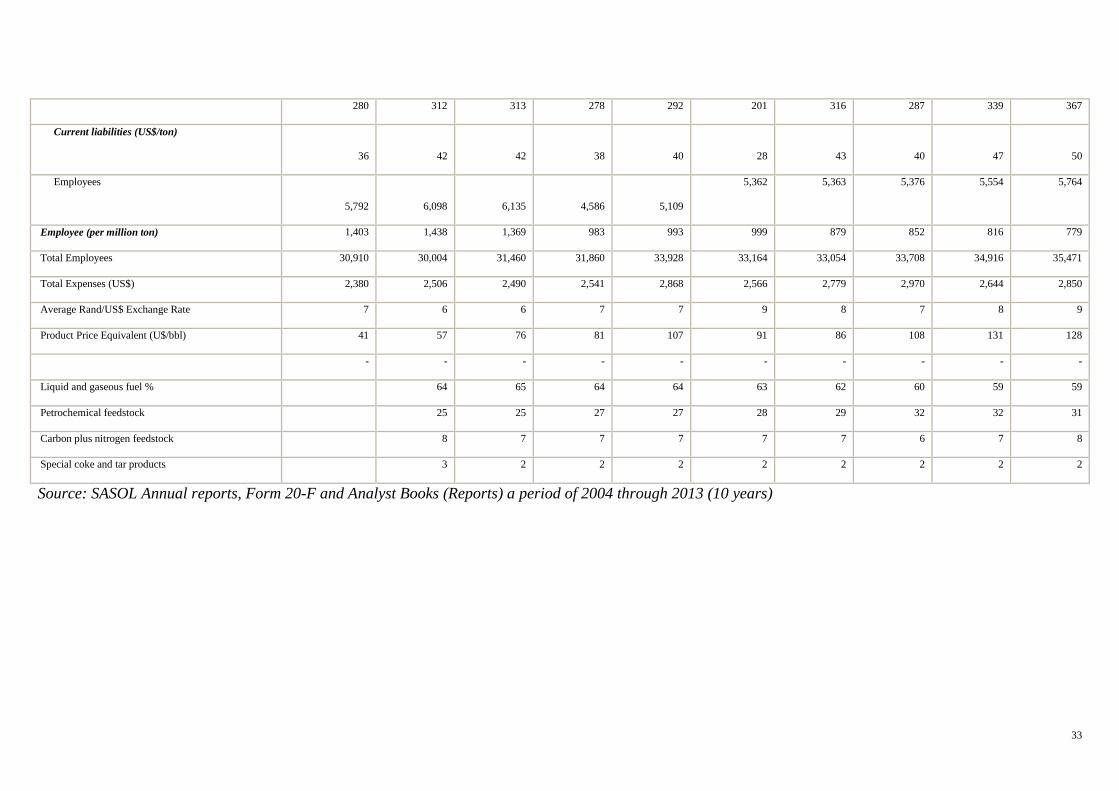
33
280 312 313 278 292 201 316 287 339 367
Current liabilities (US$/ton)
36
42
42
38
40
28
43
40
47
50
Employees
5,792
6,098
6,135
4,586
5,109
5,362 5,363 5,376 5,554 5,764
Employee (per million ton) 1,403 1,438 1,369 983 993 999 879 852 816 779
Total Employees 30,910 30,004 31,460 31,860 33,928 33,164 33,054 33,708 34,916 35,471
Total Expenses (US$) 2,380 2,506 2,490 2,541 2,868 2,566 2,779 2,970 2,644 2,850
Average Rand/US$ Exchange Rate 7 6 6 7 7 9 8 7 8 9
Product Price Equivalent (U$/bbl) 41 57 76 81 107 91 86 108 131 128
- - - - - - - - - -
Liquid and gaseous fuel % 64 65 64 64 63 62 60 59 59
Petrochemical feedstock 25 25 27 27 28 29 32 32 31
Carbon plus nitrogen feedstock 8 7 7 7 7 7 6 7 8
Special coke and tar products 3 2 2 2 2 2 2 2 2
Source: SASOL Annual reports, Form 20-F and Analyst Books (Reports) a period of 2004 through 2013 (10 years)