is there a bank lending channel in panel data
TRANSCRIPT
8/4/2019 Is There a Bank Lending Channel in Panel Data
http://slidepdf.com/reader/full/is-there-a-bank-lending-channel-in-panel-data 1/22
NOTES D’ÉTUDES
ET DE RECHERCHE
DIRECTION GÉNÉRALE DES ÉTUDES ET DES RELATIONS INTERNATIONALES
IS THERE A BANK LENDING CHANNEL IN
FRANCE ? EVIDENCE FROM BANK
PANEL DATA
Claire Loupias, Frédérique Savignac and Patrick Sevestre
November 2002
NER # 92
8/4/2019 Is There a Bank Lending Channel in Panel Data
http://slidepdf.com/reader/full/is-there-a-bank-lending-channel-in-panel-data 2/22
DIRECTION GÉNÉRALE DES ÉTUDES ET DES RELATIONSINTERNATIONALES
DIRECTION DES ÉTUDES ÉCONOMIQUES ET DE LA RECHERCHE
IS THERE A BANK LENDING CHANNEL IN
FRANCE ? EVIDENCE FROM BANK
PANEL DATA
Claire Loupias, Frédérique Savignac and Patrick Sevestre
November 2002
NER # 92
Les Notes d'Études et de Recherche reflètent les idées personnelles de leurs auteurs et n'expriment pasnécessairement la position de la Banque de France. Ce document est disponible sur le site internet de laBanque de France « www.banque-France.fr ».
The Working Paper Series reflect the opinions of the authors and do not necessarily express the views of
the Banque de France. This document is available on the Banque de France Website “www.banque-France.fr”.
8/4/2019 Is There a Bank Lending Channel in Panel Data
http://slidepdf.com/reader/full/is-there-a-bank-lending-channel-in-panel-data 3/22
1
Is there a bank lending channel in France? Evidence from bank
panel data.
Claire Loupias1, Frédérique Savignac1 and Patrick Sevestre2.3
Ce travail a été réalisé dans le cadre d’un réseau de recherche organisé par la Banque CentraleEuropéenne avec l’ensemble des Banques Centrales Nationales de la zone euro. Ce réseau intitulé« Monetary Transmission Network » a fonctionné du mois de juin 1999 au mois de décembre 2001,date à laquelle s’est tenue la conférence de clôture. Ces travaux seront publiés dans un ouvrage collectif à paraître chez Cambridge University Press.
This work is part of the production of a network including the European Central Bank and CentralNational Banks about “Monetary Transmission”. This network has been active between June 1999 andDecember 2001, when a final conference was held in Frankfurt. All the papers are to be published in acollective volume forthcoming at Cambridge University Press.
1 Research Center, Banque de France2 Erudite, Université Paris XII- Val de Marne and Research Center, Banque de France.3 The views expressed in this paper do not necessarily reflect those of the Banque de France. We wish to thank A. Duchateauand S. Matherat, for having allowed us the access to the individual bank data from the « Commission Bancaire », as well as I.Odonnat (formerly head of the “Service des Analyses et des Statistiques Monétaires”) for his help in this respect. Thanks also
to the « Service des Synthèses Conjoncturelles » for data from « the cost of credit survey » and to L. Baudry and S. Tarrieu fortheir wonderful research assistance. This paper also owes a lot to comments and suggestions made by A. Kashyap, J. Dermine,S. Avouyi-Dovi and to informal discussions with M. Ehrmann, L. Gambacorta, J. Martinez-Pages, A. Worms, C. Cortet, B.Longet and J.L. Cayssials. We also thank P. Blanchard for the SAS-IML program used to estimate the model.
8/4/2019 Is There a Bank Lending Channel in Panel Data
http://slidepdf.com/reader/full/is-there-a-bank-lending-channel-in-panel-data 4/22
2
Résumé :Le but de ce papier est d’étudier l’existence d’un canal du crédit en France. On estime pour cela laforme réduite d’un modèle dynamique qui autorise des asymétries dans la réaction de l’offre de créditsdes banques à un changement des taux de la politique monétaire, asymétries liées à leur taille, leurliquidité et leur capitalisation. Les données utilisées concernent 312 banques françaises observéestrimestriellement sur la période 1993-2000.On obtient des asymétries entre les banques liquides et illiquides, ces dernières étant plus réactives à lapolitique monétaire. Ce résultat est conforme à celui obtenu pour plusieurs autres pays de la zone euro.Cela constitue une indication du fait que, dans la mesure où elles le peuvent, les banques françaises
vendent une partie de leurs actifs liquides pour protéger leur portefeuille de crédits des effets d’unehausse des taux d’intérêt.Contrairement aux résultats établis pour les Etats-Unis (voir par exemple, Kashyap et Stein (1995,2000) et Kishan et Opiela (2000)), les deux autres caractéristiques considérées (la taille et lacapitalisation) ne semblent pas avoir d’influence sur l’offre de crédit des banques.
Mots clés : Politique monétaire, Canal du crédit
Abstract:The aim of this paper is to check the possible existence of a bank lending channel in France. For thatpurpose, we have estimated a dynamic reduced form model allowing for asymmetries in loan supplyacross banks, depending on their size, liquidity and capitalization. We have used a panel of 312 Frenchbanks observed quarterly over the period 1993-2000.We find some asymmetry between liquid and illiquid banks, the latter being more sensitive to amonetary policy tightening. This result is in accordance with that obtained for several other countries of the Euro area. It constitutes an indication that, as far as they can, French banks sell part of their liquidassets in order to shield their loan portfolio from the effects of increases in the interest rate.Contrary to what has been found for the US (e.g., see Kashyap and Stein (1995, 2000) and Kishan andOpiela (2000)), we do not find the two other banks’ characteristics we consider (size and capitalization)to have any significant impact on bank lending.
Key words: monetary policy, credit channel
JEL classification numbers: E51, E52, G21
8/4/2019 Is There a Bank Lending Channel in Panel Data
http://slidepdf.com/reader/full/is-there-a-bank-lending-channel-in-panel-data 5/22
3
1. Introduction
The French monetary and financial markets have been largely restructured in the 80’s, to allow in
particular a better access of economic agents to market finance. However, bank lending still remains a
major source of finance for French firms and households. Then, a bank lending channel is worth
considering. Indeed, the population of monetary and financial institutions (MFIs) is, in France as in
many other countries, quite heterogeneous. Strong discrepancies can be observed across banks (e.g. in
terms of legal structure, size and structure of their balance sheet) and information asymmetries between
banks and their funds providers cannot be ruled out.
Unfortunately, previous work, based either on macro VAR models or on microeconometric estimates, isnot very conclusive. In particular, Favero et al. (2001), in their comparative multinational study based
on bank balance sheets from the BankScope database, do not find strong evidence of a bank lending
channel in France. At the opposite, Martin and Rosenwald (1996) and Rosenwald (1998), using
information about the rates at which banks issue CDs, find some differences across banks and thus,
cannot reject the existence of a lending channel. However, the latter find it to be of a rather small
magnitude.
The present paper fits, partly, in this literature. Its aim is to add a piece at the available evidence bylooking at the way, depending on the banks’ characteristics, the outstanding amount of bank loans
responds to policy shocks. Using a panel of more than 300 banks observed over the years 1993-2000,
we estimate a dynamic reduced form model close to that proposed in Kashyap and Stein (1995, 2000).
This model, fully described in another chapter of this book (see Ehrmann et al. (this volume)), allows
asymmetries in loan supply across banks, depending on their size, liquidity and capitalization. In
addition to the results provided in Ehrmann et al., we provide robustness checks related to different
liquidity measures, as liquidity appears to be a key variable in our results.
The structure of the paper is as follows: Section 2 proposes a brief description of the French population
of banks. Section 3 is devoted to the presentation of some data and econometric issues. In section 4, the
existence of a bank lending channel is discussed. Section 5 concludes.
2. French banks: a brief presentation
At the end of 1998, there were 1191 Credit Institutions (CIs) having an activity in France, among which
369 “commercial banks”, 120 “mutual and cooperative banks” (which in fact belong to four large
networks), 31 “savings and provident institutions”, 22 municipal credit banks and 649 financial

8/4/2019 Is There a Bank Lending Channel in Panel Data
http://slidepdf.com/reader/full/is-there-a-bank-lending-channel-in-panel-data 6/22
4
companies (see Loupias et al. (2001) for a description of those different groups of CIs).4
This figure has
to be compared with the 1630 CIs that existed in March 1993. Indeed, stemming from the banking
system law of 1984, the suppression of the State direct control over credit volumes (1985), the creation
of a true capital market (including commercial paper) in 1986, and the end of the currency exchange
controls (1990), the rationalization of the structure of the French banking industry and the more intense
competition that followed have resulted in a steady decline in the number of credit institutions over the
last decade (see Commission Bancaire (2000)). In particular, these reforms have improved the access of
economic agents to capital markets and induced an increase in the availability of market finance which,
in turn, have increased competition between banks. However, this better access to market finance has
been essentially significant for large firms. The financing of small businesses and households still
mainly rests on bank lending (e.g. see Kremp and Sevestre (2000)).
“Commercial banks” clearly play a prominent role in the French banking system as their market share
was, in 1998, around 50% both in terms of bank lending and deposits5. The cooperative and savings
banks come in second position. However, while those banks collect almost all the remainder of deposits
(their market share is 42%), their position is less strong on the loan market as they granted about 28%
of loans in 1998.6
Due to the particular importance of size as an indicator for information asymmetries between banks
and their funds providers, it is worth comparing the characteristics of small and large banks (see table 1
below).
4 The Caisse des Dépôts et Consignations is not included in this population.5 Except where indicated, all subsequent figures in this section refer to the situation at the end of 1998.6 For a more detailed description of the population of French banks, see Loupias et al. (2001).
8/4/2019 Is There a Bank Lending Channel in Panel Data
http://slidepdf.com/reader/full/is-there-a-bank-lending-channel-in-panel-data 7/22
5
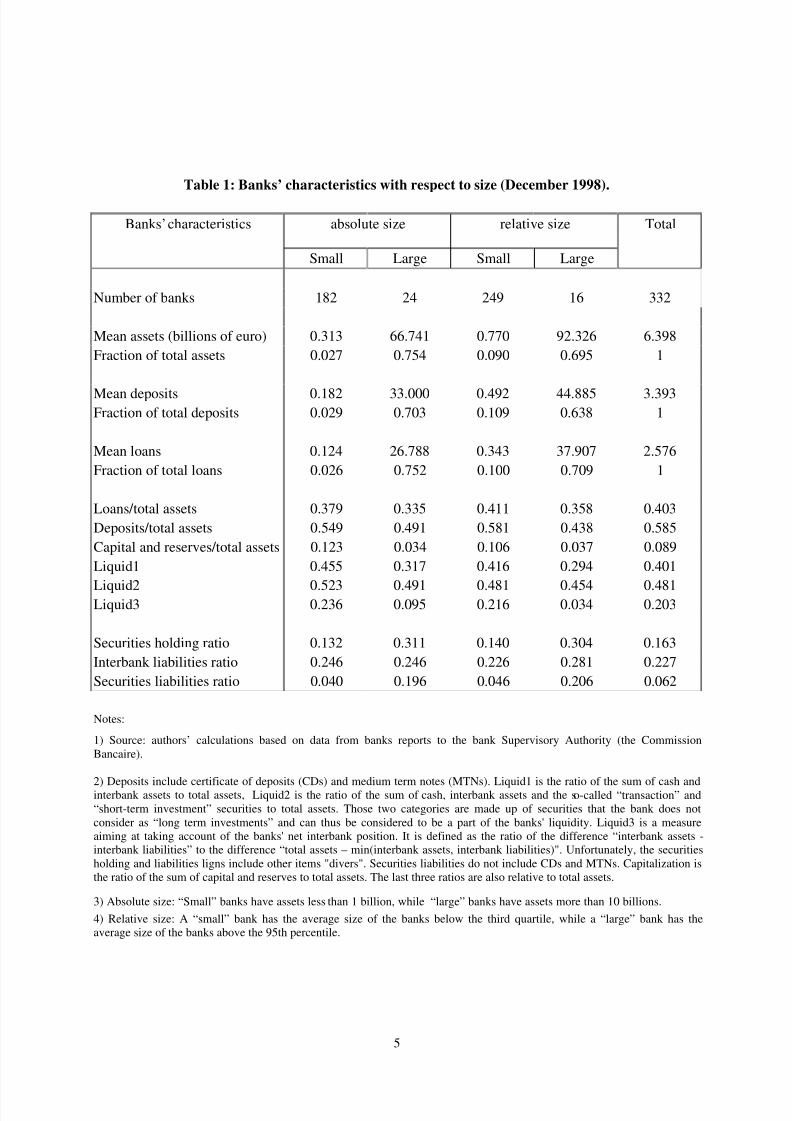
Table 1: Banks’ characteristics with respect to size (December 1998).
Banks’ characteristics absolute size relative size Total
Small Large Small Large
Number of banks 182 24 249 16 332
Mean assets (billions of euro) 0.313 66.741 0.770 92.326 6.398
Fraction of total assets 0.027 0.754 0.090 0.695 1
Mean deposits 0.182 33.000 0.492 44.885 3.393Fraction of total deposits 0.029 0.703 0.109 0.638 1
Mean loans 0.124 26.788 0.343 37.907 2.576
Fraction of total loans 0.026 0.752 0.100 0.709 1
Loans/total assets 0.379 0.335 0.411 0.358 0.403
Deposits/total assets 0.549 0.491 0.581 0.438 0.585
Capital and reserves/total assets 0.123 0.034 0.106 0.037 0.089
Liquid1 0.455 0.317 0.416 0.294 0.401
Liquid2 0.523 0.491 0.481 0.454 0.481Liquid3 0.236 0.095 0.216 0.034 0.203
Securities holding ratio 0.132 0.311 0.140 0.304 0.163
Interbank liabilities ratio 0.246 0.246 0.226 0.281 0.227
Securities liabilities ratio 0.040 0.196 0.046 0.206 0.062
Notes:
1) Source: authors’ calculations based on data from banks reports to the bank Supervisory Authority (the Commission
Bancaire).
2) Deposits include certificate of deposits (CDs) and medium term notes (MTNs). Liquid1 is the ratio of the sum of cash andinterbank assets to total assets, Liquid2 is the ratio of the sum of cash, interbank assets and the so-called “transaction” and“short-term investment” securities to total assets. Those two categories are made up of securities that the bank does notconsider as “long term investments” and can thus be considered to be a part of the banks' liquidity. Liquid3 is a measureaiming at taking account of the banks' net interbank position. It is defined as the ratio of the difference “interbank assets -interbank liabilities” to the difference “total assets – min(interbank assets, interbank liabilities)". Unfortunately, the securitiesholding and liabilities ligns include other items "divers". Securities liabilities do not include CDs and MTNs. Capitalization isthe ratio of the sum of capital and reserves to total assets. The last three ratios are also relative to total assets.
3) Absolute size: “Small” banks have assets less than 1 billion, while “large” banks have assets more than 10 billions.
4) Relative size: A “small” bank has the average size of the banks below the third quartile, while a “large” bank has theaverage size of the banks above the 95th percentile.
8/4/2019 Is There a Bank Lending Channel in Panel Data
http://slidepdf.com/reader/full/is-there-a-bank-lending-channel-in-panel-data 8/22
6
It must be mentioned that, for the sake of comparability with other countries, institutions with deposits
representing less than 10% of their total assets have been discarded from our sample. Financial
companies have been thus excluded from the sample as well as some other financial institutions which
had almost no deposits despite their legal classification as banks (among which numerous foreign
banks’ affiliates). Moreover, because of their particular nature, municipal credit banks have been also
discarded and regional banks of three of the four mutual or cooperative bank networks have been
replaced by their corresponding global entities. This has left us with 332 banks before the necessary
trimming of the sample (see section 3.1 below).
The share of credit in small banks’ balance sheets (38 %) is higher than that for large banks (34 %).
Small banks' balance sheets include a lot more liquidity (in the stricter sense, i.e. Liquid1) than the ones
of large banks. The share of cash and interbank operations in total assets is indeed of 45 % (resp. 32 %)for small (resp. for large) banks while at the opposite the share of securities is 13 % (resp. 31 %). Thus,
small banks are more liquid than large banks. This could help small banks to shield their loan portfolio
by making it easier for them to get funds by selling some of their liquid assets after a monetary policy
tightening. On the liabilities side, small banks have slightly more deposits than large banks do. The
share of deposits in total assets is respectively 55 % for small banks against 49 % for large banks. The
share of interbank liabilities in total assets equals 25 % for both small and large banks, but the share of
security liabilities is only 4 % for small banks, against 20 % for large banks. These figures might
indicate that small banks face stronger asymmetric information problems and have more difficulties for
issuing bonds than large banks do. Then, smaller banks would be more affected by a monetary policy
tightening than large banks. However, if one looks at capitalization, one may notice that small banks are
a lot more capitalized than large banks. The capitalization ratio is indeed of 12.3 % for small banks
while it is only of 3.4 % for large banks. This might counterbalance the previous asymmetric
information effect.
3. Data and econometric issues
3.1 Data issues
As stated above, we have had to discard some groups of CIs from our sample in order to ensure the
comparability of our results with those for other countries. This has left us with a sample of 332 banks.
However, as is often the case with individual data, this sample contained some outliers that could have
led us to get unsound econometric estimates. Those outliers have then been discarded from the sample
in the following way. For quarterly growth rates of total assets, loans and deposits, all observations
below the 2nd and above the 98th percentiles have been treated as outliers. For the first difference in the
capitalization and liquidity ratios, the thresholds have been set to the 1st and 99th percentiles. In
8/4/2019 Is There a Bank Lending Channel in Panel Data
http://slidepdf.com/reader/full/is-there-a-bank-lending-channel-in-panel-data 9/22
7
addition, a bank had to have at least 6 successive observations in levels, i.e. 5 in growth rates, in order
to be kept in the sample. We have then been left with an unbalanced panel comprising 312 banks over
the years 1993-2000 and 5327 observations.
3.2 Econometric issues
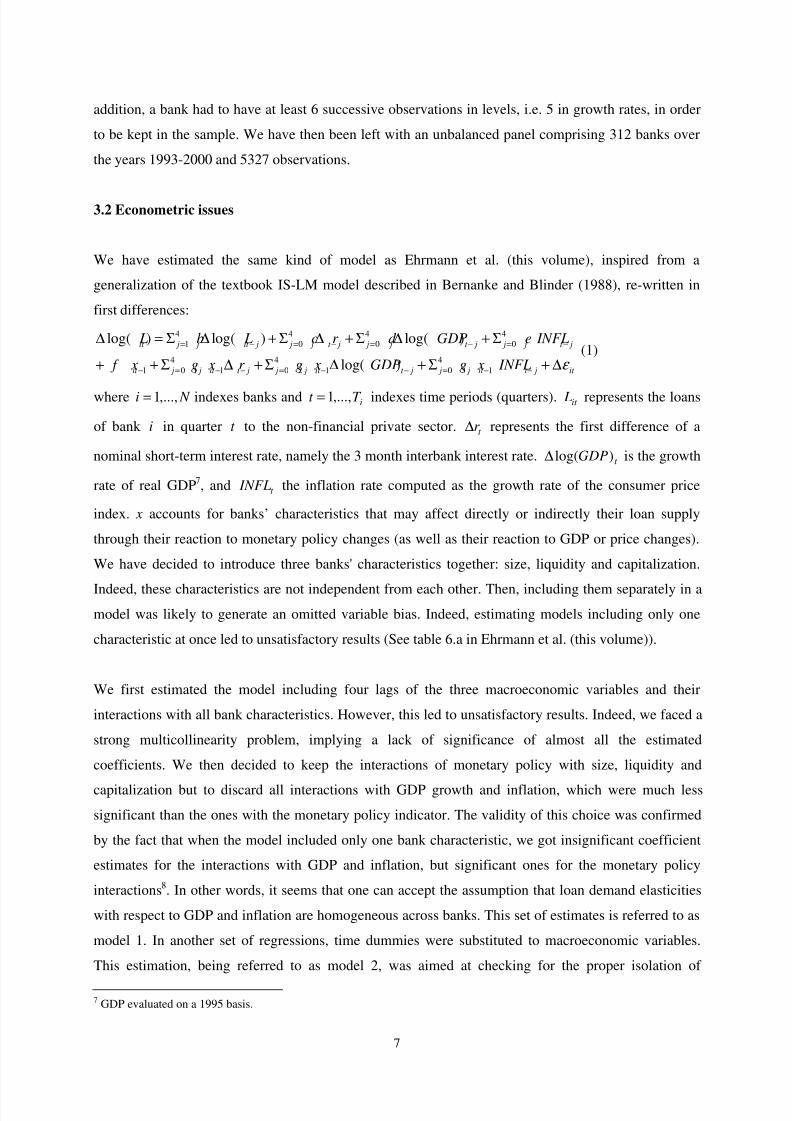
We have estimated the same kind of model as Ehrmann et al. (this volume), inspired from a
generalization of the textbook IS-LM model described in Bernanke and Blinder (1988), re-written in
first differences:
4 4 4 4
1 0 0 0
4 4 4
1 0 1 1 0 2 1 0 3 1
log( ) log( ) log( )
log( )
it j j it j j j t j j j t j j j t j
it j j it t j j j it t j j j it t j it
L b L c r d GDP e INFL
f x g x r g x GDP g x INFL ε
= − = − = − = −
− = − − = − − = − −
∆ = Σ ∆ + Σ ∆ + Σ ∆ + Σ
+ + Σ ∆ + Σ ∆ + Σ + ∆
(1)
where N i ,...,1= indexes banks and iT t ,...,1= indexes time periods (quarters). it L represents the loans
of bank i in quarter t to the non-financial private sector. t r ∆ represents the first difference of a
nominal short-term interest rate, namely the 3 month interbank interest rate. t GDP)log(∆ is the growth
rate of real GDP7, and t INFL the inflation rate computed as the growth rate of the consumer price
index. x accounts for banks’ characteristics that may affect directly or indirectly their loan supply
through their reaction to monetary policy changes (as well as their reaction to GDP or price changes).
We have decided to introduce three banks' characteristics together: size, liquidity and capitalization.
Indeed, these characteristics are not independent from each other. Then, including them separately in amodel was likely to generate an omitted variable bias. Indeed, estimating models including only one
characteristic at once led to unsatisfactory results (See table 6.a in Ehrmann et al. (this volume)).
We first estimated the model including four lags of the three macroeconomic variables and their
interactions with all bank characteristics. However, this led to unsatisfactory results. Indeed, we faced a
strong multicollinearity problem, implying a lack of significance of almost all the estimated
coefficients. We then decided to keep the interactions of monetary policy with size, liquidity and
capitalization but to discard all interactions with GDP growth and inflation, which were much less
significant than the ones with the monetary policy indicator. The validity of this choice was confirmed
by the fact that when the model included only one bank characteristic, we got insignificant coefficient
estimates for the interactions with GDP and inflation, but significant ones for the monetary policy
interactions8. In other words, it seems that one can accept the assumption that loan demand elasticities
with respect to GDP and inflation are homogeneous across banks. This set of estimates is referred to as
model 1. In another set of regressions, time dummies were substituted to macroeconomic variables.
This estimation, being referred to as model 2, was aimed at checking for the proper isolation of
7 GDP evaluated on a 1995 basis.
8/4/2019 Is There a Bank Lending Channel in Panel Data
http://slidepdf.com/reader/full/is-there-a-bank-lending-channel-in-panel-data 10/22
8
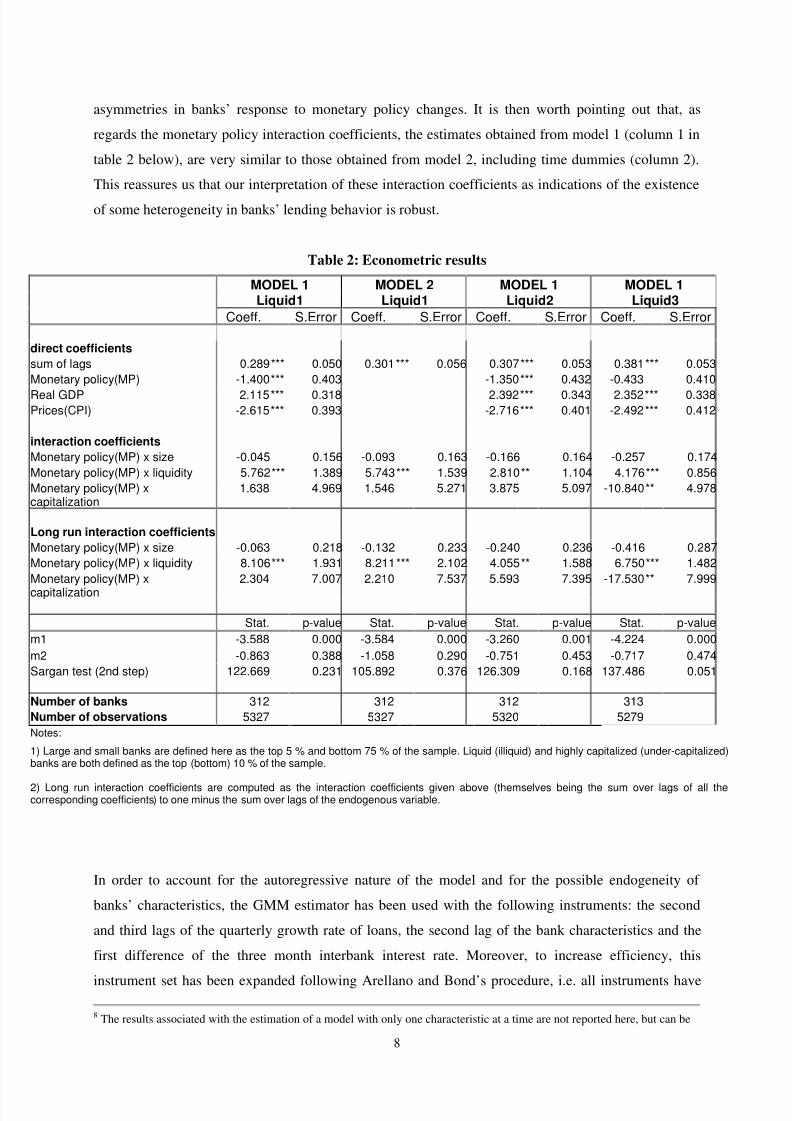
asymmetries in banks’ response to monetary policy changes. It is then worth pointing out that, as
regards the monetary policy interaction coefficients, the estimates obtained from model 1 (column 1 in
table 2 below), are very similar to those obtained from model 2, including time dummies (column 2).
This reassures us that our interpretation of these interaction coefficients as indications of the existence
of some heterogeneity in banks’ lending behavior is robust.
Table 2: Econometric results
MODEL 1 MODEL 2 MODEL 1 MODEL 1Liquid1 Liquid1 Liquid2 Liquid3
Coeff. S.Error Coeff. S.Error Coeff. S.Error Coeff. S.Error
direct coefficients
sum of lags 0.289*** 0.050 0.301*** 0.056 0.307*** 0.053 0.381*** 0.053
Monetary policy(MP) -1.400*** 0.403 -1.350*** 0.432 -0.433 0.410
Real GDP 2.115*** 0.318 2.392*** 0.343 2.352*** 0.338Prices(CPI) -2.615*** 0.393 -2.716*** 0.401 -2.492*** 0.412
interaction coefficients
Monetary policy(MP) x size -0.045 0.156 -0.093 0.163 -0.166 0.164 -0.257 0.174
Monetary policy(MP) x liquidity 5.762*** 1.389 5.743*** 1.539 2.810** 1.104 4.176*** 0.856
Monetary policy(MP) xcapitalization
1.638 4.969 1.546 5.271 3.875 5.097 -10.840** 4.978
Long run interaction coefficients
Monetary policy(MP) x size -0.063 0.218 -0.132 0.233 -0.240 0.236 -0.416 0.287
Monetary policy(MP) x liquidity 8.106*** 1.931 8.211*** 2.102 4.055** 1.588 6.750*** 1.482
Monetary policy(MP) x
capitalization
2.304 7.007 2.210 7.537 5.593 7.395 -17.530** 7.999
Stat. p-value Stat. p-value Stat. p-value Stat. p-value
m1 -3.588 0.000 -3.584 0.000 -3.260 0.001 -4.224 0.000
m2 -0.863 0.388 -1.058 0.290 -0.751 0.453 -0.717 0.474
Sargan test (2nd step) 122.669 0.231 105.892 0.376 126.309 0.168 137.486 0.051
Number of banks 312 312 312 313
Number of observations 5327 5327 5320 5279
Notes:
1) Large and small banks are defined here as the top 5 % and bottom 75 % of the sample. Liquid (illiquid) and highly capitalized (under-capitalized)banks are both defined as the top (bottom) 10 % of the sample.
2) Long run interaction coefficients are computed as the interaction coefficients given above (themselves being the sum over lags of all thecorresponding coefficients) to one minus the sum over lags of the endogenous variable.
In order to account for the autoregressive nature of the model and for the possible endogeneity of
banks’ characteristics, the GMM estimator has been used with the following instruments: the second
and third lags of the quarterly growth rate of loans, the second lag of the bank characteristics and the
first difference of the three month interbank interest rate. Moreover, to increase efficiency, this
instrument set has been expanded following Arellano and Bond’s procedure, i.e. all instruments have 8 The results associated with the estimation of a model with only one characteristic at a time are not reported here, but can be
8/4/2019 Is There a Bank Lending Channel in Panel Data
http://slidepdf.com/reader/full/is-there-a-bank-lending-channel-in-panel-data 11/22
9
been multiplied by time dummies. According to the Sargan test statistics we get, the instruments used
are valid. Then, one cannot reject the assumption that the three month interbank interest rate is
exogenous. Moreover, this statistic together with the p-values of the m1 (disturbance serial correlation
of order 1) and m2 (disturbance serial correlation of order 2) statistics confirm our interpretation of the
model as the first difference of a “theoretical” specification in log levels. Indeed, the disturbances
appear to be MA(1), and thus to be uncorrelated with bank specific variables dated t-2 or less and with
lags 2 and 3 of the endogenous variable.
The results presented in table 2 are the GMM second step estimates. However, first step estimates with
robust standard errors do not significantly differ from those. Moreover, robustness checks have been
done as regards seasonality. Neither the inclusion of seasonal dummies nor the inclusion of the fourth
lag of the growth rate of loans in the instrument set indicated any significant seasonality, besides thatimplicitly taken into account by the macro variables. Other robustness checks, specific to the particular
treatment we applied to mutual and cooperative bank networks, did not indicate any quantitatively
significant impact.9
4. Is there a bank lending channel?
In our model, the existence of a bank lending channel can be assessed through the sign and significance
of the interaction coefficients measuring the differential impact of monetary policy on bank lendingaccording to banks’ size, liquidity, and/or capitalization. If small/illiquid/under-capitalized banks faced
stronger difficulties in finding external finance, after a monetary policy tightening, they would reduce
their loans by more than large/liquid/highly capitalized ones. Given the negative impact of an interest
rate increase on bank lending, this should translate into a positive and significant estimate of the
interaction coefficients between monetary policy and banks’ characteristics.
4.1 The impact of liquidity
Contrary to Favero, Giavazzi, and Flabbi (2001), who carried out a multinational comparative study
using BankScope data, we find some evidence of a lending channel in France. Indeed, the existence of a
lending channel can be assessed since our econometric results show that more liquid banks do not
respond to a monetary policy tightening as strongly as less liquid banks do. Indeed, they use their
liquidity to compensate the effects of a monetary policy tightening: the interaction coefficient with
liquidity is positive and highly significant. Banks appear to draw on their short-term interbank assets to
dampen the consequences of an interest rate increase on their loan supply.
found in Ehrmann et al. (this volume).9 For more details, see Loupias et al. (2001).
8/4/2019 Is There a Bank Lending Channel in Panel Data
http://slidepdf.com/reader/full/is-there-a-bank-lending-channel-in-panel-data 12/22
10
As liquidity appears to be important, robustness checks have been done by considering three alternative
measures of the liquidity. Liquid1 is a very simple measure of liquidity as it takes into account only
cash and interbank assets on a gross basis. It is the one used in Ehrmann et al. (this volume) and is our
benchmark. The second measure of liquidity (Liquid2) is almost as simple but it includes, on top of
cash and interbank assets, transaction securities and short-term investment securities. These securities
are supposed to be easily marketable, and thus relatively liquid. The third measure of liquidity
(Liquid3) aims at taking account of the banks’ net interbank position. It is defined as the ratio of the
difference “interbank assets-interbank liabilities” to the difference “total assets-min(interbank assets,
interbank liabilities)”. The purpose of this measure is to get rid of the interbank activity of a bank in
order to measure its “truly disposable” liquidity. Indeed, one can imagine situations in which banks
with a high level of interbank liquid assets cannot necessarily shield their loan portfolio from amonetary policy tightening by selling those assets. Banks with large commitments on the interbank
market may have to use their interbank assets to fulfill their obligations. This phenomenon seems to be
important for mutual and cooperative banks, due to their particular management of liquidity (see
Worms (this volume) for a comparable observation for Germany).
The third column of table 2 presents a regression with the second measure of liquidity. The results are
qualitatively not quite different from the ones with a more restricted definition of liquidity.
Nevertheless, although still significantly positive, the magnitude of the monetary policy-liquidityinteraction coefficient appears to be about one half of that with the first definition of the liquidity ratio.
This is an indication that the impact of a restrictive monetary policy on the banks’ securities portfolio is
less important than that on their interbank assets. This result is consistent with Baumel and Sevestre
(2000) who found that, in order to finance more loans, banks use only marginally the possibility they
have to sell the long term securities they own. It is also in line with the results of Worms (this volume)
for German banks. The third definition of the liquidity ratio, aimed at taking account of the net liquidity
position of banks, also leads to qualitatively similar results (column 4). In other words, even taking
account of their possibly particular management of liquidity, one cannot dismiss the conclusion thatbanks insulate their loan portfolio from a monetary policy tightening by first selling part of their most
liquid assets portfolio.
4.2 The impact of size
Contrary to the results obtained by Kashyap and Stein (1995, 2000) for the US, size does not appear to
have any impact on the way banks respond to an increase in the monetary policy interest rate. This
result is similar to the one obtained for several other European countries (see Ehrmann et al. (this
volume)). One possible explanation rests in the fact that, as previously shown, small banks are
8/4/2019 Is There a Bank Lending Channel in Panel Data
http://slidepdf.com/reader/full/is-there-a-bank-lending-channel-in-panel-data 13/22
11
significantly more liquid and capitalized than large ones.10
This might counter-balance the effect of
size, as far as size is taken as an indicator for information problems faced by banks when they look for
external finance to compensate the decrease in deposits they may experience after a monetary policy
tightening. A second explanation might come from the fact that small banks are often owned by larger
ones. Thus, their size does not necessarily reflect their ability to raise funds nor their potential solvency
problems. Another possible explanation comes from the identification problem we might have. Indeed,
the interaction coefficients we get account for differences in the loan supply behavior of banks as long
as one assumes that all banks face the same demand function as regards the interest rate elasticity.
However, Baumel and Sevestre (2000) have shown that the elasticity of demand addressed to large
banks is higher than that of the demand faced by small banks. Then, the interaction coefficient we get in
our reduced form model results from the composition of two different effects of interest rate variations,
which exhibit opposite magnitudes: for large banks (resp. small banks), the elasticity of supply may below (resp. high) while that of demand is large (resp. small). This might explain why we get a non
significant impact of size on bank lending.
4.3 The impact of capitalization
The third bank characteristic we have considered, namely capitalization, does not seem to impact
significantly on bank lending behavior, everything else being equal. This result cannot be explained by
a lack of precision due to the correlations between size, liquidity and capitalization. If this were thecase, one would obtain significant coefficients when only one interaction is included in the model (see
table 6.a in Ehrmann et al. (this volume)). Again, most banks with a low capitalization ratio are large
banks, which may explain why this characteristic does not appear to impact on banks’ loan supply.
However, it might be the case that capitalization matters for small banks only. In that case, one would
expect to get a significant positive coefficient when introducing the double interaction size-
capitalization in the model. This is not what we have found when we have estimated a model with a
double interaction size-capitalization with monetary policy, as we got an insignificant coefficient for
this double interaction. Finally, the absence of influence of the capitalization ratio might also stem fromthe drawback of our accounting capitalization measure. Indeed, this ratio is quite different from the one
used in the prudential regulation.11
10 Those differences exist in the US, too. However, they are of a much smaller magnitude.11The so-called Basle capitalization requirement (e.g. see Gambacorta (this volume) or Ehrmann et al. (this volume)).

8/4/2019 Is There a Bank Lending Channel in Panel Data
http://slidepdf.com/reader/full/is-there-a-bank-lending-channel-in-panel-data 14/22
12
5. Conclusion
The aim of this paper was to check the possible existence of a bank lending channel in France. For that
purpose, we have estimated a dynamic reduced form model allowing for asymmetries in loan supply
across banks, depending on their size, liquidity and capitalization. We have used a panel of 312 French
banks observed quarterly over the period 1993-2000.
We find some asymmetry between liquid and illiquid banks, the latter being more sensitive to a
monetary policy tightening. This result is in accordance with that obtained for several other countries of
the Euro area (see Ehrmann et al. (this volume)). It constitutes an indication that, as far as they can,
French banks sell part of their liquid assets in order to shield their loan portfolio from the effects of
increases in the interest rate.
Contrary to what has been found for the US (e.g., see Kashyap and Stein (1995, 2000) and Kishan and
Opiela (2000)), we do not find the two other banks’ characteristics we consider (size and capitalization)
to have any significant impact on bank lending.
Nevertheless, some more work needs to be done to get a better assessment of the influence of monetary
policy decisions on bank lending. First, it would be probably more satisfactory to get an evaluation of
the impact of those decisions on new loans granted by banks rather than on their outstanding amount.Indeed, banks cannot easily adjust their loan portfolio downwards, at least for long-term loans which
represent a significant proportion of bank lending. Second, one should also have a look at the impact of
monetary policy on the interest rate charged by banks to their customers.
8/4/2019 Is There a Bank Lending Channel in Panel Data
http://slidepdf.com/reader/full/is-there-a-bank-lending-channel-in-panel-data 15/22
13
References
Arellano, M; Bond, S., (1991), ’’Some tests of specification for panel data: Monte Carlo evidence and an
application to employment equations’’, Review of Economic Studies 58, 277-297.
Baumel, Laurent; Sevestre Patrick (2000), ''La relation entre le taux des crédits et le coût des ressources
bancaires Modélisation et estimation sur données individuelles de banques'', Annales d'Economie et de
Statistique'', N°59, pp 199-226.
Bernanke, Ben S; Blinder Alan S (1988), ''Is it Money or Credit, or Both, or Neither?'', American
Economic Review, May, 78(2), pp. 435-439.
Bernanke, Ben S; Gertler Mark (1995), ''Inside the Black Box: The Credit Channel of Monetary Policy
Transmission''. Journal of Economic Perspectives, Fall, 9(4), pp. 27-48.
Commission Bancaire (2000), “Annual report 1999”, Secrétariat Général de la Commission Bancaire.
Ehrmann, Michael; Gambacorta, Leonardo; Martinez-Pages, Jorge; Sevestre, Patrick; Worms Andreas
(2001), ''Financial systems and the role of banks in monetary policy transmission in the euro area'', NER
N°93, Banque de France.
Favero, Carlo A; Giavazzi, Francesco; Flabbi, Luca (2001), ''The Transmission Mechanism of
Monetary Policy in Europe: Evidence from Banks’ Balance Sheets''. CEPR discussion paper, N°2303.
Gambacorta, Leonardo (2001), ''Bank-specific characteristics and monetary policy transmission : the
case of Italy'', ECB working paper N° 103.
Kashyap, Anil K; Stein, Jeremy C. (1995), ''The Impact of Monetary Policy on Bank Balance Sheets''.Carnegie-Rochester Conference Series on Public Policy, June, 42, pp. 151-95.
Kashyap, Anil K; Stein, Jeremy C. (2000), ''What Do a Million Observations on Banks Say About the
Transmission of Monetary Policy?''. American Economic Review, June, 90(3), pp. 407-428.
Kishan, Ruby P. and Opiela, Timothy P. (2000), ''Bank Size, Bank Capital and the Bank lending
Channel''. Journal of Money, Credit, and Banking, February, 32(1), pp. 121-141.
Kremp Elizabeth, Sevestre Patrick (2000), “L’appartenance à un groupe facilite le financement des
entreprises”, Economie et Statistique, N° 336, pp. 79-92.
8/4/2019 Is There a Bank Lending Channel in Panel Data
http://slidepdf.com/reader/full/is-there-a-bank-lending-channel-in-panel-data 16/22
14
Loupias, Claire, Savignac Frédérique and Sevestre, Patrick (2001), “Monetary policy and bank lending
in France: Are there asymmetries?”, ECB working paper N° 101.
Martin C. and Rosenwald, Fabienne (1996), « Le marché des certificats de dépôts, écarts de taux à
l’émission : influence de la relation émetteurs-souscripteurs initiaux », NER N° 37, Banque de France.
Rosenwald F. (1998), ''L'influence des montants émis sur le taux des certificats de dépôts'', Annales
d'Economie et de Statistique, n°52, pp.53-76.
Worms, Andreas. (2001), ''The reaction of bank lending to monetary policy measures in Germany'',
ECB working paper N° 96.

8/4/2019 Is There a Bank Lending Channel in Panel Data
http://slidepdf.com/reader/full/is-there-a-bank-lending-channel-in-panel-data 17/22
Notes d'Études et de Recherche
1. C. Huang and H. Pagès, “Optimal Consumption and Portfolio Policies with an InfiniteHorizon: Existence and Convergence,” May 1990.
2. C. Bordes, « Variabilité de la vitesse et volatilité de la croissance monétaire : le casfrançais », février 1989.
3. C. Bordes, M. Driscoll and A. Sauviat, “Interpreting the Money-Output Correlation:Money-Real or Real-Real?,” May 1989.
4. C. Bordes, D. Goyeau et A. Sauviat, « Taux d'intérêt, marge et rentabilité bancaires : le casdes pays de l'OCDE », mai 1989.
5. B. Bensaid, S. Federbusch et R. Gary-Bobo, « Sur quelques propriétés stratégiques del’intéressement des salariés dans l'industrie », juin 1989.
6. O. De Bandt, « L'identification des chocs monétaires et financiers en France : une étudeempirique », juin 1990.
7. M. Boutillier et S. Dérangère, « Le taux de crédit accordé aux entreprises françaises : coûtsopératoires des banques et prime de risque de défaut », juin 1990.
8. M. Boutillier and B. Cabrillac, “Foreign Exchange Markets: Efficiency and Hierarchy,”October 1990.
9. O. De Bandt et P. Jacquinot, « Les choix de financement des entreprises en France : unemodélisation économétrique », octobre 1990 (English version also available on request).
10. B. Bensaid and R. Gary-Bobo, “On Renegotiation of Profit-Sharing Contracts in Industry,”July 1989 (English version of NER n° 5).
11. P. G. Garella and Y. Richelle, “Cartel Formation and the Selection of Firms,” December1990.
12. H. Pagès and H. He, “Consumption and Portfolio Decisions with Labor Income andBorrowing Constraints,” August 1990.
13. P. Sicsic, « Le franc Poincaré a-t-il été délibérément sous-évalué ? », octobre 1991.
14. B. Bensaid and R. Gary-Bobo, “On the Commitment Value of Contracts underRenegotiation Constraints,” January 1990 revised November 1990.
15. B. Bensaid, J.-P. Lesne, H. Pagès and J. Scheinkman, “Derivative Asset Pricing withTransaction Costs,” May 1991 revised November 1991.
16. C. Monticelli and M.-O. Strauss-Kahn, “European Integration and the Demand for BroadMoney,” December 1991.
17. J. Henry and M. Phelipot, “The High and Low-Risk Asset Demand of French Households:A Multivariate Analysis,” November 1991 revised June 1992.
18. B. Bensaid and P. Garella, “Financing Takeovers under Asymetric Information,” September1992.

8/4/2019 Is There a Bank Lending Channel in Panel Data
http://slidepdf.com/reader/full/is-there-a-bank-lending-channel-in-panel-data 18/22
19. A. de Palma and M. Uctum, “Financial Intermediation under Financial Integration andDeregulation,” September 1992.
20. A. de Palma, L. Leruth and P. Régibeau, “Partial Compatibility with Network Externalitiesand Double Purchase,” August 1992.
21. A. Frachot, D. Janci and V. Lacoste, “Factor Analysis of the Term Structure: a ProbabilisticApproach,” November 1992.
22. P. Sicsic et B. Villeneuve, « L'afflux d'or en France de 1928 à 1934 », janvier 1993.
23. M. Jeanblanc-Picqué and R. Avesani, “Impulse Control Method and Exchange Rate,”September 1993.
24. A. Frachot and J.-P. Lesne, “Expectations Hypothesis and Stochastic Volatilities,” July1993 revised September 1993.
25. B. Bensaid and A. de Palma, “Spatial Multiproduct Oligopoly,” February 1993 revised
October 1994.
26. A. de Palma and R. Gary-Bobo, “Credit Contraction in a Model of the Banking Industry,”October 1994.
27. P. Jacquinot et F. Mihoubi, « Dynamique et hétérogénéité de l'emploi en déséquilibre »,septembre 1995.
28. G. Salmat, « Le retournement conjoncturel de 1992 et 1993 en France : une modélisationVAR », octobre 1994.
29. J. Henry and J. Weidmann, “Asymmetry in the EMS Revisited: Evidence from the Causality
Analysis of Daily Eurorates,” February 1994 revised October 1994.
30. O. De Bandt, “Competition Among Financial Intermediaries and the Risk of ContagiousFailures,” September 1994 revised January 1995.
31. B. Bensaid et A. de Palma, « Politique monétaire et concurrence bancaire », janvier 1994révisé en septembre 1995.
32. F. Rosenwald, « Coût du crédit et montant des prêts : une interprétation en terme de canallarge du crédit », septembre 1995.
33. G. Cette et S. Mahfouz, « Le partage primaire du revenu : constat descriptif sur longuepériode », décembre 1995.
34. H. Pagès, “Is there a Premium for Currencies Correlated with Volatility? Some Evidencefrom Risk Reversals,” January 1996.
35. E. Jondeau and R. Ricart, “The Expectations Theory: Tests on French, German andAmerican Euro-rates,” June 1996.
36. B. Bensaid et O. De Bandt, « Les stratégies “stop-loss” : théorie et application au ContratNotionnel du Matif », juin 1996.
37. C. Martin et F. Rosenwald, « Le marché des certificats de dépôts. Écarts de taux àl'émission : l'influence de la relation émetteurs-souscripteurs initiaux », avril 1996.

8/4/2019 Is There a Bank Lending Channel in Panel Data
http://slidepdf.com/reader/full/is-there-a-bank-lending-channel-in-panel-data 19/22
38. Banque de France - CEPREMAP - Direction de la Prévision - Erasme - INSEE - OFCE,« Structures et propriétés de cinq modèles macroéconomiques français », juin 1996.
39. F. Rosenwald, « L'influence des montants émis sur le taux des certificats de dépôts »,octobre 1996.
40. L. Baumel, « Les crédits mis en place par les banques AFB de 1978 à 1992 : une évaluationdes montants et des durées initiales », novembre 1996.
41. G. Cette et E. Kremp, « Le passage à une assiette valeur ajoutée pour les cotisationssociales : Une caractérisation des entreprises non financières “gagnantes” et “perdantes” »,novembre 1996.
42. S. Avouyi-Dovi, E. Jondeau et C. Lai Tong, « Effets “volume”, volatilité et transmissionsinternationales sur les marchés boursiers dans le G5 », avril 1997.
43. E. Jondeau et R. Ricart, « Le contenu en information de la pente des taux : Application aucas des titres publics français », juin 1997.
44. B. Bensaid et M. Boutillier, « Le contrat notionnel : efficience et efficacité », juillet 1997.
45. E. Jondeau et R. Ricart, « La théorie des anticipations de la structure par terme : test à partirdes titres publics français », septembre 1997.
46. E. Jondeau, « Représentation VAR et test de la théorie des anticipations de la structure parterme », septembre 1997.
47. E. Jondeau et M. Rockinger, « Estimation et interprétation des densités neutres au risque :Une comparaison de méthodes », octobre 1997.
48. L. Baumel et P. Sevestre, « La relation entre le taux de crédits et le coût des ressourcesbancaires. Modélisation et estimation sur données individuelles de banques », octobre 1997.
49. P. Sevestre, “On the Use of Banks Balance Sheet Data in Loan Market Studies : A Note,”October 1997.
50. P.-C. Hautcoeur and P. Sicsic, “Threat of a Capital Levy, Expected Devaluation and InterestRates in France during the Interwar Period,” January 1998.
51. P. Jacquinot, « L’inflation sous-jacente à partir d’une approche structurelle des VAR : uneapplication à la France, à l’Allemagne et au Royaume-Uni », janvier 1998.
52. C. Bruneau et O. De Bandt, « La modélisation VAR structurel : application à la politiquemonétaire en France », janvier 1998.
53. C. Bruneau and E. Jondeau, “Long-Run Causality, with an Application to InternationalLinks between Long-Term Interest Rates,” June 1998.
54. S. Coutant, E. Jondeau and M. Rockinger, “Reading Interest Rate and Bond FuturesOptions’ Smiles: How PIBOR and Notional Operators Appreciated the 1997 French SnapElection,” June 1998.
55. E. Jondeau et F. Sédillot, « La prévision des taux longs français et allemands à partir d’un
modèle à anticipations rationnelles », juin 1998.

8/4/2019 Is There a Bank Lending Channel in Panel Data
http://slidepdf.com/reader/full/is-there-a-bank-lending-channel-in-panel-data 20/22
8/4/2019 Is There a Bank Lending Channel in Panel Data
http://slidepdf.com/reader/full/is-there-a-bank-lending-channel-in-panel-data 21/22
76. E. Jondeau and H. Le Bihan, “Evaluating Monetary Policy Rules in Estimated Forward-
Looking Models: A Comparison of US and German Monetary Policies,” October2000.
77. E. Jondeau and M. Rockinger, “Conditional Volatility, Skewness, ans Kurtosis: Existence
and Persistence,” November 2000.78. P. Jacquinot et F. Mihoubi, « Modèle à Anticipations Rationnelles de la COnjoncture
Simulée : MARCOS », novembre 2000.
79. M. Rockinger and E. Jondeau, “Entropy Densities: With an Application to AutoregressiveConditional Skewness and Kurtosis,” January 2001.
80. B. Amable and J.-B. Chatelain, “Can Financial Infrastructures Foster EconomicDevelopment? ,” January 2001.
81. J.-B. Chatelain and J.-C. Teurlai, “Pitfalls in Investment Euler Equations,” January 2001.
82. M. Rockinger and E. Jondeau, “Conditional Dependency of Financial Series: An Applicationof Copulas,” February 2001.
83. C. Florens, E. Jondeau and H. Le Bihan, “Assessing GMM Estimates of the Federal ReserveReaction Function,” March 2001.
84. J.-B. Chatelain, “Mark-up and Capital Structure of the Firm facing Uncertainty,” June 2001.
85. B Amable, J.-B. Chatelain and O. De Bandt, “Optimal capacity in the Banking Sector andEconomic Growth,” June 2001.
86. E. Jondeau and H. Le Bihan, “Testing for a Forward-Looking Phillips Curve.AdditionalEvidence from European and US Data,” December 2001.
87. G. Cette, J. Mairesse et Y. Kocoglu, « Croissance économique et diffusion des TIC : le casde la France sur longue période (1980-2000) », décembre 2001.
88. D. Irac and F. Sédillot, “Short Run Assessment of French Economic activity Using OPTIM,”January 2002.
89. M. Baghli, C. Bouthevillain, O. de Bandt, H. Fraisse, H. Le Bihan et Ph. Rousseaux, « PIBpotentiel et écart de PIB : quelques évaluations pour la France », juillet 2002.
90. E. Jondeau and M. Rockinger, “Asset Allocation in Transition Economies,” October 2002.
91. H. Pagès and J.A.C Santos, “Optimal Supervisory Policies and Depositor-PreferencesLaws,” October 2002.
92. C. Loupias, F. Savignac and P. Sevestre, “Is There a Bank Lending Channel in France ?Evidence from Bank Panel Data,” November 2002.

8/4/2019 Is There a Bank Lending Channel in Panel Data
http://slidepdf.com/reader/full/is-there-a-bank-lending-channel-in-panel-data 22/22