isothermal calorimetry for biological applications in food
TRANSCRIPT

LUND UNIVERSITY
PO Box 117221 00 Lund+46 46-222 00 00
Isothermal Calorimetry for Biological Applications in Food Science and Technology
Wadsö, Lars; Gomez, Federico
Published in:Food Control
DOI:10.1016/j.foodcont.2008.11.008
2009
Link to publication
Citation for published version (APA):Wadsö, L., & Gomez, F. (2009). Isothermal Calorimetry for Biological Applications in Food Science andTechnology. Food Control, 20(10), 956-961. https://doi.org/10.1016/j.foodcont.2008.11.008
Total number of authors:2
General rightsUnless other specific re-use rights are stated the following general rights apply:Copyright and moral rights for the publications made accessible in the public portal are retained by the authorsand/or other copyright owners and it is a condition of accessing publications that users recognise and abide by thelegal requirements associated with these rights. • Users may download and print one copy of any publication from the public portal for the purpose of private studyor research. • You may not further distribute the material or use it for any profit-making activity or commercial gain • You may freely distribute the URL identifying the publication in the public portal
Read more about Creative commons licenses: https://creativecommons.org/licenses/Take down policyIf you believe that this document breaches copyright please contact us providing details, and we will removeaccess to the work immediately and investigate your claim.
Download date: 30. Jan. 2022

Gomez and Wadsö: Isothermal calorimetry in Food Science and Technology 1/26
1
Isothermal Calorimetry for Biological Applications in
Food Science and Technology
Subtitle: Isothermal calorimetry – the measurement of the heat production rate of processes – is a
general measurement technique that has many uses in the food field. We here describe some
biological applications concerning tissue respiration, fermentation, and shelf-life.
Lars Wadsö
Federico Gómez Galindo
Affiliations and Adresses:
Author Wadsö, is senior researcher in the Lund Isothermal Calorimetry Group, Building Materials, Lund University, Box 118, 221 00 Lund, Sweden. Author Gómez Galindo is senior researcher at Food Engineering, Lund University, Box 124, 221 00 Lund, Sweden and IBB-Institute for Biotechnology and Bioengineering, Centro de Engenharia Biológica, Universidade do Minho, Campus de Gualtar, 4710-057 Braga, Portugal.
Send reprint requests to author Wadsö
Wadsö: phone : +46 46 2229592, fax : +46 46 2224427, E-mail : [email protected]
Gomez: phone: +46 46 2229814, fax: +46 46 2229846, E-mail: [email protected]

Gomez and Wadsö: Isothermal calorimetry in Food Science and Technology 2/26
2
1. Introduction
Isothermal calorimetry – the measurement of thermal power and heat at constant temperature – is
a general measurement technique as nearly all processes (physical, chemical, biological etc.)
produce heat. Such instruments are used in such diverse fields as in the pharmaceutical industry,
in cement science, and at defense laboratories. Also in the food science/technology laboratory
isothermal calorimetry is a valuable tool for the study of various phenomena, but the use in this
field has yet been rather limited. In this paper we discuss biological applications of isothermal
calorimetry in food science and technology.
Probably the first food-related calorimetric measurement was made by Dubrunfaut (Dubrunfaut
1856). Although he did not have access to a calorimeter of the type we use today, he studied the
energy and heat balance of a wine fermentation vat. Today, isothermal calorimetry is a fairly
commonly used instrument for studies of fundamental biology, see for example (Gustafsson
1991; Kemp 2000; Lamprecht 2003) and some food-related microbiological studies have also
been made together with a handful of studies of vegetable tissue respiration (references are given
later). Few studies have been made on physical processes in food systems.
Isothermal calorimetry has some interesting properties:
- It is a general and unspecific technique that can be used for many different tasks in a laboratory.
- During a calorimetric measurement the thermal power is continuously measured. One can thus
monitor processes while they take place.

Gomez and Wadsö: Isothermal calorimetry in Food Science and Technology 3/26
3
- It is a non-destructive technique and as heat flows through all materials one can monitor
processes taking place inside opaque materials and packages.
The main problem with isothermal calorimetry is related to its generality: it measures heat that
can come from a large number of different sources. Instruments and methods therefore have to be
designed so that only the heat from the process of interest is measured (Wadsö and Wadsö 2005).
Isothermal calorimetry is an interesting tool for looking at kinetics of all types of reactions and
processes. This use is based on that the thermal power P (W) measured is related to the rate ν
(g/s) of the process studied, and the produced heat Q (J) (the integrated thermal power) is related
to how far the process has proceeded, i.e., what mass m (g) of a sample (or of a part of a sample)
that has reacted (this can also be formulated in molar quantities). Both these relations involve the
enthalpy change Δh (J/g) as proportionality constant:
ν⋅Δ= hP (1)
)( 0 mmhQ −Δ= (2)
These two equations are the connections between a calorimetric measurement (P and Q) and the
corresponding kinetic rate law (ν and m). For processes in foodstuffs and other complex materials
enthalpy change and rates are not as easily defined as for simpler reactions, but measured thermal
powers (and heats) can still be used to model kinetics of, e.g., degradation processes (Hansen
2000).
Gomez and Wadsö: Isothermal calorimetry in Food Science and Technology 4/26
4
Both metabolism of microorganisms, tissue respiration and physical processes like crystallization
produces heat that in principle can be measured by isothermal calorimetry. If it is practically
measurable depends on the enthalpy and rate of the process, and the specific sensitivity and
sample volume in the calorimeter. Biological samples with aerobic respiration always produce
about 455 kJ per mol oxygen consumed (or carbon dioxide produced). The same is true for
chemical oxidation phenomena. Different types of anaerobic respiration produce much less heat.
Typically, much less than 200 kJ per mol carbon dioxide are produced under anoxic conditions.
For other types of reactions, enthalpy can vary substantially.
2 The calorimetric instrument
The most common technique to make isothermal calorimetry is the heat conduction calorimetry.
The heat produced in the sample is then conducted away from the sample through a heat flow
sensor. The thermal conductance of the heat flow sensor should be high enough so that the
temperature changes in the sample are negligible. In the applications described in this paper the
temperature of the sample changes less than 0.1 K from the thermostat temperature and the
measurements can therefore be considered to be essentially isothermal.
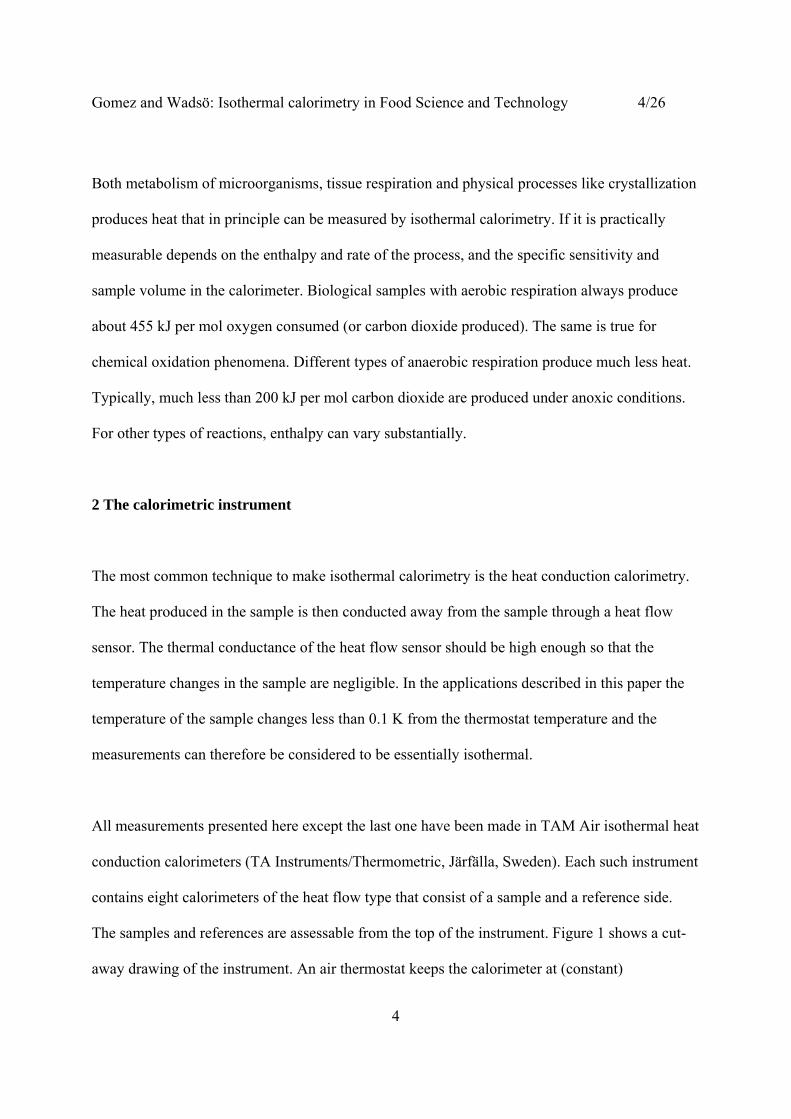
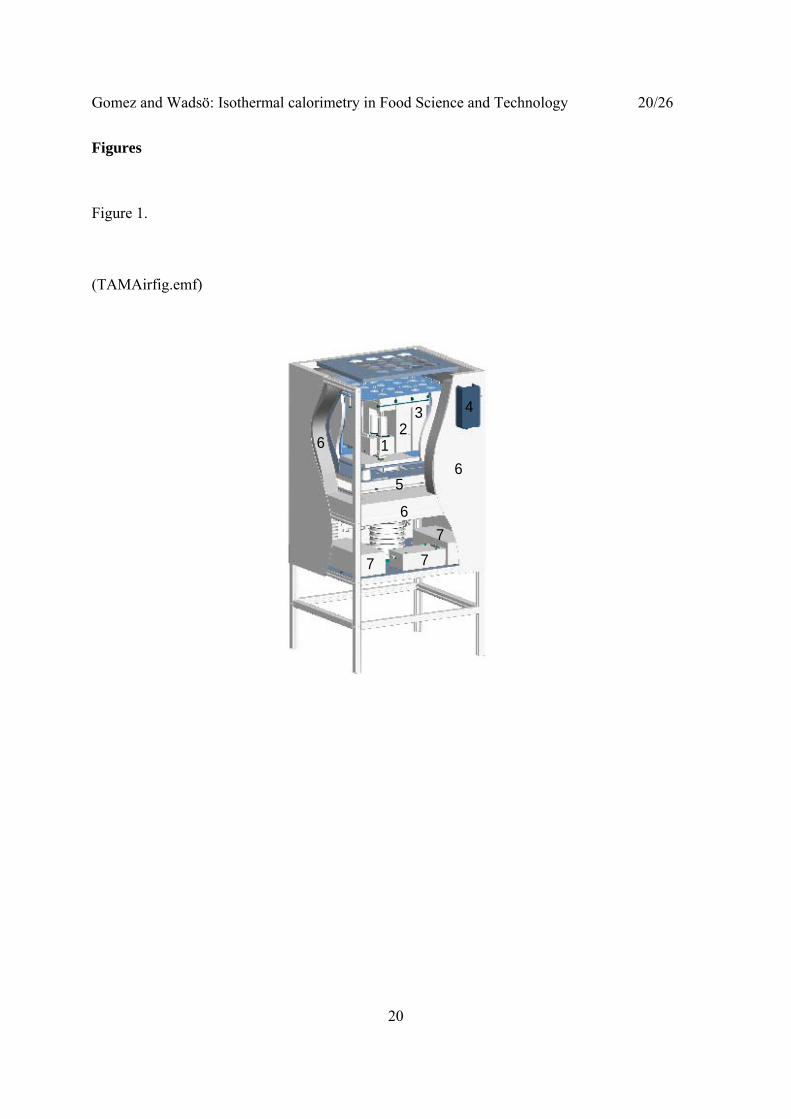
All measurements presented here except the last one have been made in TAM Air isothermal heat
conduction calorimeters (TA Instruments/Thermometric, Järfälla, Sweden). Each such instrument
contains eight calorimeters of the heat flow type that consist of a sample and a reference side.
The samples and references are assessable from the top of the instrument. Figure 1 shows a cut-
away drawing of the instrument. An air thermostat keeps the calorimeter at (constant)

Gomez and Wadsö: Isothermal calorimetry in Food Science and Technology 5/26
5
temperatures between 5 and 90°C by a Peltier heater/cooler. The temperature fluctuations of the
air thermostat are less than ±0.02 K over 24 h.
The samples are placed in 20 ml ampoules, most commonly made of glass or high density
polyethylene. The glass ampoules are closed with a Teflon coated septa and an aluminium crimp
cap. The plastic ampoules are closed with a screw cap. It is possible to combine isothermal
calorimetry with other techniques or to change the conditions of the sample during the
measurement. One can therefore design special vessels, e.g., with electrodes or other sensors or
with possibilities for, e.g., injection (Wadsö 2005).
All heat conduction calorimeters need to have a reference sample that should have the same heat
capacity as the sample, but not produce any heat. The measured signal is the difference between
the signals from the sample and the reference heat flow sensors. In this way the noise level is
decreased substantially as disturbances will influence the sample and the reference similarly.
The sample and reference ampoules are placed in ampoule holders. The heat flow sensors (solid-
state Peltier thermocouple plates) are positioned between the ampoule holders and the
surrounding heat sink. The calorimeters are normally operated in a ±60 mW range where the
resolution of the instrument is 1 μW and a typical baseline noise level is ±5 μW at 20°C. From
these figures one can see that one needs thermal powers in the order of 10 μW to differentiate
between thermal power and no thermal power, and higher than 100 μW to get a reliable figure of
the thermal power. There are several other calorimeters on the market; the more sensitive ones

Gomez and Wadsö: Isothermal calorimetry in Food Science and Technology 6/26
6
are often called microcalorimeters and can be used for measurements on small samples or
samples with low heat production rate.
It should be noted that isothermal (heat conduction) calorimetry discussed in this paper is a quite
different technique than other, possibly more commonly known, calorimetric techniques like
bomb calorimetry (used to determine enthalpies of combustion and calorific/fuel values),
differential scanning calorimetry (DSC, in which changes in heat are measured as the sample
temperature changes) and solution calorimetry (used to determine enthalpies of dissolution). Note
also that isothermal calorimeters commonly have 1000 times higher specific sensitivity (W/g
sample) than do DSC instruments run in isothermal mode, mainly because the DSC samples are
very much smaller (Hofelich and LaBarge 2002).
3. Applications examples
We have here collected six food-related biological applications of isothermal calorimetry that we
have worked with. When no references are given the measurements have been made specifically
for this paper.
Wound respiration
Fresh vegetables and fruits generally do aerobic cell respiration that produce about 455 kJ of heat
per mol oxygen consumed. Many types of tissue can also do unwanted anaerobic metabolism, at
least for short periods of time, with lower heat produced per carbon dioxide produced. Because of

Gomez and Wadsö: Isothermal calorimetry in Food Science and Technology 7/26
7
this, calorimetric measurements on tissue respiration can give similar information as respiration
measurements and already in 1912 Langworthy and Milner of the US Department of Agriculture
published a study on banana respiration (Langworthy and Milner 1912). We have used isothermal
calorimetry to investigate the effect of different unit operations on cut vegetables (Gomez,
Toledo, Wadsö, Gekas and Sjöholm 2004; Wadsö, Gomez, Sjöholm and Rocculi 2004; Gómez
Galindo, Roculli, Wadsö and Sjöholm 2005; Rocculi, Romani, Dalla Rosa, Gómez Galindo,
Sjöholm and Wadsö 2005; Gómez Galindo, Sjöholm, Wadsö, Rasmusson, Widell and Kaack
2006; Peredes Escobar, Gómez Galindo, Wadso, Ruales Nájera and Sjöholm 2007; Rocculi et al.
2007). Smith et al. (Smith et al. 2000) used a combination of calorimetry and respiration
measurements to study aging potato slices. Such techniques are further discussed by Hansen and
co-workers (Hansen et al. 1995; Hansen, Hopkin and Criddle 1997; Hansen, MacFarlane,
McKinnon, Smith and Criddle 2004).
It is well known that cutting through a vegetable causes cell damage (wounding) that sets of
several different protection and repair process in the non-wounded cells. Measured in a
calorimeter, samples with increased surface area produce more heat than less wounded tissue and
this increase is approximately proportional to the area of wounded tissue (Wadsö, Gomez,
Sjöholm and Rocculi 2004). One example of this is shown in Fig. 2. Excised cylinders (diameter
9.5 mm) of one carrot (Daucus carota L) were either used as whole cylinders or cut transversally
so that the different samples had different surface areas (wounding). They were then placed in
sealed glass ampoules and inserted into the calorimeter.
In the calorimetric result seen in Fig. 2a one can see that it takes about 40 minutes before the
signal is stable after the samples have been inserted. It is also seen that the signals are not

Gomez and Wadsö: Isothermal calorimetry in Food Science and Technology 8/26
8
constant, which is rather typical of calorimetric measurements on biological materials. This
shows that the wounding reactions are dynamic processes, but the result can also be influenced
by other factors, for example the change in gas composition in the closed vial. At the end of the
measurement the samples were taken out and baselines measured with inert vials.
The specific thermal powers measured after 240 min were plotted as a function of the specific
surface area to yield Fig. 2b. It is seen that there is a linear relationship that makes it possible to
separate the wound thermal power (the slope of the line) from the bulk thermal power (at zero
specific surface area). One can use this to investigate wound induced processes and how the rates
of these can be reduced, e.g., to prolong shelf life and decrease off-flavor. It should be noted that
different individual, e.g., carrots can have rather different specific thermal power, so it is
advisable in this type of studies to mainly compare results from measurements on tissue from
each individual separately.
Tissue wounding has typically been studied by measuring the concentrations of specific wound-
induced compounds (see for example (Reyes, Villareal and Cisneros-Zevallos 2007)). A non-
specific calorimetric measurement is an excellent complement to such techniques. In studies of
aerobic systems, calorimetry is similar to respirometry, but gives an output with higher resolution
as the heat production rate is measured, while respirometers measure gas concentration
(essentially the integral of the heat production rate).
Cell Death from Blanching

Gomez and Wadsö: Isothermal calorimetry in Food Science and Technology 9/26
9
We have used calorimetry to quantify cell damage that occurs during blanching. Increasing
intensity of the heat treatment progressively reduces the number of viable cells in a tissue sample
and results in a corresponding reduction in the rate of metabolic processes (Gómez Galindo,
Toledo and Sjöholm 2005). We have studied this by immersing carrot slices (thickness 7 mm,
diameter about 3 cm) in boiling water for different times and then rapidly cooling them in ice-
water to minimize over-processing. Similarly as in the previous example we chose a time at
which to determine thermal powers and have drawn these as a function of time in Fig. 3. As the
decrease in thermal power is caused by that increasing fractions of the samples are dead, these
calorimetric results can be combined with calculations of the increase in temperature in the
samples during blanching to find the temperature at which the cells are killed (Gomez, Toledo,
Wadsö, Gekas and Sjöholm 2004). This makes it possible to optimize blanching processes. A
factor that may complicate the analysis is that an un-blanched sample has wound respiration, so
these may not be suitable as no-treatment references for thermal calculations. The analysis can
still be made, but only with treated samples in which the surface has been heat treated to prevent
wound respiration.
The effect of blanching has for example been studied by texture measurements (see for example
(Sebok, Bontovics and Bleszkan 1999)) or with vital staining (see for example (Gomez, Toledo,
Wadsö, Gekas and Sjöholm 2004)). Calorimetry nicely complements these techniques as it
assesses a quite different aspect of the effect of blanching.
Milk Fermentation

Gomez and Wadsö: Isothermal calorimetry in Food Science and Technology 10/26
10
Fermentation of milk and other products such as beer, wine and pro-biotic foods can be
conveniently studied by calorimetry as the microbiological fermentation produces heat. One can
for example map the properties of microbial cultures, e.g., assess differences between different
cultures, measure their doubling time, look at the influence of additives etc.
We have here used pasteurized milk (3% fat) and two Swedish cultured buttermilk products as
start cultures: “filmjölk” and “A-fil”. The first is a culture of different strains of Lactococcus
lactis, while the second is a mixed culture of Lactobacillus acidophilus and Lactococcus lactis.
The samples were prepared by adding 0.25% starter culture to 20 ml milk in glass ampoules. The
samples were then mixed and placed in the calorimeter. Measurements were made at 20 and
23oC. The result is seen in Fig. 4. Integration of the measured heats (from 4 h to 40 h) gave about
7.2 J/g at 20oC and 6.6 J/g at 23oC, possibly indicating that the microorganisms metabolize more
substrate at the lower temperature. As the thermal powers measured are proportional to the rates
of the studied processes, it is possible to calculate how much the processes are accelerated by the
temperature increase, i.e., the Arrhenius activation energy or the Q10-value. From the present
measurements we found that both cultures had factors k in A⋅exp(kt) during the exponential
growth phases that were about 10% higher at 23oC than at 20oC.
It is seen in Fig. 4 the there is a delay before the main peak comes, possibly this marks the end of
an initial aerobic phase. As isothermal calorimetry gives a continuous output one can see details
like this that would be difficult to find with other techniques; however, other more specific
techniques often need to complement the unspecific calorimetry to elucidate the true nature of the
processes seen. One such technique – that is commonly used to follow milk fermentation – is to

Gomez and Wadsö: Isothermal calorimetry in Food Science and Technology 11/26
11
monitor the decrease of pH during the fermentation (see for example (Gernot, Goelling, Klimant,
Schneider and Heinzle 2003)). To follow both the heat production rate and the pH
simultaneously, a pH-sensor can be incorporated into a calorimetric ampoule ((Johansson and
Wadsö 1999)).
Microbiological spoilage prevention
The general goal of preventing microbial spoilage can be reached by many methods, e.g., natural
and synthetic chemical preservatives, and thermal treatments. Isothermal calorimetry can be used
to study the effect of such methods by studying samples treated with different methods or
measuring the thermal power of microorganisms before and after the application of a method. It
has been used for studying the effect of various inhibitors on microbial growth (Kawabata,
Yamano and Takahashi 1983; Okuda, Takahashi, Fukada, Nitta, Nakao and Kirihata 1996;
Antoce, Antoce, Takahashi, Pomohaci and Namolosanu 1997; Alyabyev et al. 2004).
Fresh carrot juice is an extremely perishable food-stuff as it has a neutral pH, high sugar content
and also contains many soil microorganisms. We here describe an experiment we made using
carrot juice and three additives: green tea, orange juice and the well known preservative sodium
benzoate. The measurements were made by taking fresh carrot juice and mixing it with the three
additives, placing 15 mL of each mixture it glass sealed vials, and measuring the thermal power
in a calorimeter. We also measured on a sample of 15 mL pure fresh juice. The result (shown in
Fig. 5) indicates that green tea is not effective in reducing the growth of the microorganisms in
the carrot juice. Mixing with orange juice is a slighter better option. Probably because of the
lowered pH the curves look quite different when orange juice is added, but the initial increase in

Gomez and Wadsö: Isothermal calorimetry in Food Science and Technology 12/26
12
thermal power takes place at about the same time as for the pure carrot juice, so its use to prolong
shelf life is doubtful. The high dose of sodium benzoate significantly delays the onset of growth,
but it does not prevent all microorganisms from growing. What types of microorganisms that are
present in the juice cannot be inferred from the calorimetric measurements, but calorimetry is in
many cases an ideal method to start a study with as it gives a general overview of how fast
processes take place and what factors that control the process rates.
Thermal Treatment
We have here made an accelerated study of how much shelf life of carrot juice is prolonged by
mild thermal treatment. The measurement was made by heating about 500 mL of fresh carrot
juice and charging ampoules with 20 ml juice samples taken when the carrot juice reached 50, 60
and 70oC. The temperature was measured with a thermoucouple in the stirred juice. The
calorimetric measurements were then made at 20oC.
The result is seen in Fig. 6. The measured thermal power is the heat from the microbiological
activity in the sample. It is seen that the lower treatment temperatures gave only slightly lower
thermal powers, but that the 70oC treatment gave a substantially delayed signal. If a threshold
thermal power level can be established the effect of a treatment can be quantified. When we,
rather arbitrarily, choose 0.1 mW as threshold in the present study we find that the fresh juice and
the juice treated at 50 and 60°C give this thermal power after 22 h, while it takes the 70oC sample
35 h to reach it. At 20oC the shelf life was thus increased by more than 50% by the 70°C
treatment. This may not be true for normal storage temperatures where other microorganisms are
Gomez and Wadsö: Isothermal calorimetry in Food Science and Technology 13/26
13
active, but the same study can be made at any temperature wanted, possibly with a more sensitive
calorimeter at lower temperatures.
Shelf Life
Isothermal calorimetry is potentially a useful tool for shelf life predictions. Several attempts have
been made in this direction. For example have isothermal calorimetry been tested as a method to
detect microbiological spoilage of meat (Gram and Sögaard 1985), milk (Berridge, Cousins and
Cliffe 1974; Nunomura, Ki-Sook and Fujita 1986), carrot juice (Alklint, Wadsö and Sjöholm
2005), pineapple (Iversen, Wilhelmsen and Criddle 1989) and salads and eggs (Riva, Fessas and
Schiraldi 2001). Lampi et al. (Lampi, Mikelson, Rowley, Previte and Wells 1974) have also
described a calorimeter to detect microbiological growth in canned foods.
We will here discuss some results from (Alklint, Wadsö and Sjöholm 2005) that used a sensitive
isothermal microcalorimeter and plate counts to quantify microbial spoilage of carrot juice. At
present, plate counts is the standard method and regulatory limits give how many colony-forming
units of microorganisms that are allowed in different food stuffs. As microbial growth produces
heat, calorimetry could possibly be used as a complement to plate counts, for example to check
for microbial growth in packed foods as industrial quality control and for studies of the efficiency
of preservatives and other anti-microbial treatments.
Alklint et al. (Alklint, Wadsö and Sjöholm 2005) packed pasteurized carrot juice in cartons that
were stored at 17oC. At certain times cartons were opened and CFU counts were made and the
results were fitted to a Gompertz equation. In parallel the pasteurized juice was at the start of the
Gomez and Wadsö: Isothermal calorimetry in Food Science and Technology 14/26
14
measurements placed in sealed vials that were measured on in an isothermal calorimeter. The
result (Fig. 7) shows that when the CFU-counts increase, an increased thermal power is also seen
in the calorimetric measurement. A curve looking more like the CFU-curve can be made by
integrating the thermal power to get the produced heat, but by integrating a curve its “sharpness”
is reduced and we find that the thermal power shown gives the best early warning that microbial
growth is occurring. From the result it is clear that calorimetry can be a sensitive tool to early
detect microbiological processes in food stuffs.
4. Concluding remarks
Isothermal calorimetry is an extremely general technique as it measures heat production rate,
which accompanies nearly all physical, chemical and biological processes. From the above
examples it is clear that also in the food field isothermal calorimetry can by used to study
biological processes. We have in our work seen that isothermal calorimetry is an excellent tool
for initial exploratory studies. As it is often a sensitive instrument for biological samples, one can
usually with only a few measurements increase one’s knowledge of a system under study.
Typically, one can assess approximate reaction rates and the associated kinetics, and study what
factors (oxygen, nutrients, temperature etc.) that influences the process. In a second step one
often complements the calorimetry with other more specific analytical techniques.
We envisage that isothermal calorimetry will become more important in the microbiological field
in the future. Although it is not possible with a calorimeter to determine what types of organisms
that are growing in, e.g., a food-stuff, its sensitivity and generality makes it possible to very early
detect microbial growth. It is also a much less work-demanding technique than plate counting, so

Gomez and Wadsö: Isothermal calorimetry in Food Science and Technology 15/26
15
it could be an alternative in food industries to detect faulty heat treatments. As heat is conducted
though all materials, this can also be made on whole cartons and cans using special calorimeters.
A related future use can be as a tool in predictive microbiology. As a calorimeter measures the
heat from all microbiological processes in a sample – also from inside the sample – it is a much
more general technique than the often used surface cultures where one measures radial growth
etc. Measurement of thermal power is also a way to assess the activity of a mixed microbial
culture; a parallel to the use of calorimetry to quantify the total biological activity of soils
(Barros, Feijóo and Fernández 2003).
References
Alklint, C., Wadsö, L. and Sjöholm, I. (2005). Accelerated storage and isothermal microcalorimetry as methods of predicting carrot juice shelf-life. J. Sci. Food Agric. 85(2): 281-285.
Alyabyev, A., Gordon, L., Loseva, N. L., Rachimova, G., Tribunskih, V., Estrina, R., Sadunishvili, T., Gulua, L., Mchedlishvili, N. and Rodriguez-Lopez, J. N. (2004). The effect of a natural inhibitor isolated from the tealeaf on the energy processes in model systems. Thermochim Acta 422: 109-113.
Antoce, O. A., Antoce, V., Takahashi, K., Pomohaci, N. and Namolosanu, I. (1997). Calorimetric determination of the inhibitory effekt of C1-C4 n- alcohols on growth of some yeas species. Thermochim. Acta 297: 33-42.
Barros, N., Feijóo, S. and Fernández, S. (2003). Microcalorimetric determination of the cell specific heat rate in soils: relationship with the soil microbial population and biophysic significance. Thermochim Acta 406: 161-170.
Berridge, N. J., Cousins, C. M. and Cliffe, A. J. (1974). Microcalorimetry applied to certain species of bacteria growing in sterilized separated milk. J Dairy Res 41: 203-215.
Dubrunfaut, M. (1856). Note sur la chaleur at le travail méchanique produits par la fermentation vineuse. C. R. Hebdomadaires Seances Acad. 42: 945-948.
Gernot, T. J., Goelling, D., Klimant, I., Schneider, H. and Heinzle, E. (2003). pH-Sensing 96-well microtitre plates for the characterization of acid production by dairy starter cultures
Journal of Dairy Research 70(3): 327-333. Gomez, F., Toledo, R. T., Wadsö, L., Gekas, V. and Sjöholm, I. (2004). Isothermal calorimetry
approach to evaluate tissue damage in carrot slices upon thermal processing. J. Food Eng. 65: 165-173.

Gomez and Wadsö: Isothermal calorimetry in Food Science and Technology 16/26
16
Gómez Galindo, F., Roculli, P., Wadsö, L. and Sjöholm, I. (2005). The potential of isothermal calorimetry in monitoring and predicting quality changes during processing and storage of minimally processes fruits and vegetables. Trends Food Sci. Technol. 16: 325-331.
Gómez Galindo, F., Sjöholm, I., Wadsö, L., Rasmusson, A. G., Widell, S. and Kaack, K. (2006). Principles of postharvest physiology applied to the minimal processing of biological materials. Advances in postharvest technologies for horticultural crops. B. Noureddiene and S. Norio. Trivandum, India, Research Signpost: 41-58.
Gómez Galindo, F., Toledo, R. and Sjöholm, I. (2005). Tissue damage in heated carrot slices. Comparing mild hot water blanching and infrared heating. J. Food Eng. 67(4).
Gram, L. and Sögaard, H. (1985). Microcalorimetry as a rapid method for estimation of bacterial levels in ground meat. J. Food Protect. 48(April): 341-345.
Gustafsson, L. (1991). Microbiological calorimetry. Thermochim. Acta 193: 145-171. Hansen, L. D. (2000). Calorimetric measurements of the kinetics of slow reactions. Ind. Eng.
Chem. Res. 39: 3541-3549. Hansen, L. D., Hopkin, M. S. and Criddle, R. S. (1997). Plant calorimetry: a window to plant
physiology and ecology. Thermochim Acta 300: 183-197. Hansen, L. D., Hopkin, M. S., Taylor, D. K., Anekonda, T. S., Rank, D. R., Breidenbach, R. W.
and Criddle, R. S. (1995). Plant calorimetry. Part 2. Modeling the differences between apples and oranges. Thermochim Acta 250: 215-232.
Hansen, L. D., MacFarlane, C., McKinnon, N., Smith, B. N. and Criddle, R. S. (2004). Use of calorespirometric ratios, heat per CO2 and heat per O2, to quantify metabolic paths and energetics of growing cells. Thermochim Acta 422: 55-61.
Hofelich, T. C. and LaBarge, M. S. (2002). On the use and misuse of detected onset temperature of calorimetric experiments for reactive chemicals. J. Loss Prevention Process Ind. 15: 163-168.
Iversen, E., Wilhelmsen, E. and Criddle, R. S. (1989). Calorimetric examination of cut fresh pineapple metabolism. J. Food Sci. 54(5): 1246-1249.
Johansson, P. and Wadsö, I. (1999). An isothermal microcalorimetric titration/perfusion vessel equipped with electrodes and spectrophotometer. Thermochim. Acta 342: 19-29.
Kawabata, T., Yamano, H. and Takahashi, K. (1983). An attempt to characterize calorimetrically the inhibitory effect of foreign substances on microbial degradation of glucose in soil. Agric. Biol. Chem. 47(6): 1281-1288.
Kemp, R. B. (2000). 'Gie me ae spark o' nature's fire'. An insight into cell physiology from calorimetry. J Thermal Anal Calorimetry 60: 831-843.
Lampi, R. A., Mikelson, D. A., Rowley, D. B., Previte, J. J. and Wells, R. E. (1974). Radiometry and microcalorimetry - techniques for the rapid detection of foodborne microorganisms. Food Technology(Oct): 52-58.
Lamprecht, I. (2003). Calorimetry and thermodynamics of living systems. Thermochim Acta 405: 1-13.
Langworthy, C. F. and Milner, R. D. (1912). Some results obtained in studying ripening bananas with the respiration calorimeter. USDA Yearbook: 293-308.
Nunomura, K., Ki-Sook, K. and Fujita, T. (1986). Calorimetric studies of microbial activities in relation to water content of food. J. Gen. Appl. Microbiol. 32: 361-365.
Okuda, S., Takahashi, K., Fukada, H., Nitta, Y., Nakao, H. and Kirihata, M. (1996). Calorimetric study of the inhibitory effect of some boron derivatives on the growth activity of yeast (in Japanese). J. Antibact. Antifung. Agents 24(10): 649-655.

Gomez and Wadsö: Isothermal calorimetry in Food Science and Technology 17/26
17
Peredes Escobar, M., Gómez Galindo, F., Wadso, L., Ruales Nájera, J. and Sjöholm, I. (2007). Effect of long-term storage and blanching pre-treatments on the osmotic dehydration kinetics of carrots (Daucus carota L. cv. Nerac). J. Food Eng. 81(2): 313-317.
Reyes, L. F., Villareal, J. E. and Cisneros-Zevallos, L. (2007). The increase in antioxidant capacity after wounding depends on the type of fruit or vegetable tissue. Food Chem. 101: 1254-1262.
Riva, M., Fessas, D. and Schiraldi, A. (2001). Isothermal calorimetry approach to evaluate shelf life of foods. Thermochim Acta 370: 73-81.
Rocculi, P., Gomez-Galindo, F., Mendoza, F., Wadsö, L., Romani, S., Rosa, M. D. and Sjöholm, I. (2007). Effects of the application of anti-browning substances on the metabolic activity and sugar composition of fresh-cut potatoes. Postharvest Biol. Technol. 43(1): 151-157.
Rocculi, P., Romani, S., Dalla Rosa, M., Gómez Galindo, F., Sjöholm, I. and Wadsö, L. (2005). Calorimetria in isoterma come metodo valutativo e predittivo della qualità di ortofrutticoli lavorati al minimo”, . Industrie Alimentari XLIV(settembre ).
Sebok, A., Bontovics, P. and Bleszkan, M. (1999). A kinetic approach of texture changes of vegetables during blanching. Acta Alimentaria 28(3): 279-290.
Smith, B. N., Hansen, L. D., Breidenbach, R. W., Criddle, R. S., Rank, D. R., Fontana, A. J. and Paige, D. (2000). Metabolic heat rate and respiratory substrate changes in aging potato slices. Thermochim Acta 349: 121-124.
Wadsö, I. and Wadsö, L. (2005). Systematic errors in isothermal micro- and nanocalorimetry J. Thermal Anal. Calorimetry 82(3): 553-558.
Wadsö, L. (2005). Applications of an eight-channel isothermal conduction calorimeter for cement hydration studies. Cement Int.(5): 94-101.
Wadsö, L., Gomez, F., Sjöholm, I. and Rocculi, P. (2004). Effect of tissue wounding on the results from calorimetric measurements of vegetable respiration. Thermochim. Acta 422: 89-93.

Gomez and Wadsö: Isothermal calorimetry in Food Science and Technology 18/26
18
Figure captions
Figure 1. A cut-away drawing of the instrument with the top insulated lid removed. Three of the
eight calorimeters are shown (1-3); one with part of the heat sink removed so that one can see the
ampoule holders for the sample and the reference (1). The temperature of the calorimeter is set on
a temperature regulator (4) and regulated by a Peltier heater/cooler (5). The thermostat is
protected from the ambient temperature with an insulation (6). The bottom part of the unit
contains the amplifier, the data logger and power supplies (7).
Figure 2. Results of experiment with wound respiration (Wadsö, Gomez, Sjöholm and Rocculi
2004). The left diagram shows the results of calorimetric measurements on eight samples excised
from a carrot, some of which have been further cut to increase the wound area. “BL” are the
baselines after the measurement. The right diagram shows the specific thermal power at 240 min
as a function of the specific wound area.
Figure 3. Results of an experiment with blanching of carrot samples (Gomez, Toledo, Wadsö,
Gekas and Sjöholm 2004). The measured thermal powers are drawn as a function of blanching
time.
Figure 4. The thermal power from the fermentation of milk at two temperatures using two
different buttermilk cultures (F is “filmjölk” and A is “A-fil”).

Gomez and Wadsö: Isothermal calorimetry in Food Science and Technology 19/26
19
Figure 5. The effect of different additions on carrot juice spoilage. The thermal power seen is
from the microbiological growth.
Figure 6. Thermal treatment of carrot juice resulting in increased shelf life only at the highest
treatment temperature.
Figure 7. Results from parallel measurements on carrot juice with plate counts and isothermal
calorimetry (adapted from (Alklint, Wadsö and Sjöholm 2005)).
Gomez and Wadsö: Isothermal calorimetry in Food Science and Technology 20/26
20
Figures
Figure 1.
(TAMAirfig.emf)
12
3 4
5
6
7 77
6
6

Gomez and Wadsö: Isothermal calorimetry in Food Science and Technology 21/26
21
Figure 2 Tissue wounding
(Fig. 1 from c:\measure3\food\ApplPaper\wound\Pietro\figwoundcarb.m)
0 200 400 600 8000
0.2
0.4
0.6
0.8
1
BL
Time / min
Ther
mal
pow
er /
mW
/g
0 500 1000 15000
0.1
0.2
0.3
0.4
0.5
0.6
specific surface area / mm2/g
spec
ific
ther
mal
pow
er /
mW
/g

Gomez and Wadsö: Isothermal calorimetry in Food Science and Technology 22/26
22
Figure 3. blanch
(Fig. 1 from c:\measure3\food\ApplPaper\blanch\evalfigblanch.m)
0 10 20 30 40 500
20
40
60
80
100
Time / s
Ther
mal
pow
er re
lativ
e co
ntro
l / %

Gomez and Wadsö: Isothermal calorimetry in Food Science and Technology 23/26
23
Figure 4. Fermentation
(Figure 1 from c:\measure3\food\ApplPaper\milk\milkferm.m)
0 10 200
0.05
0.1
0.15
0.2
0.25
0.3
0.35
Time / h
Ther
mal
pow
er /
mW
/g
A: 23oCA: 20oCF: 23oCF: 20oC

Gomez and Wadsö: Isothermal calorimetry in Food Science and Technology 24/26
24
Figure 5. Carrot juice + things
(Fig. 3 from c:\measure3\food\ApplPaper\juiceFG\evaljuiceFG.m)
0 20 40 60 80 100 1200
1
2
3
4
5
Time / h
Ther
mal
pow
er /
mW
only carrot juice10% green tea40% orange juice1% Na-benzoate

Gomez and Wadsö: Isothermal calorimetry in Food Science and Technology 25/26
25
Figure 6. Thermal treatment
(Fig. 2 from c:\measure3\food\ApplPaper\juiceFG)
0 20 40 60 80 100 1200
1
2
3
4
Time / h
Ther
mal
pow
er /
mW
fresh50oC60oC70oC

Gomez and Wadsö: Isothermal calorimetry in Food Science and Technology 26/26
26
Figure 7. Alklint
(Fig 1 from c:\measure3\food\ApplPaper\juiceCA\CAfig1x.m)
0 20 40 60 800
20
40
60
Ther
mal
Pow
er / μW
2
4
6
8
Log1
0(C
FU)
Time / h