itub institutional presentation 2q20 - macroeconomic
TRANSCRIPT

Institutional PresentationItaú Unibanco Holding S.A.
2Q20
ITUB
NYSELISTED LEVEL 1
BM&FBOVESPACDP

2Q20
This presentation contains forward-looking statements regarding Itaú Unibanco Holding, its subsidiaries and affiliates - anticipated synergies, growth plans, projected results and future strategies. Although theseforward-looking statements reflect management’s good faith beliefs, they involve known and unknown risks and uncertainties that may cause the Company’s actual results or outcomes to be materially different fromthose anticipated and discussed herein. These statements are not guarantees of future performance. These risks and uncertainties include, but are not limited to our ability to realize the amount of the projected synergiesand the timetable projected, as well as economic, competitive, governmental and technological factors affecting Itaú Unibanco Holding’s operations, markets, products and prices, and other factors detailed in ItaúUnibanco Holding’s filings with the Securities and Exchange Commission which readers are urged to read carefully in assessing the forward-looking statements contained herein. Itaú Unibanco Holding undertakes in dutyto update any of the projections contained herein. This presentation contains managerial numbers that may be different from those presented in our financial statements. The calculation methodology for thosemanagerial numbers is presented in Itaú Unibanco Holding’s quarterly earnings report. To obtain further information on factors that may give rise to results different from those forecast by Itaú Unibanco Holding, pleaseconsult the reports filed with the Brazilian Securities and Exchange Commission (Comissão de Valores Mobiliários - CVM) and with the U.S. Securities and Exchange Commission (SEC), including Itaú Unibanco Holding’smost recent Annual Report on Form 20F.

AgendaCorporate
profileStrategicagenda
Corporategovernance
Our businesses
0413
3152
Economiccontext
Capital andrisk management
6276
Financial highlights 81
Additionalinformation92

Corporate profile
4

Corporate profile
About us?
Market Value³US$45.9 bn
Total assets3
R$2,075.1 bnCredit portfolio3
R$811.3 bnROE4
13.5%Net income4
R$4.2 bnTier I Capital 3
12.1%
Universal bank | 95 years of history | largest bank in Latin America¹
(1) Largest bank in market value; (2) 2019 Interbrand Ranking ; (3) June 2020 (4) In 2Q20. (5) April 2020.
Brazil’s most valuable² brand
R$33.5 billion
Approximately
We are present in 18 countries
434 kdirect shareholders
4.5 kbranches and PABs
97 kemployees
56 million5
Retail clients
46 kATMs
Key
Multiple Bank1 Corporate & Investment Banking 2 Asset Management 3 Private BankingOther operations
5
Rest of the World
Argentina
Brazil
Chile
ColombiaMexicoPanamaParaguayPeru
Uruguay
Latin America
1
1
GermanBahamasCaymanSpainUnited StatesFrancePortugalUnited KingdomSwitzerlandReino UnidoSuíça
1
1
1
1
1 2
3
2 3
1
1 2 3
1
3

Corporate profile
What do we do?
Personal
Cards
Working capital
Real estate
Micro credit
Vehicles
Rural
Current accounts
Cards and acquiring
Consórcio
Brokerage
Premium Bonds
Payment means
Capital markets
Life
Homeowners insurance
Auto
Dental
Card protection
Travel
Healthcare
Smartphone protection
Investments Guarantee insurance
Payroll loans
Imports/Exports
Pension plans
Full offering of products and services | diversified client base | solid brand
ServicesCredit InsuranceA completephysical and digital bank
The Retail Bank includes retail clients, high-income clients and very small and small businesses, in addition to products and services for non-account holders.
The Wholesale Bank is responsible for high net
worth clients (private banking), the units in Latin
America, banking for middle market and large
companies and corporations through Itaú
BBA, the unit responsible for corporate clients and
for its role as an investment bank.
Open platformInvestment and insurance products sold on open platforms.
$
$
$
$
$
$
$$
$
Main brands and commercial partners
Other productsOther products Other products...... ...
6

Corporate profile
How have we evolved?
First stepsCasa Moreira Salles opens in 1924, and Banco Central de Créditoin 1943.
Paths to growthMarked by mergers, acquisitions and business alliances that enabled the growth and consolidation of both institutions.
An historic mergerIn 2008, Itaú andUnibanco united to create Brazil’s largest private bank.
Focus onLatin AmericaOur international presence has evolved year after year. Today, Itaú is present in 18 countries.
A bank with a purposeWe believe that people have the power to transform the world, and that the bank can promote this transformation.
1929 1945 1983 1985 1990 2006 2016 2020
Adaptable culture | innovation | transparency in business
1930 1950 1960 1980 1984 2002 2014 2020
We have witnessed important changes around the world...
NY Stock Exchange crisis
First overseas branch of Itaú
First version of Windows appears
First Internet providers
World War IIends
Itaú on the NY Stock Exchange.
First checks with client’s name
First in-branch calculators
FirstATMs
Mobile Banking in Brazil
First debit and credit cards
Banking automation begins
... and in Brazil
Britain decides to leave the European Union (Brexit)
7
World Health Organization declares coronavirus pandemic
Fintechsstart to gain strength
Central Bank launches PIX

To change leagues and compare ourselves with the world’s best companies in client satisfaction
Corporate profile
What are we seeking?
Our WayOur culture
PurposeOur Promoting people’s power
of transformation
Simple. Always
People mean everything to us
Ethics are non-negotiable
It’s only good for us if it’s good for the client
Passionate about performance
The best argument is the one that matters
We thinkand act like owners
Positive impact
Strategic agenda
Commitments to a Responsible investment
Financing for sectors with a
positive impact
Inclusion and entrepreneurship
Financial citizenship
Transparency in communication
Ethics in relationships and
business
Inclusive management
Responsible management
8
Clientcentricity
Our ambition is to be one of the world's best companies in client satisfaction.
Digital Transformation
We must have the best products, in less time and higher flexibility.
People
Our business is providing services and that is why people is a vital issue. We invest to provide a more open and diverse environment.
Efficiency
Price is of paramount importance customer satisfaction. We can only have competitive prices if we are efficient.

Carta Empresarial pelo Direitos Humanos e pela Promoção do Trabalho
Decente
Red Mujer Emprendedora
Corporate profile
A responsible bank
Financing for sectors with a positive impactTo increase our financing and services in those sectors.
Responsible investmentTo expand our offering and distribution of products and services for an economy that is more responsible and with a positive impact.
Inclusion and entrepreneurshipTo increase financial inclusion for entrepreneurs.
Financial citizenshipTo promote client satisfaction, as well as their financial lives.
Transparency in the communicationTo strengthen our transparency, demonstrating the value created for our stakeholders.
Ethics in relationships and businessEthics are non-negotiable. Promote the creation of an intimate and ethical financial ecosystem.
Inclusive managementTo enhance our employees’ experience and to foster a working environment that is diverse, inclusive and healthy.
Responsible managementTo improve the performance of our operations and to foster sustainable practices across our supply chain.
Our commitments to apositive impact
Main pacts, initiatives and voluntary commitmentsWe believe that people have the power to transform the world, and that a bank can promote this transformation.
Ethics is present in our business and results in transparency, respect and honesty in our relationships with our stakeholders, in the quality of our products and services and in our concern with financial performance and socioenvironmental responsibility.
9
Respect and diversity
Sustainable development
Responsible banking
Transparency in the communication
Climate change
Ethics and integrity
Contribuição Empresarial para a Promoção da Economia Verde e Inclusiva

Corporate profile
A responsible bank | ESG
10
ESG aspects have been integrated into the Bank's management for over two decades
We reported 12 of the 14 indicators of the Sustainability Accounting Standards Board in our Integrated Annual Report 2019.
We adopted the SASB indicatorsWe follow the main global framework of the climatechange agenda - Task Force on Climate-relatedFinancial Disclosures.
100% adherent to the TCFD until 2022ESG management and transparency practices
Environmental conservation and development of a bioeconomy
Investment in sustainable infrastructure
Guarantee of the basic rights for the population
Together with the banks Bradesco and Santander, we announced 10concrete measures targeting 3 areas considered top priority for the region:
The three banks are working together on specifying the initiatives and setting clear objectives, goals and metrics.
1999
Dow Jones Sustainability
Index(DJSI)
2008
Principles for Responsible Investment
(PRI)
2017
Bloomberg's Gender
Equality Index
2005
B3’s Corporate Sustainability
Index(ISE)
2004
Equator Principles
2019
Principles for Banking
Responsibility(UN)
2018
Sustainable Development
Goals(SDG)
2009
Global Reporting Initiative
Standards (GRI)
Integrated plan to promote sustainable development of the Amazon
2020
Since 2012We offset 100%
of our direct emissions (scope 1)1
Since 2017We offset 100%
of our indirect emissions (scope 2)2
2010
Carbon Disclosure
Project (CDP)
(1) Scope 1: Direct greenhouse gas (GHG) emissions from sources that are owned or controlled by Itaú Unibanco. (2) Scope 2: Indirect GHG emissions from the acquisition of electricity that is consumed by Itaú Unibanco.

Corporate profile
2020 | Support for clients during the crisis
11
R$1.6 billionin emergency credit for payrollsto finance salaries of more than 660 thousand employees in the last months
1st private bankto offer the Pronampe²credit lineR$ 3.6 billion - all available volume –for about 36 thousand very small and small companies
Participation in government initiatives
R$2.9 billion subscribed by Itaú Unibanco in the initiative between CCEE³ and banksof a total of R$ 15.2 billion, to support energy generators, distributors and concessionaires
(1) Includes emergency credit for payroll financing and the Pronampe² credit line; (2) Pronampe is a national support program for very small and small companies; (3) Chamber of Commercialization of Electric Energy
R$13.2 billion
middle-market companies
large companies
R$52.4billion
very small and small companies
R$17.1¹billion
individualsR$14.1billion
New credits were grantedMarch 16 to July 17, 2020
R$96.8 billionThis unprecedented initiative aims to address indebtedness using a structured approach, providingclients with some respite and ensuring that they enjoy sustainable conditions over time.The range of customized solutions includes grace periods, extended loan terms and additional credit offer.
Term extension of up to6 years for individuals
5 years for very small and small companies
Grace period of up 120 days for individuals
180 days for very small and small companies
Better interest rate conditions
~1.8 millionindividuals
It has already benefited:
~200 thousandvery small and small companies
R$52 billion in loan portfolio reprofilingIn June 30, 2020

Corporate profile
2020 | Todos pela saúde
12
From R$1.2 billion donated to date, more than $1 billion has already been allocated to 4 areas of activity.Next, check out some of the main achievements in these 90 days.
Campaigns to clarify and raise awareness among the population and guidance on the proper use of protective masks
to informR$94 million
to protectR$347 million
Test Centers operations begins on the 31st of July in Rio de Janeiro city and on the 7th of August in the Ceará state
+ 25,000 tests per day
Support for epidemiological research and for the treatment of covid-19
to prepare R$222 million
and caregivers in more than 600 institutions
to careR$396 million
serving all cities in Brazil105,000 oximeters
Implementation of Reception Centers in vulnerable areas
1,000 units of hospital equipment
~ 175 million people society to resume social activities as normal
support to 50,000 elderly people
Distributed to the elderly, users of public transport, residents of communities, indigenous people and homeless people
14 million masks
330,000 health professionals and 172,000 patientsBenefited by the distribution of more than 50 million protective equipment
Investment in the new vaccine manufacturing plants of Fiocruz and Instituto Butantã
and awareness initiatives for truck drivers44,000 tests

Strategic agenda
13

Strategic agenda
Strategic agenda
Following a collective thought process, we defined our strategic agenda in order to achieve consistent and quality results in the years ahead.
Client centricity
Efficiency
Digital Transformation
People
14
Customer centricity is the central piece supported by three fundamental pillars: digital transformation, people and efficiency.
Our ambition is to be one of the world's best companies in client satisfaction.
We must have the best products, in less time and higher flexibility.
Our business is providing services and that is why people is a vital issue. We invest to provide a more open and diverse environment.
Price is of paramount importance customer satisfaction. We can only have competitive prices if we are efficient.

Strategic agenda
Client Centricity
We want our clients to have the best experienceThat is why we are continually and tirelessly striving to improve our client’s experience each time they engage with the bank
56 million clients
between 18 and over 80 years of age;
from low-income to the Private segment;
present throughout Brazil, both in the capital cities and hinterland, and overseas;
companies: from very small companies, to major corporate conglomerates.
We challenge ourselves daily to serve this very heterogeneous universe.
Satisfied clients create more valuePresent Value of R$/client net income, 5-year forecast (base 100)
10xThe difference between the present value created by a client who advocates for the Itaú Branches segment, against the value generated by one who knocks it
Universal Bank
15
100
468
950
ItaúBranches
5x
2x

Strategic agenda
Client Centricity
We want to be the benchmark in satisfaction, transforming our culture so that the client is at the center of everything. Our actions, including digital transformation and the efforts involving people management, are designed for our clients’ satisfaction, a key metric for the entire organization.
Lessons learned from client feedbacks to enhance their
experience.
Active contact to understand our clients’ experience.
+4 k meetings per month¹
+60 k feedbacks per month¹
We want to be compared to the world’s best companies in client satisfaction
Comparable companies
Satisfied clients create higher value
Global NPS
16
+ 8 points
+ 17 points
+ 27 points
2020 vs 2018(Jun-20 vs Aug-18)
2021 vs 2018 2023 vs 2018
1: Period: Jan-20 to Mar-20

Strategic agenda
Client Centricity
3,8Updated in Jun-20
1st bank offering bank account opening by mobile phone
1st bank offering a leanersmartphone app
Card receivables control by phone
APP ITAÚ(INDIVIDUALS)
APP ITAÚ EMPRESAS
4,4
APP LIGHT
APP REDE
APP ABRE CONTA
APP ITAUCARD
APP ITAÚ EMPRESAS
APP PERSONNALITÉ
Continuous updates for a better experience
17
4.4 4.7
4.5
4.5 4.6
4.7 4.7
4.3 4.8
4.4 4.0
4.3 4.7
Our apps are among the best rated in app stores
App Store
Play Store
14.7 MM of individual and corporate account holders using our digital channels
56on the mobilechanel
More than half new users have been our customers for over 1 year
47% of new entrants are over 50 years old: 17 p.pincrease over the period before the pandemic
Newfeatures

Strategic agenda
Client Centricity
Juros pós-fixados Juros prefixados
Inflação Multimercado
Carteira em 26/08/2019Nível de risco: Moderado
Retorno esperado (em % CDI): 114.5% a.a.
Nível de risco: Arrojado
Retorno esperado (em % CDI): 133.9% a.a.
DIAGNÓSTICO DA SUA CARTEIRA
Sua carteira atual Carteira personalizada
07
Investment recommendationsWhat is the best way to invest my money?
Data only Itaú has:
Expected results from 28,000 financial products and assets 1,200,000 possible portfolio combinations 10,000 scenarios for market behavior
Testing 12 billion different scenariosfor all client profiles
Optimization in the client context (current portfolio, earnings and new investments)
2.5 minutesto generate arecommendation
+0.80 to 3.00 pp additional annualportfolio profitabilitybased on the recommendation
The most advantageous combination possible for each client, according to their profile and moment in life
Customized expert evaluation
Solution
Identifiedneed:
18

Tendências de novas tecnologias:
cloud
artificial Intelligence andmachine learning
big data and analytics
APIs
blockchain
What are they for?Identifying possible application
opportunities
Let’s testPilots and tests in lateral situations,
which do not compromise
client’s realneeds
New technology radar:
cloud
artificial Intelligence and machine learning
big data and analytics
APIs
blockchain
+
Technology applied to solve real problems,enabling measurement of value created
Expenditure Time Expenditure Time
$ $ $ $ $ $
Strategic agenda
Digital Transformation
19
Supply perspective x Demand perspective
Traditional model: supply perspective Tendências de novas tecnologias:Modern model: demand perspective
New technology trends:
We find an applicationMore investment for
updating

time data customization
Client Bank
Market research
Solutiondevelopment
Data+ research
+ experimenting
time data customization
Bank
Client
Client
Before
Now
Strategic agenda
Digital Transformation
To achieve digital transformation, we need to change the way we develop services and products
20

Strategic agenda
Digital Transformation
21
+
Sponsoredbusiness verticals:Founders:
Spark Awards
Financial Innovation Awards 2016
Startup Awards
Awardssince 2015:
International Visual Identity Awards
+ velocity to extend our digital offer
IF Design Award
Cubo is the most relevant hub for technologicalentrepreneurship promotion in Latin America.
Logistics & mobility | Retail | Health | Education | Fintech
Partnerships:
+ outros
88 projectsbetween the bank and Cubo startups
13 floors+ rooftop
29sponsors
215,000+ ft2
397filliatedstartups
residentstartups
107
31differentindustries

Higher productivity
22
Reduction of customers who had problems with major transactions on the internet and mobile channels:
More availability
Now99.6% of ourclientsfind no problems when using the main transactions on these channels
Data base 100
2Q2019 2Q2020
More technology solutions
Greater number of solutions delivered Reduction in the delivery time of technology solutions
New work methods lead to superior results
Strategic agenda
Digital Transformation
- 57%
15%2Q2019 2Q2020-30%
2Q2019 2Q2020

130 MM calls/year
The right service, for the right client at the right moment
One of the world’s largest voice transcription operations
Traditional monitoring
Calls monitored by people.<0.5% followed up
Capture client’s satisfaction limited to one sample
Transcription of 100% of the calls and analysis of the texts
client attendant
“I would like to increase my
limit.”
• Map opportunities
• Capture intentions without having to ask
• Channel efficiency
• Measure the satisfaction of 100% of our clients
In the past
Speech analytics
Today
Strategic agenda
Digital Transformation
Analytics: “listening to” 360,000 calls every day
23
Audio signal
Call content
Client´s data

Transactions
Geolocation
Interactions indigital channels
Voice data
Biometrics
Image data
Text data
Data: the bank’s new capital
Strategic agenda
Digital Transformation¹
24
70petabytes
(1) Data base Jul-20.
+State-of-the-artalgorithms
Data andanalytics
Data scientists+
+ Resultado
+485% of value captured in projects in analyticsData base: 2017 to Jul-20

Strategic agenda
Digital Transformation
Focus on efficiency while continually investing in technology
25
11%Inflation (IPCA) accumulated in the period
Technology investments
45.3 46.4 47.6 45.5
100122
130154
100 101 106 109
2016 2017 2018 2019
Efficiency Ratio (%) Technology investments (Base 100) Non-interest Expenses (Base 100)

Strategic agenda
Digital Transformation
26
Digital dashboard
Quality
Virtual stores(Itaú Varejo app, end of period)
Availability -%Share of customers with normal service on the main digital functionalities in June 2020.
99.0%
99.6%
Jan-19 Jun-20
App Store
Play store Jun-19
Mar-20
Jun-20
4.3
4.4
4.4
Jun-19
Mar-20
Jun-20
4.7
4.7
4.7
4.4 of 5
4.7 of 5+1 m reviews
+1 m reviews
Digital solutions
Transfers
Payments
Investments
Personal loan
97%85%
46%40%
For individualsShare of digital channels in 2020 (%)
For companies
R$3.6 billion²through Itaú Empresas appPronampe³ emergency credit line, directly through smartphone1st private bank to offer Pronampe.
R$1.6 billionthrough the internetLine of credit for payroll expenseswith implementation in record time.
Usability
~ 1 million accounts opened through Abreconta app in 2020(thousand)
Annual increase of 17.1% of digital clients in 2020¹
XX,X
1H18
218
987+131%
1H20 vs. 1H19
+353%1H20 vs. 1H181H201H19
426
5.56.6
8.2
IndividualsCompaniesCredit card holders
10.3
11.9
13.5
1.1 1.2 1.2
(1) Considers account holders (individuals and companies) and digital credit card holders; (2) In July 2020; (3) National Support Program to Micro and Very Small businesses.
Jun-18 Jun-19 Jun-20

14%
Employees²in Brazil and overseas
41.5%
58.5%
Men
Women
1%
3%
7%
5%
83%
OfficersManagersAdministrationOperationsTraineesInterns
Apprentices
0.1%15.0%38.8%38.6%
0.2%5.4%1.8%
86% 14%48% 52%50% 50%
30% 70%59% 41%
47% 53%31% 69%
Approximately
NorthNortheastCenter-WestSoutheastSouth
4.2%
People with disabilities
22.9%Afro-Brazilians
By gender
By age bracket By region
43.2%
51.4%
5.4%45.5 k people30-50 years38.3 k peopleup to 30 years
4.7 k people> 50 years
By hierarchical level Inclusion and diversity
27
97 thousand
(1) December 2019 - For information relating to employees, we only consider information from Itaú Unibanco companies under the management of the Human Resources department, except for International Units. (2) June 2020.
Strategic agenda
People1

Employee’s experience
An innovative and inspiring environment.
VoU cOmO sOu
Home-office
IU Conecta
New work methods
Rendering our dress code flexible, respecting our employees and our strategic agenda..
We offer more flexible options that encourage employee autonomy.
A new platform for our employees’ day-to-day. A social network with several administrative tools.
Collaborative environments, delivery communities and focal space aiming for greater synergy, communication and integration among the teams.
Greater freedom for employees to reconcile their working hours with their personal life.
Flexibility
Is Itaú Unibanco a good place to work?
73e-NPS
78%
18%
5%
Advocates
Neutrals
Knockers
In our employees’ eyes
(Scores 9-10)
(Scores 7-8)
(Cores 0-6)
Our challenge is to be increasingly attractive to all generations and to engage and develop our talent pool. To do so, we have consistently invested in disseminating our purpose and what we refer to as Our Way– a strong culture rooted in collaboration,meritocracy, ethics and total and unbridled respect for the individual.
Attraction and retention of employees
16.7% turnover rate
86% Up to 30 years’ old
14% Over 30 years old
49% Women
51% Men
Strategic agenda
People¹
28
13.6 kadmissions
(1) Data base 2019.
In the market view
2018
12.1% Involuntary
4.7% Voluntary
Strategic agenda
People¹
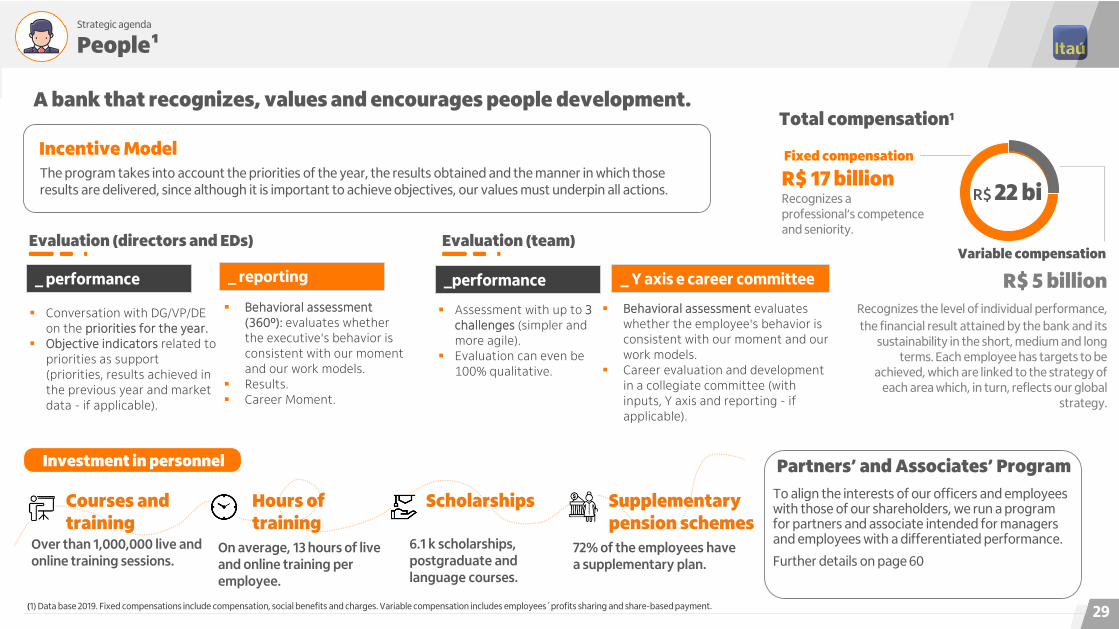
The program takes into account the priorities of the year, the results obtained and the manner in which those results are delivered, since although it is important to achieve objectives, our values must underpin all actions.
Incentive Model
Over than 1,000,000 live and online training sessions.
Courses and training
On average, 13 hours of live and online training per employee.
Hours of training
6.1 k scholarships, postgraduate and language courses.
Scholarships
72% of the employees have a supplementary plan.
Supplementary pension schemes
A bank that recognizes, values and encourages people development.
Investment in personnel
29
Partners’ and Associates’ ProgramTo align the interests of our officers and employees with those of our shareholders, we run a program for partners and associate intended for managers and employees with a differentiated performance.
Further details on page 60
(1) Data base 2019. Fixed compensations include compensation, social benefits and charges. Variable compensation includes employees´profits sharing and share-based payment.
Evaluation (directors and EDs)
Conversation with DG/VP/DE on the priorities for the year.
Objective indicators related to priorities as support (priorities, results achieved in the previous year and market data - if applicable).
_ performance _ reporting
Behavioral assessment (360º): evaluates whether the executive's behavior is consistent with our moment and our work models.
Results. Career Moment.
Assessment with up to 3 challenges (simpler and more agile).
Evaluation can even be 100% qualitative.
_performance _ Y axis e career committee
Behavioral assessment evaluates whether the employee's behavior is consistent with our moment and our work models.
Career evaluation and development in a collegiate committee (with inputs, Y axis and reporting - if applicable).
Evaluation (team)
R$ 22 bi
Total compensation1
Fixed compensation
Variable compensation
R$ 17 billionRecognizes a professional’s competence and seniority.
R$ 5 billionRecognizes the level of individual performance, the financial result attained by the bank and its
sustainability in the short, medium and long terms. Each employee has targets to be
achieved, which are linked to the strategy of each area which, in turn, reflects our global
strategy.

Strategic agenda
Efficiency
Our challenge is to continually improve the efficiency of our operations by maintaining clients at the center of our decisions, through strategic cost management and investment in technology and new ways of working in order to boost the use of our resources, whileefficiently managing the allocation and cost of capital.
Key principles of ourStrategic Cost Managementweekly reported to the Executive Committee
Automation and digitalization
Focus in technology
Consolidation, reorganization and redesign of operations
Optimization of service channels
+802 employeeshired by the Technology area in the quarter+1,327 employees in the last 12 months.
Zup1,448 employees incorporated in the quarter
3.7% 2.4% 1.8%-0.7%
0.4% -0.5%-2.5%
-4.0%
2Q19 3Q19 4Q19 1Q20 2Q20
Non-interestexpensesgrowing at a slower pacethan inflation
Non-interest expenses growthyear over year
Non-interest expenses growthcompared to the same period of the previous year (deflated by IPCA)
-9.0%
-6.8%
30

Our business
31

Our business
Who are our clients?
Through our Retail and Wholesale Banking segments we offer a wide range ofproducts and services tailored to each client profile.
Personnalité>R$10 thousand or >R$100 thousand in total investments
Uniclass>R$4 thousand up to R$10 thousand
Retailup to R$4 thousand
Private Bank>R$5 million in total investment
;;;;;;;
; Middle between R$30 million up to R$500 million
Largebetween R$500 million up to R$4 billion
Ultra over R$4 billion
Very Small and Small Companiesup to R$30 million
Client profileby segment in Brazil
RETAIL
WHOLESALE
Individuals Companies
32

Our business
Retail Banking
Our distribution network comprises¹4 , 0 0 6 B R A N C H E S A N D C S B s I N B R A Z I L
3 %North
8 %Northeast
7 %Midwest
67 %Southeast
15 %South
MainResults 2Q20
Serving a client base of over
56 million clients
MORE THAN 45,000ATMsin Brazil
Efficiencyratio
Return onallocatedcapital
Consolidatedprofitsharing
Net income R$1.8billion
42%
15.3 %
51.8 %
(1) In June 2020. Does not include branches and CSBs in Latin America and Itaú BBA. 33
Retail Banking NPS
+8 points Dec-19 vs. Aug-18
DigitalBranches(Brazil)
Brick and Mortar Branches and PABs
Branches and PABs
4,7224,488
Jun-19 Jun-20
196
4,292
196
4,526
234(Jun-20 vs Jun-19)

Our business
Retail Banking
The use of our digital channels significantly increased over the last years. Our digital branches alsoincreased to serve clients who almost do not use brick and mortar branches.
196 digital branchesfor over 2.3 millionclients
More than335,000 companies4
servedbymanagers withmobility, usingsmartphone, tablet andvideoconference
Use of digital channels¹
Total current account holders (in millionpeople)
Jun-18 Jun-19 Jun-20
10.3 11.9 13.4
1.1 1.2
individuals
companies
% of transactionsthrough digital channels
Investiments²
Credit²
Payments²
46%
25%
85%
41%
18%
72%
1H20 1H19
(1) Internet, mobile and SMS in Retail Banking; (2) Share of digital channels in the total volume of transactions (R$) in the Retail Banking; (3) Share of digital channels in the total volume (R$) of transactions in the Retail Bank segment; (4) Includes Emp3 and Emp4; (5) Includes only Emp4.
ExtendedhoursDifferentiatedservice
18 digital branches for107,000 microentrepreneurs5
HighlightDigital branches
34
Transfers³ 97% 91%
1.2
Account openings through the Abreconta app The availability of digital channels remains high, at the highest level ever
99.6%of the clientsdid not have any impact on the mainfunctionalities.(June 2020)
99.0%
99.6%
Jan-19 Jun-20
127 205
645
2Q18 2Q19 2Q20

Our business
Retail Banking | Support for clients during the crisis
This unprecedented initiative aims to address indebtedness using a structured approach, providing clients with some respite and ensuring that they enjoy sustainable conditions over time.
35
0.8 1.0 1.0
0.6 0.4 0.3
03/16 to04/17
04/18 to05/01
05/02 to05/15
05/16 to05/29
05/30 to06/12
06/13 to 06/26
March 16 to June 30, 2020
37.6 IndividualsVery small and small companies
Reprofiled portfolio by product (in R$ billions)
16.1Mortgage loans
12.9Personal loans
4.7Vehicle loans
2.8Cards
Reprofiled volume per working day (in R$ billions)
14.6
12.1Working capital
2.5Vehicle loans
R$52 billionin loan reprofiling for individuals, very small and small businesses
58% are collateralized
90% in ratings AA to C
93% individuals
83% very small and small companies
1.0Payroll loans
100% up to date in February

Our business
Wholesale Banking
Our sales channels reach institutional clients in 18 countries.
Mainproducts and services
MainResults 2Q20Only in Brazil, We serve approximately
21,000 corporate groups andinstitutional
Efficiencyratio
Return onallocatedcapital
Consolidatedprofit sharing
Net income R$825 million
20 %
5.6 %
48.9 %
ParaguayArgentina
PeruColombiaUruguayPanamaMexicoUSABahamasCayman Chile
EnglandPortugalSpainGermanyFranceSwitzerlandCorporate
Institutional Clients
Private Banking
CreditsolutionsNationalandforeigncurrency
Service solutionsR$3.3 bnfixed incomedistributionR$585 mnequitiestransactionsin LatinAmericaR$757 mn total volume of Mergerand AcquisitionR$7.4 bnfinancing of infrastructure projects in different sectors
Solutionsin WMSR$1,405 bn under local custodyR$113 bn under internationalcustodyR$720 bn¹ under assetmanagement
$
36
2020 maininitiativesLatAm –ClientCentricity
(1) Source: ANBIMA (Brazilian Financial and Capital Markets Association) – June 2020. Considers Itaú Unibanco and Intrag.
WholesaleBanking NPS
+8 points Dec-19 vs. Aug-18
• Accelerating the digitization of customer experiences and journeys • Evolution of the digital technological platform
• Increasein 100% digital customeracquisition• Implementation of NPS System for 3Q20

36% 38% 39% 40% 41% 41% 42% 44% 44%
64% 62% 61% 60% 59% 59% 58% 56% 56%
46.5 44.6 44.8 44.4 45.4 46.7 49.1 49.4 50.4
Jun-16 Dec-16 Jun-17 Dec-17 Jun-18 Dec-18 Jun-19 Dec-19 Jun-20
Rede de Agências Itaú Consignado S.A.
31.4 31.0 32.2 32.8 34.6 36.5 38.8 39.0 40.2
10.5 9.2 8.2 7.0 5.9 5.1 4.5 3.9 3.54.6 4.4 4.3 4.7 4.9 5.1 5.8 6.5 6.646.5 44.6 44.8 44.4 45.4 46.7 49.1 49.4 50.4
Jun-16 Dec-16 Jun-17 Dec-17 Jun-18 Dec-18 Jun-19 Dec-19 Jun-20
INSS Setor Público Setor Privado
Personal loans
Money in the accountThe money is immediatelycredited, including on theweekends.
PurposeThe loan does not have to bejustified.
Payroll loans
Reduced ratesInterest rates are lower than for other types of loans.
Easier repaymentFixed installments are deducteddirectly from the payroll of theborrower.
Payment conditionsFirst installment in up to 90 days.
Origination channels of payroll loans
Other personal loans
Payroll loans
(In R$ billion)
Evolution of personal loans portfolio
(In R$ billion)Composition of the payroll loans portfolio
(In %)
The payroll loans portfolio accounts for 58% of total operations in personal loans.
The portfolio of the personal loans accounts for 42% of total operations in personal loans.
58%
42%
$
$
Our business
Personal Loans and Payroll Loans$
Public SectorINSS Private Sector Itaú Consignado S.A.Branches
37
28.2 25.8 25.4 25.3 27.3 28.2 31.9 33.7 36.4
46.5 44.6 44.8 44.4 45.4 46.7 49.1 49.4 50.4
74.7 70.5 70.2 69.8 72.7 74.9 81.0 83.1 86.8
Jun-16 Dec-16 Jun-17 Dec-17 Jun-18 Dec-18 Jun-19 Dec-19 Jun-20

77.0% 78.4% 80.0% 82.6% 85.1% 87.0% 89.3% 91.4% 90.8%
23.0% 21.6% 20.0% 17.4% 14.9% 13.0% 10.7% 8.6% 9.2%
Jun-16 Dec-16 Jun-17 Dec-17 Jun-18 Dec-18 Jun-19 Dec-19 Jun-20
Pessoas Físicas Pessoas Jurídicas
Our business
Mortgage Loans$
Mortgage loans portfolio Products and sales channels
Environmental and social assessment on mortgage loans
Client focused
Quick and efficient process withcredit analysis in up to one hour for operations of up to R$1 million.
possibility of digitally contracting.
specialized consultants providingsupport throughout the process.
+ 9.2 %vs Jun-19
+ 13.0 %vs Jun-18
Real Estate
Brokers
29%High
Income Branches
32%Partnerships
17%Regular Branches
21%
(In R$ billion) (In %)
CompaniesIndividuals
38
Building site visit gatheringof information
Enterprise and region data
• Levantamento de Indícios de Contaminação (LIC)
• Enterprise Environmental and Social Form;
• Building site photos;
• Document analysis;
• Consultation of the Contaminated Areas Register; and
• Consultation of Google Maps.
No Environmental
License?
Indication ofcontamination?
Environmental and Social Department + Environmental and Social Legal Department +
Compliance
• Technical analysis of evidence;
• Analysis of site contamination documentation; and
• Preparation of contractual clauses and conditions for release of funds.
Risksmitigated
Operation approved
Technical analysis for construction financing
47.1 48.6 47.8 48.1 47.6 48.3 49.2 50.3 53.8
Developers0.4%
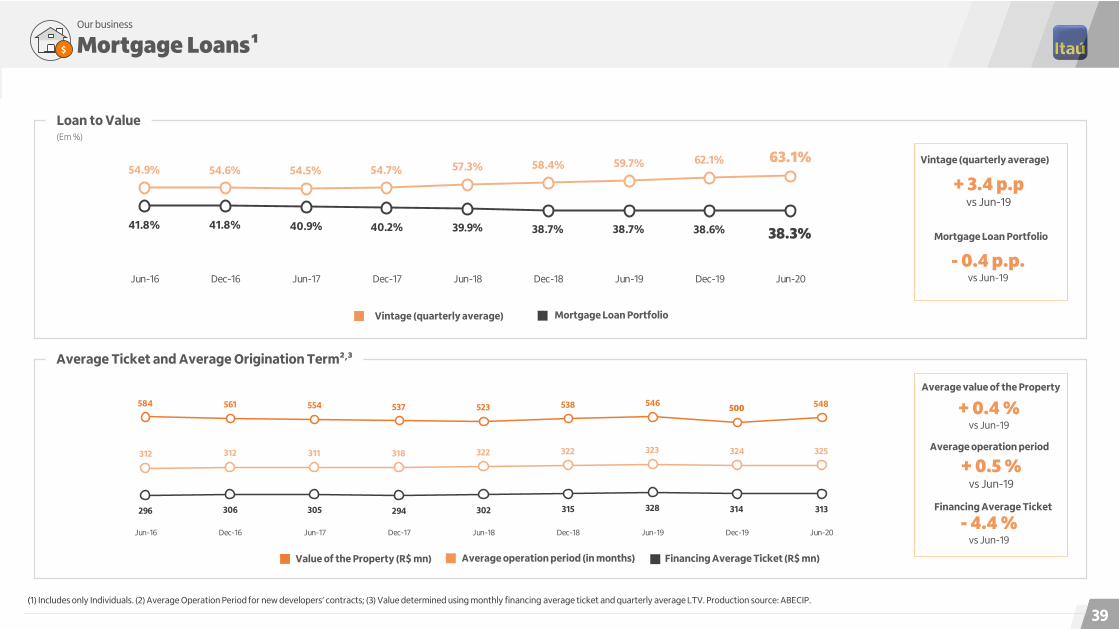
Our business
Mortgage Loans¹
Loan to Value
Average Ticket and Average Origination Term²,³
$
(Em %)
+ 3.4 p.pvs Jun-19
- 0.4 p.p.vs Jun-19
Vintage (quarterly average) Mortgage Loan Portfolio
Average operation period (in months)Value of the Property (R$ mn) Financing Average Ticket (R$ mn)
(1) Includes only Individuals. (2) Average Operation Period for new developers’ contracts; (3) Value determined using monthly financing average ticket and quarterly average LTV. Production source: ABECIP.
39
Vintage (quarterly average)
Mortgage Loan Portfolio
+ 0.5 %vs Jun-19
+ 0.4 %vs Jun-19
Average operation period
Average value of the Property
Financing Average Ticket
- 4.4 %vs Jun-19
54.9% 54.6% 54.5% 54.7% 57.3% 58.4% 59.7% 62.1% 63.1%
41.8% 41.8% 40.9% 40.2% 39.9% 38.7% 38.7% 38.6% 38.3%
Jun-16 Dec-16 Jun-17 Dec-17 Jun-18 Dec-18 Jun-19 Dec-19 Jun-20
296 306 305 294 302 315 328 314 313
312 312 311 318 322 322 323 324 325
584 561 554 537 523 538 546 500 548
Jun-16 Dec-16 Jun-17 Dec-17 Jun-18 Dec-18 Jun-19 Dec-19 Jun-20

1.8 2.3 1.8 2.5 2.6 2.9 3.0 3.5 2.1
0.3 0.4 0.5 0.8 1.0
1.6 1.9 2.5
1.1 2.1
2.6 2.3 3.2 3.6 4.5 4.8
6.0
3.2
2Q16 4Q16 2Q17 4Q17 2Q18 4Q18 2Q19 4Q19 2Q20
PF PJ
16.7 15.4 14.1 14.1 14.7 15.9 17.2 19.0 19.53.6 2.9 2.3 2.6 3.2 4.3 6.0
9.1 10.120.3 18.3 16.4 16.7 17.8 20.2 23.2 28.1 29.5
Jun-16 Dec-16 Jun-17 Dec-17 Jun-18 Dec-18 Jun-19 Dec-19 Jun-20
PF PJ
Our business
Vehicles$
40
13.2 thousand sales points;
Sale of light and heavy vehicles:
• 83% of contracts are made in stores and dealers;
• 91% to individuals;
28% made in Digital Channels;
85% of financing are made up to 48 months.
Contracting
Average Ticket (individual)
R$37.6 thousand
LTV (individual)
61%
Loan portfolio by client profile(In R$ billion)
Credit origination by client profile¹(In R$ billion)
CompaniesIndividuals
CompaniesIndividuals
(1) Includes Finame in Companies
90-day NPL Ratio ( Individuals – Vehicles)
40
(Base 100)
100
54 49
43 35 38 42
2012 2015 2016 2017 2018 2019 2Q20
+ 27.0 %
- 33.6 %
Resumption of production
11 19
31
Abril Maio Junho
Contracts - thousand
April May June

100 111
147
2018 2019 2Q20
Evolution of financing proposals on the iCarros platform:(Base 100)
Our business
Vehicles$
$
iCarros Portal
Main commercial partnerships
41
21 mn access/month 87% mobileMain products and services
Facial RecognitionSimple and safe contracting process.
ConectCarPayment of tolls and parking without queuing.
InsurancesProtection to the car and tranquility in financing.
Lead ManagerDealer platform to manage leads in one place.
Knowledge GarageDistance learning platform to training theprofessionals from the sector.
9
75
8
6
10
11
4
1
2
3 Digital ContractingIntegrated to iCarros and other digital environments, like dealers’ websites andothers e-commerces.
Credline 2.0 New proposal origination platform, with simple and renewed digital experience.
Floor PlanCredit lines for partner dealers.
iCarrosVehicle Marketplace with technologicalsolutions, that brings buyers and sellerstogether.
Eletronic signatureDigital and simple experience for the customer and the dealer.
Digital AssistantOnline credit analysis and approval platform, without additional cost for the dealer.

We are leaders in the creditcard segment in Brazil, totaling around 33.0 million credit cards and 29.8 million debit cards (both in numberof accounts).
Our credit card options serve current account holders and non-current account holders
Main brandsTo individuals, very small, small and middle-market companiesand corporate segment.
Commercial partnershipsMain partnerships with retailers and traders.
Digital portfoliosIncreased comfort and convenience to our clients.
Convenience to clientsFinancial services through credit cards.
$
$
Personalcredit
Payment of bills ininstallments
Debt renegotiation
Consumer credit
42
Our business
Credit Card
Itaucard App Benefits to our clients
Digital billing statements: Paperless. More environmentally friendly.
Timeline: To follow up consumption.
Loyalty program: Points and reward program.
Virtual card: Added security for online purchases.Virtual cards generated (2Q19 = Base 100)
1002Q19
2Q20 238
2.4x

78.6%
67.9%
10.1%
10.2%
11.3%
22.0%Transactor
Installment with Interest
Revolving Credit + Overdue Loans
13.5%¹ of total sales are carriedout using digital channels
33.4%Market ShareWe are leaders in theBrazilian credit cardMarketData base: Mar-20
40.3%² in 1Q20 + 3.6 pp vs 1Q19of household consumptionare card expenses
SFN whithout
Itaú
+2 points CustomersatisfactionGlobal NPS - Business
Composition of credit balance
2Q20
R$101.3 billions- 21.8% (vs. 1Q20)- 19.8% (vs. 2Q19)
Credit- 22.2 % (vs. 1Q20)- 20.5 % (vs. 2Q19)
Debit- 20.6% (vs. 1Q20)- 17.6% (vs. 2Q19)
Transaction Volume
43
Our business
Credit Card
(1) Considers only credit cards issued to current account holders of Branches, Uniclass e Personnalité. (2) Consider only credit and debit cards.Note: Data base refers to Jun-20 except household comsuptiom.
Debit
Credit
Total
Jun-20 vs. Aug-18
95.368 97.40375.826
30.947 32.114
25.509
126.316 129.517
101.335
2Q19 1Q20 2Q20

Our business
Acquiring services
Acquiring service revenues(R$ million)
2Q20
R$102.5 billions- 15.9% (vs. 1Q20)- 10.1% (vs. 2Q19)
credit- 18.9% (vs. 1Q20)- 16.2% (vs. 2Q19)
debit- 10.7% (vs. 1Q20)+ 1.2% (vs. 2Q19)
Transaction VolumeOur brands
accepted by Rede machines
25 brandsMore than de
+33 pointsCustomersatisfactionGlobal NPS - Business
837 thousand
Clients
1.4 mnPOS number
44
Debit
Credit
Total
1,226 1,177 1,2521,106
964 932 908737
528
2Q18 3Q18 4Q18 1Q19 2Q19 3Q19 4Q19 1Q20 2Q20
Note: Data base refers to Jun-20.
Jun-20 vs. Aug-18
74.095 76.575 62.092
39.959 45.28240.429
114.055121.858
102.521
2Q19 1Q20 2Q20

58.3% 61.9% 60.6% 60.4% 57.1%
52.7% 55.2% 53.8% 52.6% 50.5%
2Q19 3Q19 4Q19 1Q20 2Q20
Combined Ratio Extended Combined Ratio
Revenue from insurance operations/GDP (%)
Our business
Insurance
We offer a wide range of insurance products related to life, personal accidents, vehicles and property credit and travel. Ourinsurance core activities, which include our 30% interest in Porto Seguro, consist of mass-market insurance products related to lifeand property, and credit.
Ranking¹,²
Potential growth in the sector8
Combined Ratio – Recurring Activities Insurance
(1) Source SUSEP, date: May-20, includes our 30% interest in Porto Seguro. Doesn´t consider Health and VGBL is consider in Pension Plans; (2) Insurance = Earned Premiums; Pension Plans = Provision for Benefits to be Granted and Premium Bonds = Revenues from Premium Bonds; (3) Recurring insurance activities and other activities; (4) Recurring insurance activities include: Personal Insurance (Life, Personal Accidents, Unemployment, Funeral Allowance, Serious Diseases, Random Events, Credit Life), Housing, Homeowners, Multiple Peril and Travel; (5) Considers only Porto Seguro numbers; (6) Other activities include: Extended Warranty, Large Risks, DPVAT and IRB; (7) The sale of this portfolio has been concluded on October 31, 2014. (8) Sector growth potential figures for Chile, USA and South Korea refer to 2018.
45
2.9 2.9 3.0 3.2 3.3 3.43.7 3.8 3.8 3.6 3.8
2009 2010 2011 2012 2013 2014 2015 2016 2017 2018 2019
jan-may/20 jan-may/19 Model
Total Insurance 3 4th 4th
Recurring Insurance Activities 4 4th 5th
Life & Personal Accidents 2nd 2nd Bancassurance
Credit Insurance 6th 6th Bancassurance
Pension Plan 3rd 3rd Bancassurance
Premium Bonds 5th 4rd Bancassurance
Porto Seguro 3rd 3rd
Vehicles 5 Leader: Porto Seguro Leader: Porto Seguro Broker
Residential 5 Leader: Porto Seguro Leader: Porto Seguro Broker
Other Insurance Activities 6 6th 5th
Large Risks 7
Health Insurance
we do not offer this product.
we do not offer this product.
Chile: 4.7USA: 11.3South Korea: 10.5

Benefits Products OfferedMulti-channel BrokerSales Force
Our business
Insurance | Insurance Open Platform
Multi-channel distributionFocused on commissions and fees
Specialized sales force
Excellence in post-sales
Easy access and convenience to clients
Insurance consultants
Insurance Shop
Manager
Cashier
Internet Banking/Mobile
ATM
Call Center
NAC/Partners
Corban
Inte
rnal
Exte
rnal
Multi-channelBroker Platform
Retention Post-Sales Analytics
SatisfactionMarketing Client service
Relationship withclients
Vehicles
Life
Health (Companies)
Full Life
Credit Life
Dental (Individuals and Companies)
Protected Card
Premium Bonds
Mortgage
Travel
Smartphone protection
Homeowners
Corporate lines
46
Guarantee Insurance
+
Auto, Moto, Home and Pet Assistance

Our business
Pension plan
Open platform
Funds carefully selectedalways keeping the client in mind
+ 5.7% (vs. 2Q19) + 2.8% (vs. 2Q19)+ 5.1% (vs. 2Q19) VGBLPGBLTraditional
Technical Provisions
Concept 1,3,6,9: How much does the client have tosave to enjoy a peaceful retirement?
47
Retirement
Future expenses
Children education
Tax planning
Financial return
Enable easychanging of plan
Successionplanning
Reasons to invest:
1
2
3
4
5
6
7
Years of salary accumulated Age1 353 456 559 65
R$ Billion
6.6 6.8 7.0 7.0 7.2 7.3 7.4 7.5 7.7
38.1 39.2 40.6 41.7 42.8 43.5 44.9 43.8 45.0
140.4 144.0 149.0 151.6 154.8 158.1 161.4 156.5 159.2
185.2 190.0 196.6 200.4 204.8 208.9 213.6 207.8 211.8
2Q18 3Q18 4Q18 1Q19 2Q19 3Q19 4Q19 1Q20 2Q20

Main products
Zero-fee products:
Our business
Services | Investments
SavingsPension PlanFixed incomeFunds Equities Treasury Direct
Variable Income Pension Plan Fixed Income Real Estate Fund Treasury Direct
Zero custody feefor shares of Itaú Corretora and thestock exchange
Zero initial andfinal contributionfees
Zero custody fee for third party FI via Itaú Corretora
Zero brokerage andcustody fee on digital channels
Zero custodyfee - Itaú Corretora
Real Estate Funds COE
Itaú Asset ManagementThe largest private asset manager in Brazil in figures:
R$720 billlion¹assets under management
+ 60 yearsin investment management
11 timesbest fund manager by “Exame” magazine
We incorporate ESG issues intoour investment process.
Responsibleinvestments
48(1) Source: ANBIMA (Brazilian Financial and Capital Markets Association) – June - 2020. Considers Itaú Unibanco and Intrag. (2) CDB - Certificates of Banks Deposits. LCA - Agricultural Credit Bonds. LCI - Real Estate Credit Bonds
Investment Open PlatformThird-party products offered
Funds Fixed income2
Fixed IncomeMultimarketEquityPension Plan
CDBLCALCI

MiddleAnnual revenues from R$30 mn to R$500 mn
“Focused on clients with the best ratings, with 95% of the credits being rated B3 or better, and with operations in diversified services, such as Cash Management, Foreign
Exchange, Investment Banking and Funding."
Corporate BankingAnnual revenues over R$500 mn
“We offer a broad portfolio of banking products and services, ranging from“ cash management ”to structured
transactions and transactions in the Capital Market. We serve around 3,317 large business groups (includes
Agrobusiness) in addition to serving more than 240 financial institutions.”
Investment BankingLeadership position and client recognition
Markets, Products & PlanningTreasury operations for the conglomerate.
LatAmPresence in all banking segments in Latin America.
49
AgrobusinessLarge and Regional (medium size + producers)
“We serve more than 1,200 customers in the integrated agribusiness chain, from plants to rural producers, with an emphasis on Targeted products and Foreign Currency, in a
portfolio of more than R$30 billion.”
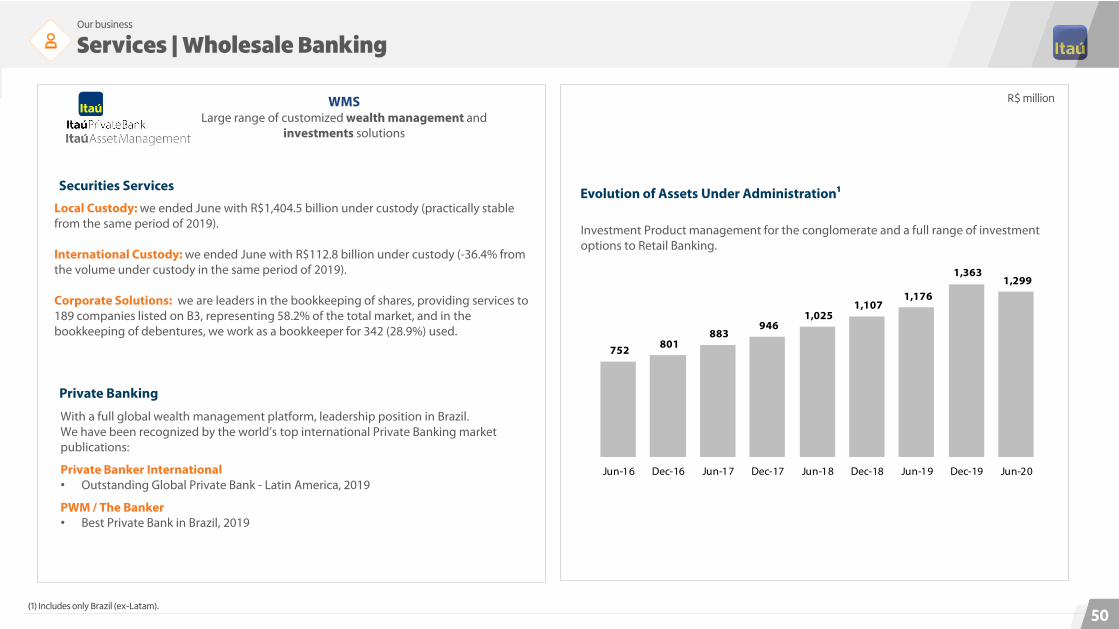
Our business
Services | Wholesale Banking
Fixed incomeWe took part in local operations with debentures, promissory notes and securitization, which totaled R$3,338 million up to June 2020, taking the second place in the ANBIMA (Brazilian Financial and Capital Markets Association) ranking.
EquitiesWe undertook 8 offerings in South America in the first semester of 2020, which totaled US$585 million, taking the second place in the Dealogic ranking.
Mergers and AcquisitionsIn the first half of 2020, we provided financial advisory on 18 transactions in South America, totaling US$757 million and maintaining the leadership position in the Dealogic ranking.
Project FinanceIn the first half of 2020, we served as advisor and/or creditor of approximately R$7.4 billion in financing to 25 different infrastructure projects in different sectors.
Ranking 2Q20 2019 2018
M&A¹ 1st 1st 1st
Local ECM¹ 2nd 1st 1st
Local DCM² 2nd 1st 1st
International DCM¹ 2nd 3rd 6th
Derivatives Total3 1st 1st 1st
(1) Source Dealogic; (2) Source ANBIMA – Brazilian Financial and Capital Markets Association. Information from Jun-20; (3) Source: Cetip. Information from Jun-20.
Our business
Services | Wholesale Banking
WMSLarge range of customized wealth management and
investments solutions
Local Custody: we ended June with R$1,404.5 billion under custody (practically stable from the same period of 2019).
International Custody: we ended June with R$112.8 billion under custody (-36.4% from the volume under custody in the same period of 2019).
Corporate Solutions: we are leaders in the bookkeeping of shares, providing services to 189 companies listed on B3, representing 58.2% of the total market, and in the bookkeeping of debentures, we work as a bookkeeper for 342 (28.9%) used.
Securities Services
With a full global wealth management platform, leadership position in Brazil.We have been recognized by the world’s top international Private Banking market publications:
Private Banker International• Outstanding Global Private Bank - Latin America, 2019
PWM / The Banker• Best Private Bank in Brazil, 2019
Private Banking
Investment Product management for the conglomerate and a full range of investment options to Retail Banking.
Evolution of Assets Under Administration1
50
752 801 883
946 1,025
1,107 1,176
1,363 1,299
Jun-16 Dec-16 Jun-17 Dec-17 Jun-18 Dec-18 Jun-19 Dec-19 Jun-20
R$ million
(1) Includes only Brazil (ex-Latam).

Our business
Services | Wholesale Banking
KineaIt is an independent platform of management of differentiated investments. With R$61.1 billion in assets as of June 2020, it operates in the segments of Multi-Markets, Real Estate, Pension Plan and Private Equity, Stock and Infrastructure.
Asset ManagementIn June 2020, we reached R$720.21 billion in assets under management.Over 60 years in investment management and 11 times best fund manager by “Exame” magazine.
Itaú Asset Management integrates ESG issues in the investment process:
51
Asset Management
Timeline of IAM responsible investment practices
(1) Source: ANBIMA (Brazilian Financial and Capital Markets Association) – June 2020. Considers Itaú Unibanco and Intrag.
2004
2008
2009
2010
2013
2014
2015
2016
2017Itaú Asset
Management launchesits Itaú Social
Excellence Fund (FIES)
Signatory toProprietary model to
incorporate ESG issuesinto the analysis of
funding fixed income
ESG issuesincorporated intothe Proxy Voting
policy
White paper on theincorporation of ESG
issues into the analysisof funding
Internal study aboutESG issues and
sovereign bonds
White paper on theincorporation of ESG
into the analysis ofcorporate securities
Launching of AMEC Stewardship Code /
Latin America
Carbon footprintcalculator for funds
2018
White paper onresponsible investment
through the SDGs lenses(image below).
2019Incorporation of ESG issues
into the analysis of more than 95% of assets under
management (AuM) of IAM
2020
White paper aboutresponsible investment in
the days of COVID-19

Corporate governance
52

Corporate governance
History of our Governance
We believe that a sound and meritocracy-based governance, guided towards long-term value creation, adds value to our business, facilitates access to capital and contributes to business continuity.
53
20081996APIMECsmeetings andRoadshows
2000Corporate Code of EthicsIndependent Fiscal Council
1999APIMECs meetings
Inclusion in the DowJones Sustainability Index
2005Trading Committee and Policy
Inclusion in the CorporateSustainability Index
1997Level III ADR
2002DisclosureCommitteeand Policy
2001Stock Option Plan
Level I of Corporate Governance of B3
2003Election of Independent Members
2007Certification under section404 of Sarbanes-Oxley Act
Merger
Highlights
2018-XP Investimentos (XP)CADE’s approval of the acquisition of a minority interest, reaffirming the independence of management – ItaúUnibanco acquired 49.9% of the capital, with 30.1% of the common shares- First woman elected on the Board of Directors- 21 years on the NYSE- 50% stock splitwith a 50% increase in dividends paid monthly;- Encouraging diversity and new Vou Como Soudress code;- Board of Directors;- General Data Protection Law as a Priority for Itaú Unibanco- 10 years of merger between Itau and Unibanco
2019- Changes in the composition of the Executive Committee:Caio Ibrahim David assumed the position of General Director of the Wholesale department and Milton Maluhy assumed the position of Vice-President of Risks and Finance, being part of the Executive Committee- The creation of the Social Responsibility Committee Approved on January 31, 2019
2020- Disclosure of the Management Members’ Compensation Policy
2017Policy for Nomination ofExecutives: minimum 30% ofindependent members in C.A.
Inclusion in the BloombergEquality Index
2008CorporateGovernancePolicy
2007Voluntary adherenceto Abrasca’s Manual forMaterial InformationControl and Disclosure
2006Certification under section404 of Sarbanes-Oxley Act
Internal Regulation of theBoard of Directors
2004Audit Committee
Creation of Dividendreinvestment program
2001Level I of CorporateGovernance of B3
Election of IndependentBoard Members
1999Inclusion in the DowJones Sustainability Index
1995Stock Option Plan
2013
Related Party Committee
2011Voluntary adherence to the Abrasca’sCode of Self-regulation and Bestpractices of Publicly-Held Companies
Remuneration Committee
2009Strategy Committee
Risk and CapitalManagement Committee
Nomination and CorporateGovernance Committee
Personnel Committee
2012Digital Assembly
2010Partners and AssociatesProgram
2015Inclusion in the SustainabilityVigeo EIRIS Index – Emerging 70
New Management Structure ofItaú Unibanco Holding
2005Nominating and Compensation Committee
Inclusion in the Corporate Sustainability Index
2002Disclosure and Trading Committee
Level II ADR Program
Tag Along

Highly diversifiedshareholder base
Corporate governance
Our governance structure
Family control, with long-term vision
ON51.71%
PN0%
ON39.21%
PN0.004%
ON7.76%
PN99.59%
Free Float
ON36.73%
PN81.87%
Free Float*
74%
Traded on B3
26%Traded on NYSE
51% Brazilians49% Foreigners
100% Foreigners
Itaú Unibanco participações
(IUPAR)ITAÚSA
Itaú Unibanco Holding S.A.
Non-voting shares (PN)4.8 billion of shares
66.5%
33.47%
33.64%
ON63.27%
PN18.13%
familyMoreira
Salles
Cia. E. Johnston de Participações66.36%
26.15% 52.95%19.91%
100%
familyEgydio de
Souza Aranha
ON50.00%
PN0%
Note: ON = Common Shares; PN = Non-voting Shares; (*) Excluding shares held by majority owners and treasury shares.54

Corporate governance
Pillars of our Governance
Family control ensuring long-term strategic vision
Responsible for value creation by means of strategicdefinition
Focus on decision-making, resolving upon high impact topicsfor the company’s destiny
• Alignment among shareholders• Defines group’s vision, mission and values• Assesses significant mergers and acquisitions• Nominates executives to the Board of Directors• Evaluation of performance and admission of family members• Discusses and approves long-term strategies
IUPAR
Itaú Unibanco Holding S.A.
Shareholders’ General Meeting
Board of Directors
Fiscal Council
Executive Committee
Committees
Disclosure and Trading Committee
Professional management with the implementation ofstrategy and day-to-day management
decisions made ona collective basis
management alignedwith meritocracy-basedculture
Focus on performance and value creation
55

Our Board of Directors consists of professionals with exceptional knowledge and expertise in different areas of expertise, some of the key differentials of our management.
Corporate governance
Board of Directors
• Defining and monitoring the strategy;• Assessing mergers and acquisitions; • Monitoring the Executive Committee performance; • Appointing officers (meritocracy);• Approving the budget;• Defining and supervising risk appetite and policies for capital use;• Defining and monitoring incentive andcompensation models and establishing goals; • Supervising the technology strategy; • Defining meritocracy policies;• Supervising the business operation.
The evaluation process of the Board of Directors iscarried out by a third-party. Each director evaluatesthemselves, the other directors and of the organ as a collegiate ”.
1
2
4
7
Risk and Capital Management
Social Responsibility Committee
3
5
6
8 Compensation Committee
Strategy Committee
Board of DirectorsCommittees
Main duties
Audit Committee
Personnel Committee
Related Parties Committee
Nomination and Corporate Governance Committee
56
2 Co-chairmenPedro Moreira SallesRoberto Egydio Setubal
9 Members, being 6 Independent membersAlfredo Egydio SetubalAna Lúcia de Mattos Barretto VillelaJoão Moreira Salles
2 4 72 4 7
Fábio Colleti BarbosaGustavo Jorge Laboissière Loyola José GallóMarco Ambrogio Crespi Bonomi Pedro Luiz Bodin de MoraesFrederico Trajano Inácio Rodrigues
2 3 4 7
24 5
3 5 8
5 8
2 4 7 86
6
6
6
3 81
1 Vice-presidentRicardo Villela Marino 6

Check Point of Executive Committee + 7
Institutional Crisis Management Committee and Check Point of Risks
Febraban and Retail War Rooms and Wholesale Committee
People, Legal, Marketing, IT, CRM and Service channels War Rooms
Executive Committee agenda
Retail War RoomMonitoring and adjusting operations in real time.
Wholesale CommitteeConsolidates the treasury, credit and ECM war rooms and monitors and adjusts their operations in real time.
Febraban* War RoomCoordination between banks and alignment with public authorities and regulators.
Check Point of Risks Closing day. Market, credit, liquidity and operational risks monitoring.
Institutional Crisis Management Committee Morning Calls. Operation monitoring. Decisions coordination. Risks and contingencies mitigation.
57
Corporate governance
COVID-19 Governance Committee
Responsible for monitoring the crisis and its impacts, deliberations and institutional positioning.
* Febraban is the Brazilian Federation of Banks.

Our committees report directly to the Board of Directors.
Corporate governance
Board of Directors Committees
since 2009
Risk and Capital Management100% of the members are non-executive12 meetings in the year
Supports the Board of Directors; establishes the riskappetite; evaluates the cost of capital x the minimum return expected; allocates capital; oversees risk management and control; improves riskculture and complies withregulatory requirements
since 2004
Audit100% of the members are independent60 meetings in the year
Ensures the integrity of thefinancial statements; complies with legal andregulatory requirements; and ensures the efficiency ofinternal controls and riskmanagement
since 2011
Compensation100% of the members are non-executive5 meetings in the year
Promotes discussions onincentive and compensationmodels; developscompensation policies for management members and employees; and establishes goals
since 2009
Nomination andCorporate Governance100% of the members are non-executive3 meetings in the year
since 2009
Personnel100% of the members are non-executive4 meetings in the year
Establishes policies for attracting and retaining talented professionals; proposes guidelines for recruiting and training employees; and presents long-term incentive programs and monitors the culture of meritocracy
since 2009
Strategy100% of the members are non-executive5 meetings in the year
Proposes budgetary guidelines; provides inputs for decision-making processes; recommends strategic guidelines and investment opportunities; and internationalizes and creates new business areas.
since 2013
Related Parties100% of the members are independent12 meetings in the year
Manages transactions between related parties; and ensures equality and transparency for these transactions
since 2018
LATAM StrategyCouncil
Assesses the outlooks for the world economy; adoptsinternationally accepted trends, codes and standards; andprovides guidelines for the Board of Directors to analyze opportunities
since 2017
Digital AdvisoryBoardProposes technologicaldevelopments; assessesclient’s experience; andfollows world trends
since 2019 NEW
Social Responsibility4 meetings in the year
Defines strategies tostrengthen our social responsibility; monitors theperformance and defines theallocation process of theRouanet Law
8committees
Strategic committees
The Board ofDirectors isresponsible for electing themembers of thecommittees for one-year terms ofoffice.
They must have proven knowledge in the respective areas of work and technical qualification compatible with their duties.
Periodically reviews the criteria for nomination and succession;provides methodological support for the assessment of the Board of Directors and Chief Executive Officer; nominates members of the Board of Directors and Senior Vice Presidents (Diretores Gerais); and analyzes potential conflicts of interests
58

Corporate governance
Our Executive Committee
• Implementing the guidelines and goals proposed by the Board of Directors;
• Carrying out business and strategies related to products and segments;• Ensuring the best allocation and management of financial, operational
and human resources;• Monitoring market, credit and operational risks; and• Leading the bank in the search for value creation.
Main duties
The Executive Committee is responsible for implementing the strategy and day-to-day management.
59
• Large and Medium Corporates • Asset Management• Institutional Treasury • Private Bank• Custody• Latin America• Investment Banking
• Branches• Cards• Rede• Real Estate• Insurance• Vehicles• Consortia• Payroll
WholesaleCaio Ibrahim David
RetailMárcio de Andrade Schettini
Risks and FinanceMilton Maluhy Filho
Legal and Human ResourcesClaudia Politanski
• IT• Operations• Procurement
• Risks• Finance
• Legal and Internal• Human Resources• Corporate Communication• Institutional and Governmental Relations•Marketing• Sustainability
IT and OperationsAndré Sapoznik
Candido Botelho Bracher• Ombudsman
Chief Executive Officer (CEO)
Senior Vice Presidents (Diretores Gerais) Executive Vice Presidents

Aiming at aligning the interests of our officers and employees with those of our shareholders, we maintain a partner and associate’ program, focused on management members and employees with outstanding performance.
Corporate governance
Partners and Associates Program
Long-term incentivesThe program offers to participants the opportunity to invest in our non-votingshares (ITUB4), receiving a return also in shares, sharing short, medium andlong-term risks.
The partners program may also considerother instruments derived from shares,
as opposed to actual shares.
The share price considered at the grant and delivery dates is calculated on the
seventh business day before of each event, considering the average closing
price in the 30 days prior to the calculation.
Any partners and associates shares not yet received will also be subject to reduction
proportional to a possible reduction in the realized recurring net income of the Issuer
or of the applicable business area.
50%3 year
50%5 years
The investmentmust be retained
for:
Net variablecompensation
PartnersEight-year term of officeEligible to successive reappointmentsPossibility to invest 50% to 100% of net variablecompensation
AssociatesFour-year term of officeEligible to two reappointments (maximum 12-year term)Possibility to invest 35% to 70% of net variable compensation
year 1 year 2 year 3 year 4 year 5 year 6 year 7 year 8
grant year
Shares received will remain unavailablefor sale for five and eight-year term as
from each investment in shares
Partners and associate receive a return on theinvestment in the program
ITUB4
Available for sale
70% associates50% partners
30% associates50% partners
Available for sale
(delivery of 50%)ITUB4
(delivery of theremaining 50%)ITUB4
60

447
363
255259290
Oct-08 Oct-10 Oct-12 Oct-14 Oct-16 Oct-18
ITUB4 - with dividend reinvestmentBank basket with dividend reinvestment¹IBOVESPA IndexDollarCDI
100
Our capital stock is comprised of 9.8 billion common shares (ITUB3) and non-voting shares (ITUB4). Non-voting shares are also traded as depositary receipts (ADR - ITUB ) on the NYSE (New York Stock Exchange).
Corporate governance
Our shares
ITUB3
Stock Exchange
R$24.00Price²
Additional payout4
Tag Along5
Voting right
Priority dividends³
Characteristics of our shares
Jun-20
R$25.45 US$4.69
80% 80% 80%
ITUB4 ITUB
Appreciation of R$ 100 investedon the date before the announcement of the merger(10/31/08) to June 30,2020
Source: Economatica
(1) Simple average of the three largest Brazilian banks ex Itaú Unibanco; (2) Closing price as of 06/30/2020, adjusted for earnings except dividends. Source: Economatica. (3) The non-voting shares will have the right to the priority minimum annual dividend (R$0.022 per share). (4) Additional payments may be made in dividends or interest on capital. ADR holders will be paid by the Custodian Bank, which will be responsible for paying the holders in an average time 10 days as from the payment in Brazil. (5) Mechanism for protecting minority shareholders in the event of a change in the Company’s shareholding control.
61

Capital and risk management
62

Through our internal capital adequacy assessment process (ICAAP), we evaluate our capital adequacy for addressing risks, represented by our regulatory capital for credit, market and operating risks, and the capital required for covering other risks.
Capital adequacy
To ensure our solidness and the availability of capital to support the growth or our business, our Reference Equity remains above the minimum levels required by the Central Bank.
Capital and risk management
Our principles of risk management
The Board of Directors is our main capital management body, responsible for approving our institutional capital management policy and the guidelines involving the institution’s level of capitalization.
preparation of managerial and regulatory reports
preparation of the capital plan, in situations of both normality and stress
We adopt a forward-looking approach when managing our capital, using the following phases:
structuring of the capital contingency and recovery plans
internal capital adequacy assessment
identification of the material risks and the evaluation of additional capital
Main indicators ascertained based on the Prudential Conglomerate on base date June 30, 2020
Basel Ratio13.5%
Reference EquityR$141 billion
Dividends and IOC in 2Q20 R$745 million (net of taxes)
Payout in 2019¹66.2%
63(1) Dividends and net interest on own capital / recurring net income

Capital and risk management
Basel III and Capital structure
Total Capital (10.25% - 12.75%)
Tier I (8.25% - 10.75%)
CET 1 (6.75% - 9.25%)
Jun-20
Additional Tier I Capital (AT1)
4,5%
1.25%
0 – 2.5%
1.5 %
2.0%
Countercyclical²
Conservation4
Common Equity Tier I
1.0 %Systemic³ACP¹
4.5%
Basel III requirement
Tier II
Our current ratio
13.5%
64
10.4%
1.4%
1.7 %
(1) ACP = Additional Principal Capital. (2) Countercyclical ACP: defined by each Central Bank. BACEN and currently set at 0%. (3) Systemic ACP: Requirement required for systemically important banks at domestic (D-SIBs) or global (G-SIBs). For Itaú Unibanco, this requirement is 1.0%. (4) Regulatory change implemented: conservation ACP from 2.5% to 1.25% from April 2020 to March 2021. As of April / 21, the conservation ACP will gradually increase, remaining again at 2.5% in April / 22. (CMN Resolution 4,783).

Capital and risk management
Payout Practice
65
66.2%
The return and growth scenario positioned the percentage to be distributed in the range of 60% to 65%
R$18.8 billionis the net amount paid and provisioned in dividends and interest on own capital in 2019
RWA 9%
2019
23.7%ROE
The percentage to be distributed may change every year based on the company’s profitability and capital demands, always considering the minimum set forth in the Bylaws.
17.5% 20.0%
5.0%
25.0%
10.0%
15.0%
22.5%
RWA growth
ROE
15.0%
65% - 70%
40% -45%
35%
70 - 75%
45 - 50%
35%
75 - 80%
50 - 55%
35 - 40%
80 - 85%
55 - 60%
40 - 45%
85% - 90%
45% - 50%
60% - 65%
Total payout simulation2019
(1) Calculated based on dividends and interest on own capital (IOC) gross of taxes over net income adjusted by the legal revenue reserves.
Dividend yieldPayout
5.5% Dividends and gross interest on own capital / net income¹
2019
2019
Dividends and net interest on own capital / recurring net income
77.6%

Capital and risk management
Capital cost management
Risk and Capital Management
Committee
Board of Directors
The cost of own capital is monitored monthly by a committee that reports to the Board of Directors.
When the monitoring indicators of the CoE exceed the monitoring range, the committee evaluates the indicators and decides whether to propose a revision of the capital cost to the Board of Directors.
Monitoring is based on in-house models, market data and evaluations of the cost of the bank’s capital and
that of the market.
The Board of Directors, then, deliberates on and approves the changes
or the ratification of the cost of own capital
We are continually striving to manage our capital allocation efficiently through an appropriate capital cost.
66

A classical model with three lines of defense: the business areas bear primary responsibility for risk management, followed by the risks area and, lastly, the audit area subordinated to the Board of Directors
Capital and risk management
How are we structured for managing risks?
General Wholesale Office
Caio Ibrahim David
General Retail Office
Marcio Schettini
Legal, Institutional and Personnel Department
Claudia Politanski
Technology and Operations
DepartmentAndré Sapoznik
Risk and Finance Control and Management Department
Milton Maluhy Filho
Board of DirectorsPedro Moreira Salles
Roberto Egydio Setubal
Itaú Unibanco HoldingCandido Bracher
Capital and Risk Management Committee
Pedro Bodin¹
Audit CommitteeGustavo Loyola¹
Internal Audit Paulo Miron
3rd line of defense
• Executive Office, Finance and Market Risk
• Investor Relations Office• Operational Risk and Compliance
Executive Office• Credit Risk, Modeling and AML
Office
Ensures that the risks are managed and sustained on the principles of risk management:• Risk Appetite• Policies• Procedures• Dissemination of the risk culture in the business
Manages the risks these generate, with responsibility for identifying, assessing, controlling and reporting
Independent review of the activities in which the institution is engaged
1st line of defense 2nd line of defense
(1) Independent director.67
Discussion of metrics and the outcome of Risk Appetite, as well as the main risk topics
Monthly monitoring of Risk Appetite

68
Credit Business
Regulatory
Technology
PeopleCorporate
Security
Market and
liquidity
Operations
Compliance
risk management fully integrated into the performance of the business
timely and preemptive action, focusing on creating increasing and sustainable value and on client centricity
widely disseminated risk culture
COVERAGE PERFORMANCE
Previous Current Future
Focus
Form
Center
Attitude
Processes Business Client
Reactive Preemptive
Reporting Challenging
Problem Solution
Capital and risk management
Risk Management

The principles of risk management define the fundamentals of risk management and risk appetite based on 6 pillars, providing guidance on how the employees of IUH work and take decisions.
Sustainability and customer satisfaction
we want to be the leading bank in sustainable performance and in customer satisfaction. We strive
to create shared value for our employees, clients, shareholders and society, ensuring the perpetuity of
our business.
Risk Culture
our risk culture extends beyond policies, procedures and processes, strengthens the individual and
collective responsibility of all employees, so that they do the right thing at the right time and in the
correct manner, respecting the ethical way of doing business.
Pricing of risk
we operate with and assume business risks we know and understand, avoiding risks we are not familiar
with or in which there is no competitive advantage, carefully evaluating the risk-return ratio.
Diversification
we have a low appetite for volatility in our results, which is why we operate with a diversified base of
clients, products and businesses, striving to diversify the risks to which we are exposed and
prioritizing lower risk business.
Operational excellence
we want to be an agile bank with a robust and stable infrastructure, to provide a high-quality service.
Ethics and respect for regulations
For us, ethics are non-negotiable. We foster a proper institutional environment, instructing our employees to cultivate ethics in relationships and
business and to abide by the rules, thereby defending our reputation.
Risk appetite consists of a 4-layer structure: principles of risk management, declaration by the Board of Directors, magnitude of the risk and metrics, and coordinates the set of guidelines on the assumption of risks.
Capital and risk management
Our risk management principles
69

Risk appetite defines the nature and level of the risks acceptable to our organization, delimiting the conditions in which our management will strive to maximize the creation of value.
‘
stipulates that we must have enough capital to protect us from a stress event without adjusting our capital structure.
establish concentration limits, foster the diversification of revenues in the search to ensure low volatility in our results and the sustainability of our business.
is centered on controlling operational risk events that could have an adverse impact on our strategy.
deals with risks that could impact our brand value and reputation.
stipulates that our liquidity should weather long periods of stress.
Capital ratios in normal and stress situations
ratings on debt issues
Exam
ples
of
met
rics LCR
NSFR
greatest credit risks
highest exposures
concentration by sectors, countries and segments
market risk concentration
Capitalization Liquidity Credit, Market and Business Operational risk Reputation
operational risk events and losses incurred
information technology
suitability indicators
media exposure
follow-up on client complaints
regulatory compliance
that underpin our risk management structure
The policy is drawn up and approved by the Board of Directors
5 dimensions
Declaration by the BD: “We are a universal bank operating mainly in LatinAmerica. With the support of our risk culture, we operate to strict standardsof ethics and regulatory compliance in the search for high-level results andgrowth with low volatility, through long-standing relationships with ourclients, correct pricing of risks, diversified sources of funding and proper useof capital.”
Capital and risk management
How do we establish our risk appetite?
It is monitored, discussed and reported on a regular basis to the executive levels, the Board of Directors and the Audit Committee
Where is Risk Appetite inserted?
Risk Appetite
Global Limits
Specific Limits
Competencies and
Policies
Board of Directors
Executive Level
70

Average VaR¹ in the quarter Liquidity Coverage Ratio (LCR) Net Stable Funding Ratio (NSFR)
(1) VAR = Value at Risk.
71
Capital and risk management
Market Risk and Liquidity Management
Solid management of liquidity and market risk
205.9
504.3
431.0
350.2 341.0
2Q16 2Q17 2Q18 2Q19 2Q20
122.8% 121.1%117.5%
122.2%116.8%
122.5%
Mar-19 Jun-19 Sep-19 Dec-19 Mar-20 Jun-20
201.7%169.5% 167.2% 179.1%
Jun-17 Jun-18 Jun-19 Jun-20

Capital and risk management
Corporate Security Mindset
Constant concern about risksBenchmark with the market with an expanded view of risk and vulnerability testing throughout the perimeter.
Market leadershipDialogue and vision of trends with the main stakeholders and regulatory bodies in the category.
Sustainable and Efficient SolutionsAutomation of cyber security with the use of Analytics, guided by the main frameworks of Information Security.
Integration with Business and Technology
Presence with the IT and Business teams in the risk assessment of new products and services.
Security GovernanceEffectiveness and adequacy of our controls
based on clear and objective policies.
› Secure development› Secure infrastructure architecture› Data observability
protect by design› 24X7 Operations Center› Prevention, detection and response to threats› Constant blue team x red team exercises› Frequent and controlled pen testing
process discipline› Attraction, training and retention program› Continuous search for international benchmarking› Integration with the business› SI certified team
human capital
Security as a StrategyPreparation for the future with Research &
Development of controls and technologies.
72
Employees

Capital and risk management
Information Security
technological infrastructure to face the constant evolution of cyber threats
application of corporate principles and guidelines for the protection of information and intellectual property
architecture of solutions and products with the highest degree of security together with the business and technology areas
maintaining the safety of current products, allowing for safe and efficient expansion
vulnerability management and adherence to security standards in a
technological environment
internal and external intrusion tests and scans in the environment, in order to reduce the risks of
attacks, image, exposure and information leakage
administration of security tools with a certified and specialized team in the most diverse technologies
monitoring and handling all types of attacks and security incidents
Gov
erna
nce
and
Proj
ects
Operations
Our processes guarantee the care and focus necessary to protect our environment ...
Gov
erna
nce
and
Proj
ects
Operations
73
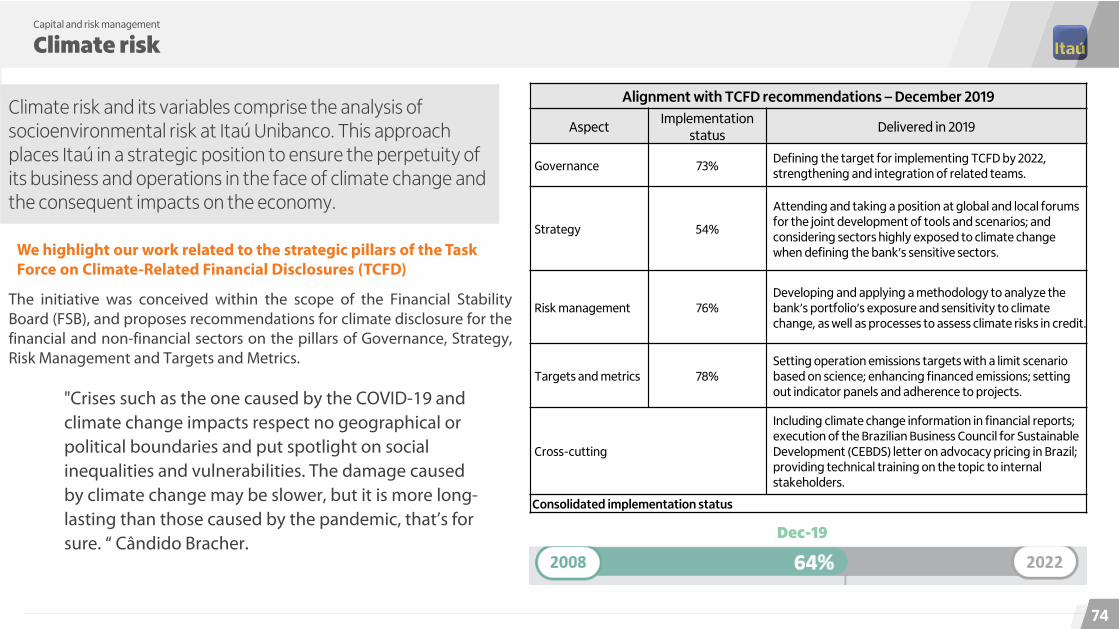
Capital and risk management
Climate risk
74
Climate risk and its variables comprise the analysis of socioenvironmental risk at Itaú Unibanco. This approach places Itaú in a strategic position to ensure the perpetuity of its business and operations in the face of climate change and the consequent impacts on the economy.
We highlight our work related to the strategic pillars of the Task Force on Climate-Related Financial Disclosures (TCFD)
The initiative was conceived within the scope of the Financial StabilityBoard (FSB), and proposes recommendations for climate disclosure for thefinancial and non-financial sectors on the pillars of Governance, Strategy,Risk Management and Targets and Metrics.
Alignment with TCFD recommendations – December 2019
AspectImplementation
statusDelivered in 2019
Governance 73%Defining the target for implementing TCFD by 2022, strengthening and integration of related teams.
Strategy 54%
Attending and taking a position at global and local forums for the joint development of tools and scenarios; and considering sectors highly exposed to climate change when defining the bank’s sensitive sectors.
Risk management 76%Developing and applying a methodology to analyze the bank’s portfolio’s exposure and sensitivity to climate change, as well as processes to assess climate risks in credit.
Targets and metrics 78%Setting operation emissions targets with a limit scenario based on science; enhancing financed emissions; setting out indicator panels and adherence to projects.
Cross-cutting
Including climate change information in financial reports; execution of the Brazilian Business Council for Sustainable Development (CEBDS) letter on advocacy pricing in Brazil; providing technical training on the topic to internal stakeholders.
Consolidated implementation status
Dec-19
"Crises such as the one caused by the COVID-19 and climate change impacts respect no geographical or political boundaries and put spotlight on social inequalities and vulnerabilities. The damage caused by climate change may be slower, but it is more long-lasting than those caused by the pandemic, that’s for sure. “ Cândido Bracher.

E&S Risk Management in Credit Granting includes actions and criteria adopted by Itaú to analyze specific clients, products and operations, and establish real estate guarantees. To this end, we factor in:
Exclusion ListThe Exclusion List applies to all client segments and includes activities that are contrary to our values. Therefore, we do not grant credit to:• Use of labor analogous to slavery;• Use of child labor in a manner that is not in
accordance with legislation; • Exploitation of prostitution, including child
prostitution.
Sensitive SectorsClients in the sectors mentioned below submitted to internal higher level credit approval authorities are also submitted to a qualitative-quantitative ESG analysis that directly impacts their risk rating:• Mining• Steel and iron and metals• Oil and gas• Textile • Pulp and paper• Chemical and Petrochemical
Agribusiness: Rural ClientsFor rural producer clients, we apply a proprietary analysis methodology that takes into account georeferenced reports on our clients’ real estate properties and in-person visits, which enable us to categorize and distinguish clients based on scores.
Real Estate Guarantees The existence of E&G liabilities is assessed, including contamination, before pledging urban and rural real estate as guarantees. In certain cases, these liabilities are taken into account to value the guarantee and the borrower may be required to replace the real estate property pledged as collateral.
List of Restricted ActivitiesBased on the existing risk and internationally recognized market practices, we follow specific guidelines for granting and renewing credit to the sectors below:• Firearms • Tobacco • Extraction of wood• Fishing• Cold storage plants and cattle slaughterhouses
Risk and capital management
E&S Risk in Credit Granting
Products and Specific OperationsNew products, as well as the structuring of specific operations, including project related operations, undergo an E&S risk assessment before starting operations and/or at closing the deal. This analysis can include an Action Plan to be followed up/monitored with the client over the financing term
75

Economic context
76

Economic context
Our expectations¹
Brazil
Chile
Colombia
Argentina
Peru
2014 2015 2016 2017 2018 2019 2020 ² 2021 ²
(1) Source: Brazilian Central Bank, FGV, IBGE, IMF, Bloomberg and Haver. (2) Source: Itaú Unibanco Holding analysis. (3) Unemployment Rate measured by PNAD Contínua.
77
GDP - World 3.6% 3.5% 3.3% 3.7% 3.7% 1.8% -3.9% 5.8%GDP - USA 2.5% 2.9% 1.6% 2.4% 2.9% 2.3% -5.0% 4.0%GDP - Euro Zone 1.4% 2.0% 1.9% 2.7% 1.9% 1.2% -8.0% 5.0%GDP - China 7.4% 7.0% 6.8% 6.9% 6.6% 6.1% 2.0% 7.5%
GDP 0.5% -3.5% -3.3% 1.3% 1.3% 1.1% -4.5% 3.5%Interest Rate (End of Period SELIC) 11.75% 14.25% 13.75% 7.00% 6.50% 4.50% 2.00% 3.00%Interest Rate (Annual Average SELIC) 11.0% 13.6% 14.2% 9.9% 6.6% 6.0% 2.8% 2.2%Inflation (IPCA) 6.4% 10.7% 6.3% 2.9% 3.7% 4.3% 1.8% 2.8%FX Rate (R$ / US$, End of Period) 2.66 3.96 3.26 3.31 3.88 4.03 5.75 4.50National Unemployment Rate ³ (Year Avarage) 6.8% 8.5% 11.5% 12.7% 12.3% 11.9% 14.7% 16.3%
GDP 1.8% 2.3% 1.7% 1.2% 3.9% 1.1% -7.0% 4.5%Interest Rate 3.00% 3.50% 3.50% 2.50% 2.75% 1.75% 0.50% 0.50%Inflation (IPC) 4.6% 4.4% 2.7% 2.3% 2.6% 3.0% 2.3% 2.9%FX Rate (Ch$ / US$, End of Period) 606 709 670 615 694 753 800 770National Unemployment Rate ³ (Year Avarage) 6.5% 6.3% 6.7% 7.0% 7.4% 7.2% 10.4% 8.7%
GDP 4.5% 3.0% 2.1% 1.4% 2.5% 3.3% -6.0% 4.5%Interest Rate 4.50% 5.75% 7.50% 4.75% 4.25% 4.25% 2.00% 2.00%Inflation (IPC) 3.7% 6.8% 5.8% 4.1% 3.2% 3.8% 2.0% 3.0%FX Rate (Co$ / US$, End of Period) 2377 3175 3002 2932 3254 3287 3800 3700National Unemployment Rate ³ (Year Avarage) 9.1% 8.9% 9.2% 9.4% 9.7% 10.5% 17.0% 14.0%
GDP -2.5% 2.7% -2.1% 2.7% -2.5% -2.2% -10.9% 4.0%Interest Rate 20.38% 27.25% 19.88% 23.25% 49.50% 39.40% 24.00% 24.00%Inflation (IPC) 38.0% 26.9% 41.0% 24.8% 47.6% 53.8% 40.0% 50.0%FX Rate (Ar$ / US$, End of Period) 8.55 13.01 15.85 18.77 37.81 59.90 88.00 130.00National Unemployment Rate ³ (Year Avarage) 7.3% 6.5% 8.5% 8.3% 9.2% 9.8% 12.0% 11.5%
GDP 2.4% 3.3% 4.0% 2.5% 4.0% 2.2% -11.9% 9.6%Interest Rate 3.50% 3.75% 4.25% 3.25% 2.75% 2.25% 0.25% 0.75%Inflation (IPC) 3.2% 4.4% 3.2% 1.4% 2.2% 1.9% 0.5% 1.2%FX Rate (Pe$ / US$, End of Period) 2.98 3.41 3.36 3.24 3.37 3.31 3.40 3.40National Unemployment Rate ³ (Year Avarage) 5.9% 6.5% 6.7% 6.9% 6.6% 6.6% 8.5% 7.5%

Economic Context
Current outlook
78
100
55
9184
03-13 03-28 06-09 07-25
Considers the consumption of goods, services (in Itaucard operations) and a proxy for industrial electricity.
Itaú Economic Activity Index (base 100 = March level, pre-crisis).
(1) Forecast by Itaú Unibanco Economic Team.
GDP% change
-10.6%Prospect¹
2Q20 vs. 1Q20
Interest rate - % SELIC (end of period)
2.25%-225 bps
(July-20 vs. Dec-19)
Government measures
~R$370B~5% of GDP
(Mar. to July-20)
Formal Jobs(CAGED, seasonally adjusted)
-1.3MSecond quarter
of 2020
Economic indicators
Indicators suggest economic activity hit the bottom in April and already shows signs of rebounding.

Economic context
Low inflation scenario spreads into 2021
79
IPCA breakdown
Our 2020 inflation forecast remains at 1.8%. After an accumulated deflation of 0.7% in April and May, short-term inflation will likely reach positive ground again, pressured by a few regulated items (gasoline, electricity, and medication).
Our 2021 estimate remains at 2.8%. There are no signs of significant inflationary pressures over the relevant monetary policy horizon.
1%
3%
5%
7%
9%
11%
13%
15%
17%
Dec‐11
Dec‐12
Dec‐13
Dec‐14
Dec‐15
Dec‐16
Dec‐17
Dec‐18
Dec‐19
Dec‐20
Dec‐21
Selic interest rateItaú Unibanco's expectation
2.8%
0.1%2.1%
-4%
0%
4%
8%
12%
16%
20%
Dec-12 Dec-13 Dec-14 Dec-15 Dec-16 Dec-17 Dec-18 Dec-19 Dec-20 Dec-21
YoY
IPCAMarket-Set (76%)
Regulated prices (24%)
Jun-20

Economic context
High fiscal risks
80
Primary result - % of GDP
‐0.6
‐1.9‐2.5
‐1.7 ‐1.6‐0.9
‐11.0
‐2.5
-13.0
-11.0
-9.0
-7.0
-5.0
-3.0
-1.0
2014 2015 2016 2017 2018 2019 2020E 2021E
1
2For 2021, we expect an increase in social spending of around 0.9% ofGDP (BRL 67 billion), partially financed by a tax burden raise of 0.2%of GDP (BRL 20 billion).
3 Gross public debt is expected to reach 92% of GDP in 2020 and 90%of GDP in 2021, up from 76% of GDP in 2019.
Our 2020 primary deficit estimate worsened to 11.0% of GDP (BRL800 billion) from 10.2% (BRL 740 billion), while our deficit forecast for2021 went to 2.5% (BRL 200 billion) from 2.2% of GDP (BRL 175 billion).
4In the event of further fiscal deterioration, the economic recoverywould be even more impaired, and maintaining interest rates closeto historical lows could become unfeasible.

Financial highlights
81

82
Financial Highlights2Q20
Espaço reservado para rodapé
Credit Portfolio
R$811.3 bn
Jun-19 Sep-19 Dec-19 Mar-20 Jun-20
674.5703.4 722.6
788.3 811.3
In R$ billions
R$4.2 bn2Q19 3Q19 4Q19 1Q20 2Q20
7.0 7.2 7.33.9 4.2net income
Recurring
13.5 %Recurring ROE
Recurring ROE (%)
Average Cost of Capital (%)
2Q19 3Q19 4Q19 1Q20 2Q20
12.5%12.5%13.0% 13.0%
23.7%23.5%23.5%
13.5%
12.5%
12.8%
Cost of Credit ¹
R$7.8 bn
2Q19 3Q19 4Q19 1Q20 2Q20
4.0 4.5 5.810.1
7.8
(1) Provision for Loan Losses + Recovery of Loans + Impairment + Discounts Granted

83
Credit portfolio2Q20
Note: (1) Does not consider origination of credit card. overdraft. debt renegotiation and other revolving credits. Average origination per working day in the period. except for private securities issuance. (2) Does not include private securities issuance. (3) Source: ANBIMA (Brazilian Financial and Capital Markets Association). Considers total volume of fixed income and hybrid private securities issuance arranged by Itaú Unibanco on the local market (includes distributed volumes).
Credit origination¹
Change in personal loans
1H20 vs. 1H19
5%
Very Small, Small and Middle Market
Individuals
Corporate
Private securities issuance³
Total Brazil ²
13%
59%
29%
+
+
+
+
-- 16%
In R$ billions
Total Brazil
Individuals + SME’s Loans
Individuals
Credit card loans
Personal loans
Payroll loans
Vehicle loans
Mortgage Loans
Very Small, Small and Middle Market Loans
Corporate loans
Credit operations
Corporate Securities
Latin America
Total with Financial Guarantees and Corporate Securities
Total (ex-foreign exchange rate variation)
Jun-20
228.8
72.9
37.3
50.4
19.5
48.8
107.4
336.2
259.2
175.4
83.9
595.5
215.9
811.3
-3.9%
-13.1%
-0.2%
0.2%
0.3%
3.5%
2.8%
-1.8%
3.6%
2.0%
7.1%
0.5%
10.4%
2.9%
0.1%
Mar-20
238.1
83.8
37.4
50.3
19.4
47.2
104.5
342.6
250.2
171.9
78.3
592.8
195.6
788.3
810.8
Jun-19
222.3
79.3
32.8
49.1
17.2
44.0
83.1
305.4
203.4
146.4
56.9
508.8
165.7
674.5
736.7
2.9%
-8.1%
13.7%
2.6%
13.2%
11.0%
29.3%
10.1%
27.5%
19.8%
47.3%
17.0%
30.2%
20.3%
10.1%Installment credit
Personalised credit
Jun-20 vs. Mar-20
Overdraft
+ 44%
- 23%
- 36%811.3

84
17.0 15.8 15.4 16.5
(1.3) (0.6) (0.7) (0.04)
0.7 0.2 0.1 1.0
1Q20 1Q20Working Capital
and Other
1Q20Spread-Sensitive
Operations
Retail ProductMix
Segment Mix Asset Spreads Average AssetPortfolio
Latin America(ex-Brazil)
Other 2Q20Spread-Sensitive
Operations
2Q20Working Capital
and Other
2Q20
Change in financial margin with clientsR$ billion
Annualized average rate % - Consolidated
Financial margin with clients2Q20
Annualized average rate % - Brazil
(1) Includes capital allocated to business areas (except treasury), in addition to the corporation's working capital. (2) Mix of segments: lower share of the Retail portfolio and higher share of the Wholesale portfolio. (3) Includes the liability margin and structured wholesale operations.
R$0.3 bn
Financial Margin with Clients Risk-adjusted Financial Margin with Clients
13
1
9.9% 9.8% 9.8% 10.0% 10.0% 10.0% 10.0% 9.2%8.4%
7.6% 7.7% 7.6% 7.6% 7.5% 7.4% 6.7%
3.7% 4.3%
2Q18 3Q18 4Q18 1Q19 2Q19 3Q19 4Q19 1Q20 2Q20
12.2% 12.1% 11.8% 12.1% 12.2% 12.2% 11.9% 11.1% 10.2%
9.5% 9.6% 9.2% 9.2% 9.2% 9.0% 8.4%
4.1%5.2%
2Q18 3Q18 4Q18 1Q19 2Q19 3Q19 4Q19 1Q20 2Q20
2

85
227%
247%
341%
172%193%
212%208%239%
281%399%
638%
920%
Jun-19 Sep-19 Dec-19 Mar-20 Jun-20
2.4% 2.6% 3.3%5.3%
3.9%
2Q20 Provision from loan losses
Expected loss provisioning modelAllocation oftotal provisions
Potential lossRelated to expected loss in retail segment and potential loss in the wholesale segment.
Aggravated risk ratings Related to aggravated risk rating of overdueand renegotiated operations
Overdue operationsRelated to minimum provision required due to overdue operations
+ 99.4%R$12.8 bn
+ 19.6%R$1.9 bn
+ 13.8%R$1.5 bn
Jun-20 vs. Jun-19
+ 48.9%
Expected loss
Total
12.1
11.4
25.7
49.3
10.7
9.5
12.9
33.1
13.0
11.5
22.6
47.1
Jun-19
(1) Provision for Loan Losses + Recovery of Loans + Impairment + Discounts Granted; (2) Average loan portfolio balance with financial guarantees provided and corporate securities considers the last two quarters.
Mar-20 Jun-20
Cost of credit¹
ratio between the annualized cost of credit¹and the loan portfolio² - (%)
Coverage ratio(90 days NPL - %)
Wholesale - Brazil
Latin America
Total
Retail - Brazil
In R$ billions
2Q19 3Q19 4Q19 1Q20 2Q20
4.0 4.5 5.8
10.17.8

86
Credit quality2Q20
15-90 days NPL (%)
3.4%3.2% 3.1%
3.5%
2.4%
1.6%1.4% 1.6%
1.9%
1.0%
0.9% 0.7%
1.2%
0.7% 0.9%
2.5% 2.5%2.3%
3.0%
1.9%
Individuals Very Small, Small and Middle Market companiesCorporateTotal Latin AmericaBrazil
90 days NPL (%)
4.5% 4.7% 4.8%5.1% 5.0%
2.4% 2.3% 2.3% 2.3%2.0%
1.8%
1.4%
0.5%1.1%
0.7%1.4%
1.4%1.9% 2.0%
1.4%
2.9% 2.9% 3.0% 3.1%2.7%
3.5% 3.4% 3.4% 3.5%3.2%
Jun-19 Sep-19 Dec-19 Mar-20 Jun-20
2.5% 2.3%
2.3%
2.6%
1.7%2.4%2.2%
2.4%
2.4%
1.7%
Jun-19 Sep-19 Dec-19 Mar-20 Jun-20

87
Sale of shares - B3Financial margin with the market – Brazil¹
Financial margin withthe market– Latin America²
1 year moving average offinancial margin with the market
(1) Includes units abroad ex-Latin America; (2) Excludes Brazil.
In R$ billions
2Q20 Financial margin with the market
0.5 0.3 0.5 0.3 0.5 0.4 0.6 0.40.6
0.20.9
1.00.5 0.9
1.1 1.0 0.7
0.4
0.7
1.3 1.3 1.1 1.21.6 1.5 1.3
0.8
1.3
1.5 1.4 1.41.2 1.3 1.4 1.4
1.3 1.2
2Q18 3Q18 4Q18 1Q19 2Q19 3Q19 4Q19 1Q20 2Q20

88
100
138
77
101
100
131
70
91
2Q20 Commissions, fees and result from insurance operations
(1) Includes fund management fees and consorcio management fees; (2) Result from insurance includes the revenues from insurance, pension plan and premium bonds operations net of retained claims and selling expenses;
In R$ billions
Collection Services
Credit and debit cards
Card issuance
Acquiring
Current account services
Asset management¹
Advisory services and brokerage
Credit operations and guarantees provided
Other
Commissions and fees
Latin America (ex-Brazil)
Commissions, fees and resultfrom insurance
2Q20
2.5
2.0
0.5
1.8
1.3
0.8
0.5
0.4
0.3
8.4
0.7
9.9
1.5Result from insurance operations²
1H20
5.5
4.3
1.3
3.8
2.8
1.7
1.1
0.9
0.6
17.9
1.4
21.0
3.1
1H19
6.5
4.4
2.1
3.7
2.3
1.0
1.3
1.0
0.5
17.7
1.5
21.0
3.3
-14.5%
-3.0%
-38.9%
3.4%
19.5%
73.2%
-10.7%
-6.9%
17.2%
1.3%
-2.0%
0.0%
-6.7%
-16.9%
-13.3%
-28.3%
-6.3%
-13.2%
-15.9%
-19.2%
-7.4%
3.9%
-11.8%
0.6%
-10.5%
-2.9%
1Q20
3.0
2.3
0.7
2.0
1.5
0.9
0.6
0.5
0.3
9.5
0.7
11.1
1.6
Monthly card transaction volumeBase 100 = Jun/19
AcquiringServices
Issuance
Jun-19 Dec-19 Apr-20 Jun-20
Open Platform
In R$ billion s(end of period)
Mar-20 Jun-20
257275 7.2 %

89
3.7% 2.4% 1.8%-0.7%
0.4% -0.5%-2.5%
-4.0%
2Q19 3Q19 4Q19 1Q20 2Q20
2Q20 Non-interest expenses
Focus in technology
Non-interestexpensesgrowing at a slower pacethan inflation
Non-interest expenses growthyear over year
Non-interest expenses growthcompared to the same period of the previous year (deflated by IPCA)
(1) Includes operating expenses and other tax expenses (Includes IPTU, IPVA, IOF and others. Does not include PIS, Cofins and ISS); (2) Does not consider overhead allocation.
+802 employeeshired by the Technology area in the quarter+1,327 employees in the last 12 months.
Zup1,448 employees incorporated in the quarter
Personnel Expenses
Administrative Expenses
Other¹
2Q20
(5.1)
(4.0)
(1.1)
Total - Brazil (10.3)
In R$ billions
1H20
(10.3)
(8.0)
(2.4)
(20.8)
-4.9%
-3.7%
0.0%
-3.9%
1H19
(10.8)
(8.3)
(2.4)
(21.6)
Non-interest expenses (12.1) (24.2) -2.6%(24.8)
Latin America (ex-Brazil)² (1.8)
-6.8%
2Q19
(5.5)
(4.2)
(1.3)
(11.1)
-4.4%(12.7)
12.1%(1.6) (3.4) 5.6%(3.2)
-7.4%
-5.2%
-9.9%
-9.0%
-6.8%

90
June 2020
10.3%
1.7%12.0%
10.4%
1.7%12.1%
Mar-20Tier I Capital
Net incomeand dividends
Prudential adjustments¹
RWA of credit² RWA of the Market³
Jun-20Tier I Capital
2Q20 Capital
(1) Tax credits, goodwill and intangible assets; (2) credit risk exposures (RWACPAD); (3) market risk capital requirement (RWAMINT)
0.3%
0.2% 0.1%0.1%
0.1%

91
2020 Perspectives
Note: The perspectives presented on this slide should not be taken as a formal projection of financial performance for the year 2020.
Due to the lack of predictability of the extent and depth of the current crisis, we will keep the 2020 forecast suspended
Capital and liquidity at appropriate levels considering our internal stress test scenarios.
In the short term, the credit portfolio will continue to expand proportionally more in the corporate segment, while more flexible repayment conditions for individuals, very small and small companies will likely keep the portfolio stable in these segments. This trend of change in mix may reverse if there is an increase in demand for credit from individuals and/or more activity from capital markets.
Possible reduction in the average rate of the financial margin with clients (NIM) due to the progressive change in the credit portfolio mix and the impact of the lower interest rate on the remuneration of working capital and liability margin.
Quarterly growth of commissions, fees and results from insurance in line with the recovery trend of economic activity and the reopening of capital markets
Possible reduction in the cost of credit in the short term - anchored in the expected loss model that will react promptly to changes in the country's macroeconomic scenario and the financial conditions of our clients.
Strategic cost management based on continuous investment in technology, new ways of working, optimization of distribution channels, in addition to structural efficiency projects will continue to bring benefits in the coming quarters.

Additional information
92

Corporate profileAdditional information
93

Additional Information
A History of Successful Strategic Deals¹
(1) Includes mergers, acquisitions, joint-ventures and partnerships.
Foundationof Banco
Itaú
Casa Moreira
Salles
Banco delBuen Ayre
BEG
Alliance with:
Unibanco
Itaú
1924
1943
1995 - 1998
NACIONAL
2000 - 2003 2004 - 20072009 - 2020
Uruguay Retail - Brazil
Acquisition of the minority interest of: Banco Itaú BMG Consignado
Acquisition of aminority interest in:
Merger 2008
Acquisition of the remaining 50% of:
94

Capital and risk managementAdditional information
95

Additional Information
Capital Ratios (BIS) | Prudential Conglomerate ¹
(1) Includes financial institutions, consortium managers, payment institutions, companies that acquire operations or directly or indirectly assume credit risk and investment funds in which the conglomerate substantially retains risks and benefits.96
In R$ millions, end of period 2Q20 1Q20
Core Capital 108,119 107,668
Tier I (Core Capital + Additional Capital) 126,214 124,980
Referential Equity (Tier I and Tier II) 140,650 139,218
Total Risk-weighted Exposure (RWA) 1,040,622 1,043,517
Credit Risk-weighted Assets (RWACPAD) 922,909 917,107
Operational Risk-weighted Assets (RWAOPAD) 92,476 92,476
Market Risk-weighted Assets (RWAMINT) 25,237 33,934
Core Capital Ratio 10.4% 10.3%
Tier I Ratio 12.1% 12.0%
BIS (Referential Equity / Total Risk-weighted Exposure) 13.5% 13.3%

Additional Information
Ratings
FitchRatings
Moody’s
Standard& Poor’s
97
Viability SupportLong Term Short Term Long Term Short Term Long Term Short Term
bb 4 BB B BB B AAA (bra) F1+ (bra)
International National Local Currency Foreign Currency
Subordinated DebtForeign Currency
Senior Unsecured DebtForeign Currency
Long Term Long Term Long Term Short Term Long Term Short Term(P) B1 (P) Ba3 Ba3 NP A1. br BR-1
International National
IssuerIssuer
Local Currency
Long Term Short Term Long Term Short Term Long Term Short TermBB- B BB- B brAAA brA-1+
International National Local Currency Foreign Currency

Economic contextAdditional information
98

99Source: Central Bank of Brazil. (1) Monthly GDP – Itaú Unibanco of May-20 is a projection.
-15.0%
-10.0%
-5.0%
0.0%
5.0%
10.0%
-23.0%
-13.0%
-3.0%
7.0%
17.0%
27.0%May‐14
May‐15
May‐16
May‐17
May‐18
May‐19
May‐20
Credit grant – Individuals – 12 monthsAcum. Growth 12 months (left)
Credit grant – Companies – 12 monthsAcum. Growth 12 months (left)
Monthly GDP - Itaú Unibanco¹Acum. Growth 12 months
80,000
130,000
180,000
230,000
280,000
May‐14
May‐15
May‐16
May‐17
May‐18
May‐19
May‐20
Credit grant – Individuals – 3 monthsCredit grant – Companies – 3 months(in R$ millions constants of May. 2020)
Additional Information
Brazil | Economic context
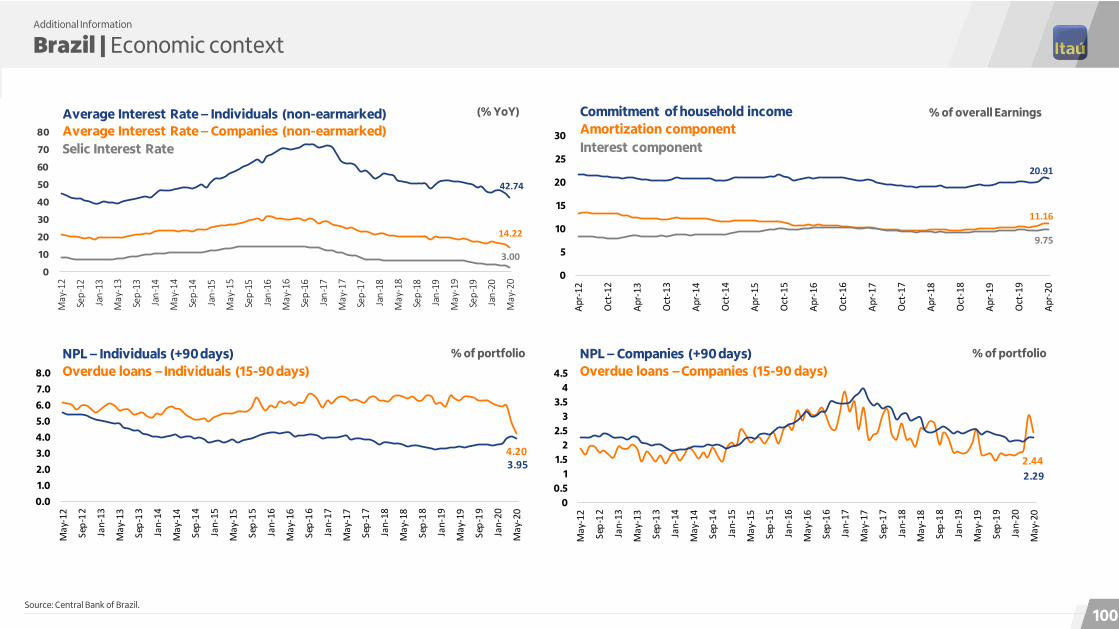
100Source: Central Bank of Brazil.
14.22
42.74
3.000
10
20
30
40
50
60
70
80
May‐12
Sep‐12
Jan‐13
May‐13
Sep‐13
Jan‐14
May‐14
Sep‐14
Jan‐15
May‐15
Sep‐15
Jan‐16
May‐16
Sep‐16
Jan‐17
May‐17
Sep‐17
Jan‐18
May‐18
Sep‐18
Jan‐19
May‐19
Sep‐19
Jan‐20
May‐20
Average Interest Rate – Individuals (non-earmarked)Average Interest Rate – Companies (non-earmarked)Selic Interest Rate
11.16
9.75
20.91
0
5
10
15
20
25
30
Apr‐12
Oct‐12
Apr‐13
Oct‐13
Apr‐14
Oct‐14
Apr‐15
Oct‐15
Apr‐16
Oct‐16
Apr‐17
Oct‐17
Apr‐18
Oct‐18
Apr‐19
Oct‐19
Apr‐20
Commitment of household incomeAmortization componentInterest component
4.203.95
0.0
1.0
2.0
3.0
4.0
5.0
6.0
7.0
8.0
May‐12
Sep‐12
Jan‐13
May‐13
Sep‐13
Jan‐14
May‐14
Sep‐14
Jan‐15
May‐15
Sep‐15
Jan‐16
May‐16
Sep‐16
Jan‐17
May‐17
Sep‐17
Jan‐18
May‐18
Sep‐18
Jan‐19
May‐19
Sep‐19
Jan‐20
May‐20
NPL – Individuals (+90 days)Overdue loans – Individuals (15-90 days)
2.442.29
00.5
11.5
22.5
33.5
44.5
May‐12
Sep‐12
Jan‐13
May‐13
Sep‐13
Jan‐14
May‐14
Sep‐14
Jan‐15
May‐15
Sep‐15
Jan‐16
May‐16
Sep‐16
Jan‐17
May‐17
Sep‐17
Jan‐18
May‐18
Sep‐18
Jan‐19
May‐19
Sep‐19
Jan‐20
May‐20
NPL – Companies (+90 days)Overdue loans – Companies (15-90 days)
(% YoY)
% of portfolio% of portfolio
% of overall Earnings
Additional Information
Brazil | Economic context

Total Credit (R$ billion) ¹ Growth in credit per customer (% YoY, nominal) ²
101
Credit growth by type of control (% YoY, nominal)²³ Market Share of private banks vs. public banks (%)³
(1) Information for 2020 refers to data available disclosed on a monthly basis. (2) Total Credit includes earmarked and non-earmarked loans. (3) As of July 2016, HSBC Brazil retail operations are consolidated into Bradesco operations. Source: Central Bank of Brazil
1,295 1,428 1,511 1,588 1,584 1,527 1,621 1,816 2,102
847 1,060
1,287 1,505 1,574 1,551 1,496 1,475 1,494
2,142 2,487
2,798 3,092 3,158 3,078 3,118 3,291
3,596
May‐12 May‐13 May‐14 May‐15 May‐16 May‐17 May‐18 May‐19 May‐20
Total Non Earmarked Credit Total Earmarked Credit
18.2
9.4
26.7
2.510.3
10.216.5
30.4
May-12 May-13 May-14 May-15 May-16 May-17 May-18 May-19 May-20
Total State OwnedDomestic Private Foreign Private
17.7
10.3
18.8
8.5
18.2
9.3
May-12 May-13 May-14 May-15 May-16 May-17 May-18 May-19 May-20
Companies Individuals Total
44.7 46.9
38.2 35.3
17.1 17.8
May-12 May-13 May-14 May-15 May-16 May-17 May-18 May-19 May-20
State Owned Domestic Private Foreign Private
Additional Information
Brazil | Economic context

102Source: Central Bank. (1) Source: Central Bank of each selected country. Reference date: Brazil´s data refer to May-20. Chile and Colombia refer to Dec-19 and Mexico refer to Sep-19. Other countries refer to Nov-19.
Credit evolution/GDP (Brazil %)
Credit/GDP ¹ (% in 2019)
Mortgage loans evolution/GDP (Brazil %)
Mortgage loans/GDP¹ (% in 2019)
47.0 49.5 50.4 52.6 52.048.0 46.6 46.8 49.7
May-12 May-13 May-14 May-15 May-16 May-17 May-18 May-19 May-20
5.5 6.7 7.9 9.2 9.7 9.7 9.5 9.3 9.6
May-12 May-13 May-14 May-15 May-16 May-17 May-18 May-19 May-20
50
94
33 4583
11686
147 13192
6910
2711 6
3849
31
48
67
4129
Additional Information
Brazil | Economic context

The Central Bank has a positive agenda for improving competitiveness and quality within the Financial System for years to come, and this rests on 4 pillars:
Inclusion
• Cooperatives
• Convertibility
• Capital Market Initiative (IMK)
• Micro credit
• Innovations Instantaneous Payments Open Banking
• International reserves
• Market efficiency
• Rural credit
• Real estate credit
• Relationship with Congress
• Relationships with international investors
• Communication plan for the actions of the Central Bank
• Transparency and communication in monetary policy
• Financial Education
Competitiveness Transparency Education
Source: Central Bank of Brazil
103
Additional Information
Brazil | Economic context

Ranking of competitiveness¹ (position)
PISA Score ²
Days required to open a business
Time to prepare and pay taxes (hours)
(1) Relative position in the ranking when compared to other countries. (2) Ranking PISA. Source: World Economic Forum, Global Competitiveness Report 2018 – 2019.104
12
728
3343
4861
6568
71
Singapore
United States
Germany
China
Chile
Russia
Mexico
Turkey
Peru
India
Brazil 1814
109
88
744
2
India
Brazil
Switzerland
Mexico
China
Russia
Turkey
United states
Chile
Singapore
1501296
260241
175170
1596463
Brazil
Chile
Peru
Mexico
United states
Turkey
Russia
Singapore
SwitzerlandReading Math Science
1º 1º 1º
46º 62º
69º
China(Score: 590)
Argentina(Score: 404)
Brazil(Score: 404)
66º 74º
48º
62º 73º 68º
Chile(Score: 444)
China(Score: 555)
Brazil(Score: 413)
Argentina(Score: 402)
Chile(Score: 452)
China(Score: 591)
Brazil(Score: 384)
Argentina(Score: 379)
Chile(Score: 417)
Additional Information
Brazil | Economic context

Leverage and Monthly Debt Service
Debt service burden breakdown (%)
105
17.9
17.3 17.9 18.5 18.8 19.5
21.6 20.9 20.8 21.1 20.9
20.3 19.1 19.4 20.9
17.5 16.8 17.3 17.9 18.0 18.3
20.0 19.1 18.7 18.7 18.5 17.8 16.6 17.0 18.5
23.1 26.0 30.7 32.9 36.3 40.0 42.8 44.2 45.0 45.9 43.7 41.7 41.5 43.5 46.2
20.0
22.5 26.6 27.9 29.5 30.9
31.1 30.5 28.7 27.1 24.8
23.0 23.1
24.9 27.2
Apr-06 Apr-07 Apr-08 Apr-09 Apr-10 Apr-11 Apr-12 Apr-13 Apr-14 Apr-15 Apr-16 Apr-17 Apr-18 Apr-19 Apr-20
Debt service burden (%) Debt service burden - without mortgage (%) Debt Leverage (%) Debt Leverage - without mortgage (%)
12.2 11.4 11.5 11.3 11.6 13.3 13.3 12.2 12.2 11.7 10.8 10.2 9.8 10.1 11.2
5.7 5.9 6.4 7.2 7.1 8.3 8.3 8.7 8.7 9.4 10.2 10.1 9.3 9.3
9.8
17.9 17.3 17.9 18.5 18.821.6 21.6 20.8 20.8 21.1 20.9 20.3 19.1 19.4
20.9
Apr-06 Apr-07 Apr-08 Apr-09 Apr-10 Apr-12 Apr-12 Apr-14 Apr-14 Apr-15 Apr-16 Apr-17 Apr-18 Apr-19 Apr-20
Debt service burden - Principal Debt service burden - Interest
Additional Information
Brazil | Economic context

Additional Information
Brazil | Economic context
Companies Total Credit / GDP ² (%)
Companies Leverage (Net Debt/EBITDA) ¹
(1)Source: Economatica (considers approximately 400 companies). (2) Source: Brazilian Central Bank106
2.2x
-
1.0
2.0
3.0
4.0
5.0
6.0
Sep-11 Sep-12 Sep-13 Sep-14 Sep-15 Sep-16 Sep-17 Sep-18 Sep-19
25.5 26.7 26.8 27.7 26.7 23.1 21.2 20.2 21.6
May-12 May-13 May-14 May-15 May-16 May-17 May-18 May-19 May-20

3.3 3.0 3.0 2.9 3.0 3.03.0 3.0
3.2
18.0 17.0 17.7 18.6 18.8 19.4 18.9 18.616.4
6.5 6.5 6.5 6.5 6.5 6.0 5.0 4.33.0
May-18 Aug-18 Nov-18 Feb-19 May-19 Aug-19 Nov-19 Feb-20 May-20
NPL 90 days Total Spread SELIC
3.0 2.5 2.5 2.4 2.6 2.4 2.3 2.2 2.3
8.9 8.4 8.9 9.3 9.1 9.2 8.7 8.9 8.0
May-18 Aug-18 Nov-18 Feb-19 May-19 Aug-19 Nov-19 Feb-20 May-20
NPL 90 days Corporate Spread
3.6 3.5 3.3 3.3 3.4 3.5 3.5 3.6 4.0
24.523.0 23.7 24.8 25.2 25.9 25.2 24.5
22.1
May-18 Aug-18 Nov-18 Feb-19 May-19 Aug-19 Nov-19 Feb-20 May-20
NPL 90 days Individuals Spread
Additional Information
Brazil | Economic context
Spread and Delinquency Evolution ¹
Individuals Spread and Delinquency | Brazil (%)
(1) Source: Brazilian Central Bank and Itaú Unibanco analysis. (2) Periods prior to 2014 do not consider CorpBanca’s information.
Companies Spread and Delinquency | Brazil (%)
Spread and Delinquency | Brazil (%)
107
19.420.9
24.1 23.9
20.321.8 21.9
23.7
12.8 13.5
7.310.0
11.814.3 13.8
7.0
6.5 4.5 3.82.3
5.5 5.0 5.07.0 7.5 7.0
7.05.6 5.1 4.9
2012 2013 2014 2015 2016 2017 2018 2019 1Q20 2Q20
Itaú Unibanco ROE SELIC Long Term Interest Rate (TJLP)
Indicators² | (%)

Additional Information
Brazil | Economic context
Reserve Requirements and Restricted Loans
108(1) Defined by Manual de Crédito Rural (MCR) for the period from Jul-20 till Jun-21; (2) Regulated by Resolution 4,000 (Central Bank).
Rate RemunerationReserve Requirement 21.0% No RemunerationRural 27.5% ¹ Max Interest: 6.0% annualMicrocredit 2.0% ² Max Interest: 3.79% monthlyAvailable to Lend 49.5%Reserve Requirement 20.0% Savings DepositsMortgage 65.0%Available to Lend 15.0%Reserve Requirement 17.0% SelicAvailable to Lend 83.0%
Rate
Demand Deposits
Savings Deposits
Time Deposits

Financial HighlightsAdditional information
109

Additional Information
Results 2Q20
110
In R$ billions
Retained claims
Provision from loan losses
Operating revenues
Managerial financial margin
Financial margin with clients
Financial margin with the market
Commissions and fees
Revenues from insurance
Cost of credit
Impairment
Discounts granted
Recovery of loans written off as losses
Other operating expenses
Non-interest expenses
Income before tax and minority interests
Tax expenses and other
Income tax and social contribution
Minority interests in subsidiaries
Recurring net income
2Q2028.0
17.8
16.5
1.3
8.4
1.8
(7.8)
(7.6)
(0.2)
(0.8)
0.7
(0.3)
(13.8)
(12.1)
(1.6)
6.2
(1.9)
(0.1)
4.2
-4.1%
-0.2%
-3.4%
72.0%
-11.8%
-2.5%
-23.0%
-27.3%
121.3%
182.0%
10.9%
-2.5%
0.0%
0.4%
-3.2%
22.4%
95.0%
-59.5%
7.5%
1Q2029.2
17.8
17.0
0.8
9.5
1.9
(10.1)
(10.4)
(0.0)
(0.3)
0.7
(0.3)
(13.8)
(12.1)
(1.7)
5.0
(1.0)
(0.2)
3.9
1H2057.2
35.6
33.5
2.0
17.9
3.7
(17.9)
(18.0)
(0.3)
(1.0)
1.4
(0.7)
(27.5)
(24.2)
(3.3)
11.2
(2.9)
(0.2)
8.1
-0.8%
-1.5%
0.6%
-26.6%
1.3%
-4.4%
127.5%
108.5%
293.0%
45.6%
-8.6%
9.1%
-2.7%
-2.6%
-3.4%
-46.6%
-56.4%
-55.2%
-41.6%
1H1957.7
36.1
33.3
2.8
17.7
3.9
(7.8)
(8.6)
(0.1)
(0.7)
1.5
(0.6)
(28.3)
(24.8)
(3.4)
21.0
(6.6)
(0.5)
13.9
2Q1929.5
18.5
16.9
1.6
9.1
2.0
(4.0)
(4.4)
(0.0)
(0.4)
0.8
(0.3)
(14.4)
(12.7)
(1.8)
10.7
(3.4)
(0.3)
7.0
-5.0%
-3.7%
-2.4%
-16.9%
-7.4%
-7.0%
92.1%
71.6%
359.4%
92.5%
-7.1%
8.1%
-4.7%
-4.4%
-6.9%
-42.5%
-44.2%
-77.9%
-40.2%

Additional Information
Segments – Income Statement Pro Forma 2Q20
111
In R$ millionsRetail Banking Wholesale Banking
Activities with the Market + Corporation
Itaú Unibanco
Operating Revenues 17,691 7,790 2,530 28,010
Managerial Financial Margin 10,603 5,123 2,050 17,776
Financial Margin with Clients 10,603 5,123 742 16,468
Financial Margin with the Market - - 1,307 1,307
Commissions and Fees 5,448 2,551 397 8,396
Result from Insurance, Pension Plans and Premium Bonds Operations before Retained Claims and Selling Expenses 1,639 116 84 1,839
Cost of Credit (5,018) (2,757) 6 (7,770)
Provision for Loan Losses (4,927) (2,640) 6 (7,561)
Impairment - (196) - (196)
Discounts Granted (669) (81) - (750)
Recovery of Loans Written Off as Losses 578 160 - 738
Retained Claims (320) (1) - (321)
Other Operating Expenses (9,575) (3,999) (177) (13,751)
Non-interest Expenses (8,387) (3,633) (89) (12,109)
Tax Expenses for ISS, PIS, Cofins and Other Taxes (1,178) (366) (88) (1,633)
Insurance Selling Expenses (9) (0) - (10)
Income before Tax and Minority Interests 2,777 1,033 2,359 6,168
Income Tax and Social Contribution (974) (189) (739) (1,902)
Minority Interests in Subsidiaries (28) (19) (14) (61)
Recurring Net Income 1,774 825 1,606 4,205
Recurring Return on Average Allocated Capital 15.3% 5.6% 33.3% 13.5%Efficiency Ratio (ER) 51.8% 48.9% 3.6% 46.5%

Additional Information
Income Statement | Operating Revenues Perspective
112
In R$ millions 2Q20 1Q20 2Q19
Operating Revenues 28,010 29,206 -4.1% 29,492 -5.0%
Managerial Financial Margin 17,776 17,805 -0.2% 18,451 -3.7% Financial Margin with Clients 16,468 17,045 -3.4% 16,879 -2.4% Financial Margin with the Market 1,307 760 72.0% 1,572 -16.9%
Commissions and Fees 8,396 9,514 -11.8% 9,063 -7.4%
Revenues from Insurance¹ 1,839 1,887 -2.5% 1,978 -7.0%
Cost of Credit (7,770) (10,087) -23.0% (4,044) 92.1% Provision for Loan Losses (7,561) (10,398) -27.3% (4,407) 71.6% Impairment (196) (89) 121.3% (43) 359.4% Discounts Granted (750) (266) 182.0% (390) 92.5% Recovery of Loans Written Off as Losses 738 666 10.9% 795 -7.1%
Retained Claims (321) (329) -2.5% (297) 8.1% Other Operating Expenses (13,751) (13,752) 0.0% (14,432) -4.7%
Non-interest Expenses (12,109) (12,056) 0.4% (12,669) -4.4% Tax Expenses for ISS, PIS, Cofins and Other Taxes (1,633) (1,691) -3.5% (1,758) -7.1% Insurance Selling Expenses (10) (5) 102.1% (6) 71.9%
Income before Tax and Minority Interests 6,168 5,038 22.4% 10,718 -42.5% Income Tax and Social Contribution (1,902) (975) 95.0% (3,408) -44.2% Minority Interests in Subsidiaries (61) (151) -59.5% (277) -77.9% Recurring Net Income 4,205 3,912 7.5% 7,034 -40.2%
(1) Revenues from Insurance includes the Revenues from Insurance, Pension Plan and Premium Bonds Operations before Retained Claims and Selling Expenses.

Additional Information
Results – Brazil and Latin America
(1) Includes units abroad ex-Latin America. (2) Result from Insurance includes the Result from Insurance, Pension Plan and Premium Bonds Operations before Retained Claims and Selling Expenses. (3) Include Tax Expenses (ISS, PIS, COFINS and other) and Insurance Selling Expenses. Note: Latin America information is presented in nominal currency. 113
In R$ millionsConsolidated Brazil ¹
Latin America (ex-Brazil)
Consolidated Brazil ¹Latin America
(ex-Brazil)Consolidated Brazil ¹
Latin America (ex-Brazil)
Operating Revenues 28,010 24,734 3,276 29,206 26,411 2,795 -4.1% -6.3% 17.2%
Financial Margin with Clients 16,468 14,553 1,915 17,045 15,340 1,705 -3.4% -5.1% 12.3%
Financial Margin with the Market 1,307 667 640 760 387 373 72.0% 72.4% 71.5%
Commissions and Fees 8,396 7,675 721 9,514 8,797 717 -11.8% -12.8% 0.6%
Revenues from Insurance 2 1,839 1,839 - 1,887 1,887 - -2.5% -2.5% -
Cost of Credit (7,770) (7,061) (708) (10,087) (9,357) (730) -23.0% -24.5% -2.9%
Provision for Loan Losses (7,561) (6,766) (795) (10,398) (9,590) (808) -27.3% -29.4% -1.5%
Impairment (196) (196) - (89) (89) - 121.3% 121.3% -
Discounts Granted (750) (747) (3) (266) (261) (5) 182.0% 186.1% -35.3%
Recovery of Loans Written Off as Losses 738 648 90 666 583 83 10.9% 11.2% 8.5%
Retained Claims (321) (321) - (329) (329) - -2.5% -2.5%
Non-interest Expenses (12,109) (10,241) (1,868) (12,056) (10,438) (1,618) 0.4% -1.9% 15.5%
Tax Expenses and Other 3 (1,642) (1,565) (77) (1,696) (1,755) 59 -3.2% -10.8% -230.5%
Income before Tax and Minority Interests 6,168 5,546 622 5,038 4,531 507 22.4% 22.4% 22.8%
Income Tax and Social Contribution (1,902) (1,715) (186) (975) (844) (132) 95.0% 103.3% 41.7%
Minority Interests in Subsidiaries (61) (42) (19) (151) (62) (89) -59.5% -31.4% -79.0%
Recurring Net Income 4,205 3,788 417 3,912 3,626 286 7.5% 4.5% 45.9%
2Q20 1Q20

Additional Information
Business Model
114
Operating Revenues 57.2 31.9 0.6 24.7 0.1 57.7 30.4 0.9 25.7 0.8 (0.5) 1.4 (0.3) (1.0) (0.6)
Managerial Financial Margin 35.6 26.2 0.6 8.7 0.1 36.1 24.4 0.9 10.1 0.8 (0.5) 1.8 (0.3) (1.4) (0.6)
R Commissions and Fees 17.9 5.6 0.0 12.3 - 17.7 6.0 0.0 11.7 - 0.2 (0.4) (0.0) 0.6 -
S Revenues from Insurance ¹ 3.7 - - 3.7 - 3.9 - - 3.9 - (0.2) - - (0.2) -
C Cost of Credit (17.9) (17.9) - - - (7.8) (7.8) - - - (10.0) (10.0) - - -
D Retained Claims (0.7) - - (0.7) - (0.6) - - (0.6) - (0.1) - - (0.1) -
Non-Interested Expenses and Other Expenses ²
(27.7) (13.8) (0.2) (13.8) 0.0 (28.7) (14.2) (0.4) (14.1) (0.0) 1.0 0.5 0.2 0.3 0.1
Recurring Net Income 8.1 1.0 0.2 7.0 (0.0) 13.9 5.8 0.3 7.2 0.6 (5.8) (4.8) (0.1) (0.2) (0.7)
C Average Regulatory Capital 126.8 75.9 1.4 50.6 (1.1) 123.9 62.6 1.4 39.8 20.0 2.9 13.3 (0.0) 10.8 (21.1)
Value Creation 0.4 (3.5) 0.3 3.6 0.0 6.1 1.8 0.2 4.7 (0.6) (5.6) (5.3) 0.1 (1.1) 0.7
Recurring ROE 13.1% 2.5% 27.3% 27.6% 4.7% 23.6% 18.5% 40.6% 36.1% 6.3% -10.5 p.p. -16.0 p.p. -13.4 p.p. -8.5 p.p. -1.6 p.p.
(1) Revenues from Insurance includes the Revenues from Insurance, Pension Plan and Premium Bonds Operations before Retained Claims and Selling Expenses. (2) Include Tax Expenses (ISS, PIS, COFINS and other), Insurance Selling Expenses and Minority Interests in Subsidiaries
The allocation of principal capital (Common Equity Tier 1) in the bank's business is made at 12%, according to our risk appetite.
In the first half of 2020, we ended with R $ 36.2 billion of capital above the minimum (8% in 1Q20 and 6.75% in 2Q20 of CET1), determined by the Central Bank of Brazil.
1st Half of 2020 1st Half of 2019 Δ
Consolidated Credit TradingInsurance & services
Excess capital
Consolidated Credit Trading Insurance & services
Excess capital Consolidated Credit Trading
Insurance & services
Excess capital

In R$ billions, end of period 2Q20 1Q20 2Q19
Individuals - Brazil 1 228.0 237.0 -3.8% 221.5 2.9%
Credit Card 72.9 83.8 -13.1% 79.3 -8.1%
Personal Loans 36.4 36.2 0.6% 31.9 14.2%
Payroll Loans 2 50.4 50.3 0.2% 49.1 2.6%
Vehicles 19.5 19.4 0.3% 17.2 13.2%
Mortgage Loans 48.8 47.2 3.5% 44.0 11.0%
Rural Loans 0.1 0.1 -18.5% 0.1 -32.1%
Companies - Brazil 1 228.7 221.2 3.4% 177.0 29.2%
Working Capital 3 131.4 120.6 9.0% 96.3 36.5%
BNDES/Onlending 9.7 9.8 -0.5% 13.6 -28.8%
Export / Import Financing 63.2 67.3 -6.1% 44.9 40.6%
Vehicles 10.1 9.9 1.3% 6.0 66.3%
Mortgage Loans 5.0 4.6 9.2% 5.3 -5.7%
Rural Loans 9.4 9.1 2.6% 10.9 -13.9%
Latin America 4 200.8 181.5 10.6% 154.3 30.1%
Total without Financial Guarantees Provided 657.5 639.7 2.8% 552.9 18.9%
Financial Guarantees Provided 70.0 70.3 -0.4% 64.7 8.2%
Total with Financial Guarantees Provided 727.5 710.0 2.5% 617.6 17.8%
Corporate Securities 5 83.9 78.3 7.1% 56.9 47.3%
Total Risk 811.3 788.3 2.9% 674.5 20.3%
Additional Information
Credit Portfolio by Product
(1) Includes units abroad ex-Latin America; (2) Includes operations originated by the institution and acquired operations; (3) Also includes Overdraft, Receivables, Hot Money, Leasing, and other; (4) Includes Argentina, Chile, Colombia, Panama, Paraguay and Uruguay; (5) Includes Debentures, CRI and Commercial Paper.
115

Additional Information
Credit Portfolio by Currency ¹
(1) Total with financial guarantees provided.
116
223.5
233.4
219.5
224.5
228.3
240.0
232.8
284.8
300.4
365.1
366.7
379.1
384.5
389.3
401.7
417.0
425.2
427.0
588.6
600.1
598.6
609.0
617.6
641.7
649.7
710.0
727.5
Jun-18
Sep-18
Dec-18
Mar-19
Jun-19
Sep-19
Dec-19
Mar-20
Jun-20
Foreign Currency Local Currency
R$ billion

100 107138
173207
2Q17 2Q18 2Q19 1Q20 2Q20
100 114161 170 168
2Q17 2Q18 2Q19 1Q20 2Q20
100114
145167 179
2Q17 2Q18 2Q19 1Q20 2Q20
100124
142155 145
2Q17 2Q18 2Q19 1Q20 2Q20
Total Credit2 – BrazilBase 100 = 2Q17
117
-7%
2%7%
23%
-1%
5%
19%
50%
Credit2 - Individuals
Credit2 – CorporateCredit2 – Very Small, Small and Middle Market
Additional Information
Credit¹ Origination | Brazil
Note: Do not consider origination of Credit Card, Overdraft, Debt Renegotiation and other revolving credits. (1) Average origination per working day in the period, except for private securities issuance. (2) Does not include private securities issuance. (3) Source: ANBIMA (Brazilian Financial and Capital Markets Association). Considers total volume of fixed income and hybrid private securities issuance arranged by Itaú Unibanco on the local market (includes distributed volumes).

Additional Information
Credit Portfolio Breakdown
(1) Includes financial guarantees provided; (2) Industry and Extractivism = Mining (+) Steel and Metallurgy (+) Capital Assets (+) Petrochemical and Chemical (+) Energy and sewage (+) Oil and gas. Consumer Goods = Food and beverage (+) Pharmaceuticals and cosmetics (+) Electronic and IT. Vehicles and Transportation = Transportation (+) Vehicles and autoparts. Real Estate and Construction = Real estate agents (+) Construction material (+) Infrastructure work. Agriculture and Related = Agribusiness and fertilizers (+) Sugar and alcohol. Other = Telecommunications (+) Commerce – Other (+) Services – Other (+) Industry – Other (+) Entertainment and Tourism (+) Other.
Companies Credit Portfolio by Business Sector¹,²R$ billion
Credit Concentration ¹Jun-20
118
In R$ billions, end of period 2Q20 1Q20Public Sector 5.6 5.0 12.4%Private Sector 416.1 396.4 5.0%
Real Estate 29.5 25.9 13.9%Transportation 25.0 23.8 5.2%Food and beverage 24.2 23.3 3.9%Agribusiness and fertilizers 22.7 22.8 -0.4%Vehicles and auto parts 20.1 19.1 5.2%Banks and other financial 18.2 16.4 11.1%Energy and water treatment 17.3 16.7 3.5%Petrochemical and chemical 14.7 14.0 4.8%Infrastructure work 12.7 11.9 6.2%Steel and metallurgy 12.0 11.5 4.6%Mining 11.4 10.1 12.8%Pharmaceutical and cosmetics 10.2 9.6 5.9%Telecommunications 10.1 9.6 5.3%Oil and gas 9.2 9.2 0.4%Electronic and IT 8.7 8.3 5.5%Entertainment and tourism 7.1 6.6 7.8%Construction Material 6.5 7.5 -13.5%Capital Assets 6.3 7.6 -16.6%Footwear and clothing 6.1 5.6 8.9%Services - Other 52.4 49.5 5.7%Commerce - Other 28.0 25.6 9.2%Industry - Other 12.9 12.7 1.5%Other 50.8 49.1 3.6%
Total 421.7 401.3 5.1%
Risk % of Total Risk % of Total
Largest Debtor 7.5 1.0 11.1 1.2
10 largest debtors 36.0 4.9 66.3 7.4
20 largest debtors 52.6 7.2 100.7 11.2
50 largest debtors 83.0 11.4 161.2 17.9
100 largest debtors 114.5 15.7 212.6 23.6
Loan, lease and other credit operations
Loan, lease, other credit operations and securities of companies and
financial institutions
38%
17%12%
12%
11%
5%
4% 1%
Other Industry and ExtractivismReal Estate and Construction Consumer GoodsVehicles and Transportation Agriculture and RelatedBanks and other financial institutions Public Sector

Additional Information
Credit Portfolio by Vintage¹
Profile of credit portfolio by origination period:• Older vintages with higher spreads are losing relevance compared to the most recent ones.• 62.1% of total origination was created in the past 12 months.
R$ billion
(1) Does not include financial guarantees provided.
119
35.7% 34.8% 35.3%
10.0% 12.0% 11.7%8.0% 8.3% 8.6%6.4% 7.3% 6.5%5.1% 3.8% 4.7%
34.8% 33.8% 33.1%
553 640 657
2Q19 1Q20 2Q20
Actual Quarter (q) q-1 q-2 q-3 q-4 q=<-5

Additional Information
Loan Portfolio Mix Change ¹ (%)
R$ billion
(1) Does not include financial guarantees provided; (2) Includes units abroad ex-Latin America; (3) Excludes Brazil.
Brazil 2
Consolidated
120
19.3 15.5 3.0 11.1 5.5 7.4 7.7 30.5jun/20
34.0
32.7
28.3
24.6
27.8
16.3
16.3
18.4
19.8
22.3
4.6
4.0
4.0
4.3
4.3
14.9
16.1
18.2
19.9
16.0
7.7
7.2
7.5
8.0
8.0
9.9
10.9
11.1
11.0
10.7
12.7
12.8
12.5
12.3
11.0
jun/16
jun/17
jun/18
jun/19
jun/20
Corporate Very Small, Small and Middle Market Vehicles Credit Card
Personal Loans Mortgage Loans Latin America 3 Payroll Loans

Additional Information
Renegotiated Loans Operations 2Q20
121
Latin America
Written-off as a Loss
Over 90 days overdue
31-90 days overdue
Up to 30 days overdue
Non-overdue
Portfolio in Brazil25.2 25.7 25.2 25.4 24.7 26.0 25.7 28.9 32.6
8.5 8.8 9.0 9.2 9.8 9.9 9.6 11.9 12.5 1.2 1.3 1.4 1.4 1.4 1.3 1.3
1.3 1.0 5.2 5.1 4.8 4.9 4.9 5.2 5.5 6.1 7.6
8.5 8.7 8.2 8.0 7.3 7.6 7.3 7.9
9.8 1.8 1.8 1.8 1.8 1.3 2.0 2.0
1.7 1.6
2.3 2.2 2.1 2.3 2.3 2.5 2.4 2.7
3.2
27.5 27.9 27.3 27.6 26.9 28.4 28.1 31.7
35.7
Jun-18 Sep-18 Dec-18 Mar-19 Jun-19 Sep-19 Dec-19 Mar-20 Jun-20

Additional Information
Provision for Loan Losses and Cost of Credit
R$ millionProvision for Loan Losses by Segment
Cost of CreditRR$ million
Note: Includes the consolidation of Citibank as of 4Q17.
122
(Provision for Loan Losses + Recovery of Loans Written Off as Losses + Impairment + Discounts Granted)
(*) Average balance of the loan portfolio, considering the last two quarters.
4,395 3,932 3,996 3,550 3,732 3,236 3,534 3,165 3,482 3,688 3,726 4,021 4,210 4,4614,481
7,149
4,922
1,546 1,825 1,070 1,410 619 532 248 393 168
-298 -354 -304 -371 -177
412
2,441
1,845396 412 757 432 598 514 701 554 621
514 423 489 568 638 1,252
808
7956,337 6,169 5,823 5,392 4,948 4,282 4,483 4,111 4,271
3,904 3,796 4,206 4,407 4,9226,145
10,398
7,561
5.0% 5.0% 4.7% 4.5% 4.1% 3.6% 3.7% 3.3% 3.4% 3.0% 2.9% 3.1% 3.2% 3.5% 4.2%
6.8%
4.7%
2Q16 3Q16 4Q16 1Q17 2Q17 3Q17 4Q17 1Q18 2Q18 3Q18 4Q18 1Q19 2Q19 3Q19 4Q19 1Q20 2Q20
Retail Banking - Brazil Wholesale Banking - Brazil Latin America ex-Brazil Provision for Loan Losses / Loan Portfolio (*) - Annualized
6,335 5,582 6,352 5,281 4,474 3,990 4,257 3,788 3,601 3,263 3,415 3,804 4,044 4,495 5,811
10,0877,770
4.1% 3.7%4.2%
3.6%3.0% 2.7% 2.9% 2.5% 2.4% 2.1% 2.1% 2.3% 2.4% 2.6%
3.3%
5.3%
3.9%
2Q16 3Q16 4Q16 1Q17 2Q17 3Q17 4Q17 1Q18 2Q18 3Q18 4Q18 1Q19 2Q19 3Q19 4Q19 1Q20 2Q20
Cost of Credit Cost of Credit / Total Risk (*) - Annualized(*) Average balance of the loan portfolio with financial guarantees provided and corporate securities, considering the last two quarters.

Allocation of Total Allowance by Type of Risk - ConsolidatedR$ million
10,666
12,978
12,135
9,514
11,471
11,383
12,910
22,634
25,749
33,091
47,083
49,267
Jun-19
Mar-20
Jun-20
11,80611,4507,065
7,3985,962
3,457
6,5445,222
2,388
25,749
22,634
12,910
Jun-20Mar-20Jun-19
Renegotiations
Overdue
Provision < 100%
Fully Provisioned
84%
16%67%
33%
123
2,996
323
739
6,721
431926
5,7612,613
1,136
1,232208
435
Additional Information
Allowance for Loan Losses by Risk– Consolidated
1 Includes units abroad ex-Latin America.² Excludes Brazil. Latin America 2Wholesale - Brazil 1Retail - Brazil 1
Potential LossRenegotiations and overdue loansOverdue operations according to the Brazilian Central Bank
9,71710,2728,286
7547901,168
1,6651,9151,212
12,13512,97810,666
Jun-20Mar-20Jun-19
6,9926,2735,019
2,8203,5883,254
1,5711,6111,241
11,38311,4719,514
Jun-20Mar-20Jun-19

4.2 4.0 3.7 3.5 3.5 3.4 3.4 3.2 3.1
3.5
2.4
2.4 2.1
1.0 0.8
1.7
0.7 0.9 0.7 1.2
0.7 0.9
4.0 3.5
2.7 2.3 2.2
1.7 1.6 1.4 1.6 1.9 1.0
Jun-16 Mar-17 Jun-17 Mar-18 Jun-18 Mar-19 Jun-19 Sep-19 Dec-19 Mar-20 Jun-20
Individuals Corporate Very Small, Small and Middle Market Companies
5.9
5.3
5.24.6 4.5 4.4 4.5 4.7 4.8 5.1 5.0
1.6 1.61.2
1.81.0
2.7
1.81.4
0.51.1 0.7
5.6 5.34.9
4.13.6
2.7 2.4 2.3 2.3 2.3 2.0
Jun-16 Mar-17 Jun-17 Mar-18 Jun-18 Mar-19 Jun-19 Sep-19 Dec-19 Mar-20 Jun-20
Individuals Corporate Very Small, Small and Middle Market Companies
3.2
3.2
2.8
2.7 2.7
2.5 2.5 2.3 2.3 2.6
1.7
3.6 3.3
2.7
2.6
2.8
2.4 2.4 2.2
2.4
2.4
1.7
2.12.7
2.9 3.1
2.5
2.6 2.5 2.5 2.3
3.0
1.9
Jun-16 Mar-17 Jun-17 Mar-18 Jun-18 Mar-19 Jun-19 Sep-19 Dec-19 Mar-20 Jun-20
Total Brazil ¹ Latin America ²
3.6 3.4 3.2 3.12.8 3.0 2.9 2.9 3.0 3.1
2.7
4.54.2 3.9 3.7
3.43.7 3.5 3.4 3.4 3.5
3.2
1.1 1.3 1.21.6 1.5 1.4 1.4 1.4
1.9 2.01.4
Jun-16 Mar-17 Jun-17 Mar-18 Jun-18 Mar-19 Jun-19 Sep-19 Dec-19 Mar-20 Jun-20
Total Brazil ¹ Latin America ²
Additional Information
Non Performing Loans Ratios
Note: Total and Latin America 15 to 90-day NPL Ratios prior to June 2016 do not include CorpBanca. (1) Includes units abroad ex-Latin America. (2) Excludes Brazil.
90-day NPL Ratio| Consolidated (%) 15 to 90-day NPL Ratio | Consolidated - %
90-day NPL Ratio | Brazil ¹ (%) 15 to 90-day NPL Ratio | Brazil ¹ - %
124

Additional Information
NPL Creation
R$ billion
125
3.8
5.04.4
5.14.7
5.3 5.0
7.3
3.3
3.5 3.5 3.5 3.63.9
4.3 4.44.9
3.2
-0.3
1.00.7
1.2
0.40.1
-0.51.1
-0.2
0.5
0.4 0.3 0.4 0.4
0.91.1 1.2
0.3
2Q18 3Q18 4Q18 1Q19 2Q19 3Q19 4Q19 1Q20 2Q20
Total Retail Banking - Brazil Whosale Banking - Brazil Latin America ex-Brazil

Additional Information
Provision for Loan Losses and NPL Creation by Segment
Retail Banking - Brazil
Wholesale Banking - Brazil
Latin America ex–Brazil
Total
R$ billion
126
R$ billion
R$ billion
R$ billion
0.2-0.3 -0.4 -0.3 -0.4 -0.2
0.42.4 1.8
-0.31.0 0.7 1.2 0.4 0.1
-0.5
1.1-0.2
-66% -29% -53% -26% -87% -119% -89%215%
-982%2Q18 3Q18 4Q18 1Q19 2Q19 3Q19 4Q19 1Q20 2Q20
0.6 0.5 0.4 0.5 0.6 0.6 1.3 0.8 0.80.5 0.4 0.3 0.4 0.4 0.9 1.1 1.2 0.3
114% 130% 133% 136% 138% 75% 115% 66%316%
2Q18 3Q18 4Q18 1Q19 2Q19 3Q19 4Q19 1Q20 2Q20
4.3 3.9 3.8 4.2 4.4 4.9 6.1 10.4 7.63.8 5.0 4.4 5.1 4.7 5.3 5.0 7.3 3.3
113% 79% 85% 83% 93% 93% 122%143% 230%
2Q18 3Q18 4Q18 1Q19 2Q19 3Q19 4Q19 1Q20 2Q20
Provision for Loan Losses Provision for Loan Losses / NPL CreationNPL Creation
3.5 3.7 3.7 4.0 4.2 4.5 4.57.1
4.93.5 3.5 3.5 3.6 3.9 4.3 4.4 4.9 3.2
100% 104% 108% 113% 108% 104% 102%145% 153%
2Q18 3Q18 4Q18 1Q19 2Q19 3Q19 4Q19 1Q20 2Q20

Additional Information
Insurance, Pension Plan and Premium Bonds
1
Result from Insurance, Pension Plan and Premium Bonds
127
R$ million
(1) Operating Revenues including the Result from Insurance, Pension Plan and Premium Bonds Operations net of retained claims and selling expenses.
In R$ millions 2Q20 1Q20 2Q19 Earned Premiums 1,046 1,082 -3.4% 1,075 -2.7% Revenues from Pension Plan 50 64 -22.0% 117 -57.3% Revenues from Premium Bonds 61 107 -42.8% 107 -42.7% Managerial Financial Margin 25 (34) - (0) - Commissions and Fees 495 549 -9.8% 515 -3.8% Earnings of Affiliates 161 117 37.4% 164 -1.6%
Revenues from Insurance, Pension Plan and Premium Bonds 1,839 1,887 -2.5% 1,978 -7.0% Retained Claims (321) (329) -2.5% (297) 8.1% Insurance Selling Expenses (10) (5) 102.1% (6) 71.9%
Result from Insurance, Pension Plan and Premium Bonds 1,508 1,553 -2.9% 1,675 -10.0%
Recurring Net Income 652 612 6.7% 680 -4.1%
1,645 1,521 1,590 1,607 1,675 1,575
1,706 1,553 1,508
5.9%5.5% 5.6% 5.8% 5.7%
5.3% 5.4% 5.4% 5.4%
2Q18 3Q18 4Q18 1Q19 2Q19 3Q19 4Q19 1Q20 2Q20
Result from Insurance, Pension Plan and Premium Bonds Operations Result/Operating Revenues

Additional Information
Balance Sheet – Assets and Liabilities
R$ million
128
Assets 2Q20 1Q20 2Q19 Current and Long-term Assets 2,039,147 1,944,899 4.8% 1,644,067 24.0%
Cash and Cash Equivalents 85,428 71,881 18.8% 59,313 44.0%
Short-term Interbank Investments 316,297 282,565 11.9% 258,710 22.3%
Securities and Derivative Financial Instruments 645,988 605,985 6.6% 473,608 36.4%
Interbank and Interbranch Accounts 127,087 107,734 18.0% 134,741 -5.7%
Loan, Lease and Other Loan Operations 657,478 639,699 2.8% 552,909 18.9%
(Allowance for Loan Losses) (48,286) (46,240) 4.4% (31,952) 51.1%
Other Assets 255,155 283,276 -9.9% 196,738 29.7%
Permanent Assets 35,975 37,599 -4.3% 34,312 4.8%
Total Assets 2,075,122 1,982,498 4.7% 1,678,378 23.6%
Liabilities 2Q20 1Q20 2Q19 Current and Long-Term Liabilities 1,934,181 1,843,947 4.9% 1,537,520 25.8%
Deposits 727,196 606,750 19.9% 463,259 57.0%
Deposits Received under Securities Repurchase Agreements 316,954 313,540 1.1% 316,543 0.1%
Fund from Acceptances and Issue of Securities 145,140 154,146 -5.8% 125,336 15.8%
Interbank and Interbranch Accounts 51,945 52,074 -0.2% 55,243 -6.0%
Borrowings and Onlendings 95,184 94,909 0.3% 72,788 30.8%
Derivative Financial Instruments 89,137 87,909 1.4% 35,655 150.0%
Technical Provisions for Insurance, Pension Plans and Premium Bonds 218,386 214,565 1.8% 211,905 3.1%
Other Liabilities 290,238 320,054 -9.3% 256,790 13.0%
Deferred Income 3,123 3,286 -5.0% 2,606 19.9%
Minority Interest in Subsidiaries 11,461 11,641 -1.5% 12,515 -8.4%
Stockholders' Equity 126,357 123,624 2.2% 125,737 0.5%
Total Liabilities and Equity 2,075,122 1,982,498 4.7% 1,678,378 23.6%

Additional Information
Funding
• Loan Portfolio mainly funded by domestic client funding
• Diversified funding base
(1) Includes funds from Real Estate, Mortgage, Financial, Credit and Similar Notes. (2) Includes installments of subordinated debt that are not included in the Tier II Referential Equity. (3) Includes Certificates of Banks Deposits (CDB), Certificates of Agribusiness Receivables (CRA), Certificates of Real Estate Receivables (CRI), Debentures, Agricultural Credit Bonds (LCA) and Real Estate Credit Bonds (LCI).
129
In R$ millions, end of period 2Q20 1Q20 2Q19
Funding from Clients (A) 806,755 700,779 15.1% 550,691 46.5%
Demand Deposits 118,787 101,711 16.8% 73,352 61.9%
Savings Deposits 163,755 149,600 9.5% 137,568 19.0%
Time Deposits 439,797 350,704 25.4% 250,521 75.6%
Debentures (Linked to Repurchase Agreements and Third Parties’ Operations) 3,392 4,166 -18.6% 10,426 -67.5%
Funds from Bills(1)
and Structured Operations Certificates 81,024 94,598 -14.3% 78,824 2.8%
Other Funding (B) 202,827 199,400 1.7% 148,763 36.3%
Onlending 11,694 10,648 9.8% 14,615 -20.0%
Borrowings 83,490 84,261 -0.9% 58,174 43.5%
Securities Obligations Abroad 64,116 59,548 7.7% 46,513 37.8%
Other(2) 43,526 44,943 -3.2% 29,463 47.7%
Portfolio Managed and Investment Funds(3) (C) 1,331,135 1,302,887 2.2% 1,200,283 10.9%
Total (A) + (B) + (C) 2,340,717 2,203,065 6.2% 1,899,738 23.2%

691 699 737 760
9001,010
566 571 618 635
788870
544 553 576 583640 657
Mar-19 Jun-19 Sep-19 Dec-19 Mar-20 Jun-20
36.0%
44.3%
8.4%
11.3%
Over to 365
0-30
31-180
181-365
Ratio between Loan Portfolio and Funding % Funding (Maturity Breakdown)
130
Additional Information
Funding
R$ billion
In days
96.0% 96.9% 93.3% 91.9%81.2%
75.6%
78.6% 79.0% 78.2% 76.7%71.1%
65.1%
Portfolio / Funding from clients and other funding Portfolio / Funding from clients and other funding net of reserve and cash
Loan portfolio
Funding from clients and other funding
Loan portfolio
Funding from clients and other funding net of reserve required by BACEN and Cash

Institutional PresentationItaú Unibanco Holding S.A.
2Q20
ITUB
NYSELISTED LEVEL 1
BM&FBOVESPACDP