josé manuel campa linda s. goldberg · exceptional research assistance, and also acknowledge the...
TRANSCRIPT

NBER WORKING PAPER SERIES
DISTRIBUTION MARGINS, IMPORTED INPUTS, AND THESENSITIVITY OF THE CPI TO EXCHANGE RATES
José Manuel CampaLinda S. Goldberg
Working Paper 12121http://www.nber.org/papers/w12121
NATIONAL BUREAU OF ECONOMIC RESEARCH1050 Massachusetts Avenue
Cambridge, MA 02138March 2006
The views expressed in this paper are those of the individual authors and do not necessarily reflect theposition of the Federal Reserve Bank of New York or the Federal Reserve System. We benefitted from thecomments of Jeannine Bailleau, Charles Engel, Luca Dedola, Joseph Gagnon, Rebecca Hellerstein, SergioRebelo, Stephanie Schmidt-Grohe, Cedric Tille and participants in the June 2003 Rome Workshop and theBank of Canada-ECB conference on Exchange Rates, December 2005. We thank Luis Gonzalez forexceptional research assistance, and also acknowledge the work of María Oleaga and Isabel Paul. NadimAhmad of the OECD patiently answered our many data questions and the Fundación Ramón Areces forfinancial support. Address correspondences to Linda S. Goldberg, Federal Reserve Bank of NY, ResearchDepartment, 33 Liberty St, New York, N.Y. 10045. Tel: 212-720-2836; fax: 212-720-6831; email:[email protected]. The views expressed herein are those of the author(s) and do not necessarilyreflect the views of the National Bureau of Economic Research.
©2006 by José Manuel Campa and Linda S. Goldberg. All rights reserved. Short sections of text, not toexceed two paragraphs, may be quoted without explicit permission provided that full credit, including ©notice, is given to the source.

Distribution Margins, Imported Inputs, and the Sensitivity of the CPI to Exchange RatesJosé Manuel Campa and Linda S. GoldbergNBER Working Paper No. 12121March 2006JEL No. F3, F4
ABSTRACT
Border prices of traded goods are highly sensitive to exchange rates, but the CPI, and the retail pricesof these goods, are more stable. Our paper decomposes the sources of this stability for twenty-oneOECD countries, focusing on the important roles of distribution margins and imported inputs intransmitting exchange rate fluctuations into consumption prices. We provide rich cross-country andcross-industry details on distribution margins and their sensitivity to exchange rates, imported inputsused in different categories of consumption goods, and weights in consumption of nontradables,home tradables and imported goods. While distribution margins damp the sensitivity of consumptionprices of tradable goods to exchange rates, they also lead to enhanced pass through when nontradedgoods prices are sensitive to exchange rates. Such price sensitivity arises because imported inputsare used in production of home nontradables. Calibration exercises show that, at under 5 percent, theUnited States has the lowest expected CPI sensitivity to exchange rates of allcountries examined. Onaverage, calibrated exchange rate pass through into CPIs is expected to be closer to 15 percent.
Linda S. GoldbergFederal Reserve Bank of NYResearch Department33 Liberty StreetNew York, NY 10045and [email protected]
José Manuel CampaIESECamino del Cerro del Aguila 328023 [email protected]
1
1. Introduction
An unexpectedly small degree of consumer price index (CPI) responsiveness to import
price and exchange rate fluctuations has been posed as a puzzle in empirical international
macroeconomics. Researchers have argued that this gap may be explained in a competitive
setting partly by the presence of nontradables goods in consumption and partly by the existence
of a distribution sector which reduces the foreign content within imports, driving a wedge
between border and retail prices (Burstein, Neves, and Rebelo 2003).1 Expenditures on
transportation, storage, finance, insurance, wholesaling, and retailing add local-value-added
components to the final consumption value of imports and reduce the weight on border prices for
imports per se in consumer price indices. An alternative explanation arises from the presence of
imperfect competition in the distribution sector. Double marginalization occurs when distributors
absorb some of the exchange-rate fluctuations in order to maintain stable prices or expand
market share at the retail level (Hellerstein 2004). Thus, distributor profit margins also can
provide partial insulation from internationally transmitted shocks. A complementary explanation,
offered by Bacchetta and van Wincoop (2003), is that consumer price insensitivity to exchange
rates may be generated as an optimal pass through strategy in a model of foreign exporting firms
selling intermediate goods to domestic producers who compete with nontraded goods producers.2
Regardless of the strength of sensitivity of border prices to exchange rates, if retailers absorb
exchange rate fluctuations in their own margins, then consumers will experience less pass
through than prices at the border (Devereux, Engel, and Tille 1999, and Devereux and Engel
2002).
We explore the phenomenon of low CPI responsiveness to exchange rates by carefully
framing what CPI sensitivity to exchange rates is expected to be, given the existence of home
and foreign tradable goods and nontradable goods in consumption, and given the potential roles
of distribution margins and imported inputs to production. These features are important for
proper identification of the foreign versus local components exposed most extensively to
exchange rate movements. We frame our contribution, which is primarily empirical, within a
1 Campa and Goldberg (2005) and Campa, Goldberg, and Gonzalez-Minguez (forthcoming 2006) detail the pass through rates on import prices of OECD and euro-area countries. Frankel, Parsley, and Wei (2004) also document pass through elasticities for developing countries. 2 Corsetti and Dedola (2005) make related arguments in a different production chain and pricing set-up.
2
workhorse two country model with wage stickiness. Methodologically, we introduce a straight-
forward variant of Obstfeld and Rogoff (2000), Corsetti and Dedola (2003), and Burstein, Neves,
and Rebelo (2003). We explicitly introduce distribution margins, a sensitivity of these margins to
exchange rates, and roles for imported inputs in the production of tradable and nontradable
goods. The model provides a clear delineation of the determinants of the price elasticities of
specific consumer goods and shows how these elasticities aggregate to yield CPI sensitivity.
Consumer prices could be insensitive to exchange rates because a small share of the goods
composing the CPI basket have exposure to exchange rate changes via tradable products, or
because the competitive structure or the size and behavior of the distribution sector isolates final
prices from exchange rate movements.
The real contribution of this paper is its empirical analysis, where we carefully apply
these concepts to data from twenty-one OECD countries.3 Most significantly, we document the
size of the distribution sector and the degree of imported input use by country, by industry, and
in some cases over time, and explore their respective roles in the pass through disconnect. Since
CPI discussions require margins applied on consumption goods per se, and not the typically
lower margins on government and investment goods, we carefully separate out the margins by
sources of final demand. Across this sample of countries, distribution margins on household
consumption are between 30 and 50 percent of purchasers prices.
These margins are dominated by wholesale and retail sector costs, with transportation and
storage costs relatively low except in the case of various raw materials and mining industries. We
use these data to explore the existence of double marginalization, wherein local wholesalers and
retailers adjust their margins in response to exchange rate fluctuations. While our data can only
give crude indications of margin adjustment, the available time-series evidence for eight
countries supports the hypothesis that distribution margins are sensitive to exchange rates.
Distribution margins fall when the local currency depreciates and imports become more
expensive in local currency terms.
We further document the role of imported inputs across countries and across both
tradable and nontradable goods production. In tradable goods production, imported inputs
account for between 10 and 48 percent of the final price. Imported inputs are also used less

3
extensively in the production of nontradables, ranging from 3 percent in the United States to 22
percent in Hungary.
Pulling together these empirical findings, we calibrate the sensitivity of country consumer
price indices to exchange rates. Using data on the shares of imports in tradables consumption,
the shares of tradables in overall consumption, the imported input use across sectors, and the
distribution margins and their responsiveness, we compare calibrated sensitivities of various
price indices and the CPI. Not surprisingly, there is considerable cross-country heterogeneity in
these predictions. It is also noteworthy that the calibrated CPI sensitivities to exchange rates are
not systematically different from observed CPI sensitivity to exchange rates. It is not unusual for
this sensitivity to be low, often below 10 percent of any exchange rate change.
We emphasize that the rates of exchange rate pass-through into CPIs depend on the role
that tradables goods have in the economy – both tradables in consumption, and imported inputs
in production of nontraded and home tradable goods. We provide substantial empirical evidence
showing the extent to which distribution margins are important for damping border price pass
through into consumption prices, as stressed in recent theoretical contributions to this literature.
We also emphasize, however, that the existence of these margins is also an added conduit for
exchange rate effects. Distribution expenditures for all tradable goods consumed are sensitive to
exchange rates to the extent that the nontradable sector relies on imported productive inputs.
Imported inputs matter both for the prices of directly consumed nontradable goods and for
tradable goods in the final consumption baskets of most developed economies.
Section II begins our exposition by documenting the extent of the pass through of
exchange rates into import price and CPI across countries. We then present a model of pass
through into respective price indices, accounting for the roles of distribution and imported inputs.
Section III presents evidence on distribution margins, imported inputs, and relevant trade shares
across countries, industries, and time. Section IV generates predicted values for pass through into
the alternative price series of each country, and compares predicted and observed pass through.
Section V concludes.
3 This evidence complements and considerably extends the evidence on Argentina and the United States provided by
4
II. Price Elasticities with Respect to Exchange Rates
Table 1 reports estimated pass-through rates into import prices and consumer price
indexes for twenty-three OECD countries. The reported coefficients are the estimated pass-
through rates from a regression of changes in import prices and consumer prices on changes in
nominal exchange rates and foreign prices using quarterly data for the period 1975:1 to 2003:4.
The reported estimates of pass through of exchange rate changes are the cumulative one-year
impact from an exchange rate shock estimated from a partial-adjustment model. The effects on
import prices are provided in the first data column. The next data column presents similar pass-
through elasticities for consumer price indices.4 The differences between the import price and the
CPI responsiveness to exchange rate movements across almost all OECD countries are striking.
Pass through into border prices far exceeds pass through into the CPI. While striking, these
differences in sensitivity are not necessarily surprising, motivating the extensive analysis of our
paper.
For these OECD countries, the (unweighted) average pass through elasticity is 0.64 for
import prices. For seventeen of the twenty-three countries presented in the table, exchange rate
pass-through into import prices is statistically different from zero. This finding rejects the
hypothesis that import prices in domestic currency do not adjust to exchange rate changes.
Campa and Goldberg (2005) came to similar conclusions for both short-run and long-run pass-
through rates in the OECD countries, as did Campa, Goldberg, and González-Minguez (2006)
for the euro-area countries. Typically, most of the pass through of exchange rates into import
prices occurs within one or two quarters after an exchange rate movement.5
Burstein, Eichenbaum and Rebelo (2002). 4 The estimation technique is based on Campa and Goldberg (2005) and provided in the technical appendix. This analysis is based on linear regression models, without cointegrating relationships modeled. See related discussion in the aforementioned paper, and in Campa, Goldberg, and Gonzalez (2006). VAR estimates are presented in the appendix, and verify the reported results. 5 The regressions over full sample data for Belgium and France, starting in 1975, support long-run pass-through elasticities in excess of one. These elasticities implausibly imply that pass through is more than complete, instead of bounded by one. Both Belgium and France experience similar share and persistent accelerations in import prices between 1979 and 1985, with import prices more than doubling in this period. Currency depreciations during this period were not strongly trending, and were mild. If the estimation interval instead begins with 1987 data the

5
Table 1: Exchange Rate Pass-through Elasticities into Import and Consumer Price Indices
Country Pass-Through on Import
Prices Pass-through on Consumer
Prices Australia 0.67*+ 0.09+ Austria 0.10 -0.09 Belgium 0.68 0.08+ Canada 0.65*+ -0.01+ Czech Republic 0.6* 0.60*+ Denmark 0.82* 0.16*+ Finland 0.77 -0.02+ France 0.98* 0.48*+ Germany 0.80* 0.07+ Hungary 0.78* 0.42*+ Ireland 0.06 0.08+ Italy 0.35+ 0.03+ Japan 1.13* 0.11*+ Netherlands 0.84* 0.38*+ New Zealand 0.22+ -0.10*+ Norway 0.63* 0.08+ Poland 0.78* 0.59*+ Portugal 1.08* 0.60*+ Spain 0.70* 0.36*+ Sweden 0.38*+ -0.11+ Switzerland 0.93* 0.17*+ United Kingdom 0.46*+ -0.11+ United States 0.42*+ 0.01+ Average 0.64 0.17
* (+) indicates exchange rate pass through significantly different from zero (one) at a 5 percent confidence level. Most data are quarterly, spanning 1975 through early 2003. Data sources: nominal exchange rate and consumer prices come from the IFS; import price comes from the OECD. Specific start and end dates by country are detailed in the data appendix. Long-run elasticities (four quarters) shown.
By contrast, average pass-through into consumer prices is 0.17 over the long run, with
much larger standard deviations. These averages mask huge cross-country differences in CPI
sensitivity. Nevertheless, the hypothesis that the pass through to CPIs is smaller than one can be
rejected for all but one country, Austria, and in Austria’s case the insignificant point estimate is
negative. In general, larger countries tend to have lower levels of estimated pass through into the
estimated pass through rates for France are similar to those for the rest of Europe. Pass through rates for Belgium

6
CPI during this period, often below 10 percent, while estimated elasticities for some countries
can be as large as 60 percent (Czech Republic, Poland, and Portugal).6 The differences between
the estimated import price and CPI sensitivities are large, positive, and vary extensively across
countries.
A. A Two Country Model of the Exchange Rate Pass Through
For formalizing the exchange rate disconnect we appeal to a workhorse two-country
model with wage stickiness, as in Obstfeld and Rogoff (2000) and Corsetti and Dedola (2003).
This approach has a utility-based framework that explicitly tracks the degree of substitutability
of imported and domestic products, and presents the explicit cost functions faced by producers.
We assume C.E.S. utility functions over nontraded and traded goods consumption. Both sectors
produce a continuum of varieties with similar elasticities of substitution, θ. Home (h) and
foreign (f) tradable goods consumption are imperfect substitutes, with an elasticity of
substitution of φT > 1. Consumption of tradable (T) and nontradable (N) products are also
governed by a constant elasticity of substitution φ.
Given the C.E.S. structure of demand, and under the standard assumption that each
variety is sufficiently small so that changes in the prices of one variety have no impact on the
price aggregators, only competition among brands matters. The first order condition faced by a
producer of a brand h is:
( ) ( )1t tp h c h
θθ
=−
(1)
where ct(h) is the marginal cost of production and delivery to consumers of brand h. The
marginal cost of production at the producer level is determined by relative productivity levels
and nominal wages, which are assumed to be fixed in the short run and exogenous to exchange
rate changes. This specification implies that producer currency prices have a constant markup of
prices over marginal costs.
decline significantly, but remain high. Due to a short available data sample we preclude Greece from this table. 6 Frankel, Parsley and Wei (2004) provide an extensive analysis of pass through around the world, importantly including the developing countries, but for a smaller group of products than covered by the import price aggregates of these industrialized countries.

7
On the supply side, the marginal cost of production includes two components of cost: the
cost of producing the good and the cost of delivery of each brand to the consumer. Following
Erceg and Levin (1995), Burstein, Neves and Rebelo (2003), and Corsetti and Dedola (2003) we
assume that bringing one unit of traded goods to consumers requires units of a basket of
differentiated nontraded goods indexed by n.7 For computational simplicity, no distinction is
made in these models between nontradable consumption goods which directly enter an agent’s
utility, and nontraded distribution services which are jointly consumed with traded products. In
empirical analyses, distribution costs include expenditures on wholesale and retail sector
services, as well as expenditures on transportation and storage.
Let ( )tP h denote the price of brand h at producer level. With a competitive distribution
sector, the consumer price of good h is simply
( ) ( )( ) ( )t t t tP h P h m h P n= + (2)
where ( )tP n is the corresponding utility-based price index for nontradable products and
( )tm h are the distribution service inputs required per unit of output. This specification attributes
the failure of purchasing power parity across countries, at least in part, to the presence of local
transaction and distribution costs, as argued by Obstfeld and Rogoff (2000). Distribution margins
are direct contributors to the purchaser prices ( )tP h . Analogous notation is used for the imported
goods sector, indexed by brand f.
We introduce two simple extensions to this workhorse model to generate additional
realism in price sensitivity to exchange rates. First, we allow for the use of imported productive
inputs, thereby introducing a direct channel through which exchange rate changes influence
producer marginal costs8. We suppose that per unit production requires imported input share
( )htµ on home tradable goods and ( )ntµ on home nontradable goods. The pricing equations for
7 It is assumed that 1 11
0( )m m n dn
θθ θθ− −� �
= � �� �� . All traded goods use the same distribution inputs, so that sectoral
differences in distribution margins are not explicitly modeled.

8
home nontradable goods n, home tradable goods h, and imported consumption goods f are given
by
( ) *( ) ( ) :
1 1t t
t t tN F
W eWP n c n n e
Z Zθ θ µ
θ θ� �
= = +� �− − � � (3)
( ) *( ) ( ) : ( ) ( : )
1 1t
t t t t tH F
W eWP h c h m h e P n h e
Z Zθ θ µ
θ θ� �
= = + ⋅ +� �− − � � (4)
( )*
( ) *( ) : ( )1 1
tt t t t t
F
eWP f e c f m f e P n
Zθ θ
θ θ� �
= = + ⋅� �− − � � (5)
where Wt refers to the wage per unit of labor at home, *tW refers to foreign wages, and
the Z terms refer to productivity in the home tradables (h), home nontradables (n), and foreign
tradables (f). This derivation assumes that all distribution costs are incurred in the home market,
and productivity parameters as well as domestic and foreign wages are sticky over the relevant
pricing horizon. e, the exchange rate, is the domestic currency price of foreign exchange. 9
This widely used basic framework, assumes sticky wages, exogenous productivity, and a
monopolistic competition set-up that generates the mark-up rule over costs noted above. The idea
of local content in the final consumption of imported goods is found in various forms elsewhere.
Most, explicitly, terms like ( )t tm P n⋅ are found in Corsetti and deDola (2003) and Burstein,
Neves and Rebelo (2003) where distribution costs drive a wedge between border and
consumption prices on imports. Other studies consider imports more as intermediate goods that
are re-priced or combined with local content by distributors (or home final goods producers).
Devereux, Engel, and Tille (1999) and Devereux and Engel (2002) gave the distributor power to
re-price imported goods, resulting in imported goods prices that were sticky in the consumer’s
currency and consistent with prevalent local currency pricing. Obstfeld and Rogoff (2000) had
final consumption goods generated when traded goods were treated as intermediate goods,
without re-pricing, so that producer currency pricing was more prevalent. Bacchetta and van
8 The assumed short run rigidity of wages to real exchange rates is supported by recent empirical analyses [Campa and Goldberg 2002, Goldberg and Tracy 2003], except perhaps for some of the less-skilled workers changing jobs. Some sectoral differences in wage elasticities are evident in U.S. data. 9 This specification, which follows Corsetti and Dedola, implies that the markup on the final price gets also charged by the producer on the distribution part of the costs. An alternative approach could delink the markups on the producer and distribution costs. Our derivation disregards the second-order effect of nontradables sector use of imported inputs in the costs of the home tradables and in the distribution costs of the imported goods.

9
Wincoop’s (2003) model enables distributors to choose a pricing structure that minimizes
relative price fluctuations on the imported good. By contrast, Burstein, Neves, and Rebelo
(2003), following Erceg and Levin (1945), implicitly assume perfect competition among
distributors, who cannot therefore adjust the size of margins charged to deliver each brand to the
consumer. Under this assumption, the distribution sector drives a wedge between border price
and consumption price sensitivity to exchange rates, but does not have a role beyond being an
input into final consumption.
In our specification of distribution costs in equations (4) and (5) we introduce the
exchange rate as an argument of the distributor margin ( : )tm i e where ( , )i h f∈ . Including this
relationship allows for possible deviations in the empirical analysis from the competitive
distribution sector assumed in equation (2) above. Our specification doesn’t take a stand on a
particular industrial or competitive structure, and instead is intended to be general enough to
permit a fixed distribution margin in the face of currency fluctuations or permit large margin
responses if particular assumptions on industrial structure would warrant this. The process by
which distributors attempt to actively manage consumer prices is referred to as “double
marginalization,” as in Hellerstein (2004).
A second modification we make to the standard approach is the existence of imported
inputs as well as home inputs into the cost of producing home tradable goods. These imported
input shares, ( : )t i eµ , ( , )i n h∈ , vary by type of goods, and can be sensitive to exchange rate
movements. This sensitivity could subsume the effects of domestic agents re-pricing imported
intermediates for local markets and perhaps adding a bit of local content.
We differentiate equations (3) through (5) to derive home tradable, home nontradable,
and imported goods price elasticities, or pass through rates, with respect to exchange rates.
( ) ( )( : ), ( : ),( ),
* *( : ) ( : )
( ) /1 1
( ) / ( ) 1 ( )t t
t tu n e e u n e eP n e F F
t t
ew ewn e n e
Z ZP n eP n e c n P n
µ µθη η η
θ
� � � �� � � �∂ ∂� � � �= = + = +
−� � � �� � � �� � � �
(6)
( ) ( )( : ),( ), ( ), ( ),
*( : )
( ) / ( : ) ( )1
( ) / 1 ( ) ( )t tu h e eP h e P n e m h e F
t t
eWh e
ZP h e m H e P nP h e P h P h
µθη η η η
θ
� �� �∂ ∂� �= = + + +
− � �� �� �
(7)

10
( ) ( )( ), ( ), ( ),( : ) ( )( ) /1 1
( ) / 1 ( )tP f e m f e P n em f e P nP f e
P f e P fθη η η
θ∂ ∂ � �= = − − +� �−
(8)
In equation (6), which assumes monopolistic competition, the necessary condition for
nontraded goods prices to be sensitive to exchange rates is that producers use imported inputs.
Exchange rate changes pass through fully into the costs of imported inputs, except to the extent
that the production structure allows substitution away from these inputs when they are more
expensive, ( : ), 0t n e eµη < .
Equation (7) shows that home tradables prices can respond to exchange rates through two
channels: imported inputs in production or distribution margin responses to exchange rate
movements. Distribution expenditures can vary both because nontradables prices can respond to
exchange rates and because distributors may actively, and perhaps strategically, adjust their
markups on home tradables when the prices of competing imported brands move with exchange
rates. Exchange rate changes fully pass through into imported input costs, putting upward
pressure on final prices except to the extent that the home tradables producers can substitute
away from the imported inputs.
Equation (8) is typically the focal point of studies of the sensitivity of foreign goods
prices to exchange rates. Note, however, that this specification gives not border price sensitivity,
but rather consumption price sensitivity to exchange rates. Under monopolistic competition,
pass through into border prices will be complete, except in the presence of a distribution sector.
The distribution sector damps the import content of this consumption good (the first term), with
the magnitude of this damping dependent on whether distributor markups and nontraded goods
prices respond to exchange rates.
The price elasticity also is smaller when elasticities of substitution among goods θ are
larger: producers charge a smaller markup over costs when the competitive environment is more
intense. As in Corsetti and Dedola (2003), productivity conditions play an important role in
determining exchange rate pass through, leading to a “state contingent component of markups”,
whereby the prices charged by a producer in different markets depend on asymmetries across
countries in relative productivity and wages. The higher the productivity in home tradable goods
production relative to home nontradables, the larger the pass through.
11
We have not assumed a specific functional form for the elasticity of response of
distribution expenditures on home tradables and imported goods with respect to exchange rates.
Presumably, when the prices of imported goods rise, domestic distributor profits expand and the
sale price on competing domestic tradable goods may also rise incrementally. Pass through of
exchange rate fluctuations into import prices should be dampened when local distributor margins
can adjust in response to domestic currency depreciation. While we have not explicitly modelled
the elasticity of distributor margins, more structure on this can certainly be imposed. For
example, one could take advantage of differences when exchange rate fluctuations are viewed as
transitory versus permanent, an intuition early exposited by Froot and Klemperer (1989).
B. Pass Through into Import Prices, Relative to Consumer Prices
To derive the gap between import price and CPI responsiveness to exchange rates, we
begin with a CES aggregator ( ) ( )1
1 1 1(1 )t t tP P T P nφ φ φα α− − −� �= + −
� � , where ( )tP T and Pt(n) are
price aggregators for tradable and non tradable products respectively, φ is the substitution
elasticity and α is the consumption weight. Pass-through of exchange rates into the aggregate
CPI is given by
( ) ( ) ( ) ( ) ( )1 1
, ,, 1P T e P n et tP e
t t
P T P n
P P
φ φ
η α η α η− −
� � = + − � �
� � (9)
Prices of tradable goods are subject to a similar aggregator, where φΤ is the substitution elasticity
and αΤ is the consumption weight. Expanding this expression using the tradable goods
aggregator, the CPI elasticity with respect to exchange rates is
( ) ( )1 1 11 1
, 1 1T T
NH F P eP e P eP e NT H T FT T
T T
PP P P PP P P P P
φ φ φφ φ
η α α η α α η α η− − −− −
� � � � � = + − + − � � � � �� � � � �
(10)
Aggregate CPI pass through is a weighted average of pass through elasticities into traded
and nontraded prices. These two elasticities are state-contingent and dependent on relative wage
and productivity parameters in domestic and foreign markets (i.e. unit labor costs), elasticities of
substitution observed between tradable (foreign and domestic) and nontradable goods, imported
12
input use in domestic production, and distribution margins. The CPI elasticity also depends on
the share of tradables in consumption, the share of imported goods in tradables, and substitution
elasticities between products. A higher α magnifies the role of ( ) ( ), , and p h e p f eη η . A higher Tα
expands the role of ,, at the expense of fh p ep eη η . State dependent elasticity is introduced by
initial relative prices of different types of goods in the economy as and by the related
comparisons of unit labor costs across different types of goods.
When Tφ φ= , equation (8) becomes
( ) ( ) ( ) ( ) ( ) ( ) ( ) ( )1 1 1
, , ,, 1 1P h e P f e P n eP eT T
P h P f P n
P P P
φ φ φ
η α α η α α η α η− − −
� � � = ⋅ + ⋅ − + − � � �
� � � (10)
Rule of thumb discussions sometimes incorrectly think of the import share in domestic
demand as the main transmission channel for exchange rates into aggregate price indices. If the
home tradables share in consumption is zero, such a rule of thumb would focus attention on the
second term of equation (10). However, there are clearly other forces at work that imply different
responses of consumption goods to exchange rates. To some degree, basic pass through depends
on price elasticities, consumption shares, distribution margins, and imported input use.
Adjustments to this basic measure come about because elasticities of distribution expenditures
and imported inputs vary with exchange rates.
Because nontraded goods are consumed directly and provide local content into both home
tradable goods and imported goods, this channel can be particularly important for the CPI
sensitivity to exchange rates in this model. This channel disappears only if exchange rate
movements trigger full substitution away from imported inputs (or if imported input costs are
insensitive to exchange rates, as they are when priced in local currency). Exchange rates affect
home tradables prices due to the use of imported inputs in the production of these goods. Again,
only fully inelastic input costs would make this channel insignificant.
Other channels may impact the CPI through imported goods. There is direct transmission
into the CPI through the foreign content of the consumption good indexed by f, that is, all of the
value of this consumption good less the expenditure on distribution costs. The only modification
to this channel occurs if the expenditure on distribution changes when the exchange rate moves.
This latter adjustment is the double marginalization effect previously discussed. Finally, there
13
also is a possibility that distributors change the margins charged on home tradable goods when
they observe competing imports having price changes attributable to exchange rates.
III. Evidence on the Distribution Sector and on Imported Inputs in Production
As the previous derivation shows, explaining pass through into different price measures
requires data on distribution margins, demand elasticities, imported input use, consumption
shares, and relative prices within countries. Among these series, the evidence on distribution
margins and imported inputs in producton – across industries, and across countries – are the least
well documented. Burstein, Neves, and Rebelo (2003) provide evidence on the size of
distribution margins using data for two countries, the United States and Argentina. They
conclude that local distribution services (expenditures on transport, wholesale and retail services,
marketing, etc.) account for at least half of the retail prices of consumer goods, and an even
higher share of tradable agricultural products. Rauch (1999) found that transportation costs
(transport and freight expenditure as a percentage of customs value) for U.S. imports from Japan,
or similarly distant countries, in 1970, 1980, and 1990 ranged from 6 to 16 percent. Hummels
(1999) estimated average trade-weighted freight costs in 1994 at 3.8 percent for the United
States, and 7.5 percent for Argentina. Goldberg and Verboven (2001) concluded that local costs
account for up to 35 percent of the price of a car.
The evidence on imported inputs is even more limited. Campa and Goldberg (1997)
provide evidence for the evolution of imported inputs since 1975 into manufacturing for the
U.S., Canada, Japan and the UK. Hummels, Ishii and Yi (2001) present evidence in their work
on understanding the domestic content of a country’s exports. Other evidence on this falls under
the heading of outsourcing analysis, as exemplified by work surveyed in Feenstra and Hanson
(2005).
This paper dramitically expands our empirical understanding of these two subjects. We
provide evidence on distribution margins and imported inputs into production for twenty-one
countries, broken down into approximately thirty industries within each country and, in some
cases, captured over time. Our measures are more aggregated than the micro studies of
particular goods production chains,10 but are consistent with those findings and enable macro
10 For example, Hellerstein (2003) and Goldberg and Verboven (2001).

14
analysis of country-wide exchange rate pass through into import prices and the CPI. The
advantage of our measures is that they are consistently estimated across countries and have a
relatively large degree of comparability. In a number of countries, we are able to differentiate
between wholesale and retail distribution margins and transportation margins. For some
countries, we characterize margin dynamics over time and estimate the role played by exchange
rate fluctuations in these dynamics.
A.- Data and Measurement Issues.
We derive information to compute the measures of imported input and distribution
margins from input-output tables. Three different kinds of prices are used in Input-Output
analyses: basic prices, producer prices, and purchaser’s (or final) prices. Basic prices are the cost
of intermediate consumption plus cost of basic inputs (labor and capital) plus other net taxes
linked to production. Producer prices are basic prices plus other net taxes linked to products.
Purchaser or final prices are the sum of producer prices and distribution margins (retail trade plus
wholesale trade plus transport costs) plus Value Added Taxes. The different tax components are
twofold: “Other taxes linked to production” are those taxes (or subsidies) levied on companies
due to the fact that goods are produced, but are not linked to the amount produced or sold.
“Other taxes linked to products” are those taxes (or subsidies) levied on companies that are
linked to the amount produced or sold. These include VAT tax on the production process,
import duties, plus other taxes.
The OECD provides homogeneous input-output information for a large sample of
countries. However, we chose not to use the OECD information in this paper. The OECD input-
output tables often are constructed using producers prices, and therefore contain price distortions
due to country tax codes. To avoid these distortions we estimate the distribution margins as the
ratio of these costs relative to the value in purchasers prices. For this type of data, we use
Eurostat tables and country source data, sometimes drawn from so-called “supply-use” tables
These tables provide symmetric input-output tables broken down by domestic production and
imports. The value of each cell in the domestic (or import) table reports the amount of inputs
consumed from the row industry by the column industry that are produced domestically (or
abroad). We compute the imported input measure as the ratio for each industry between the total

15
amount of imported imports to the sum of the total amount of domestically produced and
imported inputs.
We compute two types of margins. Our preferred margins are “purchasers prices
margins”, i.e. the expenditures on distribution margins plus transportation taken relative to total
supply valued at purchasers prices. Our “basic prices margins” are similar, except that supply is
valued at basic prices. The measures constructed using basic prices avoid the issue of different
VAT tax rates, import duties, etc. across the different countries. The margins at purchasers’
prices include net taxes on production and products. Conceptually, the basic margins are more
similar to supplier calculations, while the purchasers margins are closer to calculations on the
basis of consumer prices. The literature has traditionally used margins measured relative to
purchasers prices and, for consistency, we will focus most of our discussion in this section on
this measure. The original source of the information for the countries for which we compute
margins and the years for which we have used country data are presented in Table 2.
In the last column of Table 2 we report the source of the data for each country. Industry
classifications differ slightly by source. We compute margins for each of the original industries
in each source (for example 91 in the case of the United States) then map these to 58 industry
headings (of which 29 are manufacturing and primary industries with positive distribution
margins) that we treat as comparable across countries.11 We compute overall distribution
margins and also use the input-output and supply-use tables of data to decompose the margins
into two component parts. For each industry and each country, one part of the margin is
attributable to transportation and storage costs, and the other to wholesaler and retailer charges.
The transport margins include transportation costs paid separately by the purchaser and included
in the use of products at purchasers’ prices but not included in the basic prices of a
manufacturers’ output or in the trade margins of wholesale or retail traders. The underlying
premise motivating this split is our expectation that the component of the total distribution
margins associated with wholesalers and retailers are likely to be most responsive to exchange
rate movements. Both margin components, however, would be important for persistent
deviations in the law of one price across products and countries.

16
Table 2: Data Sample from Input-Output Tables, by Year, Country, and Information Type
available years Price Computation Method Source Australia 1999/2000 &
2000/2001 Supply, Use and Margins table Australian Bureau of
Statistics Belgium
1995-2001 1995 & 2000
Supply Table Use table for imports
Eurostat
Denmark 1995-2001 1995 & 2000
Supply Table Use table for imports Eurostat
Estonia 1997 1997
Supply Table Use table for imports Eurostat
Finland 1995-2002 1995 & 2000
Supply Table Use table for imports Eurostat
France 1995,1997, 1999-2000 2000
Supply Table Use table for imports
Eurostat
Germany 1995 & 1997-2001 1995 & 2000
Supply Table Use table for imports
Eurostat
Greece 1998
1998 Supply Table Use table for imports
Eurostat
Hungary 1998-2000 2000
Supply Table Use table for imports
Eurostat
Ireland 1998 1998
Supply Table Use table for imports
Eurostat
Italy 1995-2001 1995 & 2000
Supply Table Use table for imports
Eurostat
Netherlands 1995-2001 1995-2000
Supply Table Use table for imports
Eurostat
New Zealand 1996 Supply, use, and import tables Statistics New Zealand
Norway 2001-2002 2001-2002
Supply Table Use table for imports
Eurostat
Poland 2000 2000
Input output table Use table for imports
Eurostat
Portugal 1995-1999 1999
Supply Table Use table for imports
Eurostat
Spain 1995-2000, 1995
Supply Table Use table for imports
Eurostat
Sweden 1995-2001 1995
Supply Table Use table for imports
Eurostat
United Kingdom 1995-2001 1995
Supply Table Use table for imports
Eurostat
United States 1995-2002 1997
Annual I-O Accounts Benchmark I-O table Bureau of Economic
Analysis
11 This harmonization and the industry definitions are not exact across countries, but we nonetheless treat these as matched in our specific empirical discussions.

17
B. The Size of Country and Industry Distribution Margins
We measure distribution margins for 29 manufacturing and primary-industry groupings.
The range of values for the distribution margins across countries and for these 29 industries
(unweighted by country or industry size) are provided in Table 3. A number of important
features of the distribution margin data are immediately apparent. First, margins vary
considerably across industries. Second, there are common patterns across countries in the
incidence of high and low margins for industries. Margins are consistently high in furniture and
miscellaneous manufactured goods (36), as well as in wearing apparel and furs (18), tobacco
products (16), and fish and fishing products (5). Margins appear to be lowest on some
commodity-type products and industries, such as petroleum and natural gas (11), ores and
mining products (12, 13, 14), and basic metals (27). Margins on the order of 20 percent of the
producer price are commonly observed across industries.
Looking in more detail within industries, in some cases we are able to decompose the
distribution margins into the share attributed to wholesalers and retailers, versus the share in
transport and storage. The wholesale and retail components dominate distribution costs in almost
all industries reporting data, accounting for about 90 percent of the total distribution costs added
to the basic prices of goods. The actual size of the “trade” margin is often in excess of 20 percent
of purchaser prices, and can be as high as 70 to 90 percent in some narrow product categories.
The transport margins are typically less than 5 percent of the purchaser prices, with the exception
of some of the mining and extractive resource industries. Generally, these are the only industries
where we observe transportation margins dominating distribution costs.
In Table 4, we provide some of this decomposition information, and also consider the
size of these distribution margins from the vantage point of countries, rather than industries. In
order to construct these country margins for each country, we sum over the distribution margins
for all industries that report non-negative margins (the net consumers of distribution services),
and divide this by the sum of output of all industries net of the output of those industries with
negative distribution margins at purchaser prices. Here, and in Table 5, note that distribution
margins are computed with respect to purchaser’s prices, as in the form presented in equation (2)
of the paper. As reported in Table 4, we calculate aggregate distribution margins on the order of
15 to 25 percent of output for the industries in this industrialized country sample. Expenditures

18
on wholesale and retail services account for the vast majority of these distribution margins.
While there is cross-country variability, the range of values across countries is somewhat narrow,
from a low of 8.4 percent in Hungary and Finland, to a high of 24 percent in the United States.
Table 3 Industry Patterns of Imported Input Use and Distribution Margin Shares
Imported Distribution Margins Product Inputs Total Margins Average Max. Min. Average Max. Min. 01 Products of agriculture, hunting and related services 17.25 54.47 6.33 16.40 27.52 1.67 02 Products of forestry, logging and related services 13.93 38.73 1.57 16.52 34.87 0.00 05 Fish and other fishing products; services incidental to fishing 20.33 60.64 2.74 23.72 54.43 2.42 10 Coal and lignite; peat 13.39 50.79 0.00 14.69 45.90 0.00 11 Crude petroleum and natural gas, services incidental to oil and gas extraction, excluding surveying 21.67 75.15 0.00 4.91 17.30 0.00 12+13 Uranium, thorium and metal ores 1.04 9.93 0.00 3.21 7.69 0.00 14 Other mining and quarrying products 15.67 60.08 0.00 19.40 43.20 0.00 15 Food products and beverages 21.12 48.27 5.74 19.67 29.67 8.96 16 Tobacco products 20.45 34.97 10.20 14.75 32.27 3.05 17 Textiles 31.74 55.68 0.00 20.54 38.53 7.95 18 Wearing apparel; furs 46.50 75.15 22.57 32.61 61.52 11.29 19 Leather and leather products 50.27 87.59 11.26 29.06 70.35 10.28 20 Wood and wood products 48.06 82.10 13.53 13.40 28.00 3.13 21 Pulp, paper and paper products 27.84 47.91 14.13 13.68 24.32 4.58 22 Printed matter and recorded media 41.68 77.97 16.02 15.98 26.40 7.10 23 Coke, refined petroleum products and nuclear fuel 23.62 47.42 10.52 13.53 40.54 4.67 24 Chemicals, chemical products and man-made fibers 67.28 90.92 0.00 16.80 27.30 3.46 25 Rubber and plastic products 43.56 67.96 19.90 13.61 28.01 5.14 26 Other non metallic mineral products 46.41 76.17 23.20 17.02 24.71 5.89 27 Basic metals 26.35 53.98 6.94 10.35 22.51 3.90 28 Fabricated metal products, except machinery and equipment 45.50 76.51 23.25 13.70 29.88 6.98 29 Machinery and equipment n.e.c. 34.57 76.22 17.83 14.04 31.77 4.35 30 Office machinery and computers 39.73 75.17 16.93 17.86 46.05 2.60 31 Electrical machinery and apparatus n.e.c. 56.43 98.42 34.98 12.64 24.23 2.55 32 Radio, television and communication equipment and apparatus 44.53 82.93 19.58 14.52 54.05 2.78 33 Medical, precision and optical instruments; watches and clocks 56.79 97.98 21.59 17.82 37.08 6.54 34 Motor vehicles, trailers and semi-trailers 43.08 72.86 18.82 13.45 23.15 6.40 35 Other transport equipment 50.96 83.22 16.86 6.76 26.38 1.44 36 Furniture; other manufactured goods n.e.c. 43.35 70.66 18.93 27.14 50.30 7.94
* Product names given with CPA Codes (Classification of Products by Activity). The margins represent the average of the wholesale and retail and transportation margins. Margins are calculated as: distribution margins divided by output at purchasers or final prices “Average Country Distribution Margins” are calculated as the sum of all non-negative distribution margins in a country’s data, divided by the sum of all output from all industries (except those with negative margin numbers). Imported Input share is calculated as the average of the imported input share for each industry . n.e.c. means not elsewhere classified. The sample included are the countries and years reported in the first two columns of table 4.

19
Table 4 Share of imported inputs in total costs and share of distribution margins in purchasers´ prices, by country*
Share Distribution margins Country Reference
Year
Share Imported
Inputs Average Max Min
Australia 2000/2001 . 21.4 54.1 3.6 Austria** 2001 29.4 15.6 34.6 0.0 Belgium 2000 31.7 13.8 34.9 2.5 Denmark 2000 25.5 16.0 35.8 2.5 Estonia 1997 39.5 12.1 25.9 3.4 Finland 2002 22.9 13.2 35.5 3.1 France 2000 14.1 19.4 62.3 1.0 Germany 2000 21.4 15.1 42.4 3.6 Greece 1998 . 19.6 46.8 0.4 Hungary 2000 33.5 8.4 23.8 0.4 Ireland 1998 48.5 9.5 27.0 0.0 Italy 2000 18.5 18.4 45.2 3.7 Netherlands 2001 30 14.6 36.5 0.0 New Zealand 1995/1996 . 13.9 32.3 0.0 Norway 2002 22.2 16.6 4.6 3.2 Poland 2000 19.0 . . . Portugal 1999 22.9 14.8 28.8 0.0 Spain 1995 17.5 18.1 75.5 0.1 Sweden 2001 26.1 15.4 35.8 1.0 United Kingdom**
2000 20.2 20.7 46.1 0.0
United States 1997 8.2 23.9 70.4 4.7
* Imported input ratios refer to the ratio of imported inputs to total inputs in all industries in each country, with the exception of the US, that refers to manufacturing only. Margin calculations for each country are taken as the simple average of all distribution margins relative the purchasers’ prices for the 29 homogenous industries reported in Table 3. Total margins may not equal the sum trade and transportation margins due to rounding. ** The data for imported inputs for Austria refers to 2000 and for the United Kingdom to 1995.
C.- Distribution margins by component of final demand
The reported margins in the previous section refer to the distribution margins for
aggregate final demand in each industry or country. However, margins differ substantially
across the components of final demand. For CPI discussions, we look exclusively at margins that
apply to consumption demand. To illustrate the stark differences in margins across categories of
final demand, Table 5 presents comparisons of margins across household consumption, fixed

20
capital formation, and exports. For each of these final demand categories, we report the total
distribution margins and their breakdowns between transport versus wholesale and retail
components.
Table 5 clearly shows that total distribution margins on household consumption goods are
much larger than those applied to investment or export goods. Total distribution margins in
household consumption range from a low of 32 percent of purchaser prices in Estonia to a high
of 50 percent in the Netherlands. Distribution margins are above 33 percent for almost all
countries in the sample (excepting Estonia and Portugal). By contrast, distribution margins in
fixed capital formation are substantially lower. The largest distribution margin in fixed capital
formation, for Austria, is 18.16 percent, followed by Denmark and Belgium. Distribution
margins in fixed capital formation are below 10 percent of purchaser costs for 7 out of 19
countries in the sample. Margins in exports are also smaller than margins in household
consumption. The average distribution margin in export industries is 13 percent, with a wide
range in their values. Nordic European countries tend to have very low distribution margins on
exports, with relatively large margins on household consumption.
The contribution of wholesale-retail and transportation to the total distribution margins
also varies by final demand component. While transportation accounts for a significant portion
of total distribution margin in exports, its contributions to the total margins for consumption and
gross-fixed capital formation are significantly lower. The transport margin in exports is larger
than the wholesale–retail margin for 11 countries in the sample. In household consumption, the
country with the largest transportation margin relative to the wholesale-retail portion is Norway,
with transportation margins being 40 percent of the size of the wholesale-retail margins. For the
typical country, transport margins make up less than 20 percent of the total margin in
consumption. Finally, transportation margins are particularly low for gross-fixed capital
formation. The median transportation margin in investment is 0.6 percent. Wholesale and retail
margins are also significantly lower for investment relative to other final demand components,
but even after taking this into consideration, the relative contribution of transportation to total
margins is lower for investment.

21
Table 5 Distribution Margins by Source of Final Demand (Percent) Household Consumption Fixed Capital Consumption Export
Country Year Wholesale-
Retail Transport Total
Wholesale
-Retail Transport Total
Wholesale
-Retail Transport Total
Australia 2000/01 . . . . . . . . . Austria 2000 36.08 8.76 44.84 17.57 0.59 18.16 6.71 3.38 10.09 Belgium 2000 29.24 5.41 34.65 15.91 0.42 16.34 7.16 3.99 11.14 Denmark 2000 40.15 6.05 46.20 17.18 0.21 17.39 10.51 19.08 29.58 Estonia 1997 24.15 7.64 31.79 7.16 0.51 7.66 5.85 14.91 20.77 Finland 2002 41.80 8.35 50.15 3.38 0.22 3.60 0.62 3.76 4.38 France 2000 27.26 6.24 33.50 7.96 1.39 9.35 3.20 5.24 8.44 Germany 2000 33.00 7.30 40.30 5.60 2.16 7.76 5.26 4.19 9.46 Greece 1998 31.02 6.50 37.52 13.60 0.00 13.60 13.44 13.75 27.19 Hungary 2000 30.60 6.87 37.47 10.53 0.00 10.53 2.24 2.70 4.94 Ireland 1998 26.30 8.30 34.61 . . . 5.11 1.49 6.60 Italy 2000 34.78 7.19 41.97 8.90 3.53 12.43 4.76 7.08 11.84 Netherlands 2001 41.80 8.35 50.15 3.38 0.22 3.60 0.62 3.76 4.38 New Zealand 1995/96 31.23 9.76 40.99 14.87 0.00 14.87 5.51 11.70 17.21 Norway 2002 29.30 11.92 41.23 9.60 2.89 12.48 4.55 17.00 21.55 Poland 2000 26.32 5.21 31.53 14.31 0.40 14.71 15.07 4.52 19.59 Portugal 1999 30.59 2.49 33.08 15.70 0.00 15.70 1.55 5.91 7.46 Spain 1995 32.01 5.84 37.84 3.17 0.63 3.80 5.77 5.69 11.46 Sweden 2001 32.34 2.93 35.26 10.72 0.17 10.89 1.26 4.50 5.76 United Kingdom 1995 40.89 7.80 48.69 5.76 1.42 7.19 8.49 5.18 13.67 United States 1997 40.93 1.82 42.75 13.88 1.58 15.46 9.46 3.06 12.53
D. Imported Inputs into Production
We measure the size of imported inputs for all industries in the input-output tables. For
comparison with the distribution margins, we report in the first columns of Tables 3 and 4 the
imported input measures calculated for the same set of industries for which we have calculated
distribution margins, i.e. for 29 homogeneous manufacturing and primary-industry groupings. A
clear pattern emerges from Table 3. Industries involved in agriculture and commodity
production have much lower shares of imported inputs than industries in the manufacturing
sector. For instance, Forestry, Logging and Related Services and Coal and Lignite have
imported input shares of around 13 percent of total costs. By contrast, all manufacturing
industries have imported input shares above 20 percent. Within the manufacturing sector,
22
Chemicals has the largest share of imported inputs, 67 percent of total costs, followed by
electrical machinery and medical and precision instruments, both with imported input shares
above 50 percent. The industries within manufacturing with the lowest imported input shares are
forestry and metal ores.
The dispersion of imported inputs into production also differs significantly by country.
Table 4 reports the average imported inputs into production for all industries. This measure
includes not only the industries reported in Table 3 but also other industries such as Electricity,
Transportation, Trading, Insurance, Finance and Other Services. In general, larger countries
have a lower share of imported inputs into production while smaller countries have a higher
share. The United States has the lowest ratio of imported inputs into production of all countries
in the sample, although its data is not fully comparable since it refers to only manufacturing
industries. The next lowest is France. Ireland, with 49 percent, has by far the largest ratio of
imported inputs into production. Other smaller countries like Belgium, Hungary and Portugal
also have large ratios of imported inputs into production.
The role of imported inputs differs substantially between manufacturing industries and
other industries. We already discussed that manufacturing industries have a much larger share of
imported inputs than Agriculture and Mining. In the appendix we present the ratio of imported
inputs in the production of other non-manufacturing industries, mainly Energy, Construction,
Transportation, and Services. Imported inputs have a large share of costs of production mainly in
those industries with a large consumption of energy products as raw materials. These industries
include Electricity, Gas, Steam, Water and Air Transport. Imported inputs are also important for
Repair of Motor Vehicles as auto parts are a highly tradable industry. For the other non-
manufacturing industries, imported inputs play a minor role, with ratios almost always below 20
percent of production costs.
E. Do Distribution Margins Respond to Exchange Rate Fluctuations?
As discussed in section 2, exchange rates may influence profit margins, both at the level
of initial producers and again at the level of wholesalers and retailers. The specific size of this
relationship depends on the competitive structures assumed and the relationship between the
23
foreign producer and the local distributor. In this section we use the data available on distributor
margins to explore evidence of their responsiveness to exchange rate fluctuations.
Some of the countries in our panel have multiple years of margin data that can be used
for time-series panel construction. These data do not distinguish between markups for foreign
versus domestic producers, nor do they distinguish margins by different components of final
demand. The data span is 1995 to 2001 for Belgium, Denmark, France, Germany, Italy, Spain,
and the United Kingdom, and 1995 to 2002 for the United States.
The time-series panel regression specification we use is given by equation (11)
tctcct
ct Xm εααα +∆++=∆ (11)
where � indicates first differences in the logarithm of the variable in country c. We
introduce some combination of country and year fixed effects and ctX∆ variables that are
country-specific nominal and real exchange rates. The results reported in Table 6 are the
correlations between changes in the distribution margin (wholesale, retail plus transportation) of
total final demand relative to changes in the nominal and the real effective exchange rate of each
country.
There are three reasons the results will likely understate the sensitivity of margins to
exchange rates. First, the relevant data are available only for total distribution margins, and not
for the decomposition into the trade versus transportation components. Ideally, we would focus
only on the wholesale and retail component, which ex ante is likely to be more elastic than the
transport and storage component of the margins. As shown in Tables 4 and 5, however, this is
not a first order concern because most industries have the majority of their distribution costs
associated with the wholesale and retail component. Second, this data is much broader than our
other sources: it is at the level of countries, rather than industries and aggregates margins on
investment spending, exports, and government demand. As a consequence, we expect the results
to yield elasticities much smaller in absolute terms than would be expected specifically for retail
margins on consumption goods. Third, the distribution expenditures are across home tradable
and imported goods. We will be unable to disentangle ( ),m h eη from ( ),m f eη and instead will be
observing a weighted average of the two terms.
24
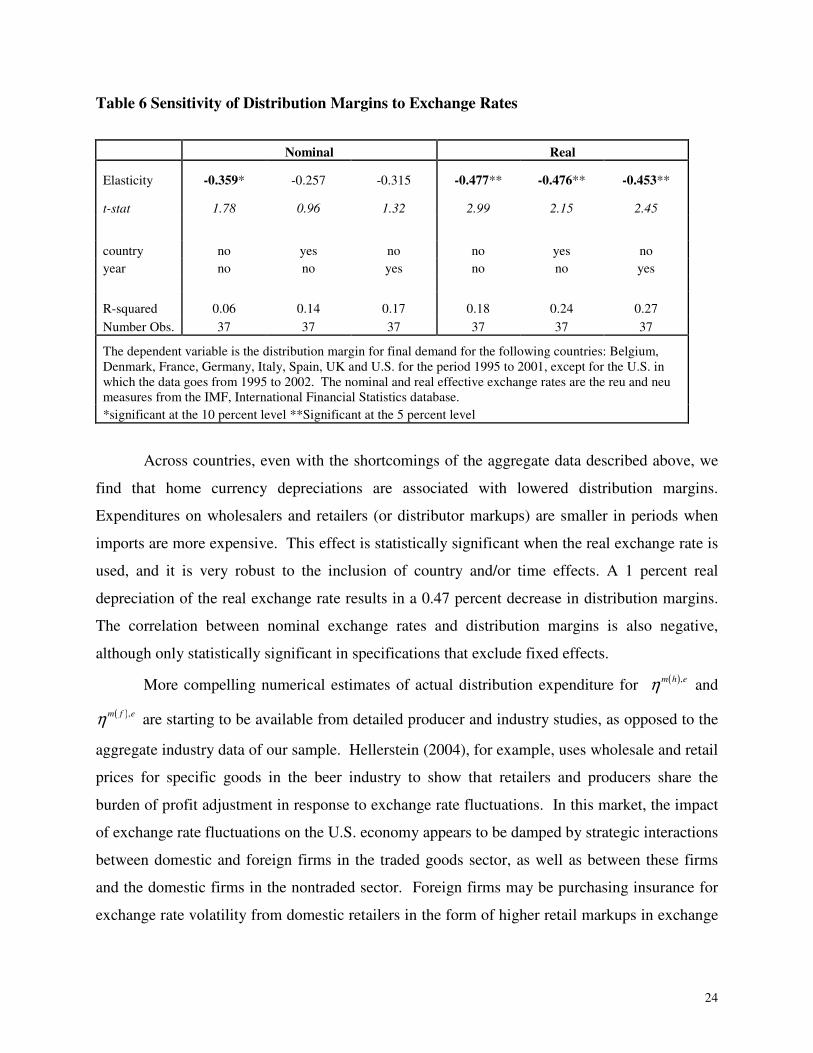
Table 6 Sensitivity of Distribution Margins to Exchange Rates
Nominal Real
Elasticity -0.359* -0.257 -0.315 -0.477** -0.476** -0.453**
t-stat 1.78 0.96 1.32 2.99 2.15 2.45
country no yes no no yes no year no no yes no no yes
R-squared 0.06 0.14 0.17 0.18 0.24 0.27 Number Obs. 37 37 37 37 37 37
The dependent variable is the distribution margin for final demand for the following countries: Belgium, Denmark, France, Germany, Italy, Spain, UK and U.S. for the period 1995 to 2001, except for the U.S. in which the data goes from 1995 to 2002. The nominal and real effective exchange rates are the reu and neu measures from the IMF, International Financial Statistics database. *significant at the 10 percent level **Significant at the 5 percent level
Across countries, even with the shortcomings of the aggregate data described above, we
find that home currency depreciations are associated with lowered distribution margins.
Expenditures on wholesalers and retailers (or distributor markups) are smaller in periods when
imports are more expensive. This effect is statistically significant when the real exchange rate is
used, and it is very robust to the inclusion of country and/or time effects. A 1 percent real
depreciation of the real exchange rate results in a 0.47 percent decrease in distribution margins.
The correlation between nominal exchange rates and distribution margins is also negative,
although only statistically significant in specifications that exclude fixed effects.
More compelling numerical estimates of actual distribution expenditure for ( ),m h eη and
( ),m f eη are starting to be available from detailed producer and industry studies, as opposed to the
aggregate industry data of our sample. Hellerstein (2004), for example, uses wholesale and retail
prices for specific goods in the beer industry to show that retailers and producers share the
burden of profit adjustment in response to exchange rate fluctuations. In this market, the impact
of exchange rate fluctuations on the U.S. economy appears to be damped by strategic interactions
between domestic and foreign firms in the traded goods sector, as well as between these firms
and the domestic firms in the nontraded sector. Foreign firms may be purchasing insurance for
exchange rate volatility from domestic retailers in the form of higher retail markups in exchange

25
for greater variability in these markups. The Hellerstein (2004) analysis of the beer market in the
United States finds that a 1 percent depreciation of the dollar with respect to the euro is
associated with a 0.50 percent decrease of retail margins for european brands, a .30 percent
decrease in the retail margins of competing (but unaffected) imported brands, (primarily brands
from Canada and Mexico), and a 0.10 percent decrease in the retail margins of domestic brands.
If one limits the last number to import competing domestic brands (light beers), the retail
margins decrease by 0.20 percent. But as both "import competing" and non-import competing
brands are included in our data on tradable domestic goods, the 0.10 number is the most relevant.
These estimates appear within the same ball park as those reported for the aggregate distribution
margins of a country reported in Table 7. In work on the automobile industry, Hellerstein and
Villas-Boas (2006) show that the margins on domestic brands that are not close substitutes for
imported brands rise by roughly 0.10 percent following a 1 percent dollar depreciation.
E. Consumption, Trade Shares, and Elasticity Estimates
Calibration of the pass through elasticities requires information on the shares of tradables
in consumption, imports in tradables, and imported inputs relative to production costs. We
compute these shares using the information from the country Input-Output data. We follow the
OECD industry classification reported in Appendix Table 1.12 The data are provided in Table 7
for twenty-one countries. The share of tradable goods in consumption ranges from 25 percent
for the US to 59 percent for Estonia, and is typically about 35 percent. Imports as a share of
tradables consumption also varies considerably across countries, from the US at 20 percent to
Denmark at 59 percent. With imports in tradables consumption on the order of 25 to 35 percent,
the resulting share of imports in overall consumption is between 5 and 15 percent.
12 In our constructions, the share of tradables in consumption is the sum of final consumption from OECD industries 1 to 24, divided by total final consumption net of consumption in wholesale and retail (OECD industry 27), and distribution (OECD industry 29).12 The nontradables industries are from OECD industry 25 and higher, excluding industry 27 and 29, picking up domestic services, electricity, gas and water. The import share of tradables is computed as the sum of imports in the final consumption for industry 1 through 24, relative to the sum of total consumption across these industries. Imported inputs into nontradables are the sum of imports into intermediate consumption for industries 25 and higher, excluding industry 27 and 29, relative to total intermediate inputs consumption for these same industries. Finally, the share of imported inputs in tradables production is the sum of
26
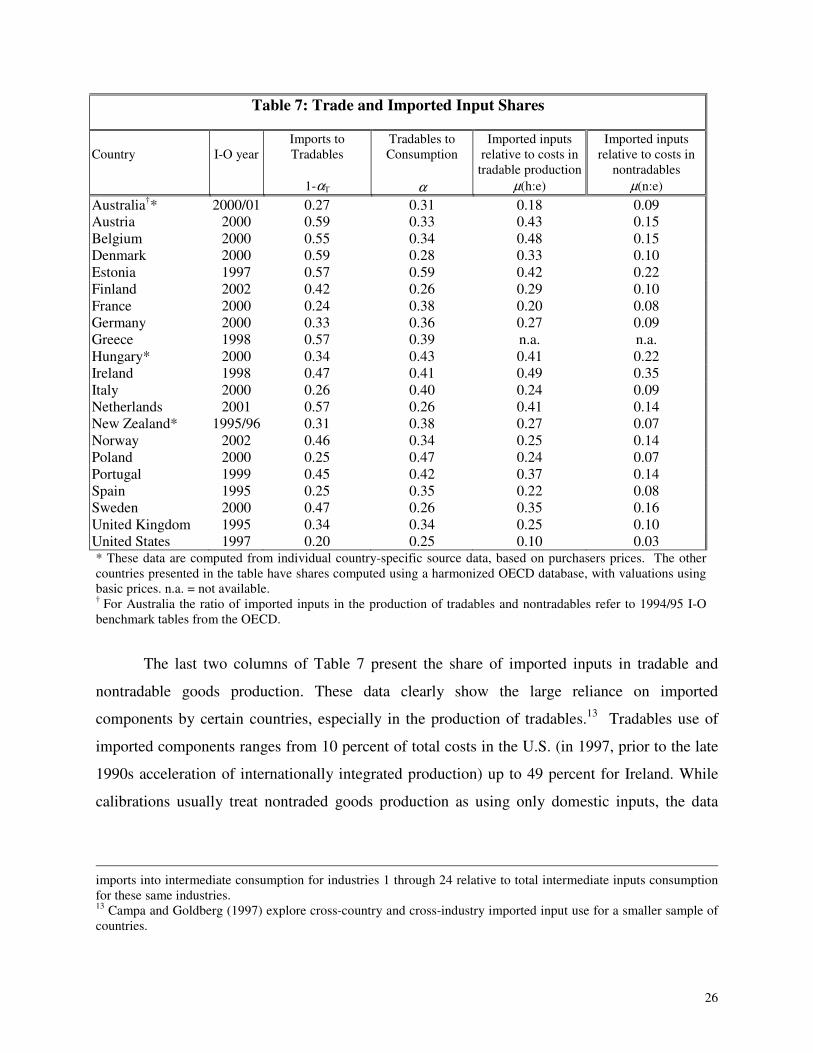
Table 7: Trade and Imported Input Shares
Country
I-O year
Imports to Tradables
1-αT
Tradables to Consumption
α
Imported inputs relative to costs in
tradable production µ(h:e)
Imported inputs relative to costs in
nontradables µ(n:e)
Australia†* 2000/01 0.27 0.31 0.18 0.09 Austria 2000 0.59 0.33 0.43 0.15 Belgium 2000 0.55 0.34 0.48 0.15 Denmark 2000 0.59 0.28 0.33 0.10 Estonia 1997 0.57 0.59 0.42 0.22 Finland 2002 0.42 0.26 0.29 0.10 France 2000 0.24 0.38 0.20 0.08 Germany 2000 0.33 0.36 0.27 0.09 Greece 1998 0.57 0.39 n.a. n.a. Hungary* 2000 0.34 0.43 0.41 0.22 Ireland 1998 0.47 0.41 0.49 0.35 Italy 2000 0.26 0.40 0.24 0.09 Netherlands 2001 0.57 0.26 0.41 0.14 New Zealand* 1995/96 0.31 0.38 0.27 0.07 Norway 2002 0.46 0.34 0.25 0.14 Poland 2000 0.25 0.47 0.24 0.07 Portugal 1999 0.45 0.42 0.37 0.14 Spain 1995 0.25 0.35 0.22 0.08 Sweden 2000 0.47 0.26 0.35 0.16 United Kingdom 1995 0.34 0.34 0.25 0.10 United States 1997 0.20 0.25 0.10 0.03 * These data are computed from individual country-specific source data, based on purchasers prices. The other countries presented in the table have shares computed using a harmonized OECD database, with valuations using basic prices. n.a. = not available. † For Australia the ratio of imported inputs in the production of tradables and nontradables refer to 1994/95 I-O benchmark tables from the OECD.
The last two columns of Table 7 present the share of imported inputs in tradable and
nontradable goods production. These data clearly show the large reliance on imported
components by certain countries, especially in the production of tradables.13 Tradables use of
imported components ranges from 10 percent of total costs in the U.S. (in 1997, prior to the late
1990s acceleration of internationally integrated production) up to 49 percent for Ireland. While
calibrations usually treat nontraded goods production as using only domestic inputs, the data
imports into intermediate consumption for industries 1 through 24 relative to total intermediate inputs consumption for these same industries. 13 Campa and Goldberg (1997) explore cross-country and cross-industry imported input use for a smaller sample of countries.
27
show that the share of imported inputs in the production of nontraded goods ranges from 3 to 35
percent of production costs inclusive of labor costs, with a value typically around 10 percent.
IV. Calibrated Pass through into Import Prices and the CPI
This section addresses the predictions of the model in two dimensions: 1) price elasticities
with respect to exchange rates for nontraded, home tradable, and imported goods and 2) the
values these elasticities imply for transmission rates from exchange rate movements into the CPI.
We begin by generating predicted rates of exchange rate pass-through into home tradable goods,
imported goods, and home nontraded goods prices using plausible parameters for the model
calibrations and the rich data on distribution margins, imported input shares, and consumption
shares. We generate model-based predictions of exchange rate pass through into the CPI, and a
variant on these predictions that uses estimated import price elasticities, showing the sensitivity
of all predictions to assumed parameters of the models.
The calibration requires values for the demand elasticity (θ ),elasticities of substitution
among groups of products, and elasticities of response to exchange rates of distribution margins
and imported inputs.14 Following Corsetti, Dedola, and Leduc (2004), we use demand elasticity
estimates, θ , that are consistent with the steady state price over cost markups, defined by
( )1markup θ θ= − , reported in the literature. Basu and Fernald (1997) find markups for United
States industries in the range of 11 percent. Oliveira Martins, Scarpetta, and Pilat (1996), after
examining 14 OECD countries and 36 manufacturing industries, find markups generally ranging
between 10 and 35 percent. These markup values imply values of θ between 10 and 4. Higher
values of pass through into home tradables are generated when we assume lower demand
elasticities. For the elasticity of substitution between tradable and nontradable goods, Stockman
and Tesar (1995) report, based on a sample of 30 countries, an elasticity of substitution between
tradable and nontraded goods at ( )1 1 0.44φ− = (yielding 2.27φ = ). However, this parameter
will not come into play in the calibrations provided below because we will assume unity
14 The calibrations basically shut down the role of initial conditions and substitution between tradables and nontradables goods by setting the relative price terms to equal one in the calculations. Accordingly, values of φ do not matter for these calibrations. Corsetti, Dedola, and Leduc (2004) use ( )1 1 0.77φ− = , implying 1.3φ = , based
on Mendoza (1991).

28
between the initial relative prices of imported and home tradables, and of home tradables and
nontradables.
We assume imported input share elasticities to exchange rates of either 0 or -0.10.
Furthermore, we assume that these elasticities are identical across the production of nontradables
and home tradables. Under these assumptions, a home currency depreciation of 1 percent either
has no effect on the volume of imported inputs used, or decreases imported input share by 0.10
percent.
We assume larger elasticities for distribution margins, consistent with the empirical
evidence on this point reported in Table 7. We assume values for ( : ),m f e eη between 0 and -0.50; in
response to a 1 percent home currency depreciation, distributors can either leave margins on
home tradables unchanged, ( : ), 0m h e eη = , or lower margins by 0.50 percent 15
Table 8 reports our model’s predictions of price elasticities of response to exchange rates.
Recall that these elasticities are all derived under the monopolistic competition structure. This
assumption implies that pass through of exchange rates into nontraded goods prices and home
tradables occurs because of the existence of imported inputs whose prices are sensitive to
exchange rates. In imported goods, pass through of exchange rates is stronger, dipping below 1
only to the extent that distribution costs add value in the local economy and adjust to exchange
rate changes.16 As indicated above, we calibrate the results for two possible rates of this
adjustment of distribution margins to exchange rates, 0 and -.50 percent.
The first two data columns of Table 8 show pass through into nontraded goods prices
(equation 6) across countries, and the sensitivity of such pass through to the assumption of
demand elasticity, θ , valued at 4 or 10. The next two columns provide calibrated exchange-rate
pass through into home tradables prices (equation 7). The final group of columns explores the
sensitivity to exchange rates of the consumption prices of imported goods (equation 8), under
alternative assumptions about demand elasticities and distributor margin responses to exchange
rates.
15 We also have not experimented here with the state contingent markup changes associated with productivity differences across countries, although we have all the mechanisms in place for such comparisons. 16 Of course, the empirical evidence on border prices generally finds less than complete pass through of exchange rates into border prices, as demonstrated by the results shown in Table 1 on import prices and by the other related studies cited. This implies that the calibration results are likely to overstate exchange rate pass through into the respective price series, and into the aggregate CPI.
29
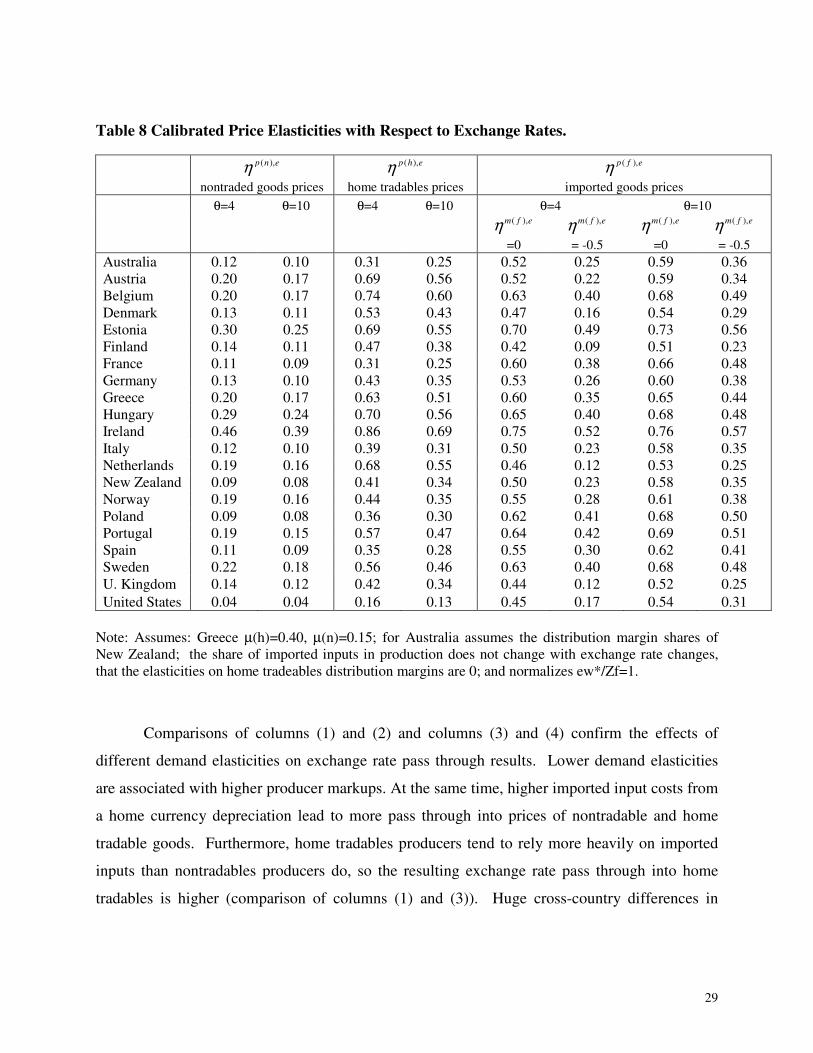
Table 8 Calibrated Price Elasticities with Respect to Exchange Rates.
( ),p n eη nontraded goods prices
( ),p h eη home tradables prices
( ),p f eη imported goods prices
θ=4 θ=10 θ=4 θ=10 θ=4 θ=10
( ),m f eη =0
( ),m f eη = -0.5
( ),m f eη =0
( ),m f eη = -0.5
Australia 0.12 0.10 0.31 0.25 0.52 0.25 0.59 0.36 Austria 0.20 0.17 0.69 0.56 0.52 0.22 0.59 0.34 Belgium 0.20 0.17 0.74 0.60 0.63 0.40 0.68 0.49 Denmark 0.13 0.11 0.53 0.43 0.47 0.16 0.54 0.29 Estonia 0.30 0.25 0.69 0.55 0.70 0.49 0.73 0.56 Finland 0.14 0.11 0.47 0.38 0.42 0.09 0.51 0.23 France 0.11 0.09 0.31 0.25 0.60 0.38 0.66 0.48 Germany 0.13 0.10 0.43 0.35 0.53 0.26 0.60 0.38 Greece 0.20 0.17 0.63 0.51 0.60 0.35 0.65 0.44 Hungary 0.29 0.24 0.70 0.56 0.65 0.40 0.68 0.48 Ireland 0.46 0.39 0.86 0.69 0.75 0.52 0.76 0.57 Italy 0.12 0.10 0.39 0.31 0.50 0.23 0.58 0.35 Netherlands 0.19 0.16 0.68 0.55 0.46 0.12 0.53 0.25 New Zealand 0.09 0.08 0.41 0.34 0.50 0.23 0.58 0.35 Norway 0.19 0.16 0.44 0.35 0.55 0.28 0.61 0.38 Poland 0.09 0.08 0.36 0.30 0.62 0.41 0.68 0.50 Portugal 0.19 0.15 0.57 0.47 0.64 0.42 0.69 0.51 Spain 0.11 0.09 0.35 0.28 0.55 0.30 0.62 0.41 Sweden 0.22 0.18 0.56 0.46 0.63 0.40 0.68 0.48 U. Kingdom 0.14 0.12 0.42 0.34 0.44 0.12 0.52 0.25 United States 0.04 0.04 0.16 0.13 0.45 0.17 0.54 0.31
Note: Assumes: Greece µ(h)=0.40, µ(n)=0.15; for Australia assumes the distribution margin shares of New Zealand; the share of imported inputs in production does not change with exchange rate changes, that the elasticities on home tradeables distribution margins are 0; and normalizes ew*/Zf=1.
Comparisons of columns (1) and (2) and columns (3) and (4) confirm the effects of
different demand elasticities on exchange rate pass through results. Lower demand elasticities
are associated with higher producer markups. At the same time, higher imported input costs from
a home currency depreciation lead to more pass through into prices of nontradable and home
tradable goods. Furthermore, home tradables producers tend to rely more heavily on imported
inputs than nontradables producers do, so the resulting exchange rate pass through into home
tradables is higher (comparison of columns (1) and (3)). Huge cross-country differences in

30
imported input use generate levels of calibrated pass through in nontradables prices that are ten
times greater in Ireland than in the United States, with home tradables pass through five times
greater.
The last four columns of Table 8 focus on pass through into the consumption prices of
imported goods, i.e. prices including distribution costs in local currency. Column (5) shows that
adding a distribution sector with local costs drives a large wedge between complete pass through
and the new calibrated pass through for imported goods prices. Distribution margin sensitivity to
exchange rates, with distributors lowering markups when the home currency depreciates, further
reduces the sensitivity of consumption prices of imports to exchange rates. However, these
distribution margin reactions cannot eliminate pass through because distribution services also
require imported inputs, which have costs sensitive to exchange rates. Thus, we observe pass
through into the consumption prices of imported goods to be lowest for countries with high
distribution shares, as is the case for the Netherlands, Finland, and the United Kingdom, when
margins are adjusted to offset the effects of exchange rates ( : ),m f e eη =-0.50 (instead of =0), and
when imported input shares are small in the nontraded goods sector.
Four key parameter assumptions influence the values reported in Table 8: the demand
elasticity, the elasticities of imported input shares and of distribution margins in the different
types of goods, and the real marginal cost in the production of foreign goods. While Table 8 has
allowed for differences in demand elasticities, Table 9 explores the impact on these exchange-
rate pass through elasticities of changes in two additional parameters: the pass through of
exchange rate movements via imported input shares and distribution margins to prices in
domestic currency of imports, domestically produced tradables, and nontradables, with a focus
only on estimates for the United States. Comparing columns (1) and (2) of this table: when the
distribution margin on imported goods is sensitive to exchange rates, the effect is a reduced
sensitivity of consumption prices of imports to exchange rates. If this force is strong enough,
and in the absence of imported inputs for the nontraded sector, exchange rate pass through into
the consumer prices of imported goods could resemble local currency pricing, as Devereux and
Engel (2002) have argued. When distribution margins on home tradables are sensitive to
exchange rates, and if this sensitivity goes in the direction of increasing the margins when
competing imports become more expensive, exchange rate pass through into home tradables is

31
increased (columns 3, 4). Finally, allowing for substitution out of some imported inputs
(columns 5, 6) directly reduces pass through into nontraded goods prices and home tradables
prices, and has an additional indirect downward effect on pass through of home tradables and
imported goods by reducing transmission of exchange rates through distribution sector costs.
Table 9 U.S. Exchange Rate Pass-Through Elasticities, under alternative assumptions assumptions (1) (2) (3) (4) (5) (6) (7) θ 4 4.00 4.00 4.00 4.00 4.00 4.00
( ), ( ),n e h eµ µη η= 0 0.00 0.00 0.00 -0.10 -0.10 -0.10 ( ),m h eη 0 0.00 0.10 0.10 0.00 0.10 0.10 ( ),m f eη 0 -0.50 0.00 -0.50 -0.50 0.00 -0.50
ew*/zf 1 1.00 1.00 1.00 1 1.00 1.00
results ( ),p n eη 0.040 0.040 0.040 0.040 0.036 0.036 0.036 ( ),p h eη 0.156 0.156 0.213 0.213 0.141 0.198 0.198 ( ),p f eη 0.453 0.168 0.453 0.168 0.165 0.450 0.165
,cpi eη 0.084 0.070 0.095 0.081 0.063 0.089 0.075
As a final exercise, we bring all of these findings together to inform the question of what
exchange rate pass through into CPIs is expected, given the features of each economy observed
in the data and assumed in the calibration exercises. The first relevant set of data are the degrees
to which different price elasticities feed into CPI sensitivity to exchange rates, based on the
shares of each type of good in the index (see equation 10). These CPI weights are computed and
presented in the first three data columns of Table 10. Clearly, nontraded goods have the largest
weights in CPIs across all countries, ranging from a low of 0.41 for Estonia to a high of 0.75 for
the United States. The home tradables weight ranges from 0.11 for the Netherlands and
Denmark, to nearly 0.30 across a number of larger countries. The weight on imported goods
ranges from a low of 0.05 for the United States to a high of 0.34 for Estonia.

32
Table 10 Exchange Rate Pass through into the CPI
Weight on Price Elasticities in
the CPI Elasticity Exchange Rate Pass Through into CPI Estimated Calibrated, θ=4
( ),p h eη weight
(1)
( ),p f eη weight
(2)
( : ),p n e eη weight
(3)
Reproduced From
Table 1 (4)
Assuming ( : ),m f e eη =0
(5)
Assuming ( : ),m f e eη
=-.5 (6)
Assuming estimated import price pass
through and assuming
( : ),m f e eη = 0 -0.5
(7) (8) Australia 0.23 0.08 0.69 0.09* 0.20 0.17 0.13 0.12 Austria 0.14 0.20 0.67 -0.09 0.33 0.27 0.03 0.03 Belgium 0.15 0.19 0.66 0.08+ 0.36 0.32 0.25 0.22 Denmark 0.11 0.16 0.72 0.16*+ 0.23 0.18 0.19 0.15 Estonia 0.25 0.34 0.41 0.53 0.46 Finland 0.15 0.11 0.74 -0.02 + 0.22 0.18 0.17 0.14 France 0.29 0.09 0.62 0.48*+ 0.21 0.19 0.21 0.19 Germany 0.24 0.12 0.64 0.07+ 0.25 0.22 0.20 0.17 Greece 0.17 0.23 0.61 0.36 0.31 Hungary 0.28 0.14 0.57 0.42*+ 0.46 0.42 0.36 0.33 Ireland 0.21 0.19 0.59 0.08+ 0.61 0.56 0.04 0.03 Italy 0.29 0.10 0.60 0.03+ 0.24 0.21 0.08 0.07 Netherlands 0.11 0.15 0.74 0.38*+ 0.29 0.24 0.24 0.20 New Zealand 0.26 0.12 0.62 -0.10*+ 0.23 0.19 0.05 0.04 Norway 0.19 0.16 0.66 0.08+ 0.29 0.25 0.18 0.16 Poland 0.35 0.12 0.53 0.59*+ 0.25 0.23 0.20 0.18 Portugal 0.23 0.19 0.58 0.60*+ 0.36 0.32 0.39 0.35 Spain 0.26 0.09 0.65 0.36*+ 0.21 0.19 0.15 0.13 Sweden 0.14 0.12 0.74 -0.11 + 0.32 0.29 0.12 0.11 United Kingdom 0.23 0.11 0.66 -0.11+ 0.24 0.20 0.11 0.09 United States 0.20 0.05 0.75 0.01+ 0.08 0.07 0.04 0.03 average 0.21 0.15 0.64 0.16 0.30 0.26 0.15 0.13 * (+) indicates exchange rate pass through significantly different from zero (one) at a 5 percent confidence level.
The remaining data columns of Table 10 address actual and calibrated exchange rate pass
through into consumer price indices across twenty-one countries. In column (4) we reproduce
estimates of exchange rate pass through in CPIs, previously reported in Table 1.17 Columns (5)
through (8) present calibrated CPI pass through, under benchmark assumptions of θ = 4, ( : ),m f e eη =0 or -0.50, and other elasticity parameters at 0. Columns (5) and (6) are the result of
17 Appendix results show that VAR methods produce similar CPI pass through elasticities.

33
multiplying the corresponding weights for each type of good reported in columns (1) to (3) of
this table with the corresponing calibrated elasticities for that type of good from Table 8, where
exchange rates pass through completely into border prices, and distribution margins and
imported input use are the main reasons for deviations from full exchange rate pass through into
consumption prices. Columns (7) and (8) embed the recognition that exchange rate pass through
into border prices is incomplete. This incomplete pass through essentially weights downward the
calibrated numbers of columns (5) and (6), on average by about 50 percent.
Calibration results predict exchange rate pass through into the CPI that average between
30 percent and 13 percent, depending on what is assumed about the double-marginalization
process and what is assumed on exchange rate pass through into import prices at the border. In
all cases, predicted cross country differences can be substantial. The highest calibrated
exchange rate pass through into the CPI occurs in Ireland, Estonia, and Hungary, at over 40
percent (columns 5 and 6). The lowest calibrated pass through is for the United States. A much
larger group of countries are in intermediate ranges of calibrated exchange rate pass through into
the CPI, between 20 to 30 percent. A number of European countries have actual CPI sensitivities
higher than their calibrated values, but more typically the predictions are correlated with actual
(noisy) estimates and similar magnitudes.
Among these countries, consider the relative importance of imported inputs and
distribution margins in driving exchange rate pass-through into the CPI. To analyze this relative
contribution we calibrate the hypothetical exchange rate pass-through into CPIs under the three
alternative assumptions: eliminating imported inputs into the economy, eliminating distribution
costs, and eliminating both effects at once.
These newly calibrated pass-throughs into the CPIs are reported in the last four columns
of Table 11. The first two columns of Table 12 reproduce the calibrated pass-through elasticities
to CPIs reported in Table 10. The next two columns, where imported inputs are zero, starkly
demonstrate how important these imported inputs are for exchange rate pass through into
consumer prices in this model. Higher imported inputs contribute to the price of nontradable
goods, which have the largest weight on the CPI, and also have an indirect impact in the price of
home produced tradable products. Since nontradables are a part of the final consumption value
of both home tradables and imported consumption goods, the role of transmission through

34
imported input costs is further magnified. These effects combined account for the vast majority
of the sensitivity of CPIs to exchange rates in the model. Columns (3) and (4) show that the pass
through drops by almost 75 percent in all countries under a counterfactual with no imported
inputs in production. The average pass through for all countries drops from 0.16 to 0.04.
Table 11: Exchange Rate Pass through into the CPI under alternative scenarios
Assuming estimated import price pass-through, and ( : ),m f e eη = 0 or -0.50
Country Base Case* No Imported Inputs No distribution
costs
Neither imported inputs nor
distribution costs
( : ),m f e eη =0 ( : ),m f e eη =-.5 ( : ),m f e eη =0 ( : ),m f e eη =-.5
( : ),m f e eη =0 or =-0.5
( : ),m f e eη =0 or =-0.5
Australia 0.13 0.12 0.03 0.01 0.15 0.06 Austria 0.03 0.03 0.01 0.00 0.04 0.02 Belgium 0.25 0.22 0.07 0.04 0.28 0.13 Denmark 0.19 0.15 0.05 0.01 0.25 0.13 Estonia n.a. n.a. n.a. n.a. n.a. n.a. Finland 0.17 0.14 0.03 0.00 0.21 0.09 France 0.21 0.19 0.05 0.03 0.23 0.09 Germany 0.20 0.17 0.04 0.02 0.23 0.09 Greece 0.00 0.00 0.00 0.00 0.00 0.00 Hungary 0.36 0.33 0.06 0.03 0.36 0.11 Ireland 0.04 0.03 0.01 0.00 0.04 0.01 Italy 0.08 0.07 0.02 0.01 0.09 0.04 Netherlands 0.24 0.20 0.04 0.00 0.30 0.13 New Zealand 0.05 0.04 0.01 0.00 0.06 0.03 Norway 0.18 0.16 0.04 0.02 0.22 0.10 Poland 0.20 0.18 0.05 0.03 0.22 0.09 Portugal 0.39 0.35 0.12 0.07 0.45 0.21 Spain 0.15 0.13 0.03 0.02 0.16 0.06 Sweden 0.12 0.11 0.02 0.01 0.13 0.05 United Kingdom 0.11 0.09 0.02 0.00 0.13 0.05 United States 0.04 0.03 0.02 0.02 0.04 0.03
Average 0.16 0.14 0.04 0.02 0.18 0.08 *Columns 7 and 8 of Table 10
Distribution costs, as expected, decrease the pass-through of exchange rates into CPIs.
Distribution expenditures add local content to imported consumption goods, thereby reducing the
share of the final consumption good directly linked to border prices, and can be adjusted through
double marginalization. The effect of eliminating these distribution costs appears to be
quantitatively smaller than the effects of eliminating imported inputs. Under a counterfactual

35
with no distribution costs, estimated pass through elasticities increase, on average, by nearly 30
percent when there is not double marginalization, and by 12.5 percent when distributor margins
elasticities are set at -0.5. The average pass through for all the countries increases from 0.14 or
0.16 to 0.18. Eliminating distribution margins has a smaller effect on CPI pass through than
eliminating imported inputs because the distribution margins are operating on a smaller part of
the consumption basket. By assumption, non tradables, the largest part of the basket, have zero
distribution costs.
Overall, this section has found that the pass-through elasticity of exchange rates into
CPIs highly depends on the role that tradables goods have in the economy – both tradables in
consumption and imported inputs in production. While the pass through of exchange rates is
strongest into import prices, pass through into nontraded goods prices and home tradables prices,
mainly due to reliance on imported inputs, also contribute to overall CPI pass through. Demand
elasticities play a key role in the scale of calibrated import price pass through elasticities.
Distribution margins are important for damping border price pass through into consumption
prices, but also enhance pass through because distribution expenditure for all tradables is
sensitive to the nontradable sector’s reliance on imported inputs. Imported inputs thus matter
both for the prices of directly consumed nontradable goods and for tradable goods in the final
consumption baskets of most developed economies.
V. Conclusions
This paper explores the channels for transmission of exchange rates into various types of
consumption goods prices and into the aggregate level of prices across twenty-one economies.
For this analysis, we provide extensive cross-country evidence on the size of the distribution
sector, the degree of openness, the size of the nontradable sector, and the amount of imported
inputs in each economy. We establish that distribution costs, relevant for consumer price pass
through calculations, are on average 32 to 50 percent of the total cost of goods across OECD
countries. Such distribution margins are attributable mainly to the costs of wholesale and retail
services, except in the case of mining and ore related industries where transportation costs play a
much larger role and wholesalers and retailers provide less measured value added. We also

36
document that imported input use is larger in tradable goods industries than in nontradables
production, and varies widely across countries.
In regressions over a smaller sample of countries, and using changes over time in
distribution margins, we find evidence that exchange rate movements influence margins. The
reduction in expenditures on distribution when a local currency depreciates is consistent with a
process of double-marginalization, in which the distributors have an added role in delinking
border prices from final consumption prices. These results complement other channels for price
insensitivity, such as those emphasized by Burstein, Eichenbaum and Rebelo (2003), who show
that following a domestic currency depreciation, home consumers substitute away from more
expensive and higher quality imports toward lower quality domestically-produced goods. The
substitutability implies that the weight on foreign products in the CPI, and the overall quality mix
of consumption, is responsive to exchange rate fluctuations. This type of argument is especially
plausible for those countries that have pursued import substitution strategies and have domestic
substitutes for a substantial part of the import bundle.
These arguments do not, however, imply that the CPI is completely insulated from
exchange rates. Distribution margins, in addition to insulating consumption prices from
exchange rate fluctuations, also provide an added channel for transmission of exchange rate pass
through. The channel exists because of the extensive use of imported inputs in production, in
nontraded goods as well as in tradables goods. The cost of distribution services, required for
both home tradables and imported goods, becomes sensitive to exchange rates. Overall, we find
that exchange rate pass through into consumer prices is predicted to average between 13 to 30
percent, but is expected to be substantially lower for the United States.
We have not addressed the possibility that low CPI sensitivity to exchange rates results
from monetary reaction functions, or monetary credibility in general. Countries with inflation
targeting regimes, or more generally with monetary authorities that lean against the wind via
their policy reaction functions, move to offset the inflationary shock to the local economy
transmitted through import prices. As Gagnon and Ihrig (2002), Bailey (2002), and Bailliu and
Fujii (2004) argue, a depreciation would be met with a corresponding monetary tightening. If
this were the dominant explanation for the disconnect, we would also expect to see the relative
prices of traded and nontraded goods diverge in the aftermath of an exchange rate shock as, for

37
example, the prices of domestic non-traded goods decline with monetary tightening and offset
the inflationary stimulus transmitted initially through traded goods prices.
Overall, our results are a step further in a broad research agenda on the transmission of
international shocks. Future empirical research can embed recent advances with alternative
assumptions of producer strategic interactions and introduce dynamic price adjustment, richer
treatment of the demand elasticities facing producers, and better specified behavioral equations
for the distribution sectors. However, we have demonstrated that distribution margins and
imported input expenditures are expected to be crucial features of exchange rate pass-through
across countries. These features should be embedded in continuing research on international
shock transmission, patterns of global adjustments, and work on associated welfare
consequences.
References
Bacchetta, Philippe, and Eric van Wincoop, 2003, “Why do Consumers Prices React Less Than
Import Prices to Exchange Rates,” Journal of the European Economics Association 1, issue
2-3, April/May, pp. 662-670.
Bailliu, Jeannine and Eiji Fujii. 2004. “Exchange Rate Pass Through and the Inflation
Environment in Industrialized Countries: An Empirical Investigation” Bank of Canada
working paper 2004-21.
Baily, Martin Neill, 2003. “Persistent Dollar Swings and the U.S. Economy”, in ed. C. Fred
Bergsten and John Williamson, Dollar Overvaluation and the World Economy (Institute for
International Economics).
Basu, Susanto and John Fernald.1997. “Aggregate Productivity and Aggregate Technology”
International Finance Discussion paper 593, Board of Governors of the Federal Reserve
System.
Burstein, Ariel, Joao Neves, and Sergio Rebelo. 2003. “Distribution Costs and Real Exchange
Rate Dynamics During Exchange Rate Based Stabilizations”. Journal of Monetary
Economics.
38
Burstein, Ariel, Martin Eichenbaum, and Sergio Rebelo. 2002. “Why are Rates of Inflation so
low after large devaluations?” NBER working paper #8748 (February).
Campa, Jose and Linda Goldberg. 1997. “The Evolving External Orientation of Manufacturing:
Evidence from Four Countries.” Economic Policy Review (July), vol. 3, no.2 pp.53-81,
Federal Reserve Bank of New York.
Campa, Jose and Linda Goldberg. 2005. “Exchange Rate Pass Through into Import Prices”,
Review of Economics and Statistics) November, 87 (4): 679-690.
Campa, Jose, Linda Goldberg, and Jose Minguez-Gonzalez. 2005. “Exchange Rate Pass Though
into Euro-area Import Prices.” Staff Reports no. 219 (September), Federal Reserve Bank of
New York.
Choudri, Ehsan, Hamid Faruquee, and Dalia Hakura. 2002. “Explaining the Exchange Rate Pass
Through in Different Prices’, IMF working paper wp/02/224 (December).
Corsetti, Giancarlo and Luca Dedola. 2003. “The Macroeconomics of International Price
Discrimination”. European Central Bank working paper no. 176.
Corsetti, Giancarlo, Luca Dedola, and Sylvain Leduc. 2004. “Pass Through and Exchange Rate
Fluctuations”. Manuscript.
Devereux, Michael B., Charles Engel, and Cedric Tille. 1999. “Exchange-Rate Pass Through and
the Welfare Effects of the Euro”. National of Bureau of Economic Research working paper
no. 7382.
Engel, Charles. 1999. “Accounting for U.S. Real Exchange Rate Changes”, Journal of Political
Economy, vol. 107, no. 3, June pp. 507-537.
Erceg, Chris and Andrew Levin. 1995. “Structures and the Dynamic Behavior of the Real
Exchange Rate,” International Finance Discussion Paper 554, Board of Governors of the
Federal Reserve System.
Feenstra, Robert. 1998. Integration of Trade and Disintegration of production in the global
economy.” The Journal of Economic Perspectives vol. 12 pp.31-50.
Feenstra, Robert and Gordon Hanson. 2005. “Global Production Sharing and Rising Inequality: A
Survey of Trade and Wages”, in ed. Kwan Choi and James Harrigan, Handbook of International
Trade (Basil Blackwell Publishers).
39
Frankel, J.D. Parsley and S. Wei (2005). “Slow Pass-through Around the World: A New Import
for Developing Countries?”, NBER Working Paper 11199.
Froot, Ken A. and Paul D Klemperer (1989): “Exchange rate pass-through when market share
matters”, The American Economic Review, vol. 79, pp 637-54.
Gagnon, Joseph and Jane Ihrig. 2001. “Monetary Policy and Exchange Rate Pass-Through”.
Board of Governors of the Federal Reserve System, International Finance Discussion Papers
#704 (July).
Goldberg, Linda. 2004. “Industry-Specific Exchange Rates for the United States,” Economic
Policy Review vol. 10 no. 1. (May 2004) pp.1-16, Federal Reserve Bank of New York.
Goldberg, Linda and Joseph Tracy. 2003. “Exchange Rates and Wages” with Joseph Tracy,
revised February 2003. Earlier version distributed as NBER working paper #8137.
Goldberg, Pinelopi and Frank Verboven. 2001. “The Evolution of Price Dispersion in the
European Car Market.” Review of Economic Studies vol. 68, pp. 811-48.
Hellerstein, Rebecca. 2004. “Who Bears the Cost of a Change in the Exchange Rate? The Case of
Imported Beer.” Staff Reports no. 179 (February), Federal Reserve Bank of New York.
Hellerstein, Rebecca and Sofia Berto Villas-Boas. 2006. “Vertical contracts as a source of
incomplete cross-border transmission: The case of autos" manuscript.
Hummels, David 1999. “Toward a Geography of Trade Costs”. GTAP Working Paper 17.
Hummels, David, Jun Ishii and Kei Mu Yi. 2001. “The Nature and Growth of Vertical
Specialization in World Trade”, Journal of International Economics (June) 75-96.
Laxson, Douglas and Paolo Pesenti. 2003. “Monetary Policy Rules for Small, Open, Emerging
Economies.” Journal of Monetary Economics vol. 50 (July) pp. 1109-1146.
MacDonald, Ronald and Luca Ricci. 2001. “PPP and the Balassa Samuelson Effect: The Role of
the Distribution Sector.” CESifo working paper no. 442 (March).
Mendoza, Enrique. 1991. “Real Business Cycles in a Small Open Economy” American Economic
Review 81 (4), pp. 797-818.
Obstfeld, Maurice. 2001. “International Macroeconomics: Beyond the Mundell-Fleming Model”.
International Monetary Fund Staff Papers, vol. 47, Special Issue, pp. 1-39.
Obstfeld, Maurice and Ken Rogoff. 2000. “New Directions for Stochastic Open Economy
Models”. Journal of International Economics vol 20 pp. 117-153.

40
Oliveira Martins, Joaquim, Stefano Scarpetta, and Dirk Pilat. 1996. “Mark-up Pricing, Market
Structure, and the Business Cycle”. OECD Economic Studies no.27.
Osbat, Chiara. 2005. ”Sectoral Exchange Rate Pass Through in the Euro Area”. Manuscript,
European Central Bank (December).
Rauch, James. 1999. “Networks versus Markets in International Trade.” Journal of International
Economics vol. 48 pp.7-35.
Stockman, Alan and Linda Tesar. 1995. “Tastes and Technology in a Two-Country Model of the
Business Cycle: Explaining International Comovements” American Economic Review vol. 85
no. 1 pp. 168-185.
Yang, Jaiwen. 1997. “Exchange Rate Pass-Through into U.S. Manufacturing Industries” Review
of Economics and Statistics. vol. 79, pp. 95-104.

41
DATA APPENDIX
Pass through estimation
Methodologically, we follow the approach to estimation laid out in Campa and Goldberg (2005), expressed in first-differences, with the addition of lagged exchange rate and foreign production cost terms to allow for the possibility of gradual adjustment of import prices or the CPI to exchange rates, the OLS estimation equation is:
4 4
0 0
j j j j j j j jt i t i i t i t t
i i
p a e b w c gdpα ϑ− −
− −= =
∆ = + ∆ + ∆ + ∆ +� �
where tp are local currency import prices or the local consumer price index, te is the exchange rate, tw is the foreign production costs, and gdpt is real GDP. The short-run relationship between exchange rates and the respective price series of country j is given by the estimated coefficient
ja0 . The long run elasticity, reported in Table 1, is given by the sum of the coefficients on the
contemporaneous exchange rate and four lags of exchange rate terms�−
=
4
0i
jia .
We include up to four lags of exchange rates and foreign prices/production costs in the regression. Most of the pass-through response occurs over the first and second lags after an exchange rate change, so the interpretation of four quarters as long run is empirically validated. While the theoretical antecedents of this equation are log-level relationships among variables, for estimation the variables in these equations are first-difference to control for the possibility of unit roots in the time series variables contained in these specifications. OECD import price series: Source: OECD Statistical Compendium. Quarterly time series of aggregate import price indices in local currency for 1975:Q1 to approximately 2003:Q1. As of 2004:Q1 when we extracted this data, most countries had end datapoints for these series ranging from 2002:Q3 to 2003:Q1. We work with the maximum amount of data available by country in our analysis. Effective Exchange Rate Indices. The nominal exchange rate index, is the trade weighted exchange rate index provides by the IMF. Code in IFS database: neu. The real effective exchange rate used is code reu. Regression analysis uses the inverse of the reported series, so that an increase in the exchange rate is a currency depreciation. Foreign Price Index. We construct a consolidated export partners cost proxy by taking advantage of the IFS reporting of both real (reu) and nominal (neu) exchange rate series and computing
,x j j j jt t t tW neu P reu= ⋅ by each country in our sample. This gives us a measure of trading partner
costs (over all partners x of importing country j), with each partner weighted by its importance in the importing country’s trade. The real effective exchange rate is calculated from Unit Labour Costs for developed countries by the IMF. Code in IFS database: reu. The consumer price indices from the International Financial Statistics. Code in IFS database: 64.

42
Structural VAR Estimation of pass-through coefficients
An alternative approach for the estimation of the pass-through coefficients in equation (1) and reported in Table 1 is to estimate a structural VAR process. The advantage of the VAR estimation in principle is twofold: first, it provides a single framework for the estimation of the pass-through effects on import and consumer prices simultaneously; and second, this framework provides a more accurate control for possible endogeneity effects among some of the exogenous variables in equation (1). The structural from of a VAR for �y is given by
ttt uyLbyB +∆=∆ )( where B is a regular matrix and b(L) is a polynomial in the lag operator L and u is a white noise process, the vector of structural shocks.
The structural form of this VAR system is explained by its own lags and by contemporaneous and lagged values of all other explanatory variables. This structural form is not identified unless additional restrictions are imposed in the system. The simplest way, originally proposed by Sims (1980), is to use the Cholesky decomposition to impose restrictions in the variance of the structural shocks. The Cholesky decompositions impose a contemporaneous causal ordering on the variables, since current values of variables only depend upon current values of variables that are “above” that variable in the system.
We perform the structural estimation of a VAR system for a set of three endogenous variables: exchange rate, import prices and consumer prices. We impose the Cholesky restriction following this ordering, so that exchange rates affect import prices and consumer prices contemporaneously, and import prices also affect contemporaneously consumer prices. We treat the foreign price variable as exogenous. To facilitate the comparison between the VAR results and those reported in Table 1 in the text, we use a four period lag length. We identify the effects of exchange rate pass-through at different horizons as the accumulated impulse response functions up to that horizon of each of the two other endogenous variables, import prices and consumer prices, to a unit structural shock in the nominal exchange rate equation.
The results from the estimation are reported in the last four columns of the table below. The first four columns of the table report the estimates from the OLS estimation of the pass-through equations. The table reports the contemporaneous effects (short) and the impact after four quarters (long) of an exchange rate shock in the import prices and in consumer prices. The point estimates from the OLS and VAR equations are very similar. There is no obvious difference in terms of point estimates for neither the time horizons of the effect (short or long run) nor for the domestic price examined (import prices or CPIs). The patterns of significance are essentially the same, confirming the recent results of Osbat (2005). For import prices, in the short-run rejection of a pass-through coefficient of one occurs in the large majority of countries. In the long-run a pass-through smaller than one can be rejected for a small subset of countries. For consumer prices, the degree of exchange rate pass-through is much smaller both in the short run and in the long run. A pass-through of one into consumer prices can be rejected in the long run for the vast majority of countries. In almost all countries, the estimated OLS coefficients fall within the confidence intervals of the corresponding estimated coefficients from the VAR equation, so that there is no statistical evidence of a bias in the OLS estimation from the potential endogeneity of exchange rates.

43
Appendix Table 1 ESTIMATES OF EXCHANGE RATE PASS-THROUGH
OLS ESTIMATES VAR Estimates Country Import Prices CPIs Import Prices CPIs Short Long Short Long Short Long Short Long Australia 0.56*+ 0.67*+ 0.01+ 0.09+ 0.57*+ 0.81* 0.04+ 0.15+ Austria 0.21+ 0.10 0.07 -0.09 0.40+ 1.10 0.02+ 0.08 Belgium 0.21+ 0.68 0.06+ 0.08+ 0.27+ 0.92+ 0.06+ 0.10+ Canada 0.75*+ 0.65*+ -0.02+ -0.01+ 0.75*+ 1.40+ -0.01+ 0.02+ Czech Republic 0.39*+ 0.6* 0.11+ 0.60*+ 0.39*+ -0.05+ 0.00+ 0.15+ Denmark 0.43*+ 0.82* 0.08+ 0.16*+ 0.52*+ 0.92* -0.02+ 0.04+ Finland 0.56* 0.77 -0.02+ -0.02+ 0.54*+ 1.24+ -0.02+ -0.03 France 0.53*+ 0.98* 0.10+ 0.48*+ 0.52*+ 1.00* -0.05+ -0.08+ Germany 0.55*+ 0.80* 0.04+ 0.07+ 0.49*+ 1.48* 0.03+ 0.16+ Hungary 0.51*+ 0.78* 0.00+ 0.42*+ 0.43*+ 0.68* 0.14+ 0.49*+ Ireland 0.16+ 0.06 0.14+ 0.08+ 0.59*+ 1.02* 0.06+ 0.30+ Italy 0.35*+ 0.35+ 0.03+ 0.03+ 0.53*+ 0.92* 0.04+ 0.14+ Japan 0.43*+ 1.13* 0.00+ 0.11*+ 0.36*+ 0.84* -0.01+ 0.06+ Netherlands 0.79*+ 0.84* 0.15*+ 0.38*+ 0.65* 1.13* 0.36+ 0.59*+ New Zealand 0.22*+ 0.22+ 0.00+ -0.10*+ 0.42*+ 0.57 0.05+ 0.33*+ Norway 0.40*+ 0.63* -0.01+ 0.08+ 0.32*+ 0.58* -0.03+ -0.09+ Poland 0.56*+ 0.78* 0.00+ 0.59*+ 0.02+ 0.13+ 0.72* 2.04 Portugal 0.63*+ 1.08* 0.02+ 0.60*+ 0.64*+ 2.04* -0.03+ 0.54*+ Spain 0.68*+ 0.70* 0.16*+ 0.36*+ 0.60*+ 0.65* 0.10+ 0.12+ Sweden 0.48*+ 0.38*+ -0.02+ -0.11+ 0.59*+ 0.82* 0.04+ 0.08+ Switzerland 0.68*+ 0.93* 0.07*+ 0.17*+ 0.59*+ 0.82* 0.07+ 0.15+ United Kingdom 0.36*+ 0.46*+ -0.05+ -0.11+ 0.34*+ 0.49*+ -0.05+ -0.12+ United States 0.23*+ 0.42*+ -0.01+ 0.01+ 0.25*+ 0.59*+ 0.01+ 0.06+ * (+) Significantly different from 0 (1).
Input-Output (I/O) databases.
The Input-Output data for the different countries come from different sources: - Data for Belgium, Finland, France, Germany, Greece, Italy, Netherlands, Spain, Sweden, and the United Kingdom come from the Eurostat National Accounts database. This database computes the input-output tables for these countries and reports a supply and a use table disaggregated to a total of 59 industries. These 59 industries include 22 manufacturing industries, 5 mining and extraction industries, 3 agriculture industries, 5 construction and energy industries, 8 trade and transport industries, and 17 service industries. We report distribution margin data for 29 manufacturing, mining and agriculture industries (we merge two mining industries into one, given their small production values in most countries).

44
- Data for Australia on input-output tables comes from the Australian Bureau of Statistics. The data reports supply and final use tables for a total of 237 industries. We convert these industries into the CPA classification of 29 manufacturing, mining and agriculture industries. - Data for the United States on input output tables come from the “Benchmark Input Output Accounts for the US economy” (years 1992, and 1997). The U.S. input output accounts use a specific IO industry classification, which can then be transformed into the NIPA classification (Nacional Income and Product Account Tables) and then aggregated into the CPA classification of 29 manufacturing, mining and agriculture industries used in the paper. - Data for New Zealand on input output tables come from Statistics New Zealand. The data reports supply, use, and import tables for a total of 210 industries. We aggregate these industries into the CPA classification of 29 manufacturing, mining and agriculture industries. Calculation of distribution margins: We compute the distribution margins for total supply in the industry as the ratio of the value of trade and transport margins to the value of total supply in the industry at purchasers’ prices. Purchaser prices include the cost of supply at basic prices plus the distribution (retail, wholesale and transportation) costs plus net taxes on products. To the extent that taxation differs significantly across countries for the same industry and across industries within a country, distribution margins may not be perfectly comparable in all cases.
Calculation of imported input ratios: The Input Output tables report the value of the use matrix broken down the use of inputs by origin: domestic and imported. We calculate imported inputs into the production of each industry as the ratio between the total value of imported intermediate inputs by an industry to the value of total intermediate inputs. Techniques to construct the imported intermediate flows matrix in the input-output tables vary by country. Most countries used to some extent the import proportionality assumption. This technique assumes that an industry uses an import of a particular product in proportion to its total use of that product. This assumption is limiting since some industries might be using inputs from domestic and import sources in different proportions than the average of the economy. Countries made use of this assumption at very different levels of aggregation. For instance, the OECD reports that Germany and Denmark made used of over 2000 different commodities, while the U.S. and Japan used slightly over 500 and the United Kingdom less than 200. Calculation of share of tradables in consumption: This number is the ratio of the value at purchaser prices of consumption by households in tradable products relative to the value of total consumption by households. Tradable products are defined as the set of 29 manufacturing, agriculture, and mining industries for which distribution margins have been calculated.

45
Calculation of imported input share of tradables in consumption: This number is the ratio of the value at purchaser prices of imported inputs used in the production of the industries consumed by households in tradable products relative to the value of total consumption by households of those same products. Tradable products are defined as the set of 29 manufacturing, agriculture, and mining industries for which distribution margins have been calculated. Calculation of imported input share of nontradables in consumption: This number is the ratio of the value at purchaser prices of imported inputs used in the production of nontradable products consumed by households relative to the value of total consumption by households of those same products. Nontradable products are those included in the construction, energy and services industries.
Appendix Table Imported Inputs in Other Industries (Average Percent Share)
e40 Electricity, gas, steam and hot water supply 27.82 e41 Collection, purification and distribution of water 13.21 f45 Construction 18.24 g50 Sale, maintenance and repair of motor vehicles 24.58 g51 Wholesale trade and commission trade, except of motor and motorcycles 16.17 g52Retail trade, except of motor vehicles, motorcycles; repair of personal&household goods 11.72 h55 Hotels and restaurants 14.92 i60 Land transport; transport via pipelines 18.07 i61 Water transport 40.61 i62 Air transport 34.50 i63 Supporting and auxiliary transport activities; activities of travel agencies 17.96 i64 Post and telecommunications 21.55 j65 Financial intermediation, except insurance and pension funding 13.30 j66 Insurance and pension funding, except compulsory social security 13.43 j67 Activities auxiliary to financial intermediation 9.23 k70 Real estate activities 7.05 k71Renting of machinery and equipment without operator and personal&household goods 16.65 k72 Computer and related activities 19.62 k73 Research and development 20.94 k74 Other business activities 17.40 l75 Public administration and defense; compulsory social security 15.09 m80 Education 10.48 n85 Health and social work 18.89 o90 Sewage and refuse disposal, sanitation and similar activities 9.43 o91 Activities of membership organization n.e.c. 11.55 o92 Recreational, cultural and sporting activities 16.45 o93 Other service activities 18.30 *Product names given with CPA Codes (Classification of Products by Activity). Imported Input share is calculated as the average of the imported input share for each industry for Austria, Belgium, France, Finland, Germany Hungary, Ireland, Italy, Netherlands, Norway, Poland Portugal, Sweden, Spain and the United Kingdom. N.e.c. not otherwise classified.

46
Appendix Table 2 OECD Industry Classification, with SIC mapping
OECD SIC Industry Classification Description
1 01-05 AGRICULTURE, HUNTING, FORESTRY AND FISHING 2 10-14 MINING AND QUARRYING 3 15-16 FOOD PRODUCTS, BEVERAGES AND TOBACCO 4 17-19 TEXTILES, TEXTILE PRODUCTS, LEATHER AND FOOTWEAR 5 20 WOOD AND PRODUCTS OF WOOD AND CORK 6 21-22 PULP, PAPER, PAPER PRODUCTS, PRINTING AND PUBLISHING 7 23 COKE, REFINED PETROLEUM PRODUCTS AND NUCLEAR FUEL 8 24ex2423 CHEMICALS EXCLUDING PHARMACEUTICALS 9 2423 PHARMACEUTICALS
10 25 RUBBER AND PLASTICS PRODUCTS 11 26 OTHER NON-METALLIC MINERAL PRODUCTS 12 271+2731 IRON & STEEL 13 272+2732 NON-FERROUS METALS 14 28 FABRICATED METAL PRODUCTS, EXCEPT MACHINERY & EQUIPMENT 15 29 MACHINERY AND EQUIPMENT, N.E.C. 16 30 OFFICE, ACCOUNTING AND COMPUTING MACHINERY 17 31 ELECTRICAL MACHINERY AND APPARATUS, NEC 18 32 RADIO, TELEVISION AND COMMUNICATION EQUIPMENT 19 33 MEDICAL, PRECISION AND OPTICAL INSTRUMENTS 20 34 MOTOR VEHICLES, TRAILERS AND SEMI-TRAILERS 21 351 BUILDING AND REPAIRING OF SHIPS AND BOATS 22 353 AIRCRAFT AND SPACECRAFT 23 352+359 RAILROAD EQUIPMENT AND TRANSPORT EQUIPMENT N.E.C. 24 36+37 MANUFACTURING NEC; RECYCLING 25 4 ELECTRICITY, GAS & WATER 26 5 CONSTRUCTION 27 61+62 WHOLESALE & RETAIL TADE 28 63 RESTAURANTS & HOTELS 29 71 TRANSPORT & STORAGE 30 72 COMMUNICATION 31 81+82 FINANCE & INSURANCE 32 83 REAL ESTATE AND BUSINESS SERVICES 33 9 COMMUNITY, SOCIAL & PERSONAL SERVICES 34 PRODUCERS OF GOVERNMENT SERVICES 35 OTHER PRODUCERS 36 STATISTICAL DISCREPANCY