journal of advanced catalysis science and technology 27-42
TRANSCRIPT

Journal of Advanced Catalysis Science and Technology, 2016, 3, 27-42 27
E-ISSN: 2408-9834/16 © 2016 Cosmos Scholars Publishing House
Catalytic Naphtha Reforming; Challenges for Selective Gasoline; an Overview and Optimization Case Study
Fawzi M. Elfghi1,2,*
1Department of Chemical and Petrochemical engineering, The College of Engineering & Architecture, Initial Campus, Birkat Al Mouz Nizwa, Sultanate of Oman 2Chemical Reaction Engineering Group (CREG), Faculty of Chemical Engineering, Universiti Teknologi Malaysia, 81310 UTM, Skudai, Johor, Malaysia
Abstract: A new trend in catalytic naphtha reforming requires the decrease of aromatics hydrocarbons particularly benzene in reformate, while maintaining high octane rating. At present, production of reformulated gasoline with low content of benzene is one of the main challenges in the transportation fuel industry. In the catalytic reforming of realistic naphtha over bi-functional Pt-Re-S/Al2O3-Cl catalysts the: (i) liquid yield (C5
+), (ii) yield of aromatics, (iii) iso-paraffin/aromatics ratio, (iv) side reactions (hydrocracking, hydrogenolysis, coking) as responses can be altered by controlling the independent reaction parameters (Temperature, Pressure, Liquid Hourly space velocity (LHSV), Hydrogen to hydrocarbon ratio (H2/HC ratio), chlorine and the addition of different promoters to the catalyst (Re, Sn, Ir, etc). In the present report, a quadratic polynomial equation for the responses Research Octane Number (RON), Neglect this statement as these models has been removed were obtained by multiple regression analysis and tested using analysis of variance (ANOVA) with 95% degree of confidence. The validation of experimental data was confirmed with the predicted model. The results showed that the reaction temperature and the total operating pressure are the key variables that have the main influence on naphtha reforming reactions by the synergistic effect of linear term (X1, X2), which is in a good agreement with the experimental data reported previously in the literature.
Keywords: Catalytic naphtha reforming, Pt-Re bifunctional catalyst, Research octane number, Response surface methodology (RSM), Central composite design, Optimization.
1. INTRODUCTION
Petroleum and Transportation Fuels
Crude oil is a mixture of virtually hundreds of different compounds. Hydrocarbons are the main constituents of these compounds which account for up to 97% of the total mass [1]. Crude oil supplied up to 40% of total energy consumed in the world over the past century, which might well called the oil century because of the wide spread use of oil [2]. Crude oil is still the dominant source of energy with respect to other fuels i.e. natural gas, coal and renewable energies (solar energy and wind energy). The global energy consumption of crude oil is estimated to be over 250 quadrillion BTU by year 2030 [3]. As shown in Figure 1, Energy Information Administration (EIA) predicts that crude oil will supply most of the energy used; current and forecast for the next fifty years [3].
Distillation process of crude oil yields several hydrocarbons fractions used for different purposes [4]. The main usage of petroleum products is for
*Address correspondence to this author at the Department of Chemical and Petrochemical engineering, The College of Engineering & Architecture, Initial Campus, Birkat Al Mouz Nizwa, Sultanate of Oman, P.O. Box 33, PC 616; Tel: 25446997, 25446200; Fax: 25443400; Email: [email protected]; [email protected]
transportation fuels. Table 1 presents the three main transport fuels i.e. gasoline, kerosene and diesel together with their key properties and main production processes. The most important characteristic of these fuels is their liquid state at ambient temperature, therefore they are easy to store, easy to distribute in bulk by road, rail or pipe lines. As a result, these advantages make them more favorable as fuels with respect to natural gas and other fuels [4].
Figure 1: World marketed energy use by fuel type, 1980-2030.
The demand for petroleum transportation fuels have been increasing in most countries for the past three

28 Journal of Advanced Catalysis Science and Technology, 2016, Vol. 3, No. 1 Fawzi M. Elfghi
decades. However, the demand for such fuels will continuously increase due to the growth of the number of automobile owners worldwide. Absolutely, petroleum for the coming two to three decades will continue to play a major role in satisfying the transportation fuel market [5]. Keeping in mind, Fuel consumption, energy efficiency, air quality are of concern nowadays. However, oil based transportation fuels that can now
be produced comply with stringent environmental standards [5].
Recently, there are a huge growth for utilization of automotive liquid fuels worldwide; the mature diesel market in Europe, the massive consumption of motor gasoline in North America and the huge newly growing fuel market in china [6]. Consequently, transportation
Table 1: Characteristics of Hydrocarbons Fuel
Fuel Type Boiling Range oC Key Property Main Production Process
Gasoline < 200 Octane Number CNR, FCC, Alkylation
Kerosene 200-250 Smoke Point SR (HDS), HC
Diesel 250-350 Cetane Index SR (HDS), HC
CNR: Catalytic Naphtha Reforming; FCC: fluid catalytic cracker; SR: Straight run; HDS: Hydrodesulfurization; HC: Hydrocracking
Figures 2 Consumption of oil products.

Catalytic Naphtha Reforming; Challenges for Selective Gasoline Journal of Advanced Catalysis Science and Technology, 2016, Vol. 3, No. 1 29
fuels in North America constitute more than 90% of oil consumption. However, the majority of vehicles in this region are LDVs (Light Duty Vehicles) with gasoline internal engines. Moreover, Motor gasoline demand in North America accounts for 60% of transport fuels demand whereas diesel constitutes 20%. On the other hand, China is a major oil based fuels consumption zone. No doubt that Gasoline will grow to 3.29 mb/d by 2025 and diesel will follow with a demand of 2.03 mb/d. Due to the high rate of growth in fuel demand in china, refining industry has to invest heavily to meet the sharp raise in transport fuels consumption. An estimated investment in the range of US $4 billion to US$ 36 billion will needed to satisfy the fuel market demands. Figure 2 a, b, c, d shows the regional markets for gasoline and patterns of oil products composition for different regions [7].
2. REFORMULATED GASOLINE, HISTORICAL BACKGROUND
Gasoline fuel is still considered as the most important product at oil refineries. Every refinery in the world has a catalytic reformer that loaded with bi-functional Pt-Re catalyst. The main purpose of the catalytic reforming process is to enhance the octane number of naphtha streams that have a fairly low octane rating by rearrange/rebuild their hydrocarbon molecules into high octane reformate components. All of the reforming reactions produce hydrogen, which is very valuable product since it is used in hydrocracking and hydro-treating units to remove sulfur, oxygen and nitrogen [8, 9].
Heavy and light naphtha are the main raw materials for gasoline production, although it is the main
Figure 3: Gasoline processing in a modern petroleum refinery.

30 Journal of Advanced Catalysis Science and Technology, 2016, Vol. 3, No. 1 Fawzi M. Elfghi
component to produce aromatics such as benzene, toluene and xylenes. The crude oil fraction with boiling range between 30oC and 200oC is defined as the full-range naphtha, and represents typically 15-30% by weight of the crude oil. This comprises hydrocarbons ranging from C5 to C12. Usually, the naphtha fractions obtained directly from the atmospheric distillation column are called straight run naphtha (SRN). They are also produced during processing of heavier parts of the crude oil such as fluid catalytic cracker (FCC) naphtha, visbreaker naphtha (VB), and Coker naphtha. These naphtha streams contain olefinic hydrocarbons. The naphtha fraction in the range from 30o C to 90 oC is called light naphtha. This fraction is rich with straight C5 and C6 hydrocarbons which are typically transformed to their branched isomers via isomerization unit and added to the gasoline pool. The fraction of boiling range from 90oC to 200oC is defined as heavy naphtha which is very rich with straight chain alkanes. The so called “medium naphtha “is sometimes defined as the fraction that has boiling range from 90oC to 150oC and contains mostly C7-C9 linear hydrocarbons. Figure 3 presents an outline of various naphtha and reformate streams added to the gasoline pool from different units in a typical, integrated refinery [10].
The main source for high octane reformates are aromatics which generally have much higher octane number than naphthenes, olefins, and paraffins. The linear chain paraffins have low octane number, but as the degree of branching of n-paraffins increases, the RON of the isomers will also increases. As shown in Table 2, the drop of RON for the n-paraffins increases as the number of carbon atoms increases but this decline is much less marked for the isoparaffins [11].
Aromatics hydrocarbons are the crucial components that enhance the octane number. Moreover, additives of gasoline boosters such as methyl tetra butyl ether (MTBE) are added to the gasoline pool in order to enhance the octane number of the finished gasoline to full fill the gasoline market specifications such as research octane number (RON), Vapor pressure, aromatics content, etc. But However Changes in specifications of transportation fuels to produce clean burning fuels with ultra-low sulfur in diesel fuel and low aromatics content particularly benzene in gasoline increased the obligations on the refinery system generally [14].
The first environmentally driven change for gasoline was the introduction of unleaded gasoline used with
Table 2: Research Octane Numbers (ron) for Pure and Blended Hydrocarbons
Hydrocarbon RON Hydrocarbon RON
Paraffins n-Butane Isobutane n-Pentane
2-Metylbutane n-Hexane
2-Methylpentane 2,2-Dimethylbutane
n-Heptane 3-Methyhexane
2,3-DimethylPentane 2,2,3-Trimethybutane
n-Octane 3,3-Dimethylhexane
2,2,4-TrimethylPentane n-Nonane
2,2,3,3TetranethylPentane n-Decane
Olefins 1-Hexene 1-Heptene
2-Methyl-2hexene 2,3-Dimethyl-1-pentene
94
100 61.8 92.3 24.8 73.4 91.8 0.0 52
91.1 >100 <0
75.5 100 <0
>100 <0
76.4 54.5 90.4 99.3
Naphthenes Cyclopentane Cyclohexane
Methylcyclopentane Methylcyclohexane
t-1,3-Dimethylcyclopentane 1,1,3-Trimethylcyclopentane
Ethylcyclohexane Isobutylhexane
Aromatics Benzene Toluene
Ethylbenzene o-Xylene m-Xylene p-Xylene
n-Propylebenzene Isopropylebenzene
1-Methyl-3-ethylbenzene 1,3,5-Trimethylbenzene
n-Butylbenzene 1-Methyl-3-isopropylbenzene 1,2,3,4-Tetramethylbenzene
>100 83.0 91.3 74.8 80.6 87.7 45.6 33.7 >100 >100 ----- >100 >100 >100 >100 >100 >100 >100 >100 ----- >100

Catalytic Naphtha Reforming; Challenges for Selective Gasoline Journal of Advanced Catalysis Science and Technology, 2016, Vol. 3, No. 1 31
catalytic converter equipped vehicles. Next, the reduction in lead content of the leaded grade gasoline was proposed. Therefore, lead content was reduced dramatically in the mid of 1980’s and by January 1, 1986 was limited to 0.1 gram per gallon. As of January 1, 1996 the addition of lead to automotive gasoline is no longer permitted. Next, in order to improve the octane number of the gasoline fuel, the focus of refineries has been changed to increasing the production of light ends components in the finished gasoline, such as butane. However, the butane content of gasoline increased significantly by the mid-1980s. As a result, this had a dramatic impact on fuel volatility and tends to increase the evaporated emissions of hydrocarbons. Between 1980 and 1985 the average vapor pressure of summer grade gasoline increased from 9.8 psi to 10.4 psi. Consequently, this increase in
vapor pressure led environmental protection agencies (EPA) to implement rules in order to reduce the volatility of gasoline which required vapor pressures of no greater than 7.8 psi [12].
The demand to produce more unleaded gasoline and to phase out the use of lead as well as to reduce the vapor pressure of gasoline primarily strained some refiner’s octane capabilities. However the refineries responded to this need for octane through a variety of actions. These actions included utilizing more complicated manufacturing processes and also the addition of oxygenates (alcohols and ethers) to the gasoline pool. Therefore, the use of more complex refining processes during the last decade resulted in increased levels of aromatics, olefins/ diolefins, in gasoline. Therefore, the average aromatic content of
Figure 4: Environmental Relationships between RON, Aromatics and Different Resources of Octane Boosters.

32 Journal of Advanced Catalysis Science and Technology, 2016, Vol. 3, No. 1 Fawzi M. Elfghi
gasoline increased from around 20% in the 1970s to approximately 32% in 1990’s with many gasoline exceeding a 40% aromatic content. Subsequently, the use of octane boosters took place and the reformulated gasoline era came out. Additives such as MTBE (methyl tetra butyl ether) were very commonly used as octane boosters in the nineties. Recently these chemicals become strictly regulated and largely eliminated from environmental point of view, because the use of MTBE in gasoline leads to damage of ground water and public health. Figure 4 presents the summary of octane booster's development through the period of 1970 to 2001, and the available routes to improve the octane number of gasoline fuel at that time [14].
2.2. New Trend and the Available Approaches for Selective Gasoline
Gasoline fuel today must have a research octane number (RON) rating of 95 – 98. Other characteristic properties should be present in gasoline fuel to make the engine perform properly and to avoid damage to the environment. For example; the presence of olefins in the gasoline causes the formation of gums and tend to foul the engine. Another important property is the vapor pressure, which is should be limited to avoid volatile light hydrocarbons emission. Aromatics such as toluene, a known toxin; and xylene which is a major contributor to smog formation. Other certain compounds such as benzene, a known cancer causing agent, are considered as carcinogenic [8, 14, 28].
The detection of MTBE in ground water coming from spills of stored tanks raise the gradual banned of using MTBE as additives. A few years ago MTBE was measured in urban and rural precipitation in Germany and was detected in ground water. California banned MTBE beginning in 2004 because for a few years, traces of MTBE were found in water sources in California. Recently, many researchers have reported that the addition of MTBE leads to many complaints related to eyes or lungs irritations [14]. As a result a new trend in gasoline production process and specifications requires low aromatics (in particular benzene) in reformates, while maintaining high RON which is consider as one of the main challenges in the transportation fuels industry. Lately, concerns are raised against other sources of octane boosters. The high content of n-alkanes in heavy naphtha makes it attractive to be utilized as a good feedstock for the production of valuable friendly high octane reformates which is called iso-paraffins. From the literature review
and previous research work carried out, production of high octane reformates from skeletal isomerisation reactions is a potentially promising route to minimize production of high amount of aromatics content in reformates. iso-paraffins are ecologically friendlier with respect to aromatics. Therefore, the attention of the refiners has been shifted to isomerization of paraffins greater than C6 to improve octane number with limited amount of aromatics and olefins. Example, n-octane has a research octane rating of 0, while 2,2,4-Trimethylpentane have research octane ratings of 100 [15, 28].
But unfortunately, the selectivity of the current used catalyst (Pt-Re) towards iso-paraffins in catalytic reforming of straight-long chain alkanes is limited because of the competitive reactions occurred simultaneously as well as the high trend toward the successive undesirable reactions. These undesirable reactions are; i) dehydrocyclization (DHC) which lead to produce aromatics that thermodynamically are privileged, and environmentally should be limited, ii) Hydrocracking (HC) reactions which classified as non-preferable reactions are also occurred and tend to decrease of C5
+ and hence decrease the cycle length of the catalyst, iii) hydrogenolysis reactions (HY) which enhance the production of invaluable commercial light ends products (C1-C4) and hence decrease the liquid yield. Therefore, the low selectivity toward isomers production via reforming of realistic (C6-C12) heavy naphtha by employing the conventional reforming catalyst (Pt-Re) represents a problem that preventing the commercial exploitation of this process [16, 22, 25, 28].
To overcome this situation, in the last few years many researches were focused on the development of a selective catalyst for isomerization of heavy long chain and study the subsequently cracking-isomerization mechanisms of C6-C12 n-alkanes hydrocarbons as alternative way to improve the octane number with limited amount of aromatics and olefins
[17, 22, 25].
2.2.1. Development of Reforming Catalyst (Pt, Pt-Re)
Pt-Re/ γ-Al2O3 catalyst is still the most widely used catalyst that capable to catalyze all types of catalytic reforming reactions. Recently, modern reforming catalysts often contain at least one or two metals in addition to Pt. Metals of group VIII of the periodic table (except for Fe and Os as well as Re and Cu), have been found to catalyze aromatization activity to at least

Catalytic Naphtha Reforming; Challenges for Selective Gasoline Journal of Advanced Catalysis Science and Technology, 2016, Vol. 3, No. 1 33
a slight extent. The mechanism of the main bifunctional reactions of naphtha catalyzed by Pt-Re catalyst is controlled by the acid function (chlorinated alumina). The metal function determines both the selectivity and the stability of the catalysts [22, 25].
More recently, the potential of employing tri-metallic Pt-Re-M catalysts has been explored, by modification of Pt-Re/Al2O3 catalyst with different promoters can alter the catalyst performance in a wide range. These promoters can possibly affect the selectivity by enhance the isomerization reactions and suppress the aromatization activity to a certain extent. It has been found that inactive metals, such as Sn, Ge as additives to the main component (Pt), have a tendency to offer a better selective gasoline and improve the stability of the catalyst by diminish the capacity of platinum metal character thus decrease its de/hydrogenation activity as well as tends to work in the same way as sulphidation does. Other researcher and co-workers reported that the role of such additives is related to the formation of M-aluminate combined, which alters the alumina properties and thus affect their acidity [18,19].
Pt-Re/Al2O3 catalysts containing 0.3 % Pt, 0.35 Re and 1 % Cl promoted with different additives including H-Exchanged Zeolites (HY I, HY II & HZSM5) have been investigated in reforming of n-octane. The conversion of n-octane increased in the order of HY< HZSM-5. The multi component modified Pt-Re/Al2O3 catalyst with zeolite and element of V group increases the isomerisation activity at mild conditions. Maximum selectivity of i-octane formation was 100% at conversion of 62% [20].
A series of Zeolite and alumina based catalysts were screened through the reforming of n-heptane by Pope et al., (2002) in order to investigate the activity and selectivity. However, Pt/USY and Pt/VUY catalysts gave the highest activity and selectivity to isomers, (up to 94% selectivity to isomers at 72% conversion). However, the isomerization activity and selectivity increases with Pt loading up to 1.5 and 1.0%, respectively. Pt/faujasite catalysts enhance the selectivity to isomers over cracked products [20].
A hybrid catalyst of both components Pt/Al2O3+SZ were found to enable a stable operation of the catalyst during isomerization-cracking of n-octane, with a conversion of about 80 %. The best appearance in isomerization-cracking of long-chain alkanes was obtained on [(Pt/Al) + (Pt/SZ)] complexes which displayed the highest values of activity, stability and
yield of isobutene. Ni and Pt metals were supported on HUSY Zeolite using ion exchange and tested via n-hexane isomerisation at atmospheric pressure and 250 oC. However, the bimetallic catalyst (Ni-Pt) showed higher cycle length and higher activity with respect to monometallic catalyst (Ni) which was more selective to isomers formation [20].
However, In the catalytic reforming of realistic naphtha over bi-functional Pt-Re-S/Al2O3-Cl catalysts the (i) liquid yield (C5
+) ; (ii) yield of aromatics ;(iii) iso-paraffin/aromatics ratio; (iv) side reactions (hydrocracking, hydrogenolysis, coking) as responses can be altered by controlling the independent reaction parameters (Temperature, Pressure, LHSV, H2/HC ratio), chlorine and the addition of different promoters (Re, Sn, Ir, Zeolites, etc.) [21, 22, 25].
2.2.2. Parametric Optimization; Case Study
Most processes can be described in terms of several controllable variables, such as temperature, pressure and feed rate. Earlier one-variable-at-a-time (OVAT) approach has been employed to identify the effect of independent variables which having a significant effect on the catalytic naphtha reforming process. Several publications have been reported concern on the effect of operating conditions on activity, selectivity and stability over different types of reforming catalysts in the reforming of model compound and real/complex feedstock [21, 22].
Statistical based experimental design techniques are practically useful in engineering design to improve the performance of a manufacturing process. They also have extensive application in the development of new process. By using experimental design techniques, engineers are able to determine the interaction of several factors with precision in a low number of experiments. The design of experiment techniques (DOE) are proficient and fast methods of estimate and testing of many factors that have planned simultaneously and determine which subset of the process variables have the most influence on the process performance. The results of experimental design techniques can be lead to: Improved process yield, reduced design and development time, reduced cost of operation and leading to more reliable predictions of the response data in areas not directly covered by experimentation [26, 29].
Research Surface Methodology (RSM) approach is a set of group of empirical techniques devoted to estimate the interaction and quadratic effects, and give idea of the local shape of response surface. It is

34 Journal of Advanced Catalysis Science and Technology, 2016, Vol. 3, No. 1 Fawzi M. Elfghi
practically used to reveal the best value of the response, find out improved or optimal process settings, Troubleshoot process problems and weak points and make a product of the process relatively more insensitive against external and non-controllable influences. RSM measures responses according to one or more selected criteria. The maximum values are taken as the response of the design experiments. The optimal conditions of the factors are obtained by solving the regression equation and also by analyzing the response surface contour plots [23, 24, 27, 29].
Therefore this case study was attempted to model and optimize the process conditions of catalytic naphtha reformer located in Libyan by applying response surface methodology (. use of a statistical approach called Central Composite Orthogonal Design (CCOD) falling under Response Surface Methodology (RSM) were reported to predict the optimum values of process parameters and their interactions for single and multi response optimization; maximum RON, maximum selectivity towards saturates and minimum aromatics yield.
3. EXPERIMENTAL
3.1. Catalysts Preparation
A Commercial industrially applied naphtha reforming bimetallic catalyst was used in this study. The catalyst pellets have a spherical shape (1.5–2.0mm). The catalysts composed of dual function components that consists of the catalytic active species (for hydrogenation and dehydrogenation) Pt (0.17) and Re (0.35), supported on (acidified alumina) chlorinated Al2O3-Cl (Cl = 1.34 wt. %) as shown in Table 3,which also works as an acid component, catalyzing both isomerization and cyclization reactions. The catalyst containing these metals was treated with sulphur (S = 0.0499 wt %) prior to use in order to passive the initial hyperactivity of the active phase.
3.2. Catalysts Characterization
3.2.1. Scanning Electron Microscopy (SEM)
The visualize microscopy structural of the catalyst was studied using a combination of scanning electron
microscope (SEM) and energy dispersive X-ray analysis (EDX) techniques using an X-ray energy dispersive spectroscopy (EDS, Noram Voyager) and 5 nm probe. A LEO-1430 VP microscope instrument was used in which the EDX system IXRF was installed and equipped with a preprogrammed MKL marker system in order to aid in rapid identification of the displayed x-ray energies peaks for each element. The microscope has a magnification power up to 300,000 times and was operated at 2.0-30 kV with two guns; tungsten gun filament and LaB6 gun filament equipped with back scattered detector. The point to point resolution of the instrument was 2.5 Ao at high vacuum and 5 Ao at low vacuum. The energy resolution of the EDX system was 133 eV at 5.9 keV.
3.2.2. Thermal Analysis (TGA-DTA)
The thermogravometeric - differential temperature analysis (TG/DTA) analysis for the catalyst samples were carried out in a Setaram Labsys™ TG-DTA/DSC version Thermal Analyzer (France) in the range of 30 - 900 ◦C in N2 atmosphere. The scanning rate was kept at 10◦C/min in all experiments.
3.3. Reforming of Heavy Naphtha
The catalytic activity tests were carried out in an integral laboratory fixed bed continuous down-flow reactor in once-through mode of 1200 mm long and internal diameter 10 mm (GEOMECHNIQUES/ VINCI, France) equipped with a thermometer in the axial of reactor body with 600 mm. The useful catalyst volume can be changed in the range of 15-70 ml. The amount of catalyst loaded was 55 g (70 ml). The catalyst was placed between two layers of inert particles of silicon carbide (Carbines), the reactor was housed with four zone electrical jacket heaters that can be operated in the 20o C to 650 oC range and between atmospheric pressure and 150 bar. A backpressure regulator valve allowed high-pressure experiments. Indeed, such type of reactors were reported to permit discrimination between CNR catalysts and can be used to determine the effect of changes in operating variables.
The reactor was run in isothermal mode (the temperature drop along the catalyst bed was around ± 5C). The feed was performed by a metric pump and
Table 3: Physical Properties of Pt-Re/Al2O3 Catalyst
Catalyst Type Nominal Diameter, (mm) ADB (Kg/m3) Pt , wt.% Re , wt.% Cl , wt.% S, wt.%
Pt-Re/Al2O3 1.6 838 0.17 0.35 1.34 0.049
Catalytic Naphtha Reforming; Challenges for Selective Gasoline Journal of Advanced Catalysis Science and Technology, 2016, Vol. 3, No. 1 35
consisted of hydrotreated naphtha (free sulfur naphtha) derived from blended (Sharara-Hamada-feel) crude oil. The sulfur and nitrogen content was below 0.5 ppmwt and the minimum initial boiling point is 75°C and maximum end point is 175 °C. The pump was calibrated on the reactant feed to choose the right position that fulfills the desired contact time (LHSV, h-
1). Table 4 shows the composition of hydrocarbons totals by group type and RON of heavy naphtha determined by near infra-red (NIR) gasoline analyzer (wt. %) The operating conditions of the activity test were performed according to the 16 experimental matrix network obtained from statestica software shown in Table 6. Before the catalytic reaction carried out, the catalysts were in suit treated directly in the reactor by N2 flow at 110 oC (1hr), and then reduced by hydrogen flow at 480 oC (2h). The condenser which linked to the high pressure gas-liquid separator was kept at -15 oC by using a cryostate contained ethylene glycol. Liquid samples were collected in each hour for six hours, time-on-stream (TOS).
3.4. Analysis of Liquid Products
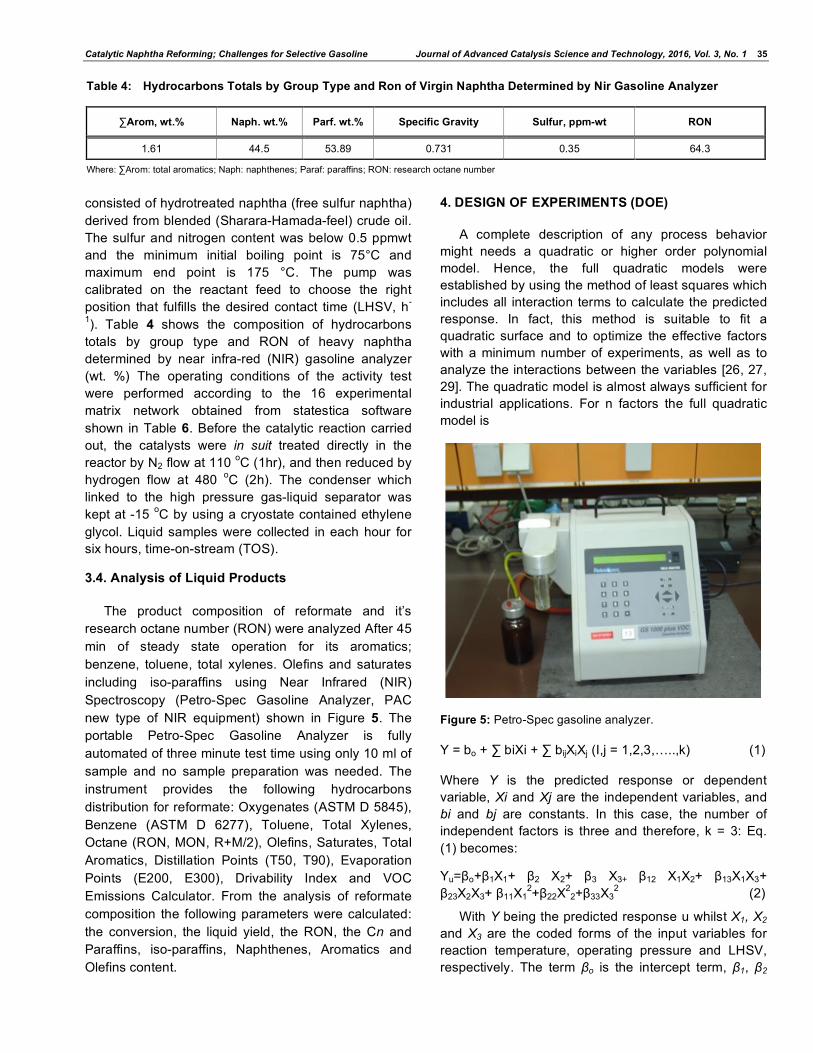
The product composition of reformate and it’s research octane number (RON) were analyzed After 45 min of steady state operation for its aromatics; benzene, toluene, total xylenes. Olefins and saturates including iso-paraffins using Near Infrared (NIR) Spectroscopy (Petro-Spec Gasoline Analyzer, PAC new type of NIR equipment) shown in Figure 5. The portable Petro-Spec Gasoline Analyzer is fully automated of three minute test time using only 10 ml of sample and no sample preparation was needed. The instrument provides the following hydrocarbons distribution for reformate: Oxygenates (ASTM D 5845), Benzene (ASTM D 6277), Toluene, Total Xylenes, Octane (RON, MON, R+M/2), Olefins, Saturates, Total Aromatics, Distillation Points (T50, T90), Evaporation Points (E200, E300), Drivability Index and VOC Emissions Calculator. From the analysis of reformate composition the following parameters were calculated: the conversion, the liquid yield, the RON, the Cn and Paraffins, iso-paraffins, Naphthenes, Aromatics and Olefins content.
4. DESIGN OF EXPERIMENTS (DOE)
A complete description of any process behavior might needs a quadratic or higher order polynomial model. Hence, the full quadratic models were established by using the method of least squares which includes all interaction terms to calculate the predicted response. In fact, this method is suitable to fit a quadratic surface and to optimize the effective factors with a minimum number of experiments, as well as to analyze the interactions between the variables [26, 27, 29]. The quadratic model is almost always sufficient for industrial applications. For n factors the full quadratic model is
Figure 5: Petro-Spec gasoline analyzer.
Y = bo + ∑ biXi + ∑ bijXiXj (I,j = 1,2,3,…..,k) (1)
Where Y is the predicted response or dependent variable, Xi and Xj are the independent variables, and bi and bj are constants. In this case, the number of independent factors is three and therefore, k = 3: Eq. (1) becomes:
Yu=βo+β1X1+ β2 X2+ β3 X3+ β12 X1X2+ β13X1X3+ β23X2X3+ β11X1
2+β22X22+β33X3
2 (2)
With Y being the predicted response u whilst X1, X2
and X3 are the coded forms of the input variables for reaction temperature, operating pressure and LHSV, respectively. The term βo is the intercept term, β1, β2
Table 4: Hydrocarbons Totals by Group Type and Ron of Virgin Naphtha Determined by Nir Gasoline Analyzer
∑Arom, wt.% Naph. wt.% Parf. wt.% Specific Gravity Sulfur, ppm-wt RON
1.61 44.5 53.89 0.731 0.35 64.3
Where: ∑Arom: total aromatics; Naph: naphthenes; Paraf: paraffins; RON: research octane number

36 Journal of Advanced Catalysis Science and Technology, 2016, Vol. 3, No. 1 Fawzi M. Elfghi
and β3 the linear terms, β11, β22 and β33 are the squared terms, and β12 β13 β23 are the interaction terms between the three variables. The selection of these variables with defined experimental ranges were carefully chosen based on previous screening carried-out earlier prior to optimization using the classical one-variable-at-a-time (OVAT) approach and are often used in the literatures. The lowest and the heights levels of variables coded as -1 and +1, respectively were given in Table 5 including axial star points of (– α and + α), where α is the distance of the axial points from centre. In this study α value calculated using equation 3 and it was fixed at 1.76 (orthogonal). α = (F) ¼ (3)
Where; F is the number of points in the cube section of the design (F = 2k, k is the number of factors). Since we have three factors, the F number is equal to 23 (= 8)
points, and α = 1.76. Therefore the total number of experiment combinations should be conducted based on the same concept of CCD by applying of equation 4
2k+2k + no (4)
Where k is the number of independent variables and no is the number of experiments repeated at the centre point, In this case, no = 2 and k = 3, as a result, the total number of runs needed were16 runs. A matrix of 16 experiments with three factors was generated using the software package, ‘STATISTICA version 6 (Stat Soft Inc., Tulsa, USA). The two centre points were used to determine the experimental error and reproducibility of the data. Table 6 shows the complete design matrix of the experiments performed together with the de/coded values. The RON (YRON) response was used to develop an empirical model. The second step after executing the experimental design is to
Table 5: Independent Variables and Their Coded and Actual Values
Coded Levels Independent Variable Symbol
-α -1 0.00 +1 +α
Operating temperature (◦C) X1 468 480 495 510 521
Operating pressure (bar) X2 2 10 20 30 37
Space velocity (h-1) X3 0.9 1.2 1.5 1.8 2.0
Where: −/+α, star point value; −1, low value; +1, high value; 0, center value.
Table 6: Experimental Design of Central Composite with De/coded Values
X1 X2 X3 Standard Runa
Reaction Temperature (oC) Levelb Operating Pressure(bar) Leveb LHSV(h-1) Levelb
1 O 480 -1 10 -1 1.2 -1
2 O 480 -1 10 -1 1.8 1
3 O 480 -1 30 1 1.2 -1
4 O 480 -1 30 1 1.8 1
5 O 510 1 10 -1 1.2 -1
6 O 510 1 10 -1 1.8 1
7 O 510 1 30 1 1.2 -1
8 O 510 1 30 1 1.8 1
9 C1 495 0 20 0 1.5 0
10 S 468 -α 20 0 1.5 0
11 S 521 +α 20 0 1.5 0
12 S 495 0 2.36 -α 1.5 0
13 S 495 0 37.63 +α 1.5 0
14 S 495 0 20 0 0.97 -α
15 S 495 0 20 0 2.02 +α
16 C2 495 0 20 0 1.5 0 aO = orthogonal design points, C = centre points, S = star axial points. b -1=low value, +1=high value,+/- α= star point value

Catalytic Naphtha Reforming; Challenges for Selective Gasoline Journal of Advanced Catalysis Science and Technology, 2016, Vol. 3, No. 1 37
interpret and analyze the output of experimental data. To analyze the output data more critically, a more efficient method was used called analysis of variance (ANOVA) of 5% level of significance using Fisher F-test. This method examines all samples and measures them together. It is a simple arithmetical method of sorting out the components of variation in a given set of data and providing test for significance8.
4. RESULTS AND DISCUSSION
4.1. SEM-EDS/X
The pretreatment of the catalyst sample was performed by coating with gold powder and placed in
the electron optics column then evacuated to 2*10-6 torr. The highest magnification used was 200,000 times with a resolution of 10 nm at a working voltage of 15 kV.
Figure 6 shows the images of Pt-Re/Al2O3 catalyst with different resolutions. The maximum resolution were around 7.73 KX. However, some bright spots areas appeared, most likely corresponding to platinum particles on the porous of Alumina. In the EDX patterns, the majority of metal particles detected were platinum, Rhenium. The Al, O and Cl peaks in all spectrums was attributed to the chlorinated alumina support. A considerable overlapping of X-ray intensity
Figure 6: (a), (b), (c) And (d) SEM at Different Magnifications; (e) And (f) EDS Of Pt-Re Catalyst.

38 Journal of Advanced Catalysis Science and Technology, 2016, Vol. 3, No. 1 Fawzi M. Elfghi
on the M axis between Pt and Re were due to the closeness of Pt (2.05 keV) and Au (1.89 keV) in the periodic table. The EDX quantitative analysis confirmed the presence of active metals in good agreements between the nominal and evaluated Pt and Re content.
4.2. TGA-DTA
TGA mass variation values calculated based on the formula given below:
c. mass variation : ( mi - mf / mi ) * 100 (5)
Where
mi = initial mass of the sample; mf = final mass of the sample
TGA-DTA curves shown in Figure 7 reveal a steady mass variation loss during the experiment. It can be
noticed from the Figure that DTA curve show endothermic heat flow (drop) accompanied with the TGA curve which is normal phenomena. This fact led to conclude that the structure of the catalyst was stable at high temperatures up to 900oC. The weight loss of mass of 8%, wt.% was attributed to the release of physosorbed water as well as some impurities usually present in the commercial catalysts.
5. MATHEMATICAL MODEL OF RESPONSE
In the catalytic naphtha reforming processes, only a few studies have attempted to model and optimize the process conditions by applying response surface methodology (RSM) and to find out the optimum responses simultaneously.
The mathematical equation model obtained was tested with the ANOVA analysis of 5% level of
Figure 7: Thermogravimetric analysis of Pt-Re catalyst.
Table7: ANOVA for RON Model
RON Model
Sources Sum of Squares Degree of Freedom Mean Squares F(calculated) Value F(Tabulated) (6,9,0.05)
S.S. Regression 264.362 9 29.373 5.147 >3.37
S.S. Error 34.2352 6 5.705
S.S. Total 298.5972 15

Catalytic Naphtha Reforming; Challenges for Selective Gasoline Journal of Advanced Catalysis Science and Technology, 2016, Vol. 3, No. 1 39
significance. The De/coded ranges and levels used in this experimental work are given in Table 5 and 6, respectively in which X1 denotes reaction temperature, X2 refers to total pressure, while X3 refers to LHSV, respectively
The experimental design matrix and ANOVA analysis was obtained from the STATISTICA Software Version 6 (Stat soft Inc.). The adequacy of each model was checked with the analysis of variance (ANOVA) using Fisher F-test. The ANOVA for three responses is shown in Table 7.
The F value is a measurement of variance of data about the mean, based on the ratio of mean square of group variance due to error. In this case study, the computed Fisher test values for the RON model in Table 7 are bigger than the tabulated F value (F6, 9, 0.05
= 3.37) at α = 0.05 in statistic Table [29], so that the null hypothesis was rejected. Having rejected the null hypothesis means that can infer that equation (2) has a good prediction of the responses and the estimated factor effects are real at 95% confidence level.
5.1. RON Model
The experiments were carried-out based on the design matrix shown in Table 6.
The quadratic mathematical model of RON (YR) is represented in Eq. (6).
As present in Table 8 the computed Fisher test value for the RON yield model is bigger than the tabulated F value (F6, 9, 0.05 = 3.37) at α = 0.05 in statistic Table, so that the null hypothesis was rejected
Table 8: ANOVA for RON Value
RON Model
Sources Sum of Squares Degree of Freedom Mean Squares F(calculated) Value F(Tabulated) (6,9,0.05)
S.S. Regression 264.362 9 29.373 5.147 >3.37
S.S. Error 34.2352 6 5.705
S.S. Total 298.5972 15
Table 9: CCOD of Three Variables with the Observed Responses and Predicted Values for RON Values
(X1) (X2) (X3) YO YP YO-YP
480.00 10.000 1.20 98.60 99.41 -0.81
480.00 10.000 1.80 98.06 95.13 2.920
480.00 30.000 1.20 92.30 92.75 -0.45
480.00 30.00 1.80 91.40 91.63 -0.23
510.00 10.00 1.20 105.10 104.42 0.67
510.00 10.00 1.80 100.53 99.63 0.89
510.00 30.00 1.20 98.90 101.38 -2.48
510.00 30.00 1.80 101.00 99.74 1.25
495.00 20.00 1.50 95.70 95.73 -0.03
468.54 20.00 1.50 91.50 92.09 -0.59
521.45 20.00 1.50 103.70 103.67 0.02
495.00 2.36 1.50 101.50 103.37 -1.87
495.00 37.63 1.50 98.90 97.59 1.30
495.00 20.00 0.97 100.50 98.54 1.95
495.00 20.00 2.02 90.80 93.32 -2.52
495.00 20.00 1.50 95.70 95.73 -0.03
Where; X1, X2 and X3 are the independent variables referred to reaction temperature, total pressure and space velocity, respectively. Yo was referred to observed data, and Yp to predicted data.

40 Journal of Advanced Catalysis Science and Technology, 2016, Vol. 3, No. 1 Fawzi M. Elfghi
which means that equation (6) has a good prediction of the RON yield and the estimated factor effects are real at 95% confidence level. The quadratic mathematical model for yield of RON value is presented in the following equation (6)
Y RON= 805.3954 - 2.9024X1 - 4.1514X2 + 1.8125X3 + 0.0060X1 X2 - 0.0286X1X3 + 0.2629 X2X3+ 0.0031X1
2 + 0.0153 X2
2 + 0.7218 X32 (6)
Where, YRON is the predicted yield of RON of reformates obtained from naphtha conversion.
Table 9 compares the observed experimental yield of RON with the predicted one obtained from equation (6). A practical rule of thumb for evaluating the determinant coefficient, R2 is that should be higher or equal 0.75. As shown, the R2 for RON value predicted model is 0.88535, indicating that the empirical model is adequate to explain most of the availability in the assay reading.
Figure 8 demonstrates the evaluated t-Student’s distribution test in Pareto chart and the corresponding p value. The p-value serves as a tool to check the significance of each coefficient. The higher the t-value or the smaller the p-value the more significant is the corresponding coefficient. Generally, a p-value of less than < 0.05 is considered to be very significant. As illustrated in Figure 8, X1, the reaction temperature (linear) has the largest effect on RON yield, having a p-value of 0.00204. Followed by X2, operating pressure (linear) could also be considered and regarded as significant factor affecting the yield of RON since its p- value less than 0.05 (0.041555).
Figure 8: Pareto chart and p-values of RON yield.
The 2D contour plot and 3D response surfaces plots are the graphical representations of the regression equations. Figures 9 show that the yield of RON varies from 91.5 to 105 when the reaction temperature is in the range of 470oC to 520oC; operating total pressure is in the range of 5 to 37 bar. The Figure clearly demonstrates that RON yield is significantly affected by increasing the reaction temperature and reduced operating total pressure, this can be attributed to the fact that raising the reaction temperature (at mild hydrogen pressure) favor the formation of aromatics and olefin hydrocarbons. However, these hydrocarbons owning high octane number thus resulted in enhance the RON of reformates. Figure 10 for 3D shows that the space velocity LHSV is statistically insignificant in determine the RON yield. The RON reaches its maximum value (110) when the reaction temperature raised up to 530 oC.
Figure 9: 2-D contour surface plot of RON as a function of temperature and pressure depicted at fixed space velocity.
Figure 10: Response surface plot for the design. RON as function of reaction temperature and space velocity depicted at fixed pressure.

Catalytic Naphtha Reforming; Challenges for Selective Gasoline Journal of Advanced Catalysis Science and Technology, 2016, Vol. 3, No. 1 41
6.5. Optimization and Verification of RON Model Yield Using RSM
The response surface analysis using statistica 6.00 sofware indicated that the predicted maximum RON yield is 89.00 at reaction temperature = 449oC, operating total pressure = 32bar and LHSV=1.7h-1. Additional experiments were carried out to validate the optimization results obtained by the response surface methodology analysis.
Table 10: Comparison between Predicted and Observed Responses at Optimum Condition (Reaction Temperature = 449oC, Operating Pressure=32bar and LHSV=1.7 h-1) Obtained from RSM
Responses Predicted Value Observed Value Error (%)
RON yield 89.00 90.76 1.93
The comparison between the real experimental and
predicted data for yield of RON at optimum conditions is shown in Table 10. As demonstrated, the experimental values was 90.76 for the RON yield.
In the meantime, the differences between the predicted and observed results are 1.93 for RON yield. It can be conclude that the obtained operating conditions for multi-response optimization favor the formation of i-paraffins as well as the aromatics which are the crucial components in enhancing the RON. As a result, a reasonable value of RON (89) was obtained since aromatics are the crucial components to enhance RON, the substantial decrease in RON most likely compensated by (isomers hydrocarbons). The errors can be considered as small errors as the observed values were within the 95% confidence intervals. The confidence intervals were calculated based on the ANOVA error term of each equation. Additionally the optimization of RON yield with RSM (89.00) was more efficient than the one-variable-at-a-time approach (81.4). The fact that has been obtained from this case study indicates clearly that the statistical model is useful in the accurate prediction and optimization of this catalytic process.
6. CONCLUSION
The influence of reaction temperature, operating pressure and Liquid hourly space velocity on catalytic naphtha reforming process were studied over Pt-Re/ Al2O3 catalyst. Central composite design (CCD) coupled with response surface methodology (RSM) were employed to find out the best operating conditions
for maximum RON. The design guided to the surface responses clearing up the dependence of high RON yield on reaction temperature (480-510 oC), operating pressure (10-30 bar) and LHSV (1.2-1.8 h-1). The equation models were tested with analysis of variance with 95% degree confidence. The results of the analysis concluded that the equation models fitted well with the experimental results for naphtha reforming process to produce high RON selective reformates. Numerical results indicated that the obtained RON was 89 at optimum reaction temperature = 449 oC, operating pressure = 32 bar and LHSV = 1.7 h-1-. Additional experiments were carried at the defined optimum conditions for verification.
REFERENCES
[1] Bee AG. The Golden Century of Oil 1950-2050--The depletion of a resource: C. J Campbell Kluwer Academic; 1991; ISBN 07923 1442 5; Price Dfl 190; £64. Marine and Petroleum Geology 1993; 10: 182-183. http://dx.doi.org/10.1016/0264-8172(93)90026-O
[2] Kontorovich, AE. Estimate of global oil resource and the forecast for global oil production in the 21st century. Russian Geology and Geophysics 2009; 50: 237-242. http://dx.doi.org/10.1016/j.rgg.2009.03.001
[3] EIA, Energy Information Administration. (2002). US Department of Energy, Washington, DC, Fundamentals of Petroleum Refining. Amsterdam: Elsevier.
[4] Ancheyta J, Betancourt G, Marroquín G, Centeno G, Casta-eda LC, Alonso F. Hydroprocessing of Maya heavy crude oil in two reaction stages. Applied Catalysis A: General 2002; 233(1-2): 159-170. http://dx.doi.org/10.1016/S0926-860X(02)00145-X
[5] Elgarni M. Dieselization trends in Europe, North America and China. The 4th international technology of oil and gas forum and exhibition. TOG- 2008; 64: 113.
[6] Speight JG. Feedstocks The Refinery of the Future. Boston: William Andrew Publishing 2011b; 1-37. http://dx.doi.org/10.1016/B978-0-8155-2041-2.10001-3
[7] Speight JG. Refinery of the Future. The Refinery of the Future. Boston: William Andrew Publishing. Tahmassebi, H. Crude oil and product value differentials: Historical perspective and outlook. Energy 2011c; 11: 343-359.
[8] Stikkers DE. Octane and the Environment. The Science of the Total Environment 2002; 299: 37-56. http://dx.doi.org/10.1016/S0048-9697(02)00271-1
[9] Zahedi G, Mohammadzadeh S. and Moradi G. Enhancing Gasoline Production in an Industrial Catalytic-Reforming Unit Using Artificial Neural Networks. Energy & Fuels 2008; 22(4): 2671-2677. http://dx.doi.org/10.1021/ef800025e
[10] Speight JG. Hydrocarbons from Petroleum Handbook of Industrial Hydrocarbon Processes. Boston: Gulf Professional Publishing 2011a; 85-126. http://dx.doi.org/10.1016/B978-0-7506-8632-7.10003-9
[11] Nicklson A. Refining developments and aromatics prospects. Petroleum Technology Quarterly. PTQ Q 2006; 3: 79-83
[12] Fahim MA, Alsahhaf TA, and Elkilani A. Refinery Feedstocks and Products Fundamentals of Petroleum Refining. Amsterdam: Elsevier 2010b; 11-31. http://dx.doi.org/10.1016/B978-0-444-52785-1.00002-4
[13] Poulopoulos S, and Philippopoulos C. Influence of MTBE

42 Journal of Advanced Catalysis Science and Technology, 2016, Vol. 3, No. 1 Fawzi M. Elfghi
addition into gasoline on automotive exhaust emissions. Atmospheric Environment 2000; 34(28): 4781-4786. http://dx.doi.org/10.1016/S1352-2310(00)00257-0
[14] Moljord K, Hellenes HG, Hoff A, Tanem I, Grande K, and Holmen A. Effect of Reaction Pressure on Octane Number and Reformate and Hydrogen Yields in Catalytic Reforming. Industrial & Engineering Chemistry Researc 1996; 35(1): 99-105. http://dx.doi.org/10.1021/ie940582r
[15] Fahim MA, Alsahhaf TA, and Elkilani A. Refinery Economics Fundamentals of Petroleum Refining. Amsterdam: Elsevier 2010a; 403-421. http://dx.doi.org/10.1016/B978-0-444-52785-1.00018-8
[16] Zakumbaeva G, Van T, Lyashenko A, Egizbaeva R, Catalytic reforming n-octane on Pt–Re/Al2O3 catalysts promoted by different additives, Catalysis Today 2001; 6. http://dx.doi.org/10.1016/s0920-5861(00)00584-8
[17] Grau J, Vera C, Parera J, Preventing self-poisoning in [Pt/Al2O3+SO42-ZrO2] mixed catalysts for isomerization-cracking of heavy alkanes by prereduction of the acid function, Applied Catalysis. A 2002; 227.
[18] Carvalho L, Pieck C, Rangel M, Figoli N, Grau J, Reyes P, Parera J, Trimetallic naphtha reforming catalysts: I.Properties of the metal function and influence of the order of addition of the metallic precursors on Pt-Re-Sn/γAl2O3-Cl. Applied Catalysis: A 2004; 269.
[19] Mazzieri V, Grau, C, Vera J, Yori J, Parera J, Pieck C, Role of Sn in Pt-Re-Sn/Al2O3-Cl catalysts for naphtha reforming, Catal. Today 2005; 107-108 http://dx.doi.org/10.1016/j.cattod.2005.07.042
[20] Pope T, Kriz J, Stanciulescu M. Monnier J, A study of catalyst formulations for isomerization of C7 hydrocarbons, Applied Catalysis A 2002; 233
[21] Ali SA, Siddiqui AM and Ali MA. parametric study of catalytic reforming process. Reaction Kinetics Catalysis Letters 2006; 87(1): 199-206.
http://dx.doi.org/10.1007/s11144-006-0001-y [22] Antos GJ. and Aittani AM. Catalytic Naphtha Reforming.
Second edition Book, Revised and Expanded (Chemical Industries). (MARCEL DEKKER, INC. NEWYOUR. BASEL) 2004. http://dx.doi.org/10.1201/9780203913505
[23] Bezerra MA, Santelli RE, Oliveira EP, Villar LS, and Escaleira LA. Response surface methodology (RSM) as a tool for optimization in analytical chemistry. Talanta 2008; 76(5): 965-977. http://dx.doi.org/10.1016/j.talanta.2008.05.019
[24] Bhatti MS, Kapoor D, Kalia RK, Reddy AS, and Thukral AK. RSM and ANN modeling for electrocoagulation of copper from simulated wastewater: Multi objective optimization using genetic algorithm approach. Desalination 2011; 274(1-3): 74-80. http://dx.doi.org/10.1016/j.desal.2011.01.083
[25] Bishara A, Stanislaus A and Hussain SS. Effect of feed composition and operating conditions on catalyst deactivation and on product yield and quality during naphtha catalytic reforming. Applied Catalysis 1984; 13: 113-125. http://dx.doi.org/10.1016/S0166-9834(00)83332-1
[26] Burkert JFM, Maugeri F, and Rodrigues MI. Optimization of extracellular lipase production by Geotrichum sp. using factorial design. Bioresource Technology 2004; 91(1): 77-84. http://dx.doi.org/10.1016/S0960-8524(03)00152-4
[27] Statsoft, Electronic Static Textbook. Statsoft Inc. Unpublished. Avaliable at http:// www.statsoft.com/textbook/stathome.html 2004
[28] Rossini S The impact of catalytic materials on fuel reformulation, Catalysis Today 2003; 77. http://dx.doi.org/10.1016/s0920-5861(02)00386-3
[29] Montgomery D, Runger G, Hubele N, ENGINEERING STATISTCS, Third Edition, chapter 7, Design of Engineering Experiments 2003.
Received on 28-02-2015 Accepted on 30-03-2016 Published on 08-04-2016 http://dx.doi.org/10.15379/2408-9834.2016.03.01.04
© 2016 Fawzi M. Elfghi; Licensee Cosmos Scholars Publishing House. This is an open access article licensed under the terms of the Creative Commons Attribution Non-Commercial License (http://creativecommons.org/licenses/by-nc/3.0/), which permits unrestricted, non-commercial use, distribution and reproduction in any medium, provided the work is properly cited.