june 1 st, 2017 | compact version - incrementum · the performance in this secular bull market is...
TRANSCRIPT

1
#igwt2017
Ronald-Peter Stoeferle Mark J. Valek
June 1st, 2017 | Compact Version Extended Version (170 pages) available at www.ingoldwetrust.report
„In Gold we Trust“ Report | Compact Version 2
#igwt2017
We would like to express our profound gratitude to our premium
partners for supporting the „In Gold we Trust” 2017
3
Introduction
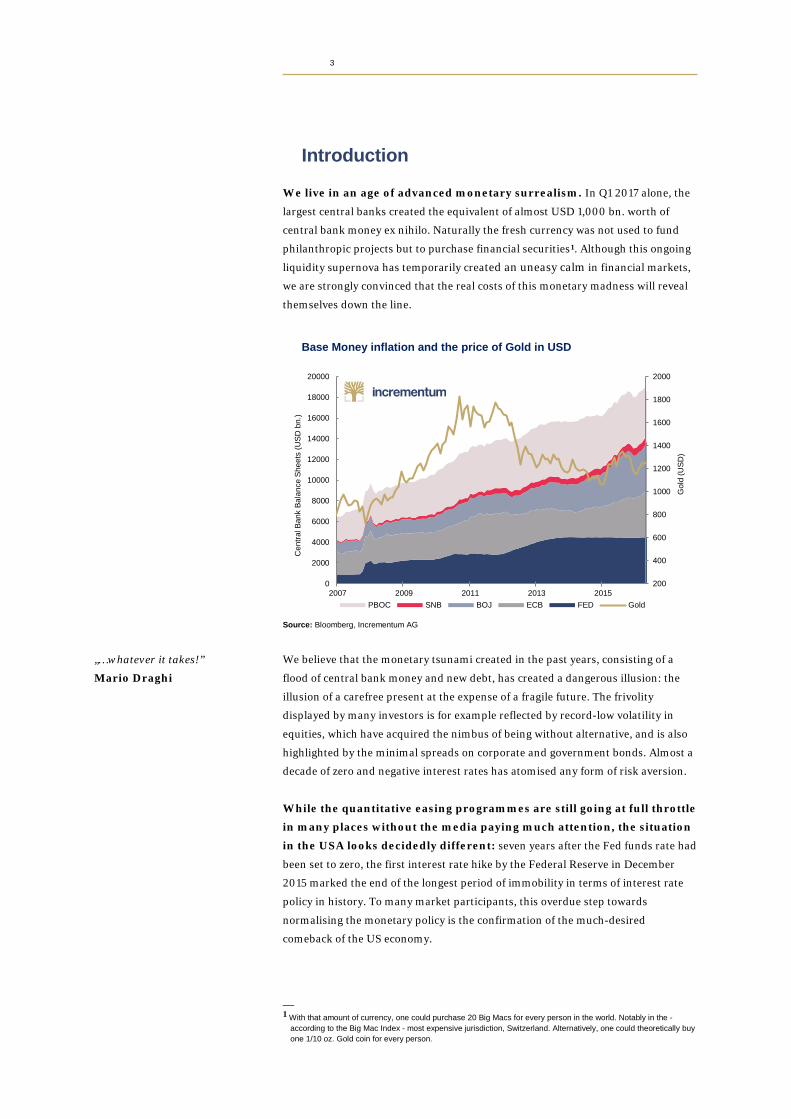
We live in an age of advanced monetary surrealism. In Q1 2017 alone, the
largest central banks created the equivalent of almost USD 1,000 bn. worth of
central bank money ex nihilo. Naturally the fresh currency was not used to fund
philanthropic projects but to purchase financial securities1. Although this ongoing
liquidity supernova has temporarily created an uneasy calm in financial markets,
we are strongly convinced that the real costs of this monetary madness will reveal
themselves down the line.
Base Money inflation and the price of Gold in USD
Source: Bloomberg, Incrementum AG
We believe that the monetary tsunami created in the past years, consisting of a
flood of central bank money and new debt, has created a dangerous illusion: the
illusion of a carefree present at the expense of a fragile future. The frivolity
displayed by many investors is for example reflected by record-low volatility in
equities, which have acquired the nimbus of being without alternative, and is also
highlighted by the minimal spreads on corporate and government bonds. Almost a
decade of zero and negative interest rates has atomised any form of risk aversion.
While the quantitative easing programmes are still going at full throttle
in many places without the media paying much attention, the situation
in the USA looks decidedly different: seven years after the Fed funds rate had
been set to zero, the first interest rate hike by the Federal Reserve in December
2015 marked the end of the longest period of immobility in terms of interest rate
policy in history. To many market participants, this overdue step towards
normalising the monetary policy is the confirmation of the much-desired
comeback of the US economy.
— 1 With that amount of currency, one could purchase 20 Big Macs for every person in the world. Notably in the -
according to the Big Mac Index - most expensive jurisdiction, Switzerland. Alternatively, one could theoretically buy one 1/10 oz. Gold coin for every person.
„…whatever it takes!”
Mario Draghi
200
400
600
800
1000
1200
1400
1600
1800
2000
0
2000
4000
6000
8000
10000
12000
14000
16000
18000
20000
2007 2009 2011 2013 2015
Cen
tral B
ank
Bala
nce
Shee
ts (U
SD b
n.)
PBOC SNB BOJ ECB FED Gold
Gol
d (U
SD)
„In Gold we Trust“ Report | Compact Version 4
#igwt2017
However, the interest rate reversal that had been announced for years
got off to a sluggish start. Market participants became increasingly nervous in
2016 when it started turning out that central banks would not be remotely able to
stick to the speed of four interest rate hikes as announced. After the FOMC
meeting in March 2016, the first question that CNBC journalist Steve Liesman
asked Janet Yellen was:
"Does the Fed have a credibility problem […]?"2
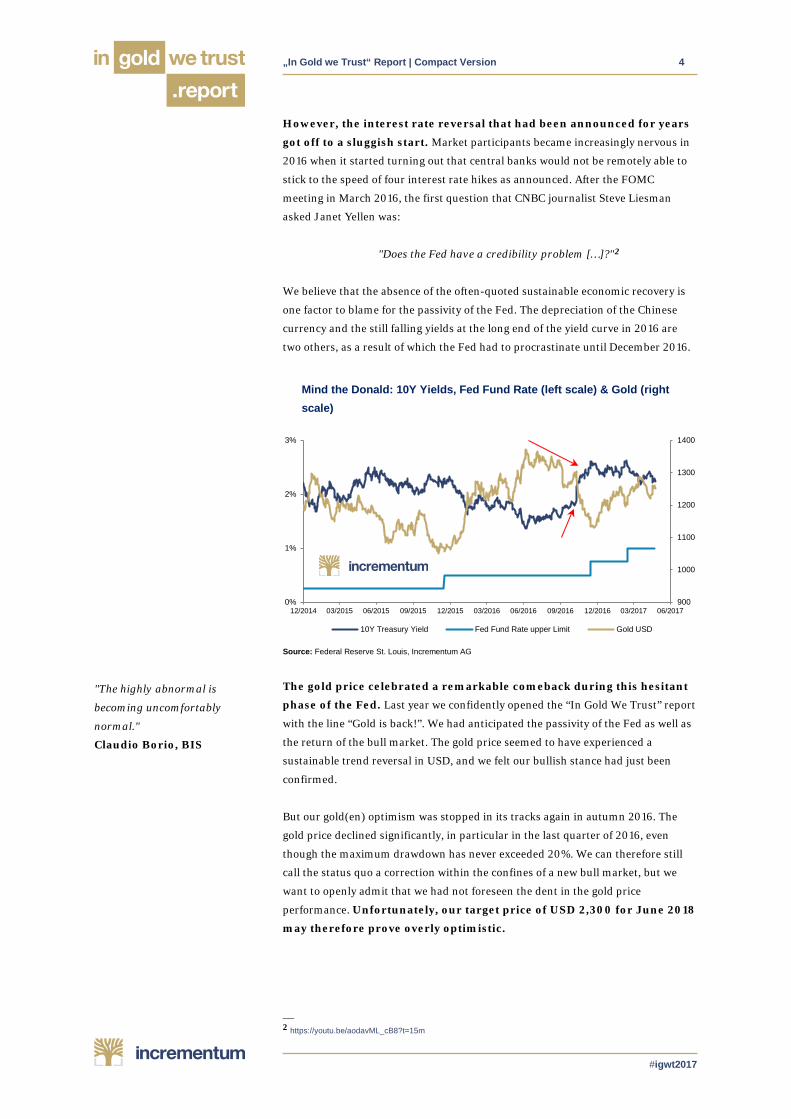
We believe that the absence of the often-quoted sustainable economic recovery is
one factor to blame for the passivity of the Fed. The depreciation of the Chinese
currency and the still falling yields at the long end of the yield curve in 2016 are
two others, as a result of which the Fed had to procrastinate until December 2016.
Mind the Donald: 10Y Yields, Fed Fund Rate (left scale) & Gold (right scale)
Source: Federal Reserve St. Louis, Incrementum AG
The gold price celebrated a remarkable comeback during this hesitant
phase of the Fed. Last year we confidently opened the “In Gold We Trust” report
with the line “Gold is back!”. We had anticipated the passivity of the Fed as well as
the return of the bull market. The gold price seemed to have experienced a
sustainable trend reversal in USD, and we felt our bullish stance had just been
confirmed.
But our gold(en) optimism was stopped in its tracks again in autumn 2016. The
gold price declined significantly, in particular in the last quarter of 2016, even
though the maximum drawdown has never exceeded 20%. We can therefore still
call the status quo a correction within the confines of a new bull market, but we
want to openly admit that we had not foreseen the dent in the gold price
performance. Unfortunately, our target price of USD 2,300 for June 2018
may therefore prove overly optimistic.
— 2 https://youtu.be/aodavML_cB8?t=15m
"The highly abnormal is
becoming uncomfortably
normal."
Claudio Borio, BIS
900
1000
1100
1200
1300
1400
0%
1%
2%
3%
12/2014 03/2015 06/2015 09/2015 12/2015 03/2016 06/2016 09/2016 12/2016 03/2017 06/2017
10Y Treasury Yield Fed Fund Rate upper Limit Gold USD

„In Gold we Trust“ Report | Compact Version 5
#igwt2017
But what was the trigger of the sudden reverse thrust of the gold price?
Source: https://de.wikipedia.org/wiki/Donald_Trump3
Ironically, it was Donald J. Trump. The election of the presidential candidate
originally unloved by Wall Street fuelled hopes of a renaissance of America on the
basis of a nationalistic growth policy. President Trump brought about a change in
sentiment, especially among a class of society that had lost its trust in the
economic system and political institutions. Stocks received another boost, and the
increase in the gold price was (temporarily) halted.
The Fed seems to be keen to use the new euphoria on the markets in order to push
the normalisation of monetary policy. Even if the journalistic mainstream is
abundantly convinced of the sustainability of the US interest rate reversal, a
contradiction is embedded in the narrative of the economic upswing triggered by
Trump: if the economic development, as claimed by the Fed in the past years, was
actually rosy even prior to Trump’s victory, the candidate promising in his central
message to make America great AGAIN would presumably not have won. The
narrative of a recovering US economy is the basis of the bull market in
equities.
The valuation level of the US equity market is nowadays ambitious, to put it mildly
- both in absolute numbers and in terms of the economic output. This prompts
the conclusion that the U.S. is caught up for the third time within two
decades in an illusionary bubble economy created by money supply
inflation and equipped with an expiry date. In comparison with the earlier
two bubbles, however, the excess is not limited to certain sectors (technology in
2000, credit in 2008), but it is omnipresent and includes various asset classes,
especially also bonds and (again) property. In view of the current situation,
the renowned analyst Jesse Felder rightly talks about an “Everything
Bubble”.4 From our point of view, the concept of the classic investment portfolio,
which calls for shares to satisfy the risk appetite and bonds as safety net, must be
critically questioned.
— 3 This is Donald Trump’s official presidential photo. Seriously! 4 cf. “Welcome to the everything bubble“, Jesse Felder, The Felder Report
"It’s the economic, stupid." Richard Lugner* (*Austrian equivalent of Donald Trump)
"It’s the economy, stupid." Bill Clinton
"… Stocks, bonds and real estate
have all become as overvalued as
we have ever seen any one of
them individually in this country.
The end result of all of this
money printing and interest rate
manipulation is the worst
economic expansion since the
Great Depression and the
greatest wealth inequality since
that period." Jesse Felder
"There are two ways to be fooled.
One is to believe what isn’t true;
the other is to refuse to believe
what is true."
Søren Kierkegaard

„In Gold we Trust“ Report | Compact Version 6
#igwt2017
The "Everything Bubble": Financial Assets relative to disposable personal income
Source: Incrementum AG, Jesse Felder, Federal Reserve St. Louis
While markets are already celebrating the future successes of Trumponomics, the
structural weakness of the US real economy is revealed yet again in the latest
growth figures. According to the most recent estimate, the US economy expanded
in Q1 2017 by a meagre 1.2 % y/y. In combination with an inflation rate of more
than 2%, this means that the U.S. is at the edge of stagflation - a scenario we have
warned about on several prior occasions. But markets are obviously taking a
different view than we are. At least for now.
In the past years, rate cuts and other monetary stimuli have affected mainly asset
price inflation. Last year, we wrote: “Sooner or later, the reflation measures will
take hold, and asset price inflation will spill over into consumer prices. Given that
consumer price inflation cannot be fine-tuned by the central banks at their
discretion, a prolonged cycle of price inflation may now be looming ahead.” 2016
might have been the year when price inflation turned the corner. However, the
hopes of an economic upswing due to Trumponomics and the strong US dollar
have caused inflation pressure to decrease for the time being. Upcoming
recession fears resulting in a U-turn by the Fed, and the consequential
depreciation of the US dollar would probably finalise the entry into a
new age of inflation. This will be the moment in which gold will begin
to shine again.
"Policy, profit and positioning
trends all argue for rotation
from deflation to inflation, from
'ZIRP winners' to 'ZIRP losers',
from Wall Street to Main Street.
As part of this rotation we expect
real assets to outperform
financial assets." Michael Hartnett
300%
350%
400%
450%
500%
550%
1970 1974 1978 1982 1986 1990 1994 1998 2002 2006 2010 2014 2018
Fina
ncia
l Ass
ets
of H
ouse
hold
s / D
ispo
sabl
e Pe
rson
al In
com
e
DotCom Bubble
Housing Bubble
Everything Bubble ?
„In Gold we Trust“ Report | Compact Version 7
#igwt2017
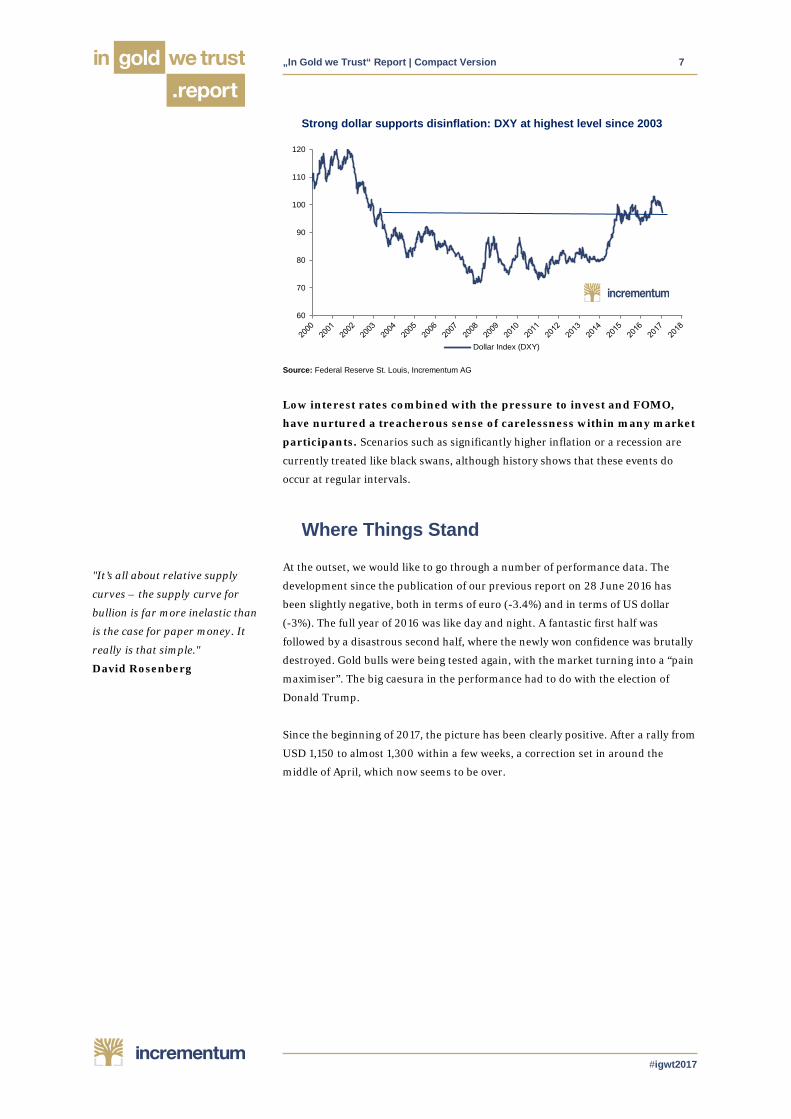
Strong dollar supports disinflation: DXY at highest level since 2003
Source: Federal Reserve St. Louis, Incrementum AG
Low interest rates combined with the pressure to invest and FOMO,
have nurtured a treacherous sense of carelessness within many market
participants. Scenarios such as significantly higher inflation or a recession are
currently treated like black swans, although history shows that these events do
occur at regular intervals.
Where Things Stand
At the outset, we would like to go through a number of performance data. The
development since the publication of our previous report on 28 June 2016 has
been slightly negative, both in terms of euro (-3.4%) and in terms of US dollar
(-3%). The full year of 2016 was like day and night. A fantastic first half was
followed by a disastrous second half, where the newly won confidence was brutally
destroyed. Gold bulls were being tested again, with the market turning into a “pain
maximiser”. The big caesura in the performance had to do with the election of
Donald Trump.
Since the beginning of 2017, the picture has been clearly positive. After a rally from
USD 1,150 to almost 1,300 within a few weeks, a correction set in around the
middle of April, which now seems to be over.
60
70
80
90
100
110
120
Dollar Index (DXY)
"It’s all about relative supply
curves – the supply curve for
bullion is far more inelastic than
is the case for paper money. It
really is that simple."
David Rosenberg

„In Gold we Trust“ Report | Compact Version 8
#igwt2017
Gold in US dollar and euro since the previous Gold Report
Source: Federal Reserve St. Louis, Incrementum AG
The performance in this secular bull market is still impressive. The average annual
performance from 2001 to 2017 has been 10.15%. Gold outperformed
practically every other asset class and especially every other currency
by a significant degree, despite intermittent (sometimes sharp)
corrections. Since the beginning of 2017, the development is quite robust, too.
On average gold is up 5.88% ytd.
Gold performance since 2001 in various currencies (%)
Source: Federal Reserve St. Louis, Goldprice.org, Incrementum AG
The following chart shows the similarities between the 1970s and the status quo.
The analysis reveals the fact that the bear market since 2011 has been following
largely the same structure and depth as the mid-cycle correction from 1974 to
1976. However, we can see that the duration of both corrections diverges
significantly.
EUR USD GBP AUD CAD CNY JPY CHF INR Mean 2001 8.10% 2.50% 5.40% 11.30% 8.80% 2.50% 17.40% 5.00% 5.80% 7.42%
2002 5.90% 24.70% 12.70% 13.50% 23.70% 24.80% 13.00% 3.90% 24.00% 16.24% 2003 -0.50% 19.60% 7.90% -10.50% -2.20% 19.50% 7.90% 7.00% 13.50% 6.91%
2004 -2.10% 5.20% -2.00% 1.40% -2.00% 5.20% 0.90% -3.00% 0.90% 0.50% 2005 35.10% 18.20% 31.80% 25.60% 14.50% 15.20% 35.70% 36.20% 22.80% 26.12%
2006 10.20% 22.80% 7.80% 14.40% 22.80% 18.80% 24.00% 13.90% 20.58% 17.24% 2007 18.80% 31.40% 29.70% 18.10% 11.50% 22.90% 23.40% 22.10% 17.40% 21.70%
2008 11.00% 5.80% 43.70% 33.00% 31.10% -1.00% -14.00% -0.30% 30.50% 15.53% 2009 20.50% 23.90% 12.10% -3.60% 5.90% 24.00% 27.10% 20.30% 18.40% 16.51%
2010 39.20% 29.80% 36.30% 15.10% 24.30% 25.30% 13.90% 17.40% 25.30% 25.18% 2011 12.70% 10.20% 9.20% 8.80% 11.90% 3.30% 3.90% 10.20% 30.40% 11.18%
2012 6.80% 7.00% 2.20% 5.40% 4.30% 6.20% 20.70% 4.20% 10.30% 7.46% 2013 -31.20% -23.20% -28.80% -18.50% -23.30% -30.30% -12.80% -30.20% -19.00% -24.14%
2014 12.10% -1.50% 5.00% 7.70% 7.90% 1.20% 12.30% 9.90% 0.80% 6.16% 2015 -0.30% -10.40% -5.20% 0.40% 7.50% -6.20% -10.1% -9.90% -5.90% -3.75%
2016 12.04% 8.50% 29.70% 10.10% 5.50% 16.50% 5.40% 10.40% 11.50% 12.27% 2017 3.02% 10.22% 5.63% 6.24% 10.35% 8.45% 4.24% 4.78% 4.32% 5.88%
Mean 10.50% 11.56% 12.50% 9.36% 10.37% 9.67% 10.21% 8.36% 13.87% 10.15%
Gold is a classic appreciation currency
1050
1100
1150
1200
1250
1100
1150
1200
1250
1300
1350
1400
Gold in USD (left scale) Gold in EUR (right scale)

„In Gold we Trust“ Report | Compact Version 9
#igwt2017
Gold bull market 1970s vs. 2000 to date
Source: Federal Reserve Fred, Incrementum AG
Not only the absolute, but also the relative development is important for a
comprehensive assessment of the status quo of the gold market. Along with gold,
silver, and mining shares, industrial metals such as zinc, nickel, copper and energy
commodities (especially coal and oil) marked stellar performances last year. All of
this happened in an environment where the US dollar climbed to a 14-year high.
We regard this as a remarkable development and as a prime example
of a bull market, whose starting gun has not been heard yet by the
majority of investors.
We consider a bullish stock market currently as the most significant
opportunity cost for gold. Therefore, a clear break-out of the gold price should
only be occurring amid a stagnating or weaker equity market. If we now compare
the gold price performance with the development of equity prices, we can see that
the relative weakness of gold seems to be slowly coming to an end. Last year we
had already noticed that the intensity of the upward trend had declined
significantly. After almost five years of underperformance relative to the broad
equity market, the tables might slowly be turning now in favour of gold.
Gold/S&P500 ratio, 50-day and 200-day Moving Averages
Source: Federal Reserve St. Louis, Incrementum AG
"If bond markets are smoking
weed, then the stock market
appears to be hooked on crack."
James Montier
"Sell economic ignorance; buy
gold."
Tim Price
1970 1971 1972 1973 1974 1975 1976 1977 1978
50
150
450
1350
2000 2002 2004 2006 2008 2010 2012 2014 2016 2018 2020 2022 2024
Gol
d (in
dexe
d) 1
970s
and
sin
ce 2
000
2000 Bull Market70s Bull Market
40%
60%
80%
100%
120%
140%
160%
180%
2011 2012 2013 2014 2014 2015 2016 2017
Gold/S&P Ratio
50d Moving Average
200d Moving Average
„In Gold we Trust“ Report | Compact Version 10
#igwt2017
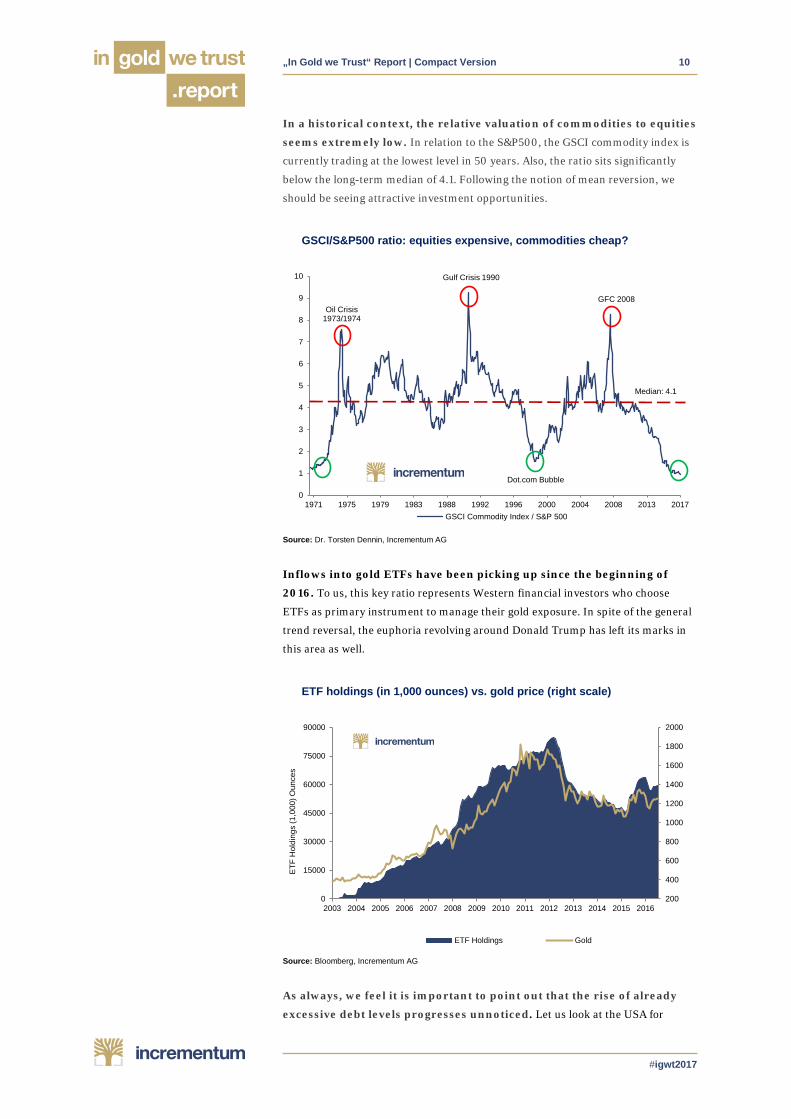
In a historical context, the relative valuation of commodities to equities
seems extremely low. In relation to the S&P500, the GSCI commodity index is
currently trading at the lowest level in 50 years. Also, the ratio sits significantly
below the long-term median of 4.1. Following the notion of mean reversion, we
should be seeing attractive investment opportunities.
GSCI/S&P500 ratio: equities expensive, commodities cheap?
Source: Dr. Torsten Dennin, Incrementum AG
Inflows into gold ETFs have been picking up since the beginning of
2016. To us, this key ratio represents Western financial investors who choose
ETFs as primary instrument to manage their gold exposure. In spite of the general
trend reversal, the euphoria revolving around Donald Trump has left its marks in
this area as well.
ETF holdings (in 1,000 ounces) vs. gold price (right scale)
Source: Bloomberg, Incrementum AG
As always, we feel it is important to point out that the rise of already
excessive debt levels progresses unnoticed. Let us look at the USA for
0
1
2
3
4
5
6
7
8
9
10
201720132008200420001996199219881983197919751971GSCI Commodity Index / S&P 500
Median: 4.1
Dot.com Bubble
Gulf Crisis 1990
GFC 2008Oil Crisis
1973/1974
200
400
600
800
1000
1200
1400
1600
1800
2000
0
15000
30000
45000
60000
75000
90000
2003 2004 2005 2006 2007 2008 2009 2010 2011 2012 2013 2014 2015 2016
ETF
Hol
ding
s (1
,000
) Oun
ces
ETF Holdings Gold

„In Gold we Trust“ Report | Compact Version 11
#igwt2017
example. The ratio of total debt to the US GDP has been around 150% in the past
150 years. Historically, there have only been two significant exceptions: the 1920s
(“the roaring twenties”), where a strong expansion of credit laid the foundation of
the stock market crash and the Great Depression; and the current phase, which
originated in the 1970s.
Unlike October 1929, even more debt was encouraged to build up in the economy
after the 1987 stock market crash, driven by Alan Greenspan’s loose interest rate
policy. In 2009, the ratio was at 378%, reaching an all-time-high. Since then,
gentle efforts have been made to deleverage, but at 365% we are still in unhealthy
regions. No trace therefore of deleveraging and austerity.
Total US credit market debt in % of GDP
Source: Dr. David Evans, www.sciencespeak.com, Incrementum AG
100%
150%
200%
250%
300%
350%
400%
1870 1890 1910 1930 1950 1970 1990 2010
Tota
l Deb
t to
GD
P (%
)
1933 Depression 299%
1929 Stockmarket crash 185%
1987 Stockmarket crash 230%
2008 Stockmarket crash 371%
2009 Peak 378%
Normal Range:130 - 170 %

„In Gold we Trust“ Report | Compact Version 12
#igwt2017
A Recession in the US: A White Swan
The future is always uncertain. It is nevertheless possible – and
sensible – to gather and interpret information in order to draw up
different future scenarios and consider reasons both for and against
their potential occurrence. Based on the “black swan” concept, we want to
discuss “black, gray and white swans”.
The surge in total indebtedness and money supply aggregates has made
the uncovered monetary system even more fragile than it already is
based on its fundamental nature. In the wake of the many non-conventional
monetary policy measures implemented by central banks, it is important that the
belatedly begun normalization of US monetary policy succeeds in order to
maintain investor confidence. We will examine potential scenarios that are liable
to cut the normalization effort short, which would ultimately lead to systemic
upheaval. Naturally, such a development would have a significant effect on the
gold price.
It is widely acknowledged that a US recession represents one of the greatest extant
risk factors for international investors. In our opinion, financial market
participants currently display a suspiciously pronounced degree of complacency.
In the following we want to examine five indications which despite the currently
prevailing optimistic sentiment suggest that a recession is far more likely than is
generally believed. These signs are:
1. Rising interest rates
2. Artificial asset price inflation
3. Consumer debt and slowing credit expansion
4. The duration of the current upswing
5. Stagnating tax revenues
Indication #1: Rising interest rates
As a long-term chart of the federal funds rate reveals, the vast majority of rate hike
cycles has led to a recession and every financial crisis was preceded by rate hikes as
well. The historical evidence is overwhelming – in the past 100 years, 16
out of 19 rate hike cycles were followed by recessions. Only three cases
turned out to be exceptions to the rule.5
— 5 These deliberations were inspired by van Hoisington - see Hoisington Quarterly Review and Outlook, Q1 2017
"Most financial traders are
picking pennies in front a
steamroller exposing themselves
to the high-impact rare event yet
sleeping like babies, unaware of
it."
Nassim Taleb
"We are living in a fragile
interim period between the Great
Financial Crisis and another
crisis that is likely to be no less
(and may possible be even more)
severe."
Thomas Mayer
"Our economic forecasting
record is nearly perfect."
Janet Yellen

„In Gold we Trust“ Report | Compact Version 13
#igwt2017
Rate hike cycles and following recessions in the US
Source: Federal Reserve St. Louis, Federal Reserve New York, Incrementum AG
This illustrates the boom-bust cycle and its relationship with monetary policy quite
well. In our opinion, the most cogent and helpful explanation of this phenomenon
and the associated concatenations is provided by Austrian business cycle theory
(ABCT).6
Future rate hikes should therefore be looked forward to with great
interest as a matter of principle.
Indication #2: Artificial asset price inflation
A declared goal of the Fed's QE programs was the inflation of asset prices, which
was supposed to stimulate consumer spending down the road:
"…we made a decision back in 2008, early 2009 we were going to have a wealth
affect. That was achieved, it made wealthy people wealthier but the point is, it
didn't trickle down... "7
Richard Fisher, former president of the Federal Reserve of Dallas
We have often pointed out that such a monetary policy represents anything but a
sustainable approach. Every artificial inflation of asset prices will sooner or later
end in a painful denouement for asset prices. In the current cycle, the surge
in asset prices has once again generated suspiciously extended
valuations. Apart from the ratio of income to total household wealth shown
earlier, the so-called “Buffett indicator”, i.e., the ratio of total market capitalization
to GDP, which is reportedly the favorite valuation indicator of legendary investor
Warren Buffett, is sending a clear warning signal. For the third time in slightly less
than two decades, it shows that the US stock market is significantly overvalued
relative to total economic output.
— 6 A detailed explanation of ABCT and its implications can inter alia be found in our book Austrian School for
Investors 7 http://www.realclearmarkets.com/video/2016/09/08/richard_fisher_wealth_effect_did_not_trickle_down.html
"We have the worst revival of an
economy since the Great
Depression. And believe me:
We're in a bubble right now."
Donald Trump
"It is hard to imagine a more stupid or more dangerous way of making decisions than by putting those decisions in the hands of people who pay no price for being wrong."
Thomas Sowell
"The tightening of policy that
puts an end to the further
expansion of an asset bubble and
the subsequent reopening of the
liquidity spigots are always
asymmetric."
www.acting-man.com
00,10,20,30,40,50,60,70,80,91
0
2
4
6
8
10
12
14
16
18
20
1914
1919
1924
1929
1934
1939
1944
1949
1954
1959
1964
1969
1974
1979
1984
1989
1994
1999
2004
2009
2014
US Recessions Effective Fed Fund Rate (pre 1955 Fed NY discount rate)
1
2
3 4
14
12
11
10
98
76
5
13
15
16
17?

„In Gold we Trust“ Report | Compact Version 14
#igwt2017
Wilshire 5000 Index and Wilshire 5000/US GDP ratio
Source: Federal Reserve St.Louis, Incrementum AG, Kevin Duffy8
Numerous other valuation metrics also suggest that stocks are currently
(significantly) overvalued, among them also the well-known Shiller P/E ratio
(a.k.a. CAPE, or cyclically adjusted P/E ratio). The fact that rate hike cycles
invariably have a negative effect on stock market valuations makes the current
level of this ratio particularly worrisome - the recent reading of 29.1 is only slightly
exceeded by the manic figure posted in 1929 and the sheer lunacy of early 2000.
Indication #3: Consumer debt levels and a slowdown in credit expansion
Interest rate signals deliberately manipulated by the central bank
create unnatural behavior patterns. For one thing, relatively wealthy
individuals think that they are becoming richer due to surging stock market and
real estate prices; but these higher prices are ephemeral, they represent phantom
wealth created by the “money illusion”, which can, and eventually will, disappear
faster than it was accumulated. For another thing, artificially low interest rates
undermine incentives to save and promote the taking up of additional debt. In
times of zero or near zero interest rates, society at large will tend to
eschew long-term, future-oriented saving in favor of conspicuous
consumption.
In April this year cumulative US household debt exceeded its pre-crisis level again
for the first time. While we regard the new record high in debt levels as a cause for
concern, the press welcomed the news as a thoroughly positive development.9
— 8 See. "Mr. Market flunks the marshmallow test", Presentation from Kevin Duffy, Grant’s Spring Konferenz 2017 9 See: “Household debt makes a comeback in the U.S”
0%
50%
100%
150%
200%
250%
0
5000
10000
15000
20000
25000
1971 1974 1977 1980 1983 1986 1989 1992 1995 1998 2001 2004 2007 2010 2013 2016
Wils
hire
5000
/GD
P
Wils
hire
500
0
Wilshire 5000 Wilshire 5000 / GDP
Tech Bubble
Subprime Bubble
"Everything Bubble"

„In Gold we Trust“ Report | Compact Version 15
#igwt2017
Total US household debt outstanding (trillion USD)
Source: Federal Reserve Bank New York, Incrementum AG
Indication #4: Duration of the economic upswing
There is usually very little consensus among economists on a great many issues: "If
you put two economists in a room, you get two opinions, unless one of them is
Lord Keynes, in which case you get three opinions."10 . Nowadays “Lord Keynes”
would probably have to be replaced with Paul Krugman, who is almost as
prominent and well-known for frequently supporting completely different
conclusions based on the same data points, depending on whatever pet agenda of
his is in need of buttressing).11
There were 49 economic expansions since the founding of the United States, which
lasted 36 months on average. Looking exclusively at the 12 post-war expansion
phases, the average duration of an upswing was 61 months. As of June 2017, the
current expansion has lasted 96 months, making it the third-longest in history.
Should the current economic expansion continue for another 24
months, it would become the longest in US history. In light of the
evidence discussed above, we believe it is unlikely that the old record
will be broken.
Indication #5: Federal tax revenues are stagnating
An interesting development can currently be observed in the trend of tax revenue
growth rates, which typically correlate strongly with economic growth. Federal tax
receipts have recently stopped growing, which is historically quite a negative sign
for the economy's future performance. An outright decrease in tax receipts is as a
rule only seen during economic contractions.
— 10 This quote is generally attributed to Winston Churchill – it shows that there is nothing new under the sun. Today
one would have to replace John Maynard Keynes with Paul Krugman. 11 Although this comment is a bit tongue in cheek, it is actually not merely a “partisan” assertion – it is backed by
plenty of evidence, much of which can be found at a site run by Tom Woods, which is actually quite fair and meticulous in its analysis of Krugman’s economic fallacies, despite being explicitly dedicated to drawing attention to them: http://contrakrugman.com/
"There is always some chance of
recession in any year, but the
evidence suggests that
expansions don't die of old age."
Janet Yellen
"Credit is a system whereby a
person who cannot pay gets
another person who cannot pay
to guarantee that he can pay."
Charles Dickens
"One day everything will be well,
that is our hope. Everything’s
fine today, that is our illusion."
Voltaire
4
5
6
7
8
9
10
11
12
13
2003
Q1
2003
Q3
2004
Q1
2004
Q3
2005
Q1
2005
Q3
2006
Q1
2006
Q3
2007
Q1
2007
Q3
2008
Q1
2008
Q3
2009
Q1
2009
Q3
2010
Q1
2010
Q3
2011
Q1
2011
Q3
2012
Q1
2012
Q3
2013
Q1
2013
Q3
2014
Q1
2014
Q3
2015
Q1
2015
Q3
2016
Q1
2016
Q3
2017
Q1
Tota
l US
Hou
seho
ld D
ebt (
trilli
on U
SD
).
Other Student Loan Credit Card Auto Loan HE Revolving Mortgage

„In Gold we Trust“ Report | Compact Version 16
#igwt2017
The consequences of a recession
Should the current expansion fail to become the longest in history and
US GDP growth indeed turn negative within the coming 24 months, we
believe the consequences could be grave. The knee-jerk reaction by the
government and the Fed would definitely comprise renewed stimulus measures in
order to arrest the downturn, which implies a U-turn in monetary policy. Currently
financial markets are almost exclusively focused on the planned normalization of
monetary policy. Almost no-one seems to expect an impending recession or a
return to loose monetary policy. Over the past 30 years, the Fed has implemented
an increasingly asymmetric monetary policy. The extent of rate cuts routinely
exceeded the extent of rate hikes.
It would be a big surprise, so to speak a black swan, if the response of
the authorities to the next economic downturn were to deviate from
the usual one.
Since the normalization of monetary policy hasn't progressed sufficiently yet,
renewed stimulus measures would probably shake market confidence in the
efficacy and sustainability of the monetary therapies applied to date. Historical
experience indicates that the crumbling of such a deeply ingrained faith is often a
wonder to behold; the best thing that can be said about it is that it will sell
newspapers and raise the ratings of TV news programs. Moreover, the dosage
of said monetary therapies are subject to the law of declining marginal
utility, in other words, the next round of QE would probably have to be
significantly larger than QE3 was. If the markets were to sense that
such a development was likely, the gold price would probably rally
quite dramatically.
Stagflation: A Gray Swan
As discussed above, we currently believe that the probability of a US recession is
significantly higher than is generally assumed. But how would a recession affect
price inflation dynamics?
"In a theater, it happened that a
fire started offstage. The clown
came out to tell the audience.
They thought it was a joke and
applauded. He told them again,
and they became still more
hilarious. This is the way, I
suppose, that the world will be
destroyed – amid the universal
hilarity of wits and wags who
think it is all a joke."
Søren Kierkegaard

„In Gold we Trust“ Report | Compact Version 17
#igwt2017
Contrary to the popular opinion that developed nations are characterized by very
low inflation, enormous monetary inflation has already occurred. Thus, asset
prices have increased to a rather conspicuous extent. It seems more than passing
strange that rising food prices are as a rule regarded as great calamity, while rising
home prices are considered a blessing. Both simply reflect a decrease in
purchasing power; whether it finds expression in home prices or food
prices is not relevant to the fact that purchasing power has been lost.12
A decisive factor likely to determine future price inflation dynamics
will be the response of the US dollar to an economic contraction. In past
recessions, the dollar tended to initially appreciate against most important foreign
currencies. Then the Fed adopted an easy monetary policy and the dollar's external
value decreased again. The extent and persistence of these moves depended also
on the dollar's relative value at the outset of economic downturns, as well as on
other contingent circumstances (such as dollar shortages in the euro-dollar market
and similar market structural or psychological aspects). In that sense, the current
situation differs markedly from that prevailing at the beginning of the last
downturn, as the dollar has already appreciated considerably in recent years.
Persistent further strength in the dollar would be the exception rather than the rule
under these circumstances.
US dollar index: when will the tide turn?
USD Index (30 month change.) Source: FRED, Incrementum AG
Should a US recession strike concurrently with a devaluation in the US dollar,
investors would be faced with a very difficult situation. While in 2008, it was
primarily concerns about liquidity and the fear that “not enough
money would be printed” were dominant (a situation known as a
“deflation scare”), the markets may arrive at a different assessment in
the next downturn. That would be particularly likely if confidence in the Fed's
ability to revive the economy with another round of stimulus measures were to
falter before they are even implemented. As soon as market participants consider
rising price inflation to be a serious possibility, a fundamental shift in general
market sentiment is likely to occur. The currently still prevailing expectation that
— 12 See: "Why Keynesian Economists Don’t Understand Inflation", Frank Hollenbeck, Mises.org
"There seems to be an unstated
assumption that a central bank
that has so far not even been able
to push consumer price inflation
rates up by doing everything to
debase its currency, will
somehow be able to keep price
inflation in check if or when it
finally does rear its head. It
seems more likely to us that a
chimpanzee will one day find the
answers to all unresolved
questions of theoretical physics."
www.acting-man.com
-40%
-30%
-20%
-10%
0%
10%
20%
30%
40%
1975 1979 1983 1986 1990 1994 1998 2002 2006 2009 2013
Strong Dollar
Weak Dollar

„In Gold we Trust“ Report | Compact Version 18
#igwt2017
“if there are problems, central banks will implement further inflationary
measures” would be increasingly questioned if inflation expectations were to rise.
Further Potential Gray Swans
Below we briefly list a number of additional gray swans, which we believe have
strong potential to become relevant at some point.
• A credit crisis in China
• A political crisis in the US in the context of an impeachment of president
Trump
• An escalation of geopolitical tensions in the Middle or Far East
• Hyper-deflation as a result of a global banking or government debt crisis
• An inflationary Boom in the US
• Reorganization of the global monetary order including a (partial)
remonetization of gold
Gray Swans and their possible effect on the gold price
Gray Swan Influence on USD Expected Influence on Gold (in USD)
Expected Influence on inflation
Stagflation Depreciation positive inflationary Credit crisis in China Appreciation positive uncertain
Political crisis in the US Depreciation positive uncertain Geopolitical escalation in the
Middle/ Far east Uncertain positive inflationary
Hyper deflation Appreciation negative deflationary Inflationary boom Depreciation strongly positive inflationary
Reset of global monetary system
Depreciation strongly positive inflationary
Source: Incrementum AG
Mining Shares
When our last gold report was published, the Gold Bugs Index (HUI)
stood at 240 points. After a stunning rally of more than 180% in eight months,
the sector suffered a 61.8% correction of the advance. Since the beginning of the
year, the tide has turned again and the technical picture has clearly brightened.
In the following pages, we will discuss why we believe that the
turnaround last year marked the end of the cyclical bear market and
why the rally in the precious metals sector has probably only just
begun.
A glance at the market capitalization of gold mining companies reveals
a significant valuation discrepancy compared to other asset classes. At
the moment the entire HUI, which includes the 16 largest unhedged gold
producers, is valued at a mere USD 99 bn. This amount represents just 0.4% of the
market capitalization of all S&P 500 Index members. The market capitalization of
Apple alone exceeds that of the 16 companies in the index by 720%. Another
interesting numbers game: One could use the cash hoard of Apple
(AAPL) to purchase the entire Gold Bugs Index 2.5 times over, or
“Sometimes life hits you in the
head with a brick. Don’t lose
faith.”
Steve Jobs
"The idea that China is now the
driving economic power in the
world, I think, is illusory or
somewhat of a fallacy."
Kyle Bass
"The great financial success
stories are people who had cash
to buy at the bottom."
Russell Napier
"The record of fiat currencies
through history, 100%, is
eventual failure. The record of
gold for 5,000 years, 100%, is
lack of failure."
Simon Mikhailovich

„In Gold we Trust“ Report | Compact Version 19
#igwt2017
alternatively buy 6,500 tons of gold. If Apple did the latter, it would be
the second largest gold holder in the world.
Market capitalization of the HUI vs. AAPL, in USD bn.
Source: Bloomberg, Incrementum AG
If one looks at all bull markets in the Barron's Gold Mining Index (BGMI)13, one
notices that the current uptrend is still relatively modest in terms of duration and
performance compared to its predecessors. Should we really be on the cusp of a
pronounced uptrend in the sector – which we assume to be the case – quite a bit of
upside potential would remain.
Bull markets compared: BGMI bull markets since 1942
Source: Nowandfutures, TheDailyGold.com, Barrons, Incrementum AG
Jordan Roy-Byrne, an analyst whom we greatly respect, describes the
sector's status as “bearish bull”. While the fundamentals of the mining sector
stabilized in the 2014-2015-period, early 2016 was the time of the final
capitulation. At the time, precious metals mining stocks exhibited the worst 5 and
10 year rolling performance in 90 years. During the final slump, they fell to an all-
time low relative to the S&P 500 Index, and their price to book ratios stood at the
— 13 The oldest existing gold mining index. Index data can be obtained at www.bgmi.us
"A speculator is a man who
observes the future, and acts
before it occurs."
Bernard Baruch
0
100
200
300
400
500
600
700
800
900
2001 2002 2003 2004 2005 2006 2007 2008 2009 2010 2011 2012 2013 2014 2015 2016 2017
MC
ap (b
illio
ns)
Gold Bugs (HUI) - Market Cap Apple (AAPL) - Market Cap
0%
100%
200%
300%
400%
500%
600%
700%
800%
1 41 81 121 161 201 241 281 321 361 401
Perfo
rman
ce
Number of Weeks
10/1942-02/1946 07/1960-03/1968 12/1971-08/1974
08/1976-10/1980 11/2000-03/2008 10/2008-04/2011
01/2016-05/2017
We are here!

„In Gold we Trust“ Report | Compact Version 20
#igwt2017
lowest level in 40 years (which is as far back as the data go). The chart below also
makes clear that the preceding bear market was an historically unique event.14
Bear markets compared: BGMI bear markets since 1942
Source: Nowandfutures, TheDailyGold.com, Barrons, Incrementum AG
Despite the confidence that we have expressed with respect to gold
miners, a number of factors have to be kept in mind:
• Gold producers were able to lower their production costs in recent
years by implementing comprehensive cost cutting measures. The
decline in energy prices, which traditionally represent a significant share of
mining cash costs, was undoubtedly helpful in this context. Moreover, many
producers have cut their annual exploration budgets drastically. As gold
reserves are steadily depleted through mining, we expect a considerable
acceleration in M&A activity in coming years. We primarily expect to see
takeovers of exploration and development companies in politically stable
regions such as Australia and North America. This assessment was most
recently confirmed by the takeover of Integra Gold by Eldorado Gold.
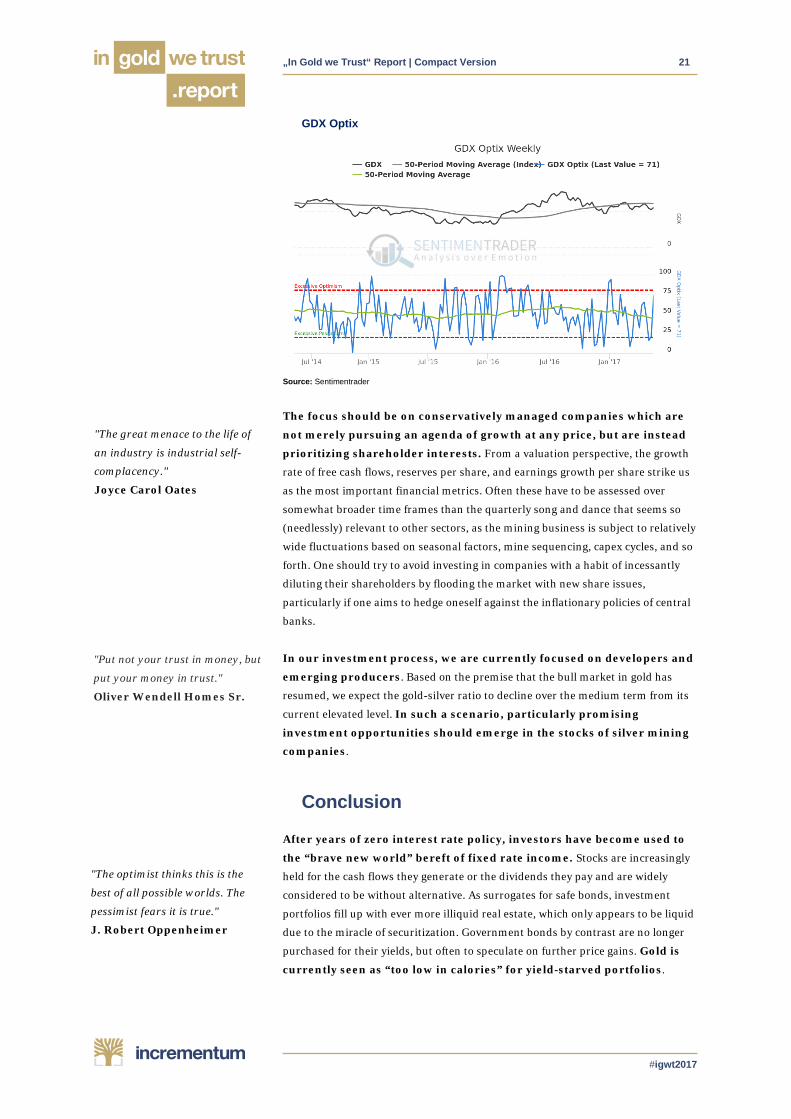
• In the short term, sentiment appears a tad over-optimistic to us. As
the Optix (optimism index, a mixture of a variety of sentiment and positioning
data) shown below indicates, sentiment in the GDX ETF is approaching
excessive optimism territory. In line with the seasonal pattern in mining
shares, a correction in the summer months may well provide a favorable entry
point.
— 14 See “The Bearish Bull”, Jordan Roy-Byrne, TheDailyGold.com
0%
20%
40%
60%
80%
100%
1 41 81 121 161 201 241
Per
form
ance
Number of Weeks
08.1974 - 08.1976 03.1968 - 12.1969
02. - 11.2008 01.1996 - 10.2000
10.1980 - 06.1982 01.1983 - 11.1986
03.1939 - 04.1942 04.2011 - 01.2016
„In Gold we Trust“ Report | Compact Version 21
#igwt2017
GDX Optix
Source: Sentimentrader
The focus should be on conservatively managed companies which are
not merely pursuing an agenda of growth at any price, but are instead
prioritizing shareholder interests. From a valuation perspective, the growth
rate of free cash flows, reserves per share, and earnings growth per share strike us
as the most important financial metrics. Often these have to be assessed over
somewhat broader time frames than the quarterly song and dance that seems so
(needlessly) relevant to other sectors, as the mining business is subject to relatively
wide fluctuations based on seasonal factors, mine sequencing, capex cycles, and so
forth. One should try to avoid investing in companies with a habit of incessantly
diluting their shareholders by flooding the market with new share issues,
particularly if one aims to hedge oneself against the inflationary policies of central
banks.
In our investment process, we are currently focused on developers and
emerging producers. Based on the premise that the bull market in gold has
resumed, we expect the gold-silver ratio to decline over the medium term from its
current elevated level. In such a scenario, particularly promising
investment opportunities should emerge in the stocks of silver mining
companies.
Conclusion
After years of zero interest rate policy, investors have become used to
the “brave new world” bereft of fixed rate income. Stocks are increasingly
held for the cash flows they generate or the dividends they pay and are widely
considered to be without alternative. As surrogates for safe bonds, investment
portfolios fill up with ever more illiquid real estate, which only appears to be liquid
due to the miracle of securitization. Government bonds by contrast are no longer
purchased for their yields, but often to speculate on further price gains. Gold is
currently seen as “too low in calories” for yield-starved portfolios.
"The great menace to the life of
an industry is industrial self-
complacency."
Joyce Carol Oates
"Put not your trust in money, but
put your money in trust."
Oliver Wendell Homes Sr.
"The optimist thinks this is the
best of all possible worlds. The
pessimist fears it is true."
J. Robert Oppenheimer

„In Gold we Trust“ Report | Compact Version 22
#igwt2017
Superficially, the current situation in financial markets appears
promising. According to the narrative propagated by the Federal Reserve, the
recovery of the economy is steadily progressing. New record
highs in stock market indexes and the decline in unemployment
rates to pre-crisis levels serve as evidence for the success of
current economic policy. After an extended period of extreme
monetary policy interventionism, the long-promised
normalization is underway. Calm has returned to China, which
was seen as the economic "problem child" in recent years and
not too long ago caused quite a bit of concern. Even in crisis-
ridden Europe the political and economic all-clear seem to be in
the air at present. Based on this picture, the prospects for
financial markets appear good and low risk aversion is held to be justified.
We believe this perception, which is reflected in market prices and
valuations, is incomplete and highly inconsistent. Most market
participants seem to be dismissive of the fact that asset prices have become
egregiously overvalued for the third time in less than two decades.
Moreover, many investors appear to disregard the negative
effects of rate hikes on the business cycle and they ignore that
the US consumer debt has once again reached new record
highs. Positioning seems to be based on the implicit
assumption that the current US economic expansion will
become the longest in history. Most ironic is probably the fact
that they are de facto celebrating the political fall-out
produced by years of misguided economic policies: the
election of probably the most unpredictable US president of all
time - Donald J. Trump.
It may appear as though our evaluation of the economic situation is
diametrically opposed to the prevailing consensus. One might well think
that we are all alone with such a contrarian perspective. Up to a point that may be
true, but in our experience, we are not quite as alone with our views as the current
levels of asset prices may suggest. A growing number of our readers are
institutional investors who share our concerns. Paradoxically, it is precisely the
recent surge in asset prices that has goaded many of them into continuing to ride
the financial market merry-go-round, even if their heads are spinning by now. A
certain type of fear is currently rife: the fear of missing out. Many skeptics remain
on the dance floor – even if they remain close to the exit. This raises the
question whether the exit will be big enough to accommodate all of
them.
One of the reasons why we are convinced that turmoil in financial markets is
highly likely to strike in the not-too-distant future, is the insight that the current
monetary system is not sustainable. Its design inherently results in a continuous
increase in overall debt levels, which have grown at a faster pace than economic
output for decades. Over-indebtedness makes the creation of additional wealth
increasingly hard, and the economy becomes ever more crisis-prone as a result.
"There’s no harm in hoping for
the best as long as you are
prepared for the worst."
Stephen King
"Never underestimate the power
of stupid people in large groups."
George Carlin
"Societal scale increases.
Instability grows exponentially.
Complexity breeds complexity."
Jim Rickards
Source: Hedgeye

„In Gold we Trust“ Report | Compact Version 23
#igwt2017
The higher the levels of outstanding debt, the greater their interest rate sensitivity
– we have been stuck in a zero interest rate trap for quite some time already.
Although the symptoms are obvious to almost everyone, there was to date no
broad public debate whatsoever regarding the need for fundamental reform of the
monetary system or the international monetary order.
Whether one fully agrees with our critical assessment of the system is
one thing; the question of whether one should hold an appropriate
share of one's liquid wealth in the form of a “golden insurance reserve”
is a different kettle of fish entirely. In order to make up one's mind regarding
this point, it may be helpful to ask oneself a few simple questions, such as:
When will I not need any gold in my portfolio?
When...
• debt levels can be sustained or can be credibly reduced
• the threat of inflation is negligible
• real interest rates are high
• confidence in the monetary authority is (justifiably) strong
• the political environment is steady and predictable
• the geopolitical situation is stable
• governments deregulate markets, simplify tax regulations and
respect civil liberties
In our opinion, the current environment speaks for itself: purchasing gold as a
hedge should be the order of the day for prudent investors.
Where will the gold price go next?
Two years ago, we made a quite audacious forecast, calling for gold to reach a price
target of USD 2,300 by June 2018. At the current juncture that appears unlikely to
happen. Nevertheless, the long term chart suggests that gold has pulled out of its
rut. We continue to believe that the second phase of its secular bull market still lies
ahead. There are numerous reasons for this:
1. The next US recession inevitably approaches - only the precise timing is
open to question. It is not only certain that another recession will come, it is just as
certain how central banks will respond to it: by switching back to (or intensifying)
expansionary monetary policy, by implementing rate cuts, renewed rounds of
quantitative easing, and quite possibly some form of “helicopter money” program.
Should the next recession already begin before the process of policy normalization
is finalized, confidence in the measures implemented to date could well crumble to
disastrous effect. The following two criteria can be used to judge whether the Fed's
monetary policy normalization effort can be considered a success:
- positive real interest rates in a range from 1 to 2 percent are established.
Based on the Fed's consumer price inflation objective of 2%, this implies
that nominal interest rates should increase to around 3.5%.
"Our winnings will
come…from the people who
wake up one morning to find
their savings have been
devalued or bailed-in…It’s
going to come from the
pension funds of teachers and
firefighters. The irony
is that when gold finally pays
off, it will not be a cause for
celebration."
Brent Johnson
Source: Hedgeye
„In Gold we Trust“ Report | Compact Version 24
#igwt2017
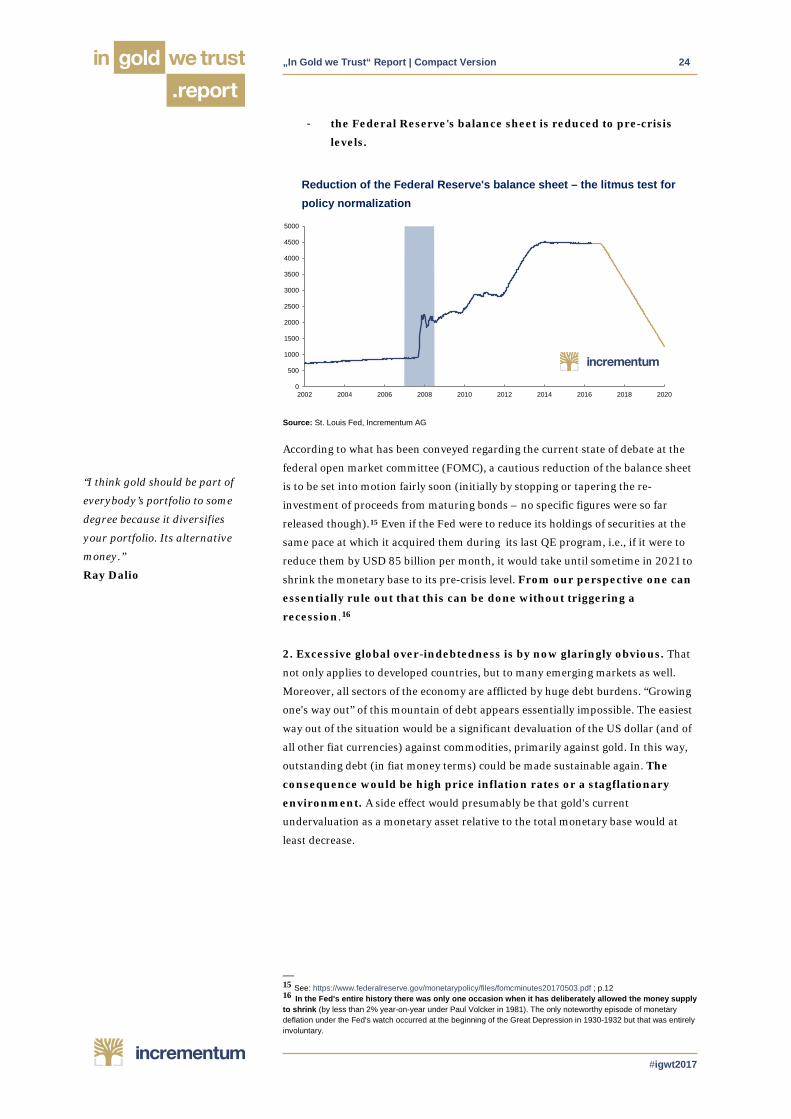
- the Federal Reserve's balance sheet is reduced to pre-crisis
levels.
Reduction of the Federal Reserve's balance sheet – the litmus test for policy normalization
Source: St. Louis Fed, Incrementum AG
According to what has been conveyed regarding the current state of debate at the
federal open market committee (FOMC), a cautious reduction of the balance sheet
is to be set into motion fairly soon (initially by stopping or tapering the re-
investment of proceeds from maturing bonds – no specific figures were so far
released though).15 Even if the Fed were to reduce its holdings of securities at the
same pace at which it acquired them during its last QE program, i.e., if it were to
reduce them by USD 85 billion per month, it would take until sometime in 2021 to
shrink the monetary base to its pre-crisis level. From our perspective one can
essentially rule out that this can be done without triggering a
recession.16
2. Excessive global over-indebtedness is by now glaringly obvious. That
not only applies to developed countries, but to many emerging markets as well.
Moreover, all sectors of the economy are afflicted by huge debt burdens. “Growing
one's way out” of this mountain of debt appears essentially impossible. The easiest
way out of the situation would be a significant devaluation of the US dollar (and of
all other fiat currencies) against commodities, primarily against gold. In this way,
outstanding debt (in fiat money terms) could be made sustainable again. The
consequence would be high price inflation rates or a stagflationary
environment. A side effect would presumably be that gold's current
undervaluation as a monetary asset relative to the total monetary base would at
least decrease.
— 15 See: https://www.federalreserve.gov/monetarypolicy/files/fomcminutes20170503.pdf ; p.12 16 In the Fed's entire history there was only one occasion when it has deliberately allowed the money supply to shrink (by less than 2% year-on-year under Paul Volcker in 1981). The only noteworthy episode of monetary deflation under the Fed's watch occurred at the beginning of the Great Depression in 1930-1932 but that was entirely involuntary.
0
0,2
0,4
0,6
0,8
1
0
500
1000
1500
2000
2500
3000
3500
4000
4500
5000
2002 2004 2006 2008 2010 2012 2014 2016 2018 2020
“I think gold should be part of
everybody’s portfolio to some
degree because it diversifies
your portfolio. Its alternative
money.”
Ray Dalio

„In Gold we Trust“ Report | Compact Version 25
#igwt2017
US monetary base vs. US gold reserves at market prices (log scale)
Source: Incrementum AG, St. Louis Fed
Since the end of the classical gold standard, parity between the US monetary base
and US gold reserves was already restored on two occasions by an upward
revaluation of gold (in the mid 1930s and in the late 1970s). Whether a potential
dollar devaluation will happen in the framework of an international agreement or
in an uncoordinated manner remains to be seen.
3. De-dollarization has begun. We regard this process as an uncoordinated
form of dollar devaluation. Its main symptom is a gradual reduction of the US
dollar's importance as a global reserve currency. If central banks want to hold a
monetary asset that is liquid, stateless and above all requires no counterparty, it is
not debt securities denominated in other fiat currencies, but gold that represents
the only real alternative. That should become particularly obvious if or when the
currently still preferred foreign exchange reserves are devalued as the associated
securities held in central bank portfolios suffer price declines, and central banks
come under political pressure.
4. Occurrence of a “black or gray swan” event. Numerous potential
financial shocks can be envisaged in the current environment. Regardless of
whether such a shock is triggered by geopolitical tensions boiling over, or by
negative economic developments – an appropriate allocation to gold will mitigate
the negative performance of assets that typically generate large losses in the wake
of such events.
5. Based on our analysis of market structure, sentiment and price
patterns, our assessment is that the medium to long term technical
picture looks promising. Speculative positions in futures markets have
corrected sufficiently to create a healthy basis for the advance to resume. The
Coppock curve gave a long term buy signal in late 2015, while sentiment data
indicate that skepticism in the market remains quite pronounced. We expect only
little upside momentum in the short term though, primarily based on seasonality,
1
10
100
1000
10000
1918 1928 1938 1948 1958 1968 1978 1988 1998 2008
US Gold Reserves @ Market Prices US Monetary Base

„In Gold we Trust“ Report | Compact Version 26
#igwt2017
but also due to a number of signals from technical indicators that remain in
bearish territory.
Of course, the future is always uncertain, hence we want to present several
scenarios outlining potential future gold price developments. The US dollar's
status as the senior global reserve currency remains (for now) a constant that is
underlying all of them. That is also why we believe that economic developments in
the US remain crucial for the price trend of gold. Since financial markets have
fundamentally reassessed what the coming years are likely to bring in the wake of
the US presidential election, we align the time-line of our scenarios with the
Trump administration's term of office, which should last until early 2021. From
our perspective, the decisive factors for the gold price will be the
momentum of GDP growth, as well as the further progress made in
terms of the Fed's monetary policy normalization effort.
Scenario A: “Relatively strong real economic growth”
The proposed economic policy initiatives are implemented and take hold, the US
economy begins to grow strongly (>3% p.a.) and price inflation remains in an
acceptable range (<3%). Monetary policy normalization succeeds. The central
bank's “experiment” pays off.
The gold price should trade in a range from USD 700 to USD 1,000
Scenario B: “Muddling through continues”
Real US GDP growth and consumer price inflation remain in a range of 1-3% p.a.
In this case we would not expect the gold price to enter into the second phase of
the secular bull market we currently anticipate.
The gold price should remain in a range from USD 1,000 to USD 1,400
in this scenario.
Scenario C: “High inflationary growth”
Trump's economic policy initiatives are put into place, a large infrastructure
spending program is launched, US economic growth accelerates significantly (>3%
p.a.), but so does the consumer price inflation rate (>3%). Monetary policy
normalization succeeds only partially, as real interest rates remain very low or
even negative, due to the elevated consumer price inflation rate.
In this scenario, the gold price should trade in a range from around
USD 1,400 to USD 2,300.
Scenario D: One of the four events listed in the table below occurs. Recession,
stagflation and/or significant weakness in the US dollar push the gold price up
noticeably. In the wake of another US recession and the cessation of the monetary
policy normalization effort, significant changes to the global monetary order
cannot be ruled out. A very large gold price rally has to be expected in such an
environment.
Gold prices between USD 1,800 up to USD 5,000 appear possible in
this scenario.
"There are three key biases in
financial forecasting. Economists
never forecast recessions, equity
strategists are always bullish,
and bond strategists are always
bearish." Albert Edwards

„In Gold we Trust“ Report | Compact Version 27
#igwt2017
Term is characterized by Growth Monetary Normalisation Gold price in USD
Scenario A: Genuine Boom
Real growth > 3% p.a.
Successful; Real Interest Rates
>1.5%
700-1,000
Scenario B: Muddling Through
Growth & Inflation 1.5-3% p.a.
not completed 1,000-1,400
Scenario C: Inflationary Boom
Growth & Inflation > 3% p.a.
not completed 1,400-2,300
Scenario D: Adverse Scenario
Growth / Contraction
<1.5%
Normalization paused or renewed
easing
1,800-5,000
Source: Incrementum AG
Given the analyses presented in this year's In Gold We Trust report, it shouldn't be
too big a surprise that we assign the highest probability to the latter two scenarios.
Similar to the 1930s and the 1970s, these scenarios would be difficult to navigate,
but at the same time provide quite interesting investment opportunities. The
product range of Incrementum includes strategies that are specifically
tailored to these scenarios.
If the bull market in precious metals continues, the performance of
mining stocks will be decidedly positive. Investors should continue to place
their bets with conservatively managed companies in the sector, which rather than
pursuing a “growth at any price” agenda are focused on delivering strong returns to
shareholders. From a valuation perspective, growth in free cash flows, gold
reserves/resources per share, and earnings growth per share strike us as the most
important metrics.
This is a sector in which one must be particularly careful to avoid getting diluted by
a flood of share issuance. The sector's small size in terms of total market
capitalization is both a blessing and a curse. A blessing because outsized
price gains can be achieved in boom times, and a curse because the flood of money
flowing into the sector during bull markets invariably tempts managers of gold and
silver mining companies to misallocate capital as they are constantly under
pressure to “do something”. This danger is usually particularly pronounced in the
late stages of bull markets, once everyone's memories of the hardships of the bust
period of the cycle have faded. In our investment process, we are currently
focused on developers and emerging producers. Based on the premise that
the bull market in gold has resumed, we expect the gold-silver ratio to decline over
the medium term. In this scenario, pure play silver mining stocks should
offer particularly interesting investment opportunities.
In summary, we expect to see significant upheaval in coming years,
with noticeable effects on the gold price. We will monitor events very
carefully and provide commentary on a regular basis.
www.ingoldwetrust.report
"Gold is a currency. It always
has been. It always will be." Brent Johnson
"Let us not look back in anger,
nor forward in fear, but around
in awareness."
James Thurber
"Security... it's simply the
recognition that changes will
take place and the knowledge
that you're willing to deal with
whatever happens."
Harry Browne
"Whether it’s the best of times or
the worst of times, it’s the only
time we’ve got." Art Buchwald

„In Gold we Trust“ Report | Compact Version 28
#igwt2017
Ronald-Peter Stöferle, CMT
Ronni is partner of Incrementum AG and responsible for Research and Portfolio Management.
He studied Business Administration and Finance in the USA and at the Vienna University of
Economics and Business Administration, and also gained work experience at the trading desk of a
bank during his studies. Upon graduation he joined the Research department of Erste Group,
where he published his first “In Gold We Trust” report in 2007. Over the years, the Gold Report has
proceeded to become one of the benchmark publications on gold, money, and inflation.
Since 2013 he has held the position as reader at scholarium in Vienna, and he also speaks at
Wiener Börse Akademie (i.e. the Vienna Stock Exchange Academy). In 2014, he co-authored the
book “Austrian School for Investors” and in 2017 “Die Nullzinsfalle” (The Zero Interest Rate Trap).
Moreover, he is an advisor for Tudor Gold Corp. (TUD), a significant explorer in British Columbia’s
Golden Triangle.
Mark J. Valek, CAIA
Mark is partner of Incrementum AG and responsible for Portfolio Management and Research.
While working full time, Mark studied Business Administration at the Vienna University of
Business Administration and has continuously worked in financial markets and asset
management since 1999. Prior to the establishment of Incrementum AG, he was with Raiffeisen
Capital Management for ten years, most recently as fund manager in the area of inflation
protection and alternative investments. He gained entrepreneurial experience as co-founder of
Philoro Edelmetalle GmbH.
Since 2013 he has held the position as reader at scholarium in Vienna, and he also speaks at
Wiener Börse Akademie (i.e. the Vienna Stock Exchange Academy). In 2014, he co-authored the
book “Austrian School for Investors” and in 2017 “Die Nullzinsfalle” (The Zero Interest Rate Trap).
Incrementum AG
Incrementum AG is an independent investment and asset management company based in Liechtenstein.
Independence and self-reliance are the cornerstones of our philosophy, which is why the four managing partners own
100% of the company. Prior to setting up Incrementum, we all worked in the investment and finance industry for years
in places like Frankfurt, Madrid, Toronto, Geneva, Zurich, and Vienna. We are very concerned about the economic
developments in recent years especially with respect to the global rise in debt and extreme monetary measures taken by
central banks. We are reluctant to believe that the basis of today’s economy, i.e. the uncovered credit money system, is
sustainable. This means that particularly when it comes to investments, acting parties should look beyond the horizon of
the current monetary system. We want to re-think investment strategies and implement them in a way that is in line with
today’s requirements.
About Us

„In Gold we Trust“ Report | Compact Version 29
#igwt2017
We sincerely want to thank the following friends for their outstanding support:
Marc Waldhausen, Tobias Müller, Sebastian Müller, Nikolaus Jilch, Demelza Hays, Yannick Möhring, Lars Haugen, Bawerk.net, Philip Barton, Brent Johnson, Florian Grummes, Katja
Stöferle, Markus Blaschzok, Thomas Vesely, Carsten Ringler, Georg Bühler, Gregor Hochreiter, Nikolaus Jilch, Atle Willems, Hans Fredrik Hansen, Pascal Hügli, Luis Enrique, David Holzinger,
Markus Rossmiller, Pater Tenebrarum, Veronika Svihalkova and Florian Hulan.
Contact:
Incrementum AG Im Alten Riet 102 9494 – Schaan/Liechtenstein
www.incrementum.li
www.ingoldwetrust.li
Email: [email protected]
Disclaimer: This publication is for information purposes only, and represents neither investment advice, nor an investment analysis or an invitation to buy or sell financial instruments. Specifically, the document does not serve as a substitute for individual investment or other advice. The statements contained in this publication are based on the knowledge as of the time of preparation and are subject to change at any time without further notice. The authors have exercised the greatest possible care in the selection of the information sources employed, however, they do not accept any responsibility (and neither does Incrementum AG) for the correctness, completeness or timeliness of the information, respectively the information sources, made available, as well as any liabilities or damages, irrespective of their nature, that may result there from (including consequential or indirect damages, loss of prospective profits or the accuracy of prepared forecasts). Copyright: 2017 Incrementum AG. All rights reserved.