key china energy statistics 2014 china energy statistics 2014 china energy group lawrence berkeley...
TRANSCRIPT

China Energy Group
KEY CHINA ENERGY STATISTICS
2014
Lawrence BerkeleyNational Laboratory


KEY CHINA ENERGY STATISTICS
2014
China Energy Group
Lawrence BerkeleyNational Laboratory

ii
The Lawrence Berkeley National Laboratory China Energy Group
The China Energy Group at Lawrence Berkeley National Laboratory (LBNL) was established in 1988. Over the years, the Group has gained recognition as an authoritative source of China energy statistics through the publication of its China Energy Databook (CED). To date, the Group has published eight editions of the CED (http://china.lbl.gov/research-projects/china-energy-databook). This handbook summarizes key statistics from the CED and is expressly modeled on the International Energy Agency’s Key World Energy Statistics series of publications. The handbook contains timely, clearly pre-sented data on the supply, transformation, and consumption of all major energy sources in China.
Gathering and analyzing data is one important function of LBNL's China Energy Group. The mission of the Group, located within the Environmental Energy Technologies Division of LBNL, is to:
Working collaboratively with groups in China and elsewhere to understand the dynamics of energy use, improve energy efficiency, and reduce emissions in China;
Strengthen Chinese capabilities in energy efficiency;
Enhance relationships on energy efficiency among Chinese, U.S., and international institutions.
Major achievements of the China Energy Group include:
• Introduced appliance energy efficiency standards to China
• Initiated pilot policy programs that led to the Top 1,000 (now Top 10,000) Enterprises Program
• Analyzed long-term energy demand in China to 2020, 2030, and 2050
• Played a key role in creating the Beijing Energy Efficiency Center and the Energy Foundation China Program
• Leads the US-China Clean Energy Research Center — Building Energy Efficiency
• Hosted more than 100 visiting researchers from China
iii
Disclaimer
This document was prepared as an account of work sponsored by the United States Government. While this document is believed to contain correct information, neither the United States Government nor any agency thereof, nor The Regents of the University of California, nor any of their employees, makes any warranty, express or implied, or assumes any legal responsibility for the accuracy, completeness, or usefulness of any information, apparatus, product, or process disclosed, or represents that its use would not infringe privately owned rights. Reference herein to any specific commercial product, process, or service by its trade name, trademark, manufacturer, or otherwise, does not necessarily constitute or imply its endorsement, recommendation, or favoring by the United States Government or any agency thereof, or The Regents of the University of California. The views and opinions of authors expressed herein do not necessarily state or reflect those of the United States Government or any agency thereof, or The Regents of the University of California.
Lawrence Berkeley National Laboratory is an equal opportunity employer.

iv
Table of Contents
Supply 1
Transformation 14
Consumption 19
Prices 28
Emissions 36
Economic & Demographic Indicators 39
International Comparisons 42
Appendices
Table of Abbreviations 47
Glossary 48
Conversion Factors 50
Energy Balances (2012) in Standard Units 51
Energy Balances (2012) in Physical Units 58
Data Sources 65
Acknowledgements 67

1
Supply

2
Maps of China
Map of China

3
2012 Highlights *
• China accounted for 20% of global energy consumption.
• Energy grew 51% percent as fast as GDP.
• China accounted for more than 20% of global energy-related CO2 emissions.
• China’s per capita CO2 emissions were 6 tonnes/person, 32% percent above the world average but 65% below that of the United States.
• China accounted for a staggering 47 percent of total world coal consumption.
• In contrast, oil consumption was 11 percent of world demand and natural gas, 4 percent.
• Since 2000, natural gas consumption grew at a rate of 15 percent per year.
• China’s Western region continues to be the dominant source of increased production of oil and natural gas.
• China built 88 GW of power plants, of which about 60 percent were coal-based. To date, about 35% of all global coal-fired power generation capacity has been built in China.
• China built 14.6 GW of wind power, accounting for about 32% percent of world capacity additions.
• China installed 1.1 GW of solar power, 4% percent of world capacity additions.
• Imports of natural gas jumped 40% to 63 billion cubic meters (including a 50% increase in pipeline gas from Central Asia), crude oil imports rose 7% to 5.4 million barrels/day, and coal imports rose 29% to 234 million tonnes.
* All data are for 2012 unless otherwise noted.

4
China's Total Primary Energy Production by Source Shares (1950-2012)
China's Total Primary Energy Production by Source (1950-2012)
China's Total Primary Energy Production by Source (1950-‐2012)
China's Total Primary Energy Production by Source Shares (1950-‐2012)
0
20
40
60
80
100
-‐
500
1,000
1,500
2,000
2,500
3,000
3,500
1950 1955 1960 1965 1970 1975 1980 1985 1990 1995 2000 2005 2010
Coal Oil Natural Gas Nuclear Hydro Wind Other Renewables
Mtce E J
0%
10%
20%
30%
40%
50%
60%
70%
80%
90%
100%
1950 1955 1960 1965 1970 1975 1980 1985 1990 1995 2000 2005 2010
Coal Oil Natural Gas Nuclear Hydro Wind Other Renewables
Mtce
AAGR1980-‐2001 4%2001-‐2006 10%2006-‐2012 6%

5
China's Total Primary Energy Production (1985-2012)
China's Total Coal Production (1985-2012)
China's Total Primary Energy Production (1985-‐2012)
China's Total Coal Production (1985-‐2012)
0
10
20
30
40
50
60
70
80
90
100
-‐
500
1,000
1,500
2,000
2,500
3,000
3,500
1950 1955 1960 1965 1970 1975 1980 1985 1990 1995 2000 2005 2010
E J
Mtce
-‐
500
1,000
1,500
2,000
2,500
3,000
-‐
500
1,000
1,500
2,000
2,500
3,000
3,500
4,000
1950 1955 1960 1965 1970 1975 1980 1985 1990 1995 2000 2005 2010
Mt
Mtce
AAGR1950-‐1985 10%1985-‐2001 3%2001-‐2006 10%2006-‐2012 6%
AAGR1950-‐1985 9%1985-‐2001 3%2001-‐2006 11%2006-‐2012 6%

6
China's Coal Export (2012)
Coal Producing Provinces in China (2012)
Coal Producing Provinces in China (2012)
China's Coal Export (2012)
25%
22%
11%
4%
4%
4%
4%
4%
3% 2%
17%
Inner Mongolia
Shanxi Shaanxi Guizhou 9Shandong
Henan 9Xinjiang
Anhui Hebei Yunnan All other provinces
Total Coal Produc=on: 4,160 Mt
44%#
40%#
14%#
2%#
0%#
Japan##
South#Korea##
Other#Asia##
North#Korea##
Myanmar##
Total&Coal&Export:&9.26&Mt&
49%$
11%$
9%$
3.2%$
3.2%$
2.4%$
2.4%$
1.8%$
1.7%$
1.6%$
1.3%$
1.2%$0.9%$
12%$China$
United$States$$
India$$
Russia$
Germany$
South$Africa$
Japan$$
Australia$
Poland$
South$Korea$$
Turkey$$
Kazakhstan$
Ukraine$
Other$Total&World&Coal&Consump0on:&7.7&Gt&Total&China&Coal&Consump0on:&3.8&Gt&&

7
China's Coal Import (2012)
World Coal Consumption (2012)
China's Coal Import (2012)
World Coal Consumption (2012)
29%$
25%$
9%$
9%$8%$
6%$
5%$
4%$
4%$1%$
0%$
0%$
Indonesia$
Australia$
Mongolia$
Russia$
Vietnam$
South$Africa$$
North$Korea$$
USA$
Canada$
Colombia$$
New$Zealand$$
Other$
Total&Coal&Import:&234.28&Mt&
49%$
11%$
9%$
3.2%$
3.2%$
2.4%$
2.4%$
1.8%$
1.7%$
1.6%$
1.3%$
1.2%$0.9%$
12%$China$
United$States$$
India$$
Russia$
Germany$
South$Africa$
Japan$$
Australia$
Poland$
South$Korea$$
Turkey$$
Kazakhstan$
Ukraine$
Other$Total&World&Coal&Consump0on:&7.7&Gt&Total&China&Coal&Consump0on:&3.8&Gt&&

8
China's Crude Oil Production by Regional Shares (1985-2012)
China's Crude Oil Production by Region (1985-2012)
China's Crude Oil Production by Region (1985-‐2012)
Note: The sum of reported provincial production exceeds the official national total. China's Crude Oil Production by Regional Shares (1985-‐2012)
-‐
50
100
150
200
250
300
350
-‐
50
100
150
200
250
1985 1990 1995 2000 2005 2010 East South Central North West
Mtce
Mt
0%
10%
20%
30%
40%
50%
60%
70%
80%
90%
100%
1985 1990 1995 2000 2005 2010
East South Central North West
AAGR1985-‐2001 2%2001-‐2006 3%2006-‐2012 3%
Note: The sum of reported provincial production exceeds the official national total.
Note: The sum of reported provincial production exceeds the official national total.

9
Crude Oil Producing Provinces in China (2012)
China's Crude Oil Export (2012)
China's Crude Oil Producing Provinces in China (2012)
China's Crude Oil Export (2012)
19%$
16%$
14%$13%$
12%$
6%$
5%$
4%$3%$
3%$2%$3%$ Heilongjiang$
Shaanxi$
Tianjin$
Shandong$
Xinjiang$
Guangdong$
Liaoning$
Jilin$
Gansu$
Hebei$
Henan$
All$other$provinces$Total&Crude&Oil&Produc0on:&207&Mt&&
55%#
21%#
8%#
8%#
4%#
2%#
1%#
1%#0%#
Japan##
North#Korea##
USA#
Malaysia##
South#Korea##
Australia##
Thailand##
Singapore##
France##
Total&Crude&Oil&Export:&2.4&Mt&
20%$
15%$
9%$
8%$7%$
6%$
6%$
4%$
4%$
3%$
3%$
2%$
2%$
1%$1%$
1%$
1%$7%$
Saudi$Arabia$$Angola$$Russia$$Iran$$Oman$Iraq$Venezuela$Kazakhstan$Kuwait$United$Arab$Emirates$$Libya$$Brazil$$Congo$$Australia$$Yemen$$Colombia$$Algeria$$Other$$
Total&Crude&Oil&Import:&271&Mt&
21%$
11%$
5%$
4%$4%$
3%$3%$3%$3%$3%$
2%$2%$
2%$2%$
2%$
2%$2%$
28%$
United$States$$
China$$
Japan$$
India$$
Russia$$
Saudi$Arabia$$
Brazil$
Germany$
South$Korea$
Canada$
Mexico$$
France$
Iran$
Indonesia$
United$Kingdom$
Singapore$
Italy$
Other$Total&World&Petroleum&Consump2on:&32,642&Million&Barrels&Total&China&Petroleum&Consump2on:&3,751&Million&Barrels&&

10
World Oil Consumption (2012)
China's Crude Oil Import (2012)
China's Crude Oil Import (2012)
World Oil Consumption (2012)
20%$
15%$
9%$
8%$7%$
6%$
6%$
4%$
4%$
3%$
3%$
2%$
2%$
1%$1%$
1%$
1%$7%$
Saudi$Arabia$$Angola$$Russia$$Iran$$Oman$Iraq$Venezuela$Kazakhstan$Kuwait$United$Arab$Emirates$$Libya$$Brazil$$Congo$$Australia$$Yemen$$Colombia$$Algeria$$Other$$
Total&Crude&Oil&Import:&271&Mt&
21%$
11%$
5%$
4%$4%$
3%$3%$3%$3%$3%$
2%$2%$
2%$2%$
2%$
2%$2%$
28%$
United$States$$
China$$
Japan$$
India$$
Russia$$
Saudi$Arabia$$
Brazil$
Germany$
South$Korea$
Canada$
Mexico$$
France$
Iran$
Indonesia$
United$Kingdom$
Singapore$
Italy$
Other$Total&World&Petroleum&Consump2on:&32,642&Million&Barrels&Total&China&Petroleum&Consump2on:&3,751&Million&Barrels&&
11
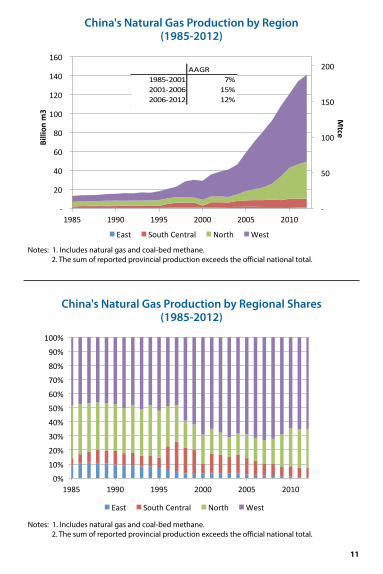
China's Natural Gas Production by Region (1985-2012)
China's Natural Gas Production by Regional Shares (1985-2012)
China's Natural Gas Production by Region (1985-‐2012)
Notes: 1. Includes natural gas and coal-‐bed methane. 2. The sum of reported provincial production exceeds the official national total.
China's Natural Gas Production by Regional Shares (1985-‐2012)
-‐
50
100
150
200
-‐
20
40
60
80
100
120
140
160
1985 1990 1995 2000 2005 2010
East South Central North West
Billion
m3
Mtce
0%
10%
20%
30%
40%
50%
60%
70%
80%
90%
100%
1985 1990 1995 2000 2005 2010
East South Central North West
AAGR1985-‐2001 7%2001-‐2006 15%2006-‐2012 12%
Notes: 1. Includes natural gas and coal-bed methane. 2. The sum of reported provincial production exceeds the official national total.
Notes: 1. Includes natural gas and coal-bed methane. 2. The sum of reported provincial production exceeds the official national total.
12
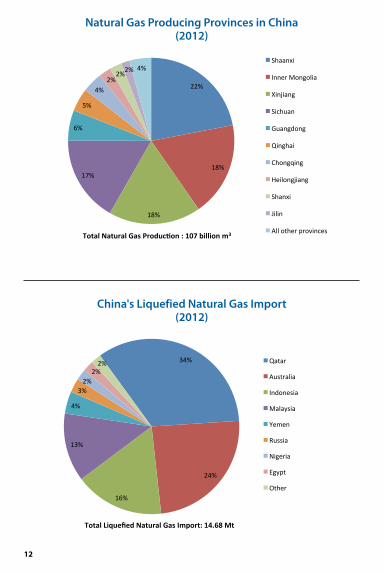
China's Liquefied Natural Gas Import (2012)
Natural Gas Producing Provinces in China (2012)
China's Natural Gas Producing Provinces (2012)
China's Liquefied Natural Gas Import (2012)
22%#
18%#
18%#
17%#
6%#
5%#
4%#2%#
2%#2%#4%#
Shaanxi#
Inner#Mongolia#
Xinjiang#
Sichuan#
Guangdong#
Qinghai#
Chongqing#
Heilongjiang#
Shanxi#
Jilin#
All#other#provinces#Total&Natural&Gas&Produc/on&:&107&billion&m3&
34%$
24%$
16%$
13%$
4%$
3%$2%$
2%$2%$ Qatar$
Australia$$
Indonesia$
Malaysia$
Yemen$
Russia$$
Nigeria$$
Egypt$
Other$$
Total&Liquefied&Natural&Gas&Import:&14.68&Mt&

13
World Natural Gas Consumption (2012)
World Natural Gas Consumption (2012)
21%$
13%$
5%$
4%$4%$3%$3%$3%$
2%$2%$
2%$2%$
2%$2%$
2%$2%$
30%$
United$States$
Russia$$
Iran$
China$$
Japan$$
Saudi$Arabia$$
Germany$$
Canada$$
Italy$$
United$Kingdom$$
Mexico$
United$Arab$Emirates$$
India$$
Egypt$
Uzbekistan$
Ukraine$$
Other$$
Total&World&Natural&Gas&Consump2on:&3,399&billion&m3&
Total&China&Natural&Gas&Consump2on:&147&billion&m3&

Transformation
14

15
Transformation
China's Electricity Production by Fuel Source (1980-2012)
China's Electricity Production by Source Shares (1980-2012)
China's Electricity Production by Fuel Source (1980-‐2012)
Notes: 1. Natural gas includes LNG. 2. Other renewables include solar, biomass, geothermal, and tidal.
China's Electricity Production by Source Shares (1980-‐2012)
Notes: 1. Natural gas includes LNG. 2. Other renewables include solar, biomass, geothermal, and tidal.
-‐
500
1,000
1,500
2,000
2,500
3,000
3,500
1980 1985 1990 1995 2000 2005 2010
Coal Oil Natural Gas Hydro Nuclear Wind Other Renewables
TWh
0%
10%
20%
30%
40%
50%
60%
70%
80%
90%
100%
1980 1985 1990 1995 2000 2005 2010
Coal Oil Natural Gas Hydro Nuclear Wind Other Renewables
Notes: 1. Natural gas includes LNG. 2. Other renewables include solar, biomass, geothermal, and tidal.
Notes: 1. Natural gas includes LNG. 2. Other renewables include solar, biomass, geothermal, and tidal.

16
China's Primary Electricity Production by Regional Shares (1985-2012)
China's Primary Electricity Generation by Region (1985-2012)
China's Primary Electricity Generation by Region (1985-‐2012)
Note: Primary electricity includes nuclear, hydro, wind, solar, and other renewables. China's Primary Electricity Production by Regional Shares (1985-‐2012)
-‐
200
400
600
800
1,000
1,200
1985 1990 1995 2000 2005 2010 West North South Central East
TWh
0%
10%
20%
30%
40%
50%
60%
70%
80%
90%
100%
1985 1990 1995 2000 2005 2010
West North South Central East
AAGR1985-‐2001 7%2001-‐2006 11%2006-‐2012 15%
Note: Primary electricity includes nuclear, hydro, wind, solar, and other renewables.
Note: Primary electricity includes nuclear, hydro, wind, solar, and other renewables.

17
Top 10 Primary Electricity Producing Provinces (2012)
Region Province TWh % of Total
West Sichuan 155 15%
South Central Hubei 138 13%
West Yunnan 127 12%
South Central Guangdong 70 7%
East Zhejiang 57 5%
South Central Hunan 57 5%
West Guizhou 54 5%
South Central Guangxi 53 5%
East Fujian 50 5%
West Qinghai 47 4%
Top 10 Total 808 76%
Other 254 24%
Total 1,062 100%
18
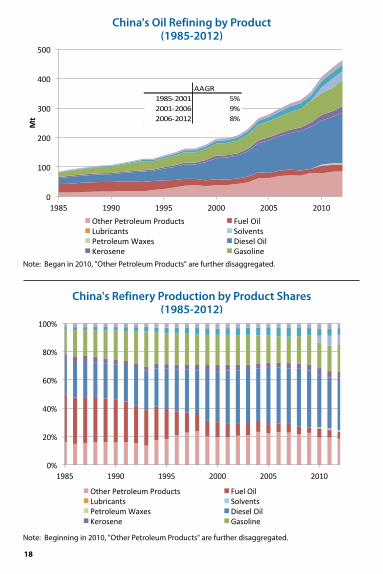
China's Refinery Production by Product Shares (1985-2012)
China's Oil Refining by Product (1985-2012) China's Oil Refining by Product (1985-‐2012)
Note: Began in 2010, "Other Petroleum Products" are further disaggregated.China's Refinery Production by Product Shares (1985-‐2012)
0
100
200
300
400
500
1985 1990 1995 2000 2005 2010 Other Petroleum Products Fuel Oil Lubricants Solvents Petroleum Waxes Diesel Oil Kerosene Gasoline
Mt
0%
20%
40%
60%
80%
100%
1985 1990 1995 2000 2005 2010
Other Petroleum Products Fuel Oil Lubricants Solvents Petroleum Waxes Diesel Oil Kerosene Gasoline
AAGR 1985-‐2001 5%2001-‐2006 9%2006-‐2012 8%
China's Oil Refining by Product (1985-‐2012)
Note: Began in 2010, "Other Petroleum Products" are further disaggregated.China's Refinery Production by Product Shares (1985-‐2012)
0
100
200
300
400
500
1985 1990 1995 2000 2005 2010 Other Petroleum Products Fuel Oil Lubricants Solvents Petroleum Waxes Diesel Oil Kerosene Gasoline
Mt
0%
20%
40%
60%
80%
100%
1985 1990 1995 2000 2005 2010
Other Petroleum Products Fuel Oil Lubricants Solvents Petroleum Waxes Diesel Oil Kerosene Gasoline
AAGR 1985-‐2001 5%2001-‐2006 9%2006-‐2012 8%
Note: Beginning in 2010, "Other Petroleum Products" are further disaggregated.
Note: Began in 2010, "Other Petroleum Products" are further disaggregated.

Consumption
19

20
China's Total Primary Energy Consumption by Source Shares (1985-2012)
China's Total Primary Energy Consumption by Source (1980-2012)
China's Total Primary Energy Consumption by Source (1980-‐2012)
Note: Natural gas includes LNG. Renewable electricity is converted at its calorific value (1 kWh = 0.1229 kgce).
China's Total Primary Energy Consumption by Source Shares (1985-‐2012)
-‐
500
1,000
1,500
2,000
2,500
3,000
3,500
4,000
1980 1985 1990 1995 2000 2005 2010
Coal Oil Natural Gas Hydro Nuclear Wind Other Renewables
Mtce
0%
10%
20%
30%
40%
50%
60%
70%
80%
90%
100%
1980 1985 1990 1995 2000 2005 2010
Coal Oil Natural Gas Hydro Nuclear Wind Other Renewables
AAGR1980-‐2001 4%2001-‐2006 12%2006-‐2012 7%
Note: Natural gas includes LNG. Primary electricity is converted at its calorific value (1 kWh = 0.1229 kgce).
Note: Natural gas includes LNG. Primary electricity is converted at its calorific value (1 kWh = 0.1229 kgce).

21
China's Total Energy Consumption by Regional Shares (1995-2012)
China's Total Energy Consumption by Region (1995-2012)
China's Total Energy Consumption by Region (1995-‐2012)
China's Total Energy Consumption by Regional Shares (1995-‐2012)
-‐
500
1,000
1,500
2,000
2,500
3,000
3,500
4,000
1995 2000 2005 2010 East South Central North West
Mtce
0%
10%
20%
30%
40%
50%
60%
70%
80%
90%
100%
1995 2000 2005 2010
East South Central North West

22
China's Energy Consumption per Unit of GDP (1980-2013) China's Energy Consumption per Unit of GDP (1980-‐2013)
0
500
1,000
1,500
2,000
2,500
3,000
3,500
4,000
1980 1985 1990 1995 2000 2005 2010
Ener
gy In
tens
ity
(kgc
e/10
,000
RM
B (2
005
pric
e))
23
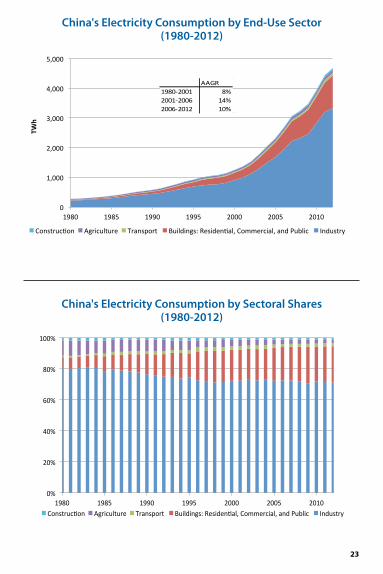
China's Electricity Consumption by Sectoral Shares (1980-2012)
China's Electricity Consumption by End-Use Sector (1980-2012)
China's Electricity Consumption by End-‐Use Sector (1980-‐2012)
China's Electricity Consumption by Sectoral Shares (1980-‐2012)
0
1,000
2,000
3,000
4,000
5,000
1980 1985 1990 1995 2000 2005 2010
Construc3on Agriculture Transport Buildings: Residen3al, Commercial, and Public Industry
TWh
0%
20%
40%
60%
80%
100%
1980 1985 1990 1995 2000 2005 2010 Construc3on Agriculture Transport Buildings: Residen3al, Commercial, and Public Industry
AAGR1980-‐2001 8%2001-‐2006 14%2006-‐2012 10%

24
China's Oil Consumption by Sector (1980-2012)
China's Oil Consumption by Sectoral Shares (1980-2012)
China's Oil Consumption by Sector (1980-‐2012)
China's Oil Consumption by Sectoral Shares (1980-‐2012)
0
100
200
300
400
500
1980 1985 1990 1995 2000 2005 2010
Mt
Hea-ng Supply Thermal Power Agriculture Construc-on Buildings: Residen-al, Commercial, and Public Transport Industry
0%
20%
40%
60%
80%
100%
1980 1985 1990 1995 2000 2005 2010 Hea-ng Supply Thermal Power Agriculture Construc-on Buildings: Residen-al, Commercial, and Public Transport
AAGR1980-‐2001 5%2001-‐2006 9%2006-‐2012 5%

25
Composition of China Oil Use(2012)
26
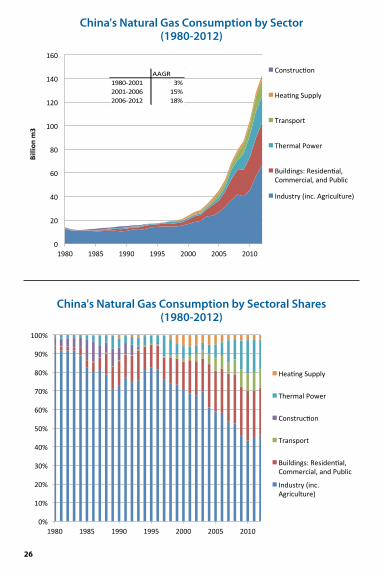
China's Natural Gas Consumption by Sector (1980-2012)
China's Natural Gas Consumption by Sectoral Shares (1980-2012)
China's Natural Gas Consumption by Sector (1980-‐2012)
Note: Natural gas includes LNG. China's Natural Gas Consumption by Sectoral Shares (1980-‐2012)
0
20
40
60
80
100
120
140
160
1980 1985 1990 1995 2000 2005 2010
Billion
m3
Construc=on
Hea=ng Supply
Transport
Thermal Power
Buildings: Residen=al, Commercial, and Public
Industry (inc. Agriculture)
0%
10%
20%
30%
40%
50%
60%
70%
80%
90%
100%
1980 1985 1990 1995 2000 2005 2010
Hea=ng Supply
Thermal Power
Construc=on
Transport
Buildings: Residen=al, Commercial, and Public
Industry (inc. Agriculture)
AAGR1980-‐2001 3%2001-‐2006 15%2006-‐2012 18%

27
Prices

28
China's Production Cost and Average Sales Price of State-Owned Coal Mines
China's Average Coal Contract Price and Coal Market Price for Power Generation
China's Production Cost and Average Sale Price of State-‐Owned Coal Mines
China's Average Coal Contract Price and Coal Market Price for Power Generation
0
50
100
150
200
250
300
350
400
1990 1992 1994 1996 1998 2000 2002 2004 2006 2008 2010
2000
RM
B/t c
oal
Average Sales Price of State-‐Owned Mines
Average ProducAon Cost for Raw Coal in State-‐owned Mines
0
100
200
300
400
500
600
700
800
900
2004 2005 2006 2007 2008 2009 2010 2011 2012 2013 2014
RMB/
tonn
e (n
omin
al p
rice)
Coal contract price for power generaAon Coal market price for power generaAon

29
China's Average Wholesale Price of Electricity (1979-2011) China's Average Wholesale Price of Electricity (1979-‐2011)
0
0.1
0.2
0.3
0.4
0.5
0.6
0.7
0.8
1979 1984 1989 1994 1999 2004 2009
RMB/kW
h
Average Wholesale Price (Nominal RMB) Average Wholesale Price (2005 RMB)

30
China's Average Residential Power Price by Province (2008-2011)
Province 2008 2009 2010 2011
(RMB/kWh) (RMB/kWh) (RMB/kWh) (RMB/kWh)
Guangdong 0.63 0.63 0.63 0.63
Hainan 0.59 0.60 0.60 0.60
Jiangxi 0.60 0.60 0.60 0.60
Hubei 0.56 0.56 0.56 0.56
Henan 0.54 0.54 0.55 0.55
Anhui 0.55 0.55 0.54 0.55
Shanghai 0.54 0.54 0.54 0.54
Hunan 0.53 0.53 0.53 0.53
Zhejiang 0.53 0.53 0.53 0.53
Jilin 0.52 0.52 0.52 0.52
Shandong 0.50 0.52 0.52 0.53
Guangxi 0.49 0.51 0.52 0.54
Chongqing 0.52 0.52 0.52 0.52
Sichuan 0.51 0.51 0.51 0.51
Jiangsu 0.50 0.50 0.50 0.50
Xinjiang 0.49 0.50 0.50 0.50
Shaanxi 0.47 0.50 0.50 0.50
Tibet 0.56 0.53 0.50 0.49
Liaoning 0.50 0.50 0.50 0.50
Tianjin 0.49 0.49 0.49 0.49
Gansu 0.48 0.49 0.49 0.48
Hebei (South Grid) 0.49 0.48 0.49 0.49
Hebei (North Grid) 0.48 0.48 0.48 0.49
Fujian 0.47 0.47 0.47 0.48
Beijing 0.48 0.47 0.47 0.47
Shanxi 0.47 0.46 0.46 0.46
Heilongjiang 0.46 0.46 0.46 0.46
Yunnan 0.45 0.45 0.45 0.45
Ningxia 0.45 0.46 0.45 0.45
Inner Mongolia (East) 0.45 0.43 0.45 0.48
Guizhou 0.43 0.44 0.44 0.44
Inner Mongolia (West) 0.39 0.39 0.37 0.36
Qinghai 0.34 0.34 0.36 0.36

31
China's Residential Natural Gas Price by Province (2012) Note: Natural gas includes LNG.
0.0 0.5 1.0 1.5 2.0 2.5 3.0 3.5 4.0 4.5 5.0
Xinjiang
/Qinghai
/Ningxia
Inner Mongolia
/Sichuan
Gansu /Shaanxi
Beijing Jilin
Liaoning
/Jiangsu
Tianjin Shanxi Hebei Henan
Shandong
Hubei /Shanghai
Anhui Hainan Hunan
Zhejiang
Fujian /Jiangxi
/Guizhou
Yunnan
/Guangxi
2012 RMB/cubic meter
Heilongjiang
Chongqing
Guangdong

32
China's Non-Residential Natural Gas City-Gate Ceiling Prices by Province (2013)
Province Quota Price Above-‐quota Price
Beijing 2.26 3.14
Tianjin 2.26 3.14
Hebei 2.24 3.12
Shanxi 2.17 3.05
Inner Mongolia 1.60 2.48
Liaoning 2.24 3.12
Jilin 2.02 2.90
Heilongjiang 2.02 2.90
Shanghai 2.44 3.32
Jiangsu 2.42 3.30
Zhejiang 2.43 3.31
Anhui 2.35 3.23
Jiangxi 2.22 3.10
Shandong 2.24 3.12
Henan 2.27 3.15
Hubei 2.22 3.10
Hunan 2.22 3.10
Guangdong 2.74 3.32
Guangxi 2.57 3.15
Hainan 1.92 2.78
Chongqing 1.92 2.78
Sichuan 1.93 2.79
Guizhou 1.97 2.85
Shaanxi 1.60 2.48
Guansu 1.69 2.57
Ningxia 1.77 2.65
Qinghai 1.53 2.41
Xinjiang 1.41 2.29 Unit: RMB/1000 cubic meter (include value-added tax)
Notes: 1. Effective since July 10, 2013. 2. Applies to domestically produced onshore natural gas and imported pipeline natural gas.
3. Does not apply for shale gas, coal-bed methane, and coal-to-gas.

33
Retail Gasoline Price (Including Tax) in Selected Countries and Regions (1990-2012) Retail Gasoline Price (Including Tax) in Selected Countries and Regions (1990-‐2012)
Note: Prices are those actually paid (i.e., net of rebates), and include transport costs and non-‐refundable taxes. Prices in national currencies are converted to U.S. dollars using exchange rates published by the International Monetary Fund.
0
1
2
3
4
5
6
7
8
9
1990 1995 2000 2005 2010
Nom
inal US Do
llars/G
allon
Japan
Germany
South Korea
Australia
Mainland, China
Canada
United States
Mexico
Note: Prices are those actually paid (i.e., net of rebates), and include transport costs and non-refundable taxes. Prices in national currencies are converted to U.S. dollars using exchange rates published by the International Monetary Fund.
34
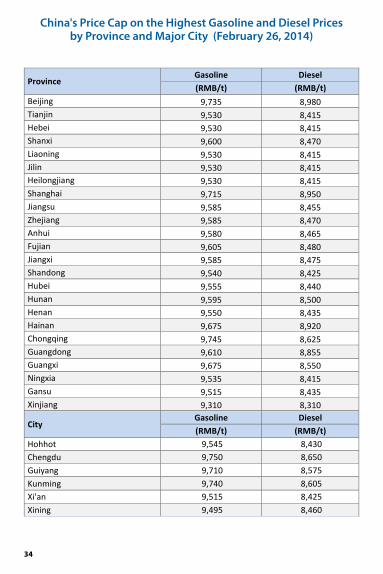
China's Price Cap on the Highest Gasoline and Diesel Prices by Province and Major City (February 26, 2014)
Province Gasoline Diesel (RMB/t) (RMB/t)
Beijing 9,735 8,980 Tianjin 9,530 8,415 Hebei 9,530 8,415 Shanxi 9,600 8,470 Liaoning 9,530 8,415 Jilin 9,530 8,415 Heilongjiang 9,530 8,415 Shanghai 9,715 8,950 Jiangsu 9,585 8,455 Zhejiang 9,585 8,470 Anhui 9,580 8,465 Fujian 9,605 8,480 Jiangxi 9,585 8,475 Shandong 9,540 8,425 Hubei 9,555 8,440 Hunan 9,595 8,500 Henan 9,550 8,435 Hainan 9,675 8,920 Chongqing 9,745 8,625 Guangdong 9,610 8,855 Guangxi 9,675 8,550 Ningxia 9,535 8,415 Gansu 9,515 8,435 Xinjiang 9,310 8,310
City Gasoline Diesel (RMB/t) (RMB/t)
Hohhot 9,545 8,430 Chengdu 9,750 8,650 Guiyang 9,710 8,575 Kunming 9,740 8,605 Xi'an 9,515 8,425 Xining 9,495 8,460
35
Emissions
36
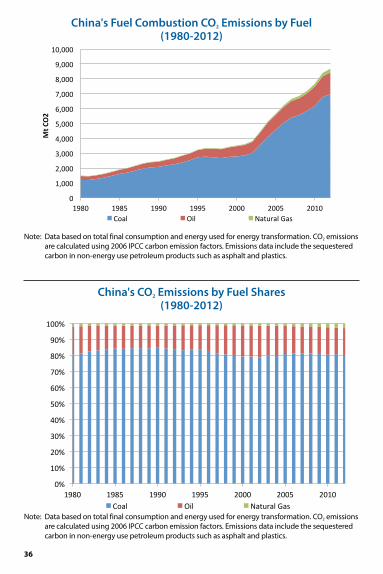
China's Fuel Combustion CO2 Emissions by Fuel (1980-2012)
China's CO2 Emissions by Fuel Shares (1980-2012)
China's Fuel Combustion CO2 Emissions by Fuel (1980-‐2012)
China's CO2 Emissions by Fuel Shares (1980-‐2012)
Note: Data based on total final consumption and energy used for energy transformation. CO2 emissions are
calculated using 2006 IPCC carbon emission factors. Emissions data include the sequestered carbon in non-energy use petroleum products such as asphalt and plastics.
Note: Data based on total final consumption and energy used for energy transformation. CO2 emissions are
calculated using 2006 IPCC carbon emission factors. Emissions data include the sequestered carbon in non-energy use petroleum products such as asphalt and plastics.
0
1,000
2,000
3,000
4,000
5,000
6,000
7,000
8,000
9,000
10,000
1980 1985 1990 1995 2000 2005 2010
Mt C
O2
Coal Oil Natural Gas
0%
10%
20%
30%
40%
50%
60%
70%
80%
90%
100%
1980 1985 1990 1995 2000 2005 2010 Coal Oil Natural Gas
Note: Data based on total final consumption and energy used for energy transformation. CO2 emissions are calculated using 2006 IPCC carbon emission factors. Emissions data include the sequestered carbon in non-energy use petroleum products such as asphalt and plastics.
Note: Data based on total final consumption and energy used for energy transformation. CO2 emissions are calculated using 2006 IPCC carbon emission factors. Emissions data include the sequestered carbon in non-energy use petroleum products such as asphalt and plastics.

37
China's Energy-Related CO2 Emissions by Sectoral Shares (1980-2012)
China's Energy-Related CO2 Emissions by Sector (1980-2012)
China's Energy-‐Related CO2 Emissions by Sector (1980-‐2012)
China's Energy-‐Related CO2 Emissions by Sectoral Shares (1980-‐2012)
0
2,000
4,000
6,000
8,000
10,000
1980 1985 1990 1995 2000 2005 2010
Mt C
O2
Construc3on Agriculture Transport Buildings: Residen3al, Commercial, and Public Industry
0%
10%
20%
30%
40%
50%
60%
70%
80%
90%
100%
1980 1985 1990 1995 2000 2005 2010
Construc3on Agriculture Transport Buildings: Residen3al, Commercial, and Public Industry
Note: Power sector emissions are allocated to end-use sectors in proportion to their electricity use.
Note: Power sector emissions are allocated to end-use sectors in proportion to their electricity use.

38
Economic and Demographic
Indicators

39
China's GDP by Sector (1980-2012)
China's Gross Domestic Product (GDP) (1980-2013)
Primary: agriculture (farming, forestry, animal husbandry, sideline production and fishery)
Industry: including mining and quarrying, manufacturing, water supply, electricity generation and supply, steam, hot water and gas.
Construction: including preparation of land and construction, alteration, and repair of buildings, structures, and other real property.
Tertiary: all the other industries not included in primary, industry, and construction.

40
Growth of China's Population (1980-2012)
International Comparisons

41
International Comparisons

42
Total Primary Energy Production per GDP (MER*) (2011)
Total Primary Energy Production per GDP (PPP**) (2011)
Total Primary Energy Production per GDP (MER*) (2011)
0.0
0.2
0.4
0.6
0.8
1.0
1.2 tce/thou
sand
USD
(200
5 price)
Total Primary Energy Production per GDP (PPP**) (2011)
0.0
0.1
0.2
0.3
0.4
0.5
0.6
tce/thou
sand
USD
(200
5 price)
** Purchasing Power Parity
*Market Exchange RatesOECD: members of the Organization for Economic Co-operation and Development

43
Electricity Consumption per Capita (2011)
Total Primary Energy Production per Capita (2011)
Electricity Consumption per Capita (2011)
0 2,000 4,000 6,000 8,000
10,000 12,000 14,000
kWh/capita
Total Primary Energy Production per Capita (2011)
0
2
4
6
8
10
12 tce/capita

44
Energy-Related CO2 Emissions per Total Primary Energy Supply (2011)
Energy-Related CO2 Emissions per Capita (2011)
Energy-‐Related CO2 Emissions per Total Primary Energy Supply (2011)
0.0
0.5
1.0
1.5
2.0
2.5 tonn
es CO2/tce
Energy-‐Related CO2 Emissions per Capita (2011)
0 2 4 6 8
10 12 14 16 18
tonn
es CO2/capita

45
Energy-Related CO2 Emissions per GDP (PPP**) (2011)
Energy-Related CO2 Emissions per GDP (MER*) (2011)
Energy-‐Related CO2 Emissions per GDP (PPP**)
** Purchasing Power Parity
0 0.1 0.2 0.3 0.4 0.5 0.6 0.7 0.8 0.9
kg CO2/USD
(200
5 price)
Energy-‐Related CO2 Emissions per GDP (MER*) (2011)
* Market Exchange Rates
0.0 0.2 0.4 0.6 0.8 1.0 1.2 1.4 1.6 1.8 2.0
kg CO
2/USD
(200
5 price)
** Purchasing Power Parity
*Market Exchange Rates

46
Appendix 1: Table of Abbreviations
Abbreviations
AAGR average annual growth rate
bm3 billion cubic meters
bm3/yr billion cubic meters/year
CO2 carbon dioxide
EJ exajoule (1018 joules)
GDP gross domestic product
Gt giga (billion) tonnes
IPCC Intergovernmental Panel on Climate Change
kgce kilogram of coal equivalent
kgce/cap kilogram of coal equivalent/capita
kWh kilowatt-‐hours
kWh/cap kilowatt-‐hour/capita
LPG liquefied petroleum gas
m3 cubic meter
Mt million tonnes
Mt/yr million tonnes/year
Mtce million tonnes of coal equivalent
Mtce/yr million tonnes of coal equivalent/year
MWh megawatt-‐hours
MWh/t megawatt-‐hour/tonne
MWh/yr megawatt-‐hour/year
OECD Organisation for Economic Co-‐operation and Development
PPP purchasing power parity
RMB renminbi (Chinese currency)
RMB/kWh renminbi/kilowatt-‐hour
RMB/m3 renminbi/cubic meter
RMB/tce renminbi/tonnes of coal equivalent
tce tonnes of coal equivalent
TWh terawatt-‐hours

47
Appendix 1: Glossary
Coal Coal includes both primary (raw coal, cleaned coal, washed coal, briquettes) and derived fuels (coke, coke oven gas, and other coking products).
Crude Oil Crude oil includes crude oil, natural gas liquids, refinery feedstock, additives, and other hydrocarbon.
Petroleum Products
Petroleum products include gasoline, kerosene, diesel oil, fuel oil, LPG, refinery gas, and other petroleum products.
Gas Gas includes natural gas.
Nuclear Nuclear is the energy content of the electricity produced by a nuclear power plant.
Hydro Hydro is the energy content of the electricity produced by a hydro electric power plant.
Indigenous Production
Indigenous production is the production of primary energy in China.
International Marine Bunkers
International marine bunker cover those quantities delivered to sea-going ships of all countries, including warships.
Region - East The east region of China is defined to include provinces of Anhui, Fujian, Jiangsu, Jiangxi, Shandong, and Zhejiang.
Region - West The west region of China is defined to include cities and provinces of Gansu, Ningxia, Qinghai, Shaanxi, Xinjiang, Chongqing, Guizhou, Sichuan, Tibet, and Yunnan.
Region - North The north region of China is defined to include cities and provinces of Beijing, Hebei, Inner Mongolia, Shanxi, Heilongjiang, Jilin, and Liaoning.
Region - South The south region of China is defined to include provinces of Guangdong, Guangxi, Hainan, Henan, Hubei, and Hunan.

48
Appendix 1: Glossary (continued)
Stock Changes Stock changes reflect the difference between opening stock levels on the first day of the year and closing stock levels of the last day of the year of stocks on national territory held by producers, importers, energy transformation industries, and large consumers.
Total Primary Energy Supply
Total primary energy supply equals to the total of indigenous production and imports, and minus exports and international marine bunkers and plus stock changes.
Transformation Transformation includes the conversion of primary energy into secondary energy carriers such as electricity and oil products.
Statistical Differences
Statistical differences is a category that includes the sum of unexplained statistical differences for individual fuels.
Distribution and Transmission Losses
Distribution and transmission losses are losses in gas distribution, electricity transmission, and coal transport.
Total Final Consumption
Total final consumption is the sum of consumption by end-use sectors.

49
For this energy form... 1 unit of equals in Mtce Coal Total Mt 0.714 Raw Coal Mt 0.714 Cleaned Coal Mt 0.9 Other Washed Coal Mt 0.525 Briquettes Mt 0.6 Coke Mt 0.971 Coke Oven Gas Billion m3 0.593 Other Gas Billion m3 0.288 Other Coking Products Mt 1.107 Petroleum Products Mt 1.43 Crude Oil Mt 1.429 Gasoline Mt 1.471 Kerosene Mt 1.471 Diesel Oil Mt 1.457 Fuel Oil Mt 1.429 LPG Mt 1.714 Refinery Gas Mt 1.571 Other Petroleum Products Mt 1.31 Natural Gas Billion m3 1.33 Heat TJ 3.4 X 10-‐5 Heat PJ 0.034 Electricity TWh 0.123 Electricity GWh 1.23 X 10-‐4 Thermal Power TWh 0.404 Thermal Power GWh 4.04 X 10-‐4 Total Power TWh 0.404 Total Power GWh 4.04 X 10-‐4 Other Energy Mt 1 Fuelwood Mt 0.571 Crop Residues Mt 0.43 Dried Dung Mt 0.471
Appendix 2: Conversion Factors from Physical Unit to Coal Equivalent

50
Appendix 3: Energy Balance/China 2012Standard Quantity (Mtce)
Standard Quantity (Mtce)
Total Coal Coal Raw Coal Cleaned
Coal Washed
Coal Briquettes
Total Primary Energy Supply 2,713.44 2,719.12 (7.83) 0.42 (0.03)
Indigenous Production 2,602.53 2,602.53
Indigenous Production -‐ Hydro Power
Indigenous Production -‐ Nuclear Power
Indigenous Production -‐ Wind Power
Import 205.93 205.88 0.04
Chinese Vessels Refueling Abroad
Export 6.62 6.52 0.08
Foreign Vessels Refueling in China
Stock Change (88.40) (82.76) (7.83) 0.42 0.01
Total Transformation (1,896.32) (1,997.14) 40.29 45.08 6.34
Thermal Power (1,274.71) (1,255.55) (0.53) (13.78)
Heating Supply (144.62) (139.09) (0.38) (3.82)
Coal Washing (80.35) (542.66) 464.13 69.19
Coking (386.05) (53.06) (419.26) (0.28)
Petroleum Refineries (2.70) (1.39) (1.56) (0.05)Petroleum Refineries -‐ Petroleum Products Input
Gas Works (5.70) (4.04) (2.10)
Gas Works -‐ Coke input
Natural Gas Liquefaction
Briquettes (2.21) (1.35) (6.18) 6.34
Recovery of Energy
Losses in Transformation
Total Consumption 621.58 539.17 24.38 40.89 6.27
Agriculture 12.61 12.35 0.19
Industry 500.68 431.16 24.20 34.95 2.34
Industry -‐ NonEnergy Use 31.33 28.30 1.24 1.50
Construction 5.38 5.30 0.05 0.03
Transportation, Telecommunications, Postal 4.39 4.19 0.12 0.07
Wholesale, Retail Trade, and Catering Service 16.86 16.52 0.09 0.19
Other 16.30 15.32 0.66 0.07
Residential consumption 65.36 54.33 4.90 3.67
Residential consumption -‐ Urban 10.94 7.75 1.37 1.11
Residential consumption -‐ Rural 54.42 46.57 3.52 2.56
Statistical Difference 195.54 182.82 8.08 4.60 0.04

51
Appendix 3: Energy Balance/China 2012 Standard Quantity (Mtce) (continued)
Standard Quantity (Mtce)
Gangue Coke Coke Oven Gas
Blast Furnace Gas
Converter Gas
Total Primary Energy Supply 1.19
Indigenous Production
Indigenous Production -‐ Hydro Power
Indigenous Production -‐ Nuclear Power
Indigenous Production -‐ Wind Power
Import 0.07
Chinese Vessels Refueling Abroad
Export 0.99
Foreign Vessels Refueling in China
Stock Change 2.11
Total Transformation 0.02 397.89 36.05 12.75 7.13
Thermal Power (5.39) (7.88) (12.36) (2.60)
Heating Supply (1.38) (4.34) (6.11) (1.43)
Coal Washing 6.78
Coking 396.59 47.21
Petroleum RefineriesPetroleum Refineries -‐ Petroleum Products Input
Gas Works 1.82 1.05
Gas Works -‐ Coke input (0.53)
Natural Gas Liquefaction
Briquettes
Recovery of Energy 31.21 11.16
Losses in Transformation
Total Consumption 381.78 35.13 12.80 6.93
Agriculture 0.56
Industry 380.71 32.79 12.80 6.93
Industry -‐ NonEnergy Use 15.23 0.33
Construction 0.06
Transportation, Telecommunications, Postal 0.00
Wholesale, Retail Trade, and Catering Service 0.06 0.04
Other 0.02 0.16
Residential consumption 0.37 2.14
Residential consumption -‐ Urban 0.17 2.14
Residential consumption -‐ Rural 0.20
Statistical Difference 0.02 17.30 0.92 (0.05) 0.20
52
Appendix 3: Energy Balance/China 2012Standard Quantity (Mtce) (continued)
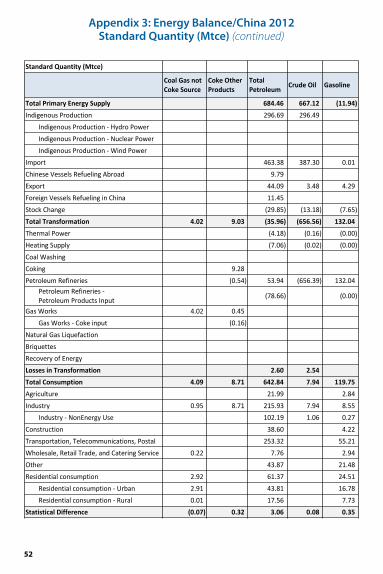
Standard Quantity (Mtce)
Coal Gas not Coke Source
Coke Other Products
Total Petroleum Crude Oil Gasoline
Total Primary Energy Supply 684.46 667.12 (11.94)Indigenous Production 296.69 296.49
Indigenous Production -‐ Hydro PowerIndigenous Production -‐ Nuclear PowerIndigenous Production -‐ Wind Power
Import 463.38 387.30 0.01Chinese Vessels Refueling Abroad 9.79Export 44.09 3.48 4.29Foreign Vessels Refueling in China 11.45Stock Change (29.85) (13.18) (7.65)Total Transformation 4.02 9.03 (35.96) (656.56) 132.04Thermal Power (4.18) (0.16) (0.00)Heating Supply (7.06) (0.02) (0.00)Coal WashingCoking 9.28Petroleum Refineries (0.54) 53.94 (656.39) 132.04
Petroleum Refineries -‐ Petroleum Products Input (78.66) (0.00)
Gas Works 4.02 0.45Gas Works -‐ Coke input (0.16)
Natural Gas LiquefactionBriquettesRecovery of EnergyLosses in Transformation 2.60 2.54Total Consumption 4.09 8.71 642.84 7.94 119.75Agriculture 21.99 2.84Industry 0.95 8.71 215.93 7.94 8.55
Industry -‐ NonEnergy Use 102.19 1.06 0.27Construction 38.60 4.22Transportation, Telecommunications, Postal 253.32 55.21Wholesale, Retail Trade, and Catering Service 0.22 7.76 2.94Other 43.87 21.48Residential consumption 2.92 61.37 24.51
Residential consumption -‐ Urban 2.91 43.81 16.78Residential consumption -‐ Rural 0.01 17.56 7.73
Statistical Difference (0.07) 0.32 3.06 0.08 0.35

53
Appendix 3: Energy Balance/China 2012Standard Quantity (Mtce) (continued)
Standard Quantity (Mtce)
Kerosene Diesel Oil Fuel Oil Naphtha Lubricants
Total Primary Energy Supply (3.01) (1.41) 20.55 3.41 0.28Indigenous Production
Indigenous Production -‐ Hydro PowerIndigenous Production -‐ Nuclear PowerIndigenous Production -‐ Wind Power
Import 9.13 1.32 38.34 4.63 0.43Chinese Vessels Refueling Abroad 3.77 0.13 5.99Export 10.96 2.70 16.60 0.32 0.15Foreign Vessels Refueling in China 5.01 0.30 6.29Stock Change 0.05 0.13 (0.90) (0.90)Total Transformation 32.13 247.67 9.19 41.19 3.15Thermal Power (0.52) (0.62)Heating Supply (0.03) (2.68)Coal WashingCokingPetroleum Refineries 32.13 248.62 32.20 44.49 3.15
Petroleum Refineries -‐ Petroleum Products Input (0.40) (19.72) (3.30)
Gas WorksGas Works -‐ Coke input
Natural Gas LiquefactionBriquettesRecovery of EnergyLosses in TransformationTotal Consumption 28.78 246.24 29.62 44.53 3.27Agriculture 0.02 19.46 0.03Industry 0.47 24.51 9.02 44.53 3.27
Industry -‐ NonEnergy Use 42.53 3.03Construction 0.12 7.55 0.39Transportation, Telecommunications, Postal 26.29 156.29 19.78Wholesale, Retail Trade, and Catering Service 0.42 3.34 0.12Other 1.09 21.05 0.28Residential consumption 0.38 14.05
Residential consumption -‐ Urban 0.05 9.89Residential consumption -‐ Rural 0.33 4.16
Statistical Difference 0.33 0.01 0.11 0.06 0.15

54
Appendix 3: Energy Balance/China 2012Standard Quantity (Mtce) (continued)
Standard Quantity (Mtce)
Petroleum Waxes Solvents Bitumen
AsphaltPetroleum Coke
Liquid Petroleum Gas
Total Primary Energy Supply (0.57) 0.03 3.45 4.66 3.90Indigenous Production
Indigenous Production -‐ Hydro PowerIndigenous Production -‐ Nuclear PowerIndigenous Production -‐ Wind Power
Import 0.07 0.03 3.58 7.39 6.14Chinese Vessels Refueling AbroadExport 0.64 0.01 0.13 2.41 2.20Foreign Vessels Refueling in ChinaStock Change 0.00 (0.32) (0.05)Total Transformation 2.00 2.37 21.20 15.68 36.18Thermal Power (1.37)Heating Supply (1.50) (0.00)Coal WashingCokingPetroleum Refineries 2.00 2.37 21.20 18.56 38.89
Petroleum Refineries -‐ Petroleum Products Input (2.70)
Gas WorksGas Works -‐ Coke input
Natural Gas LiquefactionBriquettesRecovery of EnergyLosses in Transformation 0.07Total Consumption 1.38 2.32 24.05 20.01 39.77Agriculture 0.11Industry 1.38 2.32 0.59 20.01 7.94
Industry -‐ NonEnergy Use 1.35 2.23 15.23 0.87Construction 23.46 0.12Transportation, Telecommunications, Postal 1.09Wholesale, Retail Trade, and Catering Service 1.30Other 1.17Residential consumption 28.03
Residential consumption -‐ Urban 21.26Residential consumption -‐ Rural 6.77
Statistical Difference 0.05 0.08 0.61 0.34 0.24
55
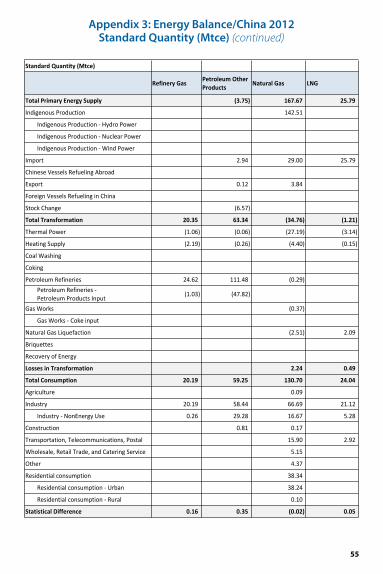
Appendix 3: Energy Balance/China 2012Standard Quantity (Mtce) (continued)
Standard Quantity (Mtce)
Refinery Gas Petroleum Other Products Natural Gas LNG
Total Primary Energy Supply (3.75) 167.67 25.79
Indigenous Production 142.51
Indigenous Production -‐ Hydro Power
Indigenous Production -‐ Nuclear Power
Indigenous Production -‐ Wind Power
Import 2.94 29.00 25.79
Chinese Vessels Refueling Abroad
Export 0.12 3.84
Foreign Vessels Refueling in China
Stock Change (6.57)
Total Transformation 20.35 63.34 (34.76) (1.21)
Thermal Power (1.06) (0.06) (27.19) (3.14)
Heating Supply (2.19) (0.26) (4.40) (0.15)
Coal Washing
Coking
Petroleum Refineries 24.62 111.48 (0.29)Petroleum Refineries -‐ Petroleum Products Input (1.03) (47.82)
Gas Works (0.37)
Gas Works -‐ Coke input
Natural Gas Liquefaction (2.51) 2.09
Briquettes
Recovery of Energy
Losses in Transformation 2.24 0.49
Total Consumption 20.19 59.25 130.70 24.04
Agriculture 0.09
Industry 20.19 58.44 66.69 21.12
Industry -‐ NonEnergy Use 0.26 29.28 16.67 5.28
Construction 0.81 0.17
Transportation, Telecommunications, Postal 15.90 2.92
Wholesale, Retail Trade, and Catering Service 5.15
Other 4.37
Residential consumption 38.34
Residential consumption -‐ Urban 38.24
Residential consumption -‐ Rural 0.10
Statistical Difference 0.16 0.35 (0.02) 0.05

56
Appendix 3: Energy Balance/China 2012Standard Quantity (Mtce) (continued)
Standard Quantity (Mtce)
Heat Electricity Other Energy Total Energy
Total Primary Energy Supply 133.22 4,004.69
Indigenous Production 134.54 3,484.01
Indigenous Production -‐ Hydro Power 107.18 352.33
Indigenous Production -‐ Nuclear Power 119.70 39.35
Indigenous Production -‐ Wind Power 117.96 38.78
Import 0.84 701.16
Chinese Vessels Refueling Abroad 9.79
Export 2.17 62.68
Foreign Vessels Refueling in China 11.45
Stock Change (116.14)
Total Transformation 116.06 478.43 (0.00) 168.68
Thermal Power (12.71) 478.43 (5.23) 240.80
Heating Supply 113.79 (2.48) (49.10)
Coal Washing (80.35)
Coking 67.03
Petroleum Refineries (0.02) 50.40Petroleum Refineries -‐ Petroleum Products Input (78.66)
Gas Works 1.27
Gas Works -‐ Coke input (0.68)
Natural Gas Liquefaction (2.51)
Briquettes (2.21)
Recovery of Energy 14.98 7.72 22.70
Losses in Transformation 1.24 35.59 123.08
Total Consumption 114.81 575.99 3,833.04
Agriculture 0.04 12.44 76.19
Industry 82.75 409.70 2,635.99
Industry -‐ NonEnergy Use 165.76
Construction 0.23 7.48 69.02
Transportation, Telecommunications, Postal 0.77 11.25 311.36
Wholesale, Retail Trade, and Catering Service 1.62 20.79 100.05
Other 3.01 37.90 192.32
Residential consumption 26.39 76.43 448.12
Residential consumption -‐ Urban 26.39 43.74 268.39
Residential consumption -‐ Rural 32.69 179.74
Statistical Difference 0.00 0.06 (0.00) 217.24
57
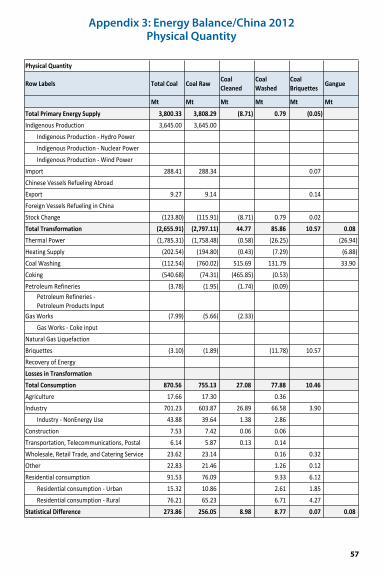
Appendix 3: Energy Balance/China 2012Physical Quantity
Physical Quantity
Row Labels Total Coal Coal Raw Coal Cleaned
Coal Washed
Coal Briquettes Gangue
Mt Mt Mt Mt Mt Mt
Total Primary Energy Supply 3,800.33 3,808.29 (8.71) 0.79 (0.05)Indigenous Production 3,645.00 3,645.00
Indigenous Production -‐ Hydro PowerIndigenous Production -‐ Nuclear PowerIndigenous Production -‐ Wind Power
Import 288.41 288.34 0.07Chinese Vessels Refueling AbroadExport 9.27 9.14 0.14Foreign Vessels Refueling in ChinaStock Change (123.80) (115.91) (8.71) 0.79 0.02Total Transformation (2,655.91) (2,797.11) 44.77 85.86 10.57 0.08Thermal Power (1,785.31) (1,758.48) (0.58) (26.25) (26.94)Heating Supply (202.54) (194.80) (0.43) (7.29) (6.88)Coal Washing (112.54) (760.02) 515.69 131.79 33.90Coking (540.68) (74.31) (465.85) (0.53)Petroleum Refineries (3.78) (1.95) (1.74) (0.09)
Petroleum Refineries -‐Petroleum Products Input
Gas Works (7.99) (5.66) (2.33)Gas Works -‐ Coke input
Natural Gas LiquefactionBriquettes (3.10) (1.89) (11.78) 10.57Recovery of EnergyLosses in TransformationTotal Consumption 870.56 755.13 27.08 77.88 10.46Agriculture 17.66 17.30 0.36Industry 701.23 603.87 26.89 66.58 3.90
Industry -‐ NonEnergy Use 43.88 39.64 1.38 2.86Construction 7.53 7.42 0.06 0.06Transportation, Telecommunications, Postal 6.14 5.87 0.13 0.14Wholesale, Retail Trade, and Catering Service 23.62 23.14 0.16 0.32Other 22.83 21.46 1.26 0.12Residential consumption 91.53 76.09 9.33 6.12
Residential consumption -‐ Urban 15.32 10.86 2.61 1.85Residential consumption -‐ Rural 76.21 65.23 6.71 4.27
Statistical Difference 273.86 256.05 8.98 8.77 0.07 0.08

58
Appendix 3: Energy Balance/China 2012Physical Quantity (continued)
Physical Quantity
Row Labels Gangue Coke Coke Oven Gas
Blast Furnace Gas
Converter Gas
Mt Mt bm3 bm3 bm3
Total Primary Energy Supply 1.23Indigenous Production
Indigenous Production -‐ Hydro PowerIndigenous Production -‐ Nuclear PowerIndigenous Production -‐ Wind Power
Import 0.08Chinese Vessels Refueling AbroadExport 1.02Foreign Vessels Refueling in ChinaStock Change 2.17Total Transformation 0.08 409.77 60.79 99.11 26.28Thermal Power (26.94) (13.28) (96.12) (9.60)Heating Supply (6.88) (7.32) (47.49) (5.25)Coal Washing 33.90Coking 408.44 79.61Petroleum Refineries
Petroleum Refineries -‐Petroleum Products Input
Gas Works 1.87 1.77Gas Works -‐ Coke input (0.55)
Natural Gas LiquefactionBriquettesRecovery of Energy 242.73 41.12Losses in TransformationTotal Consumption 393.19 59.23 99.50 25.52Agriculture 0.57Industry 392.08 55.29 99.50 25.52
Industry -‐ NonEnergy Use 15.69 0.55Construction 0.06Transportation, Telecommunications, Postal 0.00Wholesale, Retail Trade, and Catering Service 0.07 0.06Other 0.02 0.28Residential consumption 0.38 3.61
Residential consumption -‐ Urban 0.18 3.61Residential consumption -‐ Rural 0.20
Statistical Difference 0.08 17.81 1.55 (0.39) 0.75

59
Appendix 3: Energy Balance/China 2012Physical Quantity (continued)
Physical Quantity
Row Labels Coal Gas not Coke Source
Coke Other Products
Total Petroleum Crude Oil Gasoline
bm3 Mt Mt Mt MtTotal Primary Energy Supply 478.65 466.85 (8.12)Indigenous Production 207.48 207.48
Indigenous Production -‐ Hydro PowerIndigenous Production -‐ Nuclear PowerIndigenous Production -‐ Wind Power
Import 324.04 271.03 0.00Chinese Vessels Refueling Abroad 6.85Export 30.83 2.43 2.92Foreign Vessels Refueling in China 8.01Stock Change (20.88) (9.23) (5.20)Total Transformation 13.95 8.15 (25.15) (459.46) 89.76Thermal Power (2.92) (0.11) (0.00)Heating Supply (4.94) (0.01) (0.00)Coal WashingCoking 8.38Petroleum Refineries (0.49) 37.72 (459.34) 89.76
Petroleum Refineries -‐Petroleum Products Input (55.01) (0.00)
Gas Works 13.95 0.41Gas Works -‐ Coke input (0.14)
Natural Gas LiquefactionBriquettesRecovery of EnergyLosses in Transformation 1.82 1.78Total Consumption 14.21 7.87 449.54 5.55 81.41Agriculture 15.38 1.93Industry 3.30 7.87 151.00 5.55 5.81
Industry -‐ NonEnergy Use 71.46 0.74 0.19Construction 26.99 2.87Transportation, Telecommunications, Postal 177.15 37.53Wholesale, Retail Trade, and Catering Service 0.78 5.42 2.00Other 30.68 14.61Residential consumption 10.13 42.92 16.67
Residential consumption -‐ Urban 10.11 30.63 11.41Residential consumption -‐ Rural 0.03 12.28 5.26
Statistical Difference (0.26) 0.29 2.14 0.06 0.24

60
Appendix 3: Energy Balance/China 2012Physical Quantity (continued)
Physical Quantity
Row Labels Kerosene Diesel Oil Fuel Oil Naphtha Lubricants
Mt Mt Mt Mt Mt
Total Primary Energy Supply (2.05) (0.97) 14.38 2.27 0.20
Indigenous Production
Indigenous Production -‐ Hydro Power
Indigenous Production -‐ Nuclear Power
Indigenous Production -‐ Wind Power
Import 6.21 0.91 26.83 3.09 0.30
Chinese Vessels Refueling Abroad 2.56 0.09 4.19
Export 7.45 1.85 11.62 0.22 0.11
Foreign Vessels Refueling in China 3.41 0.20 4.40
Stock Change 0.04 0.09 (0.63) (0.60)
Total Transformation 21.84 169.98 6.43 27.46 2.22
Thermal Power (0.36) (0.43)
Heating Supply (0.02) (1.87)
Coal Washing
Coking
Petroleum Refineries 21.84 170.64 22.53 29.66 2.22Petroleum Refineries -‐Petroleum Products Input (0.27) (13.80) (2.20)
Gas Works
Gas Works -‐ Coke input
Natural Gas Liquefaction
Briquettes
Recovery of Energy
Losses in Transformation
Total Consumption 19.57 169.01 20.73 29.69 2.31
Agriculture 0.01 13.35 0.02
Industry 0.32 16.82 6.31 29.69 2.31
Industry -‐ NonEnergy Use 28.35 2.15
Construction 0.08 5.18 0.27
Transportation, Telecommunications, Postal 17.87 107.27 13.84
Wholesale, Retail Trade, and Catering Service 0.29 2.29 0.09
Other 0.74 14.45 0.20
Residential consumption 0.26 9.64
Residential consumption -‐ Urban 0.03 6.79
Residential consumption -‐ Rural 0.22 2.85
Statistical Difference 0.22 0.01 0.08 0.04 0.11

61
Appendix 3: Energy Balance/China 2012Physical Quantity (continued)
Physical Quantity
Row Labels Petroleum Waxes Solvents Bitumen
AsphaltPetroleum Coke
Liquid Petroleum Gas
Mt Mt Mt Mt MtTotal Primary Energy Supply (0.42) 0.02 2.64 4.44 2.27Indigenous Production
Indigenous Production -‐ Hydro PowerIndigenous Production -‐ Nuclear PowerIndigenous Production -‐ Wind Power
Import 0.05 0.02 2.73 7.03 3.59Chinese Vessels Refueling AbroadExport 0.47 0.01 0.10 2.29 1.28Foreign Vessels Refueling in ChinaStock Change 0.00 (0.30) (0.03)Total Transformation 1.47 1.61 16.19 14.94 21.11Thermal Power (1.31)Heating Supply (1.43) (0.00)Coal WashingCokingPetroleum Refineries 1.47 1.61 16.19 17.67 22.69
Petroleum Refineries -‐Petroleum Products Input (1.58)
Gas WorksGas Works -‐ Coke input
Natural Gas LiquefactionBriquettesRecovery of EnergyLosses in Transformation 0.04Total Consumption 1.01 1.58 18.36 19.05 23.20Agriculture 0.06Industry 1.01 1.58 0.45 19.05 4.63
Industry -‐ NonEnergy Use 0.99 1.52 14.51 0.51Construction 17.91 0.07Transportation, Telecommunications, Postal 0.64Wholesale, Retail Trade, and Catering Service 0.76Other 0.68Residential consumption 16.35
Residential consumption -‐ Urban 12.40Residential consumption -‐ Rural 3.95
Statistical Difference 0.04 0.05 0.47 0.32 0.14

62
Appendix 3: Energy Balance/China 2012Physical Quantity (continued)
Physical Quantity
Row Labels Refinery Gas Petroleum Other Products Natural Gas LNG
Mt Mt bm3 MtTotal Primary Energy Supply (2.86) 126.07 14.68Indigenous Production 107.15
Indigenous Production -‐ Hydro PowerIndigenous Production -‐ Nuclear PowerIndigenous Production -‐ Wind Power
Import 2.25 21.81 14.68Chinese Vessels Refueling AbroadExport 0.10 2.89Foreign Vessels Refueling in ChinaStock Change (5.01)Total Transformation 12.95 48.35 (26.14) (0.69)Thermal Power (0.67) (0.05) (20.44) (1.79)Heating Supply (1.39) (0.20) (3.31) (0.09)Coal WashingCokingPetroleum Refineries 15.67 85.10 (0.22)
Petroleum Refineries -‐Petroleum Products Input (0.66) (36.50)
Gas Works (0.28)Gas Works -‐ Coke input
Natural Gas Liquefaction (1.89) 1.19BriquettesRecovery of EnergyLosses in Transformation 1.68 0.28Total Consumption 12.85 45.23 98.27 13.68Agriculture 0.06Industry 12.85 44.61 50.14 12.02
Industry -‐ NonEnergy Use 0.17 22.35 12.54 3.01Construction 0.62 0.13Transportation, Telecommunications, Postal 11.95 1.66Wholesale, Retail Trade, and Catering Service 3.87Other 3.29Residential consumption 28.83
Residential consumption -‐ Urban 28.75Residential consumption -‐ Rural 0.08
Statistical Difference 0.10 0.26 (0.02) 0.03

63
Appendix 3: Energy Balance/China 2012Physical Quantity (continued)
Physical Quantity
Row Labels Heat Electricity Other Energy Total Energy
PJ TWh Mtce MtceTotal Primary Energy Supply 1,083.96 4,004.69Indigenous Production 1,094.74 3,484.01
Indigenous Production -‐ Hydro Power 872.11 352.33Indigenous Production -‐ Nuclear Power 97.39 39.35Indigenous Production -‐ Wind Power 94.98 38.78
Import 6.87 701.16Chinese Vessels Refueling Abroad 9.79Export 17.65 62.68Foreign Vessels Refueling in China 11.45Stock Change (116.14)Total Transformation 3,413.39 3,892.81 (0.00) 168.68Thermal Power (373.93) 3,892.81 (5.23) 240.80Heating Supply 3,346.85 (2.48) (49.10)Coal Washing (80.35)Coking 67.03Petroleum Refineries (0.02) 50.40
Petroleum Refineries -‐Petroleum Products Input (78.66)
Gas Works 1.27Gas Works -‐ Coke input (0.68)
Natural Gas Liquefaction (2.51)Briquettes (2.21)Recovery of Energy 440.46 7.72 22.70Losses in Transformation 36.42 289.62 123.08Total Consumption 3,376.87 4,686.65 3,833.04Agriculture 1.13 101.26 76.19Industry 2,433.91 3,333.61 2,635.99
Industry -‐ NonEnergy Use 165.76Construction 6.88 60.84 69.02Transportation, Telecommunications, Postal 22.65 91.54 311.36Wholesale, Retail Trade, and Catering Service 47.59 169.15 100.05Other 88.63 308.36 192.32Residential consumption 776.08 621.90 448.12
Residential consumption -‐ Urban 776.08 355.93 268.39Residential consumption -‐ Rural 265.96 179.74
Statistical Difference 0.09 0.51 (0.00) 217.24

64
Appendix 4: Data Sources
1. Supply National Bureau of Statistics of the People’s Republic of China, various years. China Energy Statistical Yearbook. Beijing: China Statistics Press.
United Nations. United Nations Commodity Trade Statistics Database. New York: United Nations.
2. Transformation National Bureau of Statistics of the People’s Republic of China, various years. China Energy Statistical Yearbook. Beijing: China Statistics Press.
3. Consumption National Bureau of Statistics of the People’s Republic of China, various years. China Energy Statistical Yearbook. Beijing: China Statistics Press.
4. Prices Energy Information Administration, United States. International Energy Statistics. Washington, DC: USA.
Fridley D., Khanna N.Z. and L. Hong. 2013. Review of China’s low-carbon city initiative and developments in the coal industry. Berkeley, California: Lawrence Berkeley National Laboratory (LBNL-6151E).
National Development and Reform Commission, 2013. “Notice on Adjusting Natural Gas Prices”. June 28, 2013.
Ni, C. 2009. China Energy Primer. Berkeley, CA: Lawrence Berkeley National Laboratory (LBNL-2860E).
State Electricity Regulatory Commission of the People’s Republic of China, various years. Annual Report of Electricity Regulation. Beijing: State Electricity Regulatory Commission.
5. Emissions Intergovernmental Panel on Climate Change (IPCC). 2006. Revised 2006 IPCC Guidelines for National Greenhouse Gas Inventories: Reference Manual (Volume 3).
National Bureau of Statistics of the People’s Republic of China, various years. China Energy Statistical Yearbook. Beijing: China Statistics Press.
National Bureau of Statistics of the People’s Republic of China, various years. China Statistical Yearbook. Beijing: China Statistics Press.

65
Appendix 4: Data Sources (continued)
6. Economic and Demographic Indicators National Bureau of Statistics of the People’s Republic of China, various years. China Statistical Yearbook. Beijing: China Statistics Press.
7. International Comparison International Energy Agency (IEA). 2013. Key World Energy Statistics 2013. Paris, France: IEA.
8. Appendices: National Bureau of Statistics of the People’s Republic of China, 2013. 2012 China Energy Statistical Yearbook. Beijing: China Statistics Press.

66
The LBNL China Energy Group team responsible for this compilation of energy statistics of China includes David Fridley, Mark Levine, Hongyou Lu, and Cecilia Fino-Chen. The team wishes to acknowledge the following institutions for their support of this effort: • Energy Foundation China whose grants have enabled the China Energy
Group to collect many data sources in China and to augment the exper-tise needed to understand the data.
• Shenzhen Institute of Building Research
• Oak Foundation
We also acknowledge most of these same parties for the support of the much more extensive China Energy Databook. Instructions for obtaining the databook can be found on our website http://china.lbl.gov.
We plan to publish updates to this compilation annually or biannually. We are thus eager to learn about any errors you may find, suggestions for improvement, and the most important data additions you would like to see.
This work was supported by the U.S. Department of Energy under Contract No. DE-AC02-05CH11231.
Acknowledgments

Notes

Notes


For more information about the Berkeley Lab China Energy Group, please visit:
http://china.lbl.gov
15-EE-0998
EnvironmEntal EnErgy tEchnologiEs Division
China Energy Group
Lawrence BerkeleyNational Laboratory