kinetics of gypsum nucleation and crystal growth from...
TRANSCRIPT

Kinetics of gypsum nucleation and crystal growth from Dead Sea brine
Reznik Itay J. 1,2, Gavrieli Ittai 2 and Ganor Jiwchar 1
1 Department of Geological and Environmental Sciences, Ben-Gurion University of the Negev,
P. O. Box 653, Beer-Sheva 84105,Israel
2 Geological Survey of Israel, 30 Malkhe Israel, Jerusalem, 95501
Phone ++972-8-6472-651
Fax ++972-8-6472-997
E-mail [email protected]
WEB http://www.bgu.ac.il/~ganor/
The original publication is available at ScienceDirect:
http://dx.doi.org/10.1016/j.gca.2009.07.018
ABSTRACT
The Dead Sea brine is supersaturated with respect to gypsum (Ω=1.42).
Laboratory experiments and evaluation of historical data show that gypsum nucleation
and crystal growth kinetics from Dead Sea brine are both slower in comparison with
solutions at a similar degree of supersaturation. The slow kinetics of gypsum
precipitation in the Dead Sea brine is mainly attributed to the low solubility of
gypsum which is due to the high Ca2+/SO42- molar ratio (115), high salinity (~280
g/kg) and to Na+ inhibition.
Experiments with various clay minerals (montmorillonite, kaolinite) indicate
that these minerals do not serve as crystallization seeds. In contrast, calcite and
aragonite which contain traces of gypsum impurities do prompt precipitation of
gypsum but at a considerable slower rate than with pure gypsum. This implies that
transportation inflow of clay minerals, calcite and local crystallization of minerals in
the Dead Sea does not prompt significant heterogeneous precipitation of gypsum.
Based on historical analyses of the Dead Sea, it is shown that over the last decades, as
inflows to the lake decreased and its salinity increased, gypsum continuously
precipitated from the brine. The increasing salinity and Ca2+/SO42- ratio, which
results from the precipitation of gypsum, lead to even slower kinetics of nucleation
and crystal growth, which resulted in an increasing degree of supersaturation with
respect to gypsum. Therefore, we predict that as the salinity of the Dead Sea brine
continues to increase (accompanied by Dead Sea water level decline), although
gypsum will continuously precipitate, the degree of supersaturation will increase
furthermore due to progressively slower kinetics.

1 INTRODUCTION
The Dead Sea is a hypersaline terminal lake located in the Dead Sea Rift
valley. The lake's brine has a salinity of about 345 g/l (~280 g/kg) which is about an
order of magnitude higher than that of sea water. However, its composition is
significantly different from that of evaporated sea water with similar salinity. Relative
to evaporated sea water, the Dead Sea brine is enriched in Cl-, Br-, Mg2+, Ca2+ and K+
and depleted in Na+ and SO42-. In fact, the concentration of SO4
2- in the Dead Sea is
even lower than that in sea water, and it's Ca2+/SO42- ratio (115) is therefore extremely
high.
Since the 1930s the water level of the Dead Sea has receded dramatically,
resulting in a drop of nearly 30 meters. In recent years, in response to increased
diversion of freshwater from the lake's drainage basin, the rate of water level drop has
accelerated to 1-1.2 m yr-1. This water level decline causes environmental changes in
the region, such as receding shorelines, sinkhole formation and changes in the
chemical composition of the lake due to evaporation and precipitation of minerals
(Gavrieli, 2004).
A comprehensive limnological study of the Dead Sea carried out by Neev and
Emery (1967) in the late 1950s up to the early 1960s described massive gypsum
precipitation that was occurring from Dead Sea waters during the time. These
observations include: (a) ropes left hanging in the water column were coated with
gypsum crystals within a period of merely few weeks; (b) gypsum was found in
sediment traps; (c) considerable parts of the Dead Sea floor in the littoral zone were
covered with gypsum; and (d) suspended gypsum crystals were observed with the
unaided eye in water samples. The precipitation of gypsum in the late 1950s is in
accord with Stein et al., (1997) who suggested that during periods of negative water

balance massive gypsum precipitation occurred in the Dead Sea and its Late
Pleistocene precursor, Lake Lisan. However, by the early 1980s, gypsum
accumulation rates were lower by three orders of magnitude compared to the rates
recorded by Neev and Emery (1967) even though the negative water balance
continued and even worsened (Levy, 1987). The reduction in gypsum accumulation
rates may be attributed to the reduction in the natural supply of SO42- due to the
diversion of freshwater from the lake.
By the early 1980s, the Dead Sea has evaporated to the point that halite (NaCl)
started to precipitate (Steinhorn, 1983). Since then, it is the major precipitate from the
Dead Sea, and the phenomena described by Neev and Emery (1967) for gypsum are
presently observed with halite (Gavrieli, 1997). It was suggested that even if gypsum
precipitation still occurs in the Dead Sea it is masked by the higher quantities of
precipitated halite (Herut et al., 1998).
In addition to the precipitation in the Dead Sea itself, halite and gypsum also
precipitate in the artificial evaporation ponds constructed at the southern basin of the
Dead Sea by the chemical industries. Further evaporation of the brine leads to
precipitation of carnallite (KMgCl3.6H2O) which is harvested for the production of
potash. The residual concentrated brine is then returned to the Dead Sea.
Thermodynamic calculations based on Pitzer's equations (Krumgalz and
Millero, 1982; Krumgalz, 2001) show that despite the fact that gypsum precipitates in
the Dead Sea, the brine remains supersaturated with respect to gypsum (Katz et al.,
1981; Krumgalz and Millero, 1983; Gavrieli, 1997; Krumgalz, 1997). Currently, the
degree of saturation with respect to gypsum (DSG) is 1.42±0.08. The Dead Sea brine
is also supersaturated (degree of saturation, Ω>1) with respect to other SO42- minerals,
including anhydrite (CaSO4, Ω=1.94), barite (BaSO4, Ω=11.75) and celestite
(SrSO4, Ω=2.48). In contrast to the above SO42- phases, which maintain high
supersaturation in the Dead Sea brine, halite remains close to saturation,
(1≤Ω<1.1 (Gavrieli, 1997)).
The two basic processes of precipitation of minerals are: (1) nucleation, by
which a new phase is formed and (2) crystal growth during which the formed nuclei
and crystals continue growing. Most of the previous studies of gypsum nucleation
and crystal growth focused on industrial needs, where gypsum is usually an unwanted
scale deposit. Therefore, these studies focused on gypsum precipitation from solutions
with relatively low ionic strength, similar to the conditions in the industry (Edinger,
1973; Van Rosmalen et al., 1981; Christoffersen et al., 1982; Cody and Cody, 1989).
Most of these studies were conducted in solutions that contain equivalent
concentrations of Ca2+ and SO42- (Liu and Nancollas, 1970; Smith and Sweett, 1971;
Gill and Nancollas, 1979; Kagawa et al., 1981; Van Rosmalen et al., 1981;
Christoffersen et al., 1982; Witkamp et al., 1990; He et al., 1994b). The few studies
that examined gypsum nucleation and crystal growth in high ionic strength conditions,
did so in solution of ionic strength of only up to 6 m (mol kg H2O-1) (He et al., 1994a;
He et al., 1994b), which is still significantly lower than the ionic strength of the Dead
Sea brine (10 m).
1.1 The effect of evaporation and consequential precipitation on precipitation
kinetics
The kinetics of both nucleation and crystal growth depend on numerous
parameters, some of which are common to both. As a supersaturated solution
evaporates and minerals precipitate, the solution's chemistry, thermodynamic state
and precipitation kinetics are altered. During evaporation, the concentrations of the
dissolved ions increase, including the concentrations of the dissolved lattice ions and

possible catalysts and inhibitors. Precipitation on the other hand leads to decrease in
the concentrations of the dissolved lattice ions and may change their respective ratio
in the solution. Figure 1 schematically illustrates the affects of evaporation and
consequent mineral precipitation on the ionic strength, activity coefficients of the free
ions, formation of aqueous complexes, concentrations of lattice ions and lattice
cation/anion ratio and the resulting impacts on both degree of saturation and mineral
solubility. Mineral solubility may be defined as the molal concentration of a
mineral that is dissolved in a solution at saturation. For stoichiometric solutions, the
solubility is equal to the molal concentration of any of the lattice ions, divided by its
coefficient in the mineral formula. For non-stoichiometric solutions the solubility is
equal to the lowest amongst these quotients. Accordingly, maximal solubility (at a
given ionic strength and composition) is attained when the ratio between the dissolved
lattice ions equals that of the mineral. It follows that in the SO42--depleted Dead Sea
brine, gypsum solubility is defined as the concentration of SO42- at which the brine is
saturated with respect to gypsum.
Following evaporation, the increase in total concentration of the dissolved ions
leads to the formation of aqueous complexes, which may include the mineral lattice
ions, thereby increasing solubility and decreasing the degree of saturation (Fig. 1). At
low ionic strengths (up to ~1 m), activity coefficients of the free ions (including lattice
ions) decrease with increasing salinity. This leads to increase in solubility and
decrease in the degree of saturation of the mineral. Therefore, up to an ionic strength
of 1 m the effects of formation of aqueous complexes and variation in activity
coefficients are similar. At higher ionic strengths (>1 m) activity coefficients
generally increase with increasing salinity, thereby decreasing the solubility and

increasing the degree of saturation. Accordingly, at I>1 m the impact of ion
complexes on solubility counteracts that of increasing activity coefficient.
It is widely argued that higher solubility allows more impinging growth units
which results in faster precipitation kinetics (Brandse et al., 1977; Witkamp et al.,
1990; Zhang and Nancollas, 1992; Bosbach et al., 1996; Sheikholeslami and Ong,
2003). Specifically, gypsum nucleation and crystal growth kinetics was shown to
positively correlate with solubility both when the solubility is altered by increasing
the ionic strength of the solution (He et al., 1994a; He et al., 1994b) and by changing
the Ca2+/SO42- ratio (Zhang and Nancollas, 1992; Alimi and Gadri, 2004).
Another effect which influences crystal growth rate by retarding the
precipitation kinetics is adsorption of background electrolytes onto the forming
mineral. For example, Zhang and Nancollas (1992) suggested that Na+ and to a lesser
extent K+, adsorb onto the surface of gypsum, partially inhibiting its growth rate. As
salinity increases, adsorption may increase due to increased concentration, thereby
decreasing the precipitation rate.
Since most of the relationships presented in Fig. 1 between the various
variables and precipitation kinetics are interrelated and occur simultaneously with
evaporation and consequential precipitation, it is presently impossible to differentiate
and quantify the relative impact of each variable. Therefore, it is not possible to
predict a-priori the overall effect of evaporation and precipitation on gypsum
precipitation kinetics from Dead Sea brine.
The aim of the current study is to quantify, by combining laboratory
experiments, theoretical geochemical models and chemical data obtained from
historic and present measurements, the different parameters affecting the kinetics of
gypsum nucleation and crystal growth in the Dead Sea. This will enable us to
understand why the Dead Sea has remained supersaturated with respect to gypsum for
at least several decades and predict how the Dead Sea will evolve with respect to
gypsum in the future, if left to evaporate.
2 MATERIALS AND METHODS
2.1 Dead Sea Brine
Dead Sea brines were collected from various locations in the northern basin of the
Dead Sea. The brines were pumped from a depth of approximately 4 meters. The
collected brines were held in closed containers at room temperature (20-30˚C) for
several months. During this period, halite precipitated in the containers, probably due
to changes in solubility of the brine as a result of the temperature changes. Analyses
of SO42- concentrations close to the date of sampling and two months thereafter show
no difference (within measurement error) suggesting that gypsum did not precipitate
in the containers. Before introducing it into an experiment, the brine was filtered
through a 0.45μM Durapore membrane (milipore). Table 1 shows the average
chemical composition and DSG of the Dead Sea brines used in the experiments.
2.2 Experimental setting
2.2.1 Batch experiments:
Seeded batch experiments were carried out in 60 ml Teflon bottles, fully
immersed in a thermostatic water-bath held at a constant temperature of 25±0.1ºC.
The batch experiments were shaken once a day. Periodically, a 1 g sample was taken
using a syringe, filtered with a 0.45 μM filter disk and diluted for chemical analysis.
2.2.2 Flow-through experiments:
Experiments were carried out using stirred-flow reaction cells (ca. 35 ml) fully
immersed in a thermostatic water-bath held at a constant temperature of 25.0±0.1ºC

(Fig. 2). The reactors were composed of two chambers, a lower chamber of 33mm
inner diameter and an upper chamber of 26 mm inner diameter. The two chambers
were separated by a fine 5 μm nylon sieve. A submersed stir-plate controlled two
Teflon-coated stir bars. The first was mounted on the bottom of the cell and the
second was placed on the fine 5 μm mesh to improve the stirring of the upper cell. In
most of the experiments crystallization seeds were placed on the 5 μm mesh. The
sieve prevented the falling of the crystallization seeds to the lower chamber. The inlet
of the inflow Dead Sea brine was located at the lower chamber, while the outlet was
located in the upper chamber. A 0.45 μm mesh was mounted at the top of the cell in
order to prevent crystals from exiting the system. Flow rates were controlled by
peristaltic pumps. In any one run, the flow rate was held constant for a long enough
time for steady-state conditions to be closely achieved. Steady states were defined to
have been achieved when a series of outflow SO42- concentrations remained constant
(± 5%). After steady-state conditions were reached, precipitation rates were
evaluated. Most of the experiments consisted of one stage, i.e., the experiment was
stopped after steady state was approached.
2.3 Seed Material
Various minerals, most of which are naturally transported to or precipitate in
the Dead Sea, were used as seeds in the experiments, including gypsum, clay minerals
(montmorillonite and kaolinite), calcite and aragonite. These minerals were cleaned,
ground and sieved to retain a particle size fraction of 53-149 μM.
Gypsum crystal seeds were prepared from natural occurring selenite (gypsum)
collected from Machtesh Ramon in the Negev desert, Israel. X-ray diffraction (XRD)
of the clean sample showed no other mineral phases. Accordingly, chemical analysis
of the dissolved gypsum indicated that it contains only minor concentrations (<0.2%)
of elements other than Ca2+ and SO42-. Montmorillonite sample SAZ-1 and kaolinite
sample KGa-1b are international reference samples of the Clay Mineral Society
Source Clay Repository. SAZ-1 contains considerable amounts of silica phases
(quartz, cristobalite and/or amorphous silica) and minor quantities of alkali-feldspars,
plagioclase and carbonates (Metz et al., 2005). KGa-1b is an almost pure well-ordered
kaolinite, with a trace abundance of anatase (Pruett and Webb, 1993). Calcite
idiomorphic crystal obtained from Ward's Natural Sciences was found to contain
some quartz and gypsum impurities (<0.3%). Aragonite-rich sediments deposited by
Lisan Lake, the Late Pleistocene precursor of the Dead Sea, were collected from the
Lisan Formation near Massada, Dead Sea, Israel. The sediments contain mostly
aragonite with some quartz, calcite and gypsum impurities (Torfstein et al., 2008).
2.4 Analyses
Density of the inflow and outflow solutions was measured with a Paar digital
DMA-35 density meter. The uncertainty in the density measurement was ±0.0005 g
cm-3.
SO42- was analyzed using a Dionex's DX500 high pressure liquid chromatography.
Eluent solution containing 1.8 mM Na2CO3 and 1.7 mM NaHCO3 is pumped through
a guard column (AG4A-SC) and an anion column (AS4A-SC) at a flow rate of 2
ml/min. Approximately 5 ml of diluted Dead Sea solution (1:100) is injected using an
auto-sampler into a 25 μl feeding loop. Based on repeated analyses of SO42- standards,
we estimate the precision to be ± 3% (1 standard deviation).
Na+, K+, Ca2+, Mg2+, Ba2+ and Sr2+ were analyzed using Inductively Coupled
Plasma Atomic Emission Spectroscopy (ICP-AES). Cl- and Br- combined were
measured by a potentiometeric titration method, using a silver and calomel electrodes
with AgNO3 as the titrant. Br- was then measured by Inductively Coupled Plasma
Mass Spectrometry (ICP-MS) which enables the derivation of Cl- alone. The precision
of the analysis of all the major elements except SO42- is ±2%.
The specific surface area of the gypsum was measured by the Brunauer-Emmett-
Teller (BET) method (Brunauer et al., 1938), using 5-points of N2 adsorption
isotherms, with a Micromeritics Gemini II-2375 surface area analyzer. BET surface
area was determined after an outgassing period of ten days at a temperature of 40ºC.
The relatively low temperature for the outgassing procedure was selected in order to
avoid dehydration of gypsum and transformation into bassanite or anhydrite (Billo,
1986; Deutsch, 1994). The BET-determined initial specific surface area of the
gypsum seeds used for the experiments is 0.41±0.06 m2 g-1. The mineralogical
compositions of the seeds were characterized by X-ray diffraction (XRD) using a
Philips PW1700 diffractometer.
3 CALCULATIONS
3.1 Gypsum precipitation kinetics
Gypsum precipitation and dissolution reaction is expressed by:
(1) OHSOCaOHCaSO 224
224 22 ++⇔⋅ −+ .
In a well-mixed flow-through system where gypsum precipitates, the change in
concentration of the products with time (mol kg solution-1 s-1), is obtained from the
following mass balance equation:
(2) )( ,,,
injoutjroutj CC
Vq
VS
jRatedt
dC−
⋅−
⋅⋅⋅−=
ρρν ,
where Cj,in and Cj,out are the concentrations of component j (SO42- or Ca2+) in the
inflow and the outflow solutions (mol kg solution-1) respectively; νj is the
stoichiometry coefficient of j in the precipitation reaction; Rate is the precipitation
rate (mol m-2 s-1); t is time (s); Sr is the overall surface area of the mineral (m2); V is
the volume of the cell (m3) and q is the fluid weight flux through the system (kg s-1).
Note that in this formulation, the rate is defined to be positive for precipitation and
negative for dissolution.
Rearranging Eq. (2) gives:
(3) )( ,,,
injoutjrr
outj CCSq
SV
dtdC
jRate −−⋅⋅−=⋅ ρν .
Under steady state conditions, when the composition of the outflow solution reaches a
constant value, i.e. ⎟⎟⎠
⎞⎜⎜⎝
⎛= 0,
dtdC outj , the precipitation rate may be obtained as follows:
(4) )( ,, injoutjr
CCSq
jRate −−=⋅ν .
In the seeded experiments, gypsum growth was small relative to the original seeding
and therefore did not considerably affect the available surface area.
3.2 Gibbs free energy
The deviation from equilibrium with respect to gypsum precipitation is
calculated in terms of the Gibbs free energy (ΔGr):
(5) )ln(ln DSGRTKIAPRTG
eqr =⎟
⎟⎠
⎞⎜⎜⎝
⎛=Δ ,
where R is the gas constant (J K-1 mol-1); T is the temperature (K); IAP and Keq are the
ion activity product and the thermodynamic solubility product, respectively, and DSG
is the degree of saturation with respect to gypsum.
Taking the activity of the reactant solid gypsum in Eq. (1) to be 1, the ion activity
product of the precipitation reaction is:
(6) 1
22
24
2 OHSOCaaaa
IAP⋅⋅
=−+
,
where ai is the activity of constituent i. The activities are strongly dependent on the
composition and ionic strength of the solution. In the present work they are
calculated, along with the DSG values, using Pitzer's approach provided by the

PhreeqC code (Parkhurst and Appelo, 2007). Reznik et al. (2009) showed
experimentally that the PhreeqC code correctly calculates the DSG values in Dead
Sea brine, despite their unique composition and extremely high ionic strength. The
uncertainty in the calculated DSG for the Dead Sea brine is ±8% (1 standard
deviation). This uncertainty is derived from the analytical uncertainties of the
different ions used to calculate DSG.
4 RESULTS AND DISCUSSION
Eleven flow-through experiments were conducted (Table 2). Residence time
of the solutions in contact with the crystals ranged between 6-14 hours. The
precipitation rates presented in Table 2 were calculated according to Eq. (4). In order
to allow a longer residence time, six long term (~100 days) batch experiments were
conducted, using the same Dead Sea brine sample. The SO42- concentration of the
Dead Sea brine sampled was 3007±27 μmol kg solution-1 (n=12) and its initial DSG
was calculated to be 1.36±0.11 (Table 3).
4.1 Impact of crystallization seeds on gypsum precipitation
4.1.1 Gypsum seeding and control (no seeding) experiments
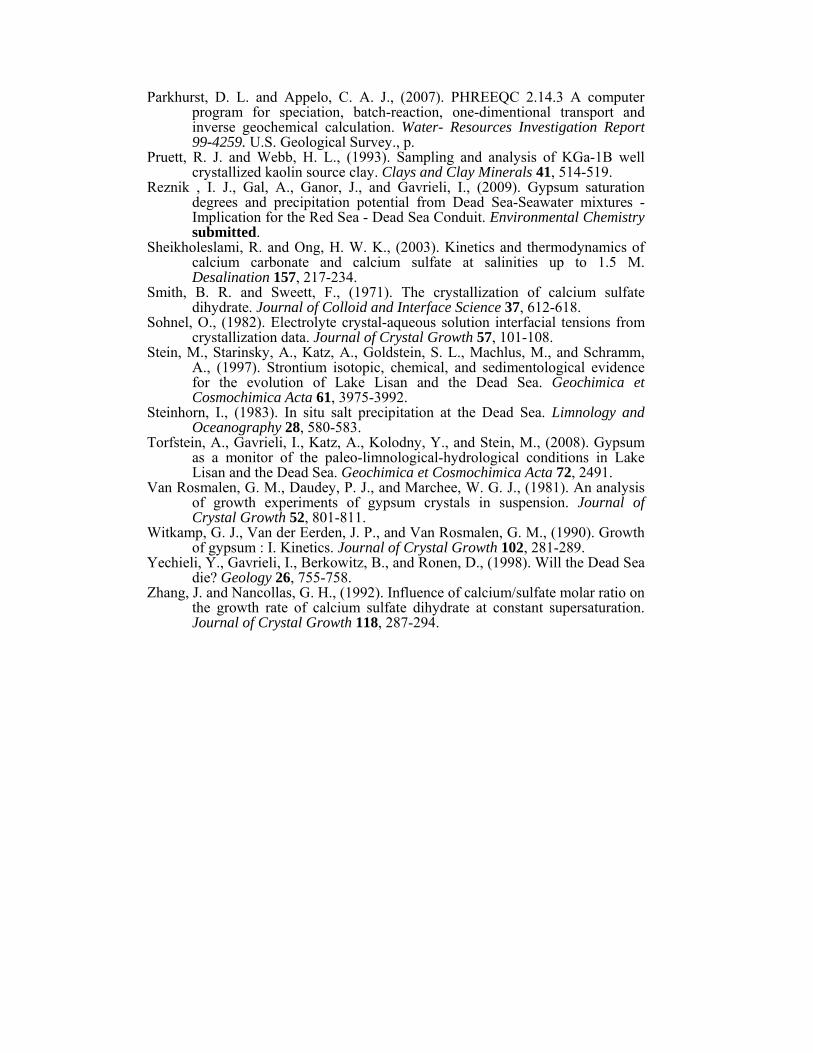
SO42-
concentrations in the inflow and outflow solutions of two flow-through
experiments performed with a relatively high amount of gypsum crystallization seeds
(2 g, experiment AN) and with no crystallization seeds (experiment AO), are shown
in Fig. 3. No change in the brine's chemical composition was detected in the
experiment with no seeding, whereas the decrease in SO42- concentration in the

seeded experiment testifies to gypsum precipitation in the presence of crystallization
seeds.
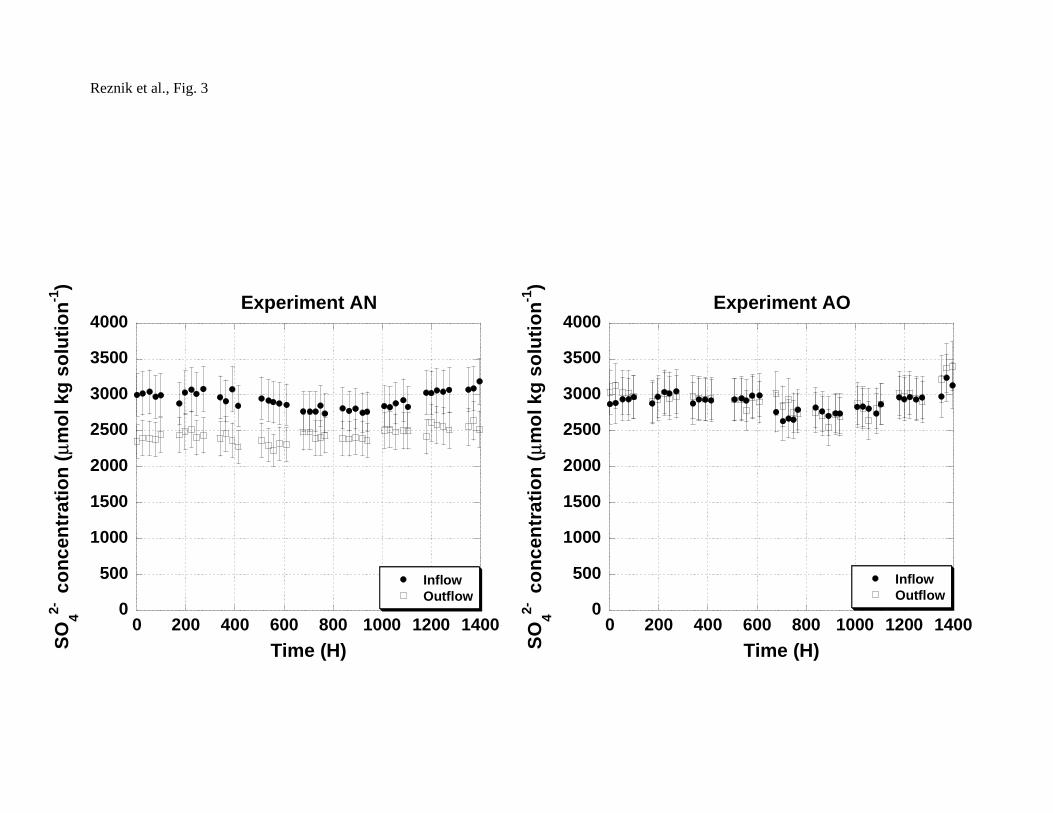
The same experimental concept was repeated using a batch apparatus (Fig. 4).
Less than 24 hours after the introduction of gypsum crystals, the brine reached
equilibrium (DSG=1.00±0.08). This shows that when enough gypsum crystallization
seeds are present, the brine reaches equilibrium within a short time. In the control
experiment (no seeding), a change in SO42- concentration was observed after about 80
days, indicating that gypsum nucleation from Dead Sea brine is very slow. The
control experiment remained supersaturated with respect to gypsum even after more
than 100 days.
4.1.2 Seeding experiments with minerals other than gypsum
In order to examine if other minerals may serve as crystallization seeds for the
precipitation of gypsum from Dead Sea brine, a set of flow-through experiments were
conducted containing various other potential crystallization seeds (Table 2). In all
flow-through experiments with minerals other than gypsum, the difference between
the inflow and outflow SO42- concentrations (Δsulfate) was less than the analytical
uncertainty (~±50 μmol kg solution-1). These observations indicate that gypsum
precipitation did not occur during the course of the flow-through experiments that
contained minerals other than gypsum (within analytical limitations).
In the batch experiments (Fig 4), no difference was found between the control
experiment and experiments conducted with montmorillonite and kaolinite, indicating
that these minerals do not prompt precipitation of gypsum. A change in composition
was noticed when calcite and aragonite were added. However, these minerals were
found to contain gypsum impurities which probably prompted the precipitation. As
calcite was reported by Gill and Nancollas (1979) to be a suitable substrate for
gypsum, heterogeneous growth on calcite may be an alternative reason to explain the
decrease in SO42- in this experiment (Fig 4).
The fact that gypsum precipitation was noticed in the batch experiments that
included the calcite and aragonite and not in the flow-through experiments is
attributed to difference in the residence times of the solutions. It follows that the rate
of gypsum precipitation in experiments conducted with minerals other than gypsum is
immeasurable for short residence times such as that in the flow-through experiments.
4.2 Parameters affecting heterogeneous crystal growth rates
Since crystal growth is a surface reaction, the precipitation rate depends on the
surface area:
(7) mSkSkRate shetrhethet ⋅⋅=⋅= '' ,
where hetRate is the heterogeneous crystal growth rate (mol s-1); hetk ' is an apparent
heterogeneous rate constant (mol s-1 m-2); Sr is the total reactive surface area (m2); Ss
is the specific surface area (m2 g-1) and m is the mass of gypsum (g). Rearranging
Eq. (7) while taking into account that the apparent heterogeneous rate constant
depends on the degree of deviation from equilibrium, gives:
(8) )( rhets
het GfkmS
Rate Δ⋅=⋅
,
where hetk is the heterogeneous rate constant (mol s-1 m-2) and f(ΔGr) is a function
describing the dependency of the growth rate on deviation from equilibrium.
When crystal growth or dissolution involves surface defects, the function
f(ΔGr) takes the typical form (Lasaga, 1998):
(9) ( )n
nr
r DSGRTGGf 11exp)( −=⎟⎟
⎠
⎞⎜⎜⎝
⎛ −⎟⎠⎞
⎜⎝⎛ Δ=Δ
,

where n is the apparent reaction order with respect to the deviation from equilibrium
(DSG-1). Merging Eq. (9) and Eq. (8) yields the following expression which describes
the normalized heterogeneous growth rate:
(10) nhet
s
het DSGkmS
Rate )1( −⋅=⋅
.
Equations (9) and (10) apply for solutions in which the dissolved lattice activity ratios
are similar to the stoichiometries of the precipitating minerals. A more rigorous rate
equation for crystal growth, which applies for both stoichiometric and non-
stoichiometric solutions was shown by Nielsen (1981):
(11) nhet
s
het DSGkmS
Rate)1('' 1 −⋅=
⋅υ ,
where υ is the number of molecules in a formula unit of the crystal, other than the
solvent (two in the case of gypsum). For stoichiometric solutions, khet in the rate law
of Eq. (10) is linearly proportional to k''het in Eq. (11).
The Burton Cabrera and Frank (BCF) crystal growth theory (Burton et al.,
1951) calculates the balance between the attachment and detachment of molecules
(adatoms) on the mineral surface during a spiral growth of a step, which is initiated by
a screw dislocation. According to the BCF theory n=2 for spiral growth (Lasaga,
1998).
Experimental studies showed that the bulk growth rate of gypsum (the sum of
growth on all crystallographic surfaces) at low ionic strength solutions with small
deviation from equilibrium (low degrees of supersaturation) is a second order reaction
(n=2) (Liu and Nancollas, 1970; Liu and Nancollas, 1973; Christoffersen et al., 1982;
Amjad, 1985; Witkamp et al., 1990). For higher degrees of supersaturation, the order
of the crystal growth reaction increases up to 3.5 (Brandse et al., 1977). The reaction
order may be affected by background electrolytes as well: in solutions containing
NaNO3 (1 mol kg solution-1) the reaction order increases with increasing
supersaturation (Witkamp et al., 1990). However, other electrolytes, such as NaCl (up
to 6 m), have no effect on the order of gypsum growth rate and it remains a second
order reaction (He et al., 1994b). Although most overall growth rate studies describe a
second order reaction, several microscopic studies show no evidence for spirals on the
dominant surface (Van Rosmalen et al., 1981; Bosbach and Rammensee, 1994; Hall
and Cullen, 1996). Thus, an alternative mechanism was suggested by which gypsum
grows in a layer-by-layer mechanism, which may also account for a second order
reaction (Goto and Ridge, 1967; Van Rosmalen et al., 1981; Bosbach and
Rammensee, 1994).
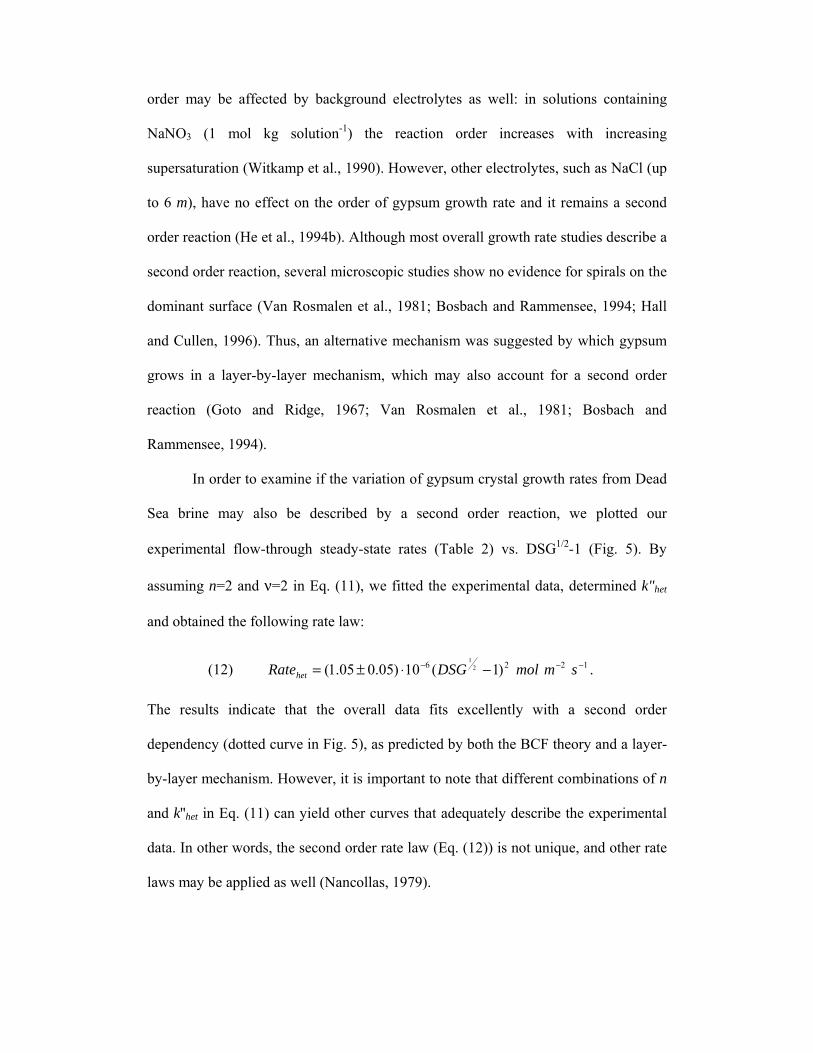
In order to examine if the variation of gypsum crystal growth rates from Dead
Sea brine may also be described by a second order reaction, we plotted our
experimental flow-through steady-state rates (Table 2) vs. DSG1/2-1 (Fig. 5). By
assuming n=2 and ν=2 in Eq. (11), we fitted the experimental data, determined k"het
and obtained the following rate law:
(12) 1226 )1(10)05.005.1( 21 −−− −⋅±= smmolDSGRatehet .
The results indicate that the overall data fits excellently with a second order
dependency (dotted curve in Fig. 5), as predicted by both the BCF theory and a layer-
by-layer mechanism. However, it is important to note that different combinations of n
and k''het in Eq. (11) can yield other curves that adequately describe the experimental
data. In other words, the second order rate law (Eq. (12)) is not unique, and other rate
laws may be applied as well (Nancollas, 1979).

4.3 Nucleation and crystal growth kinetics from Dead Sea brine
In the control batch experiment (Fig. 4), decrease in the SO42- concentration of
the Dead Sea brine was first detected only after approximately 80 days. In contrast, in
solutions of much lower ionic strength but with similar degrees of supersaturation
such a change occurs within a much shorter time scale, ranging from a few hours
(Packter, 1974; Lancia et al., 1999; El-Shall. et al., 2002) to a day (He et al., 1994a).
A similar trend is shown for crystal growth rates. A comparison of the crystal growth
rates of gypsum from Dead Sea brine with the results of Zhang and Nancollas (1992)
who conducted crystal growth experiments using synthetic NaCl solutions at much
lower ionic strength solutions, reveal that for the same degrees of supersaturation, the
precipitation rate (mol s-1 m-2) from Dead Sea brine is slower by at least one order of
magnitude.
We suggest that the slow nucleation in the Dead Sea brine is due to the low
solubility which derives from the high Ca2+/SO42- ratio and high ionic strength. In
pure water, gypsum solubility is ~15500 μm (Ca2+/SO42- = 1:1), while in the Dead Sea
brine, gypsum solubility is only ~3200 μm. The low solubility leads to an increased
interfacial energy and to a slow rate of nucleation. The low solubility also leads to a
reduced rate of crystal growth. The rate of crystal growth is also reduced due to the
inhibitory effect of Na+. Furthermore, lack of suitable crystallization seeds prevents
crystal growth from taking place, thereby forcing the system to be limited by the rate
of nucleation and suspension time of the crystals in the brine. Elaboration on the
effects of each parameter is given below.

4.3.1 Interfacial energy effect on nucleation
According to the classic nucleation theory, the induction time (tind) for the
formation of a critical nucleus in a system is described by (He et al., 1994a):
(13) CDSGLogBtind −= 2)(
log ,
where C is a constant and B is defined as:
(14) 3
23
)3.2()(
RTfNV
B Am ϑβσ= ,
where β is a geometric factor (16π/3 for a spherical nucleus), σ is the interfacial
tension between the crystal and the aqueous solution (J m-2), mV is the molar volume
of gypsum (74.69 cm3 mol-1), AN is Avogadro's number, )(ϑf is the correction
factor for heterogeneous nucleation (0.01 for heterogeneous nucleation and 1 for
homogeneous nucleation). The interfacial tension is related to the solubility (Nielsen
and Sohnel, 1971; Sohnel, 1982):
(15) FCA s +−= logσ ,
where A (J m-2 m-1) and F (J m-2) are constants for a specific solution and sC (m-1) is
the mineral's solubility.
According to Eq. (15), as solubility decreases, the interfacial tension (σ )
increases. A higher σ poses a high energetic barrier, thereby reducing the statistical
chance for the creation of a stable nucleus. This leads to a longer induction time and a
slower nucleation rate.
4.3.2 The effects of ionic strength, Ca2+/SO42- ratio and Na+ concentration on
crystal growth rates
As discussed in the introduction, increasing the ionic strength in high ionic
strength solutions reduces the solubility, which results in slower kinetics. In addition,
Zhang and Nancollas (1992) showed that at a given degree of saturation (DSG=1.69),
gypsum precipitation rate from 1 m NaCl solutions decreases linearly with increasing
log of Ca2+/SO42- (Fig. 6). Thus, the rate of crystal growth is not merely a function of
the thermodynamic driving force, but also depends upon the relative concentration
and characteristics of the individual ions. Moreover, Zhang and Nancollas (1992),
suggested that Na+, and to a lesser extent K+, adsorbs onto the surface of gypsum,
partially inhibiting its growth rate. Despite the differences in compositions between
Dead Sea brine and the NaCl solutions that Zhang and Nancollas (1992) worked with,
gypsum precipitation rate from Dead Sea brine (corrected to DSG=1.69 according to
Eq. (12)) agrees well with the extrapolation of Zhang and Nancollas's (1992) data
(triangle in Fig. 6 ). Based on this extrapolation, we suggest that the main parameters
that retard the rate of crystal growth in Dead Sea brine is the high Ca2+/SO42- ratio and
high Na+ concentration.
4.3.3 Lack of available crystallization seeds
Heterogeneous precipitation rate is limited by the nucleation rate. However, if
suitable crystallization seeds are introduced, heterogeneous precipitation will be
promoted. Previous studies found that anhydrite, hemihydrate, gypsum, barite and
calcite substrates encourage heterogeneous precipitation of gypsum (Gill and
Nancollas, 1979; Kagawa et al., 1981). In this study precipitation of gypsum was
promoted by the presence of calcite and aragonite. However, these phases were found

to contain gypsum impurities. Nevertheless, despite the very high seed/brine ratio, the
solution remained supersaturated even after 4 months, probably due to a limited
available surface area of gypsum in these samples. Thus, neither calcite nor aragonite
is as favored as pure gypsum.
We conclude that in the Dead Sea nucleation rates of gypsum are slow and
that natural transported sediments (air borne dust and detritus) are not suitable for
serving as efficient crystallization seeds. Since the Dead Sea remains supersaturated
with respect to gypsum we assume that both these processes have little impact on the
Dead Sea's chemistry. Therefore, we suggest that the relatively few nuclei that do
form in the Dead Sea, grow relatively fast and due to crystal size, settle rapidly to the
sea floor, where they are buried and do not continue to serve as crystallization seeds.
Since the nucleation rate is slower relatively to the crystal growth rate, at any given
time the water body contains limited amount of gypsum crystals. It follows that both
the in situ formation and the external transport of surfaces on which gypsum can grow
is insufficient to promote enough gypsum precipitation to decrease gypsum
supersaturation in the Dead Sea.
4.4 Precipitation of gypsum in the Dead Sea, past, present and future
Since the Dead Sea is a terminal lake, the major natural process that removes
dissolved ions from the brine is mineral precipitation. A comparison between current
and 1960 mass of dissolved ions (based on chemical compositions and lake's volume,
Table 1 & Table 4), shows that a significant decrease in Na+ and SO42- quantities
occurred due to the precipitation of halite and gypsum, respectively. A proportionally
smaller decrease was observed for Cl-, which is due to its relatively high
concentrations in comparison to Na+. Similarly, Ca2+ concentration is not sensitive to
the precipitation of gypsum because of the high Ca2+/SO42- ratio and low precipitation
potential (the maximal amount of gypsum that can precipitate until attainment of
equilibrium). Thus, no measurable change is detected in the weight of dissolved Ca2+
since 1960. Although anthropogenic induced precipitation of carnellite occurred
extensively in the evaporation ponds of the chemical industries since 1960, K+ only
decreased by ~5% while Mg2+, which has a much higher concentration and is
harvested to a lesser extent by the industry has not changed within measurement error
(most of the Mg2+ that is pumped by the factories is returned to the Dead Sea).
Using the values presented in Table 4, ~ 81036 ⋅ ton of halite precipitated from
the Dead Sea brine between 1960 and 2008. Assuming that this mass is spread
homogeneously on the seafloor, it has by now accumulated to a thickness of ~2.5m.
Following the same line of reasoning, 61020 ⋅ tons of SO42- has precipitated since
1960, resulting in a reduction of ~27% in the mass of dissolved SO42- in the lake. If all
this mass precipitated as gypsum, ~ 61035 ⋅ tons of gypsum precipitated on the
seafloor, accumulating to a total thickness of only ~2.5 cm, i.e. 2 orders of magnitude
less than the halite accumulation. It should however be noted that the above values
represent a maximal thicknesses, since some of the Na+ and SO42- were removed from
the brine as gypsum and halite that precipitated in the evaporation ponds of the
chemical industries.
The average rate at which SO42- concentration decreased between 1960 and
2008 is ~35 μmol kg H2O-1 per year. Thus, in order to detect changes in SO42-
concentrations in the lake, at least 4 years are required before the change exceeds the
range in the analytical error of ~±140 μm-1 (1 standard deviation). Even if the rate of
concentration decrease will remain constant over years to come, the quantities of
precipitated gypsum are expected to decrease since the Dead Sea volume decreases
with time.

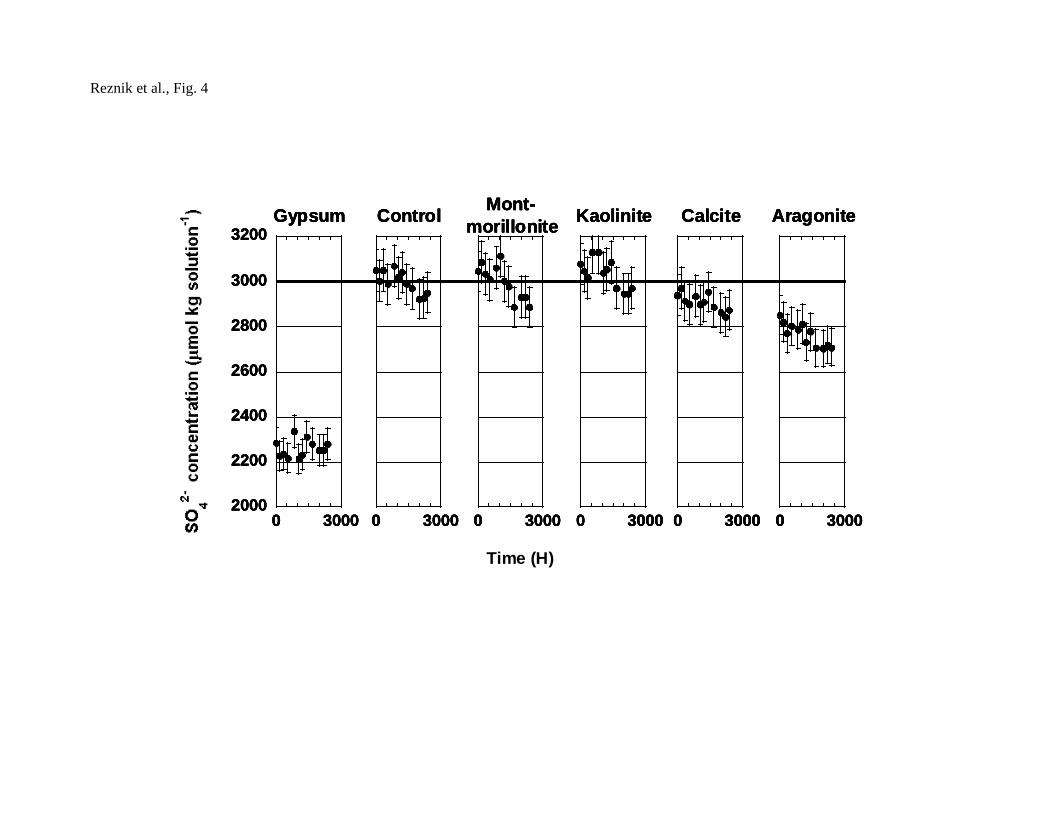
Neev and Emery (1967) showed a strong inverse linear relationship between
density and SO42- concentrations, attained from historic measurements of the Dead
Sea brine between the years 1919-1960. This relationship is extended in the present
study (Fig. 7) by adding more recent density and chemical data. Data for figures 7-10
consist of several groups: Diluted Dead Sea solutions with a density lower than the
current bulk value, Dead Sea values measured between 1980-2008, and end brines
which are returned to the Dead Sea after the industrial process is over and serve as a
proxy for the future Dead Sea upon its continued evaporation. Several other points
were added to the graphs: bulk composition in 1960 (Table 1), upper water mass
(UWM) in 1960 and lower water mass (LWM). Since gypsum precipitation has only
negligible impact on Ca2+ content in the Dead Sea, Ca2+ concentrations are
proportional to the density of the solution (Fig. 8). As a result, the Ca2+/SO42- ratio
increases with density (Fig. 9). (Neev, 1964; Neev and Emery, 1967; Gavrieli et al.,
1994; Gavrieli, 1997)
As discussed above, the increasing Ca2+/SO42- ratio and salinity (in this range
of ionic strength) decrease the solubility of gypsum. We showed that according to
both theoretical considerations and experimental observations, the kinetics of gypsum
nucleation and crystal growth are expected to slow down as the solubility decreases. If
the kinetics is indeed slower, it is expected that the Dead Sea brine will be able to
retain a higher degree of supersaturation as the brine evaporates further. Indeed, since
1960 (when Ca2+/SO42- ratio was 86 and solubility was ~4500 μmol kg H2O-1) DSG
increased from 1.20 to the current value of 1.42 (Ca2+/SO42-=115 and solubility ~3200
μm-1). Moreover, Figure 10 shows that as Dead Sea brine becomes more concentrated,
DSG increases up to values of 2.75 at a density of ~1.35. The trend shown in figure
10 represents a balance between the increase in DSG due to evaporation and the

decrease in DSG due to precipitation of gypsum. Since the trend strongly depends on
the residence time of the system, extrapolation should be carefully considered.
Furthermore, if the mechanism of either the nucleation or crystal growth precipitation
would change with increasing DSG's, the trend of DSG vs. density may change.
Due to the decrease in the water activity of the brine with increasing salinity,
the Dead Sea cannot desiccate completely (Yechieli et al., 1998; Krumgalz et al.,
2000). We suggest that DSG will continue to rise as long as the lake experiences
negative water balance, volume decrease and an overall salinity increase. Maximum
DSG will be reached when a new steady state between inflow and evaporation is
attained. From that point in time, DSG values would decrease at a very slow rate, in
accordance with precipitation kinetics until the attainment of very close to equilibrium
conditions.
5 SUMMARY AND CONCLUSIONS
The kinetics of gypsum nucleation and crystal growth in the Dead Sea brine
(DSG=1.42) are slow compared to other solutions with similar degrees of
supersaturation. Although precipitation of gypsum occurs in the lake as a result of its
constant evaporation, the Dead Sea supersaturation with respect to gypsum increased
over the last few decades. Laboratory experiments presented here show that present-
day Dead Sea brine can remain supersaturated for a prolonged period of time if no
suitable crystallization seeds are available. Although gypsum does nucleate in the
Dead Sea, the crystals sink relatively fast through the water column and do not serve
as readily available crystallization seeds. Furthermore, the natural flux of clay and
carbonate minerals into the lake is insufficient to prompt significant heterogeneous
growth of gypsum.

Figure 1 summarized the possible effects of evaporation and consequential
precipitation on the precipitation rate of minerals. For the case of the high ionic
strength Dead Sea brine, the solubility is low due to a combined effect of high activity
coefficients of the free ions (>1) and high Ca2+/SO42- ratio (115) which overrides the
contradictory effect of aqueous complexes. Adsorption of Na+ and K+ (1.5 m and 0.2
m, respectively, in the Dead Sea brine) onto the gypsum's surface leads to a decrease
in precipitation rates as well.
As the Dead Sea will continue to evaporate, gypsum will continue to
precipitate from the brine, thereby further increasing the ionic strength and Ca2+/SO42-
ratio and reducing the solubility. Further evaporation will also lead to higher
concentration of inhibiting cations. As the solubility will decrease and inhibitor
concentration will increase, both the kinetics of nucleation and crystal growth will
slow down, resulting in a solution that will maintain increasingly higher degrees of
supersaturation.
Acknowledgments. This research was supported by the Israeli Ministry of
National Infrastructure (grants #ES-38-2005 and #ES-28-2006 to JG and IG) and by
the Israel Science Foundation (grant #902/05 to IG). I. J Reznik is grateful to the
Rieger Foundation – JNF Program for Environmental Studies and to the Water
Authority of Israel for their generous support. We thank the associate editor, Timothy
W. Lyons, for handling the manuscript and for his fruitful comments as well as David
Fike and an anonymous reviewer for their thorough review of the manuscript. We
wish to express our gratitude to G. Antler, Y. Tubul, T. Feldt and K. Stein for their
technical assistance.
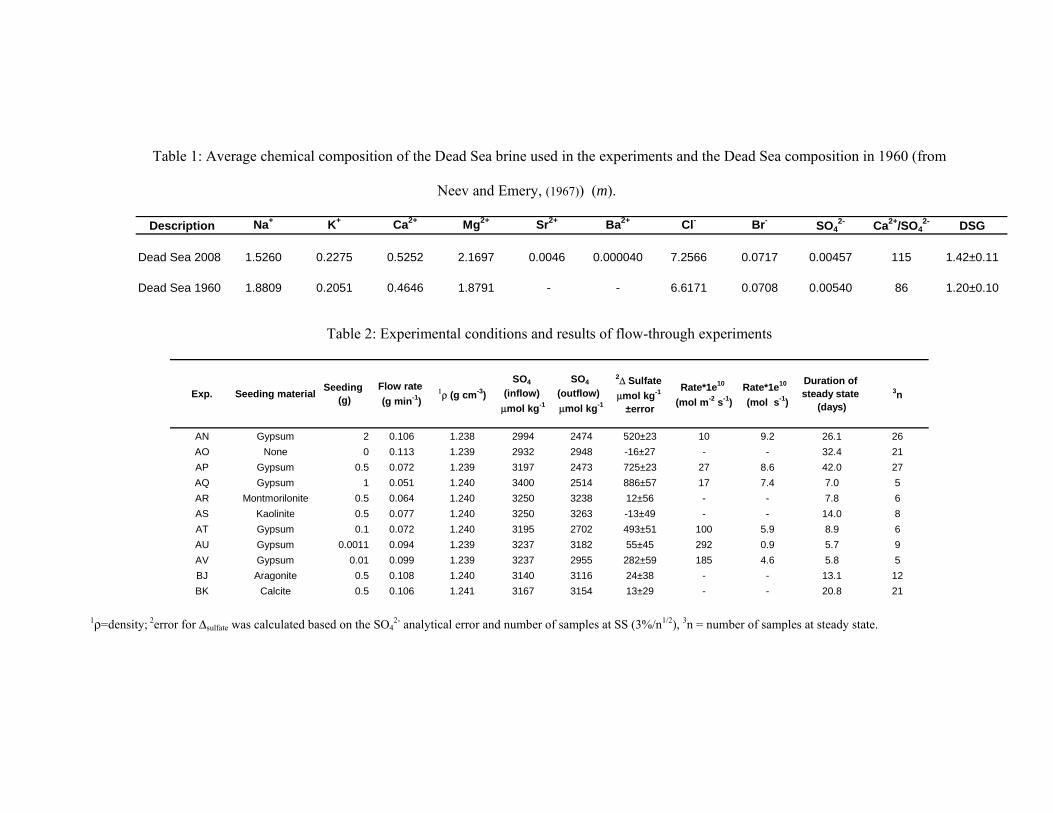
Table 1: Average chemical composition of the Dead Sea brine used in the experiments and the Dead Sea composition in 1960 (from
Neev and Emery, (1967)) (m).
Description Na+ K+ Ca2+ Mg2+ Sr2+ Ba2+ Cl- Br- SO42- Ca2+/SO4
2- DSG
Dead Sea 2008 1.5260 0.2275 0.5252 2.1697 0.0046 0.000040 7.2566 0.0717 0.00457 115 1.42±0.11
Dead Sea 1960 1.8809 0.2051 0.4646 1.8791 - - 6.6171 0.0708 0.00540 86 1.20±0.10
Table 2: Experimental conditions and results of flow-through experiments
Exp. Seeding material Seeding (g)
Flow rate (g min-1)
1ρ (g cm-3) SO4
(inflow) μmol kg-1
SO4 (outflow) μmol kg-1
2Δ Sulfate μmol kg-1
±error
Rate*1e10 (mol m-2 s-1)
Rate*1e10 (mol s-1)
Duration of steady state
(days)3n
AN Gypsum 2 0.106 1.238 2994 2474 520±23 10 9.2 26.1 26AO None 0 0.113 1.239 2932 2948 -16±27 - - 32.4 21AP Gypsum 0.5 0.072 1.239 3197 2473 725±23 27 8.6 42.0 27AQ Gypsum 1 0.051 1.240 3400 2514 886±57 17 7.4 7.0 5AR Montmorilonite 0.5 0.064 1.240 3250 3238 12±56 - - 7.8 6AS Kaolinite 0.5 0.077 1.240 3250 3263 -13±49 - - 14.0 8AT Gypsum 0.1 0.072 1.240 3195 2702 493±51 100 5.9 8.9 6AU Gypsum 0.0011 0.094 1.239 3237 3182 55±45 292 0.9 5.7 9AV Gypsum 0.01 0.099 1.239 3237 2955 282±59 185 4.6 5.8 5BJ Aragonite 0.5 0.108 1.240 3140 3116 24±38 - - 13.1 12BK Calcite 0.5 0.106 1.241 3167 3154 13±29 - - 20.8 21
1ρ=density; 2error for Δsulfate was calculated based on the SO42- analytical error and number of samples at SS (3%/n1/2), 3n = number of samples at steady state.

Table 3: Experimental conditions and results of batch experiments
Seeding Material
Seeding (g)
DS weight (g)
Initial SO42-
concentration (μmol kg-1)
Final SO42-
concentration (μmol kg-1)
Δ SO42-
concentration (μmol kg-1)
Initial DSG Final DSG
Aragonite 1.0255 58.889 3007 2707 300 1.36 1.19Calcite 0.9924 58.846 3007 2873 134 1.36 1.27
Montmorilonite 0.9943 59.117 3007 2885 122 1.36 1.27Kaolinite 1.0037 58.997 3007 2951 56 1.36 1.30Gypsum 1.0087 58.905 3007 2279 728 1.36 1.00Control 0 59.967 3007 2970 37 1.36 1.31
Table 4 : Masses of dissolved ions in Dead Sea brine
Description Na+ K+ Ca2+ Mg2+ Cl- Br- SO42- Volume (km3)
Dead Sea 2008 4.1 1.04 2.46 6.15 30.0 0.67 0.051 130
Dead Sea 1960 5.9 1.09 2.53 6.20 31.9 0.77 0.071 148
Difference 1960-2008 1.8±0.1 0.05±0.03 0.074±0.074 0.05±0.18 1.9±0.9 0.1±0.02 0.019±0.002
Decrease since 1960 30% 5% no change no change 6% 13% 27% 12%
(Tons x 109)

6 FIGURE CAPTIONS
1 Fig. 1 Schematic illustration of the effects of evaporation and mineral
precipitation on chemical parameters of the solution and the
consequent impact on the precipitation kinetics. A "+" sign denotes
an increase of a parameter (e.g., "R+" denotes an increase in
precipitation rate), while a "-" sign denotes a decrease of it. See the
legend for details.
2 Fig. 2 Flow-through experimental setup.
3 Fig. 3 Inflow and outflow SO42- concentrations over time in flow-through
experiments conducted with gypsum crystallization seeds
(experiment AN) and with no crystallization seeds (experiment
AO).
4 Fig. 4 SO42- concentrations as a function of time in batch experiments
containing different seeding material. The solid line represents the
initial SO42- concentration for all experiments.
5 Fig. 5 The effect of deviation from equilibrium on precipitation rates of
gypsum (mol m-2 s-1) in flow-through experiments with Dead Sea
brine.
6 Fig. 6 The effect of Ca2+/SO42- molar ratio on gypsum precipitation rate.
Most of the data (squares) are from Zhang and Nancollas, (1992).
The curve was fitted only for these points. The datum for the Dead
Sea brine (triangle) is from the present study. All the rate data are
corrected to DSG of 1.69.
7 Fig. 7 Inverse linear relationship between SO42- concentrations and density
in Dead Sea brines and their derivatives. UWM and LWM stand for
the 1960 upper and lower Dead Sea water masses, respectively.
8 Fig. 8 Ca2+ concentrations vs. density of Dead Sea brines and their
derivatives.

9 Fig. 9 Ca2+/SO42- ratio vs. density in Dead Sea brines and their derivatives.
10 Fig. 10 DSG vs. density in Dead Sea brines and their derivatives.
7 REFERENCES
Alimi, F. and Gadri, A., (2004). Kinetics and morphology of formed gypsum. Desalination 166, 427-434.
Amjad, Z., (1985). Applications of antiscalants to control calcium sulfate scaling in reverse osmosis systems. Desalination 54, 263-276.
Billo, S. M., (1986). Petrology and kinetics of Gypsum-Anhydrite transitions. Journal of Petroleum Geology 10, 73-86.
Bosbach, D., Junta-Rosso, J. L., Becker, U., and Hochella, M. F., (1996). Gypsum growth in the presence of background electrolytes studied by Scanning Force Microscopy. Geochimica et Cosmochimica Acta 60, 3295-3304.
Bosbach, D. and Rammensee, W., (1994). In situ investigation of growth and dissolution on the (010) surface of gypsum by Scanning Force Microscopy. Geochimica et Cosmochimica Acta 58, 843-849.
Brandse, W. P., Vanrosmalen, G. M., and Brouwer, G., (1977). The influence of sodium-chloride on crystallization rate of gypsum. Journal of Inorganic and Nuclear Chemistry 39, 2007-2010.
Brunauer, S., Emmett, P. H., and Teller, E., (1938). Adsorption of gases in multimolecular layers. Journal of American Chemical Society 60, 309-319.
Burton, W. K., Cabrera, N., and Frank, F. C., (1951). The growth of crystals and the equilibrium structure of their surfaces. Philosophical Transactions of the Royal Society London 243, 299-358.
Christoffersen, M. R., Christoffersen, J., Weijnen, M. P. C., and Van Rosmalen, G. M., (1982). Crystal growth of calcium sulphate dihydrate at low supersaturation. Journal of Crystal Growth 58, 585-595.
Cody, A. M. and Cody, R. D., (1989). SEM and polarization analyzes updating early light microscope studies related to {101} twin formation in gypsum. Journal of Crystal Growth 98, 731-738.
Deutsch, Y., Nathan, Y. Sarig, S., (1994). Thermogravimetric evaluation of the kinetics of the Gypsum-hemihydrate- soluble anhydrate transitions. Journal of Thermal Analysis 42, 159-174.
Edinger, S. E., (1973). An investigation of the factors which affect the size and growth rates of the habit faces of gypsum. Journal of Crystal Growth 18, 217-224.
El-Shall., H., Rashad., M. M., and Abdel-Aal., E. A., (2002). Effect of Phosphonate Additive on Crystallization of Gypsum in Phosphoric and Sulfuric Acid Medium. Cryst. Res. Technol. 37, 1264-1273.
Gavrieli, I., (1997). Halite Deposition from the Dead Sea: 1960-1993. In: Niemi, T. M., Ben-Avraham, Z., Gat, J.R (Ed.), The Dead Sea - the lake and its setting, Oxford University Press, New York oxford.
Gavrieli, I., Beyth, M., Weinstein, R., and Anati, D. A., (1994). The effect of the decrease in the stability of the Dead Sea water column stratification on the mixing mechanism of the End Brines in the southern Dead Sea. Geological Survey of Israel, Jerusalem, p.
Gavrieli, I., Oren A., (2004). The Dead Sea as a Dying Lake. In: C.J, N. J. and O., Z. P. (Eds.), Dying and Dead Seas Climatic Versus Anthropic Causes, IV. Earth and Environmental Sciences. Kluwer Academic Publishers, Kalamazoo.
Gill, J. S. and Nancollas, G. H., (1979). The growth of gypsum crystals on barite and calcite. Desalination 29, 247-254.
Goto, M. and Ridge, M. J., (1967). Crystal Growth of Gypsum on its Cleaved Surface. J.Fac. Sci. 4, 349-382.
Hall, C. and Cullen, D., (1996). Scanning Force Microscopy of Gypsum Dissolution and Crystal Growth. AIChE Journal 42, 232-238.

He, S., Oddo, J. E., and Tomson, M. B., (1994a). The Nucleation Kinetics of Calcium Sulfate Dihydrate in NaCl Solutions up to 6 m and 90°C. Journal of Colloid and Interface Science 162, 297-303.
He, S., Oddo, J. E., and Tomson, M. B., (1994b). The Seeded Growth of Calcium Sulfate Dihydrate Crystals in NaCl Solutions up to 6 m and 90ºC. Journal of Colloid and Interface Science 163, 372-378.
Herut, B., Gavrieli, I., and Halicz, L., (1998). Coprecipitation of trace and minor elements in modern authigenic halites from the hypersaline Dead Sea brine. Geochimica et Cosmochimica Acta 62, 1587-1598.
Kagawa, M., Sheehan, M. E., and Nancollas, G. H., (1981). The crystal growth of gypsum in an ammoniacal environment. Journal of Inorganic and Nuclear Chemistry 43, 917-920.
Katz, A., Starinsky, A., Taitel-Goldman, N., and Beyth, M., (1981). Solubilities of Gypsum and Halite in the Dead Sea and in Its Mixtures with Seawater. Limnology and Oceanography 26, 709-716.
Krumgalz, B. S., (1997). Ion interaction apporch to geochemical aspects of the Dead Sea. In: Niemi, T. M., Ben-Avraham, Z., Gat, J.R (Ed.), The Dead Sea - the lake and its setting, Oxford University Press, New York oxford.
Krumgalz, B. S., (2001). Application of the Pitzer ion interaction model to natural hypersaline brines. J. Molecular Liquids 91, 3-19.
Krumgalz, B. S., Hecht, A., Starinsky, A., and Katz, A., (2000). Thermodynamic constraints on Dead Sea evaporation: can the Dead Sea dry up? Chemical Geology 165, 1.
Krumgalz, B. S. and Millero, F. J., (1982). Physico-Chemical Study of the Dead Sea Waters. I. Activity Coefficients of Major Ions in Dead Sea Water. Marine Chemistry 11, 209-222.
Krumgalz, B. S. and Millero, F. J., (1983). Physico-Chemical Study of the Dead Sea Waters. III. On gypsum saturation in Dead Sea waters and their mixtures with Mediterranean Sea Water. Marine Chemistry 13, 127-139.
Lancia, A., Musmarra, D., and Marina, P., (1999). Measuring Induction Period for Calcium Sulfate Dihydrate Precipitation. AIChE Journal 45, 390-397.
Lasaga, A. C., (1998). Kinetic Theory in the Earth Sciences. Princeton University Press, Princeton, NJ.
Levy, Y., (1987). The Dead Sea - Hydrographic, Geochemical and Sedimentological changes during the last 25 years (1959-1984). Geological Survey of Israel, Jerusalem, p.
Liu, S.-T. and Nancollas, G. H., (1970). The kinetics of crystal growth of calcium sulfate dihydrate. Journal of Crystal Growth 6, 281-289.
Liu, S.-T. and Nancollas, G. H., (1973). Linear crystallization and induction-period studies of the growth of calcium sulphate dihydrate crystals. Talanta 20, 211-216.
Metz, V., Amram, K., and Ganor, J., (2005). Stoichiometry of smectite dissolution reaction. Geochimica et Cosmochimica Acta 69, 1755-1772.
Nancollas, G. H., (1979). The growth of crystals in solution. Advances in Colloid and Interface Science 10, 215-252.
Neev, D., (1964). The Dead Sea. The Geological Survey of Israel, Jerusalem. Neev, D. and Emery, K. O., (1967). The Dead Sea - Depositional processes and
environments of evaporites. Minisrty of Development - Geological Survery of Israel, Jerusalem, 147 p.
Nielsen, A. E., (1981). Theory of Electrolyte Crystal Growth - The Parabolic Rate Law. Pure & appl. Chem. 53, 2025-2039.
Nielsen, A. E. and Sohnel, O., (1971). Interfacial tensions electrolyte crystal-aqueous solution, from nucleation data. Journal of Crystal Growth 11, 233-242.
Packter, A., (1974). The precipitation of calcium sulphate dihydrate from aqueous solution : Induction periods, crystal numbers and final size. Journal of Crystal Growth 21, 191-194.
Parkhurst, D. L. and Appelo, C. A. J., (2007). PHREEQC 2.14.3 A computer program for speciation, batch-reaction, one-dimentional transport and inverse geochemical calculation. Water- Resources Investigation Report 99-4259. U.S. Geological Survey., p.
Pruett, R. J. and Webb, H. L., (1993). Sampling and analysis of KGa-1B well crystallized kaolin source clay. Clays and Clay Minerals 41, 514-519.
Reznik , I. J., Gal, A., Ganor, J., and Gavrieli, I., (2009). Gypsum saturation degrees and precipitation potential from Dead Sea-Seawater mixtures - Implication for the Red Sea - Dead Sea Conduit. Environmental Chemistry submitted.
Sheikholeslami, R. and Ong, H. W. K., (2003). Kinetics and thermodynamics of calcium carbonate and calcium sulfate at salinities up to 1.5 M. Desalination 157, 217-234.
Smith, B. R. and Sweett, F., (1971). The crystallization of calcium sulfate dihydrate. Journal of Colloid and Interface Science 37, 612-618.
Sohnel, O., (1982). Electrolyte crystal-aqueous solution interfacial tensions from crystallization data. Journal of Crystal Growth 57, 101-108.
Stein, M., Starinsky, A., Katz, A., Goldstein, S. L., Machlus, M., and Schramm, A., (1997). Strontium isotopic, chemical, and sedimentological evidence for the evolution of Lake Lisan and the Dead Sea. Geochimica et Cosmochimica Acta 61, 3975-3992.
Steinhorn, I., (1983). In situ salt precipitation at the Dead Sea. Limnology and Oceanography 28, 580-583.
Torfstein, A., Gavrieli, I., Katz, A., Kolodny, Y., and Stein, M., (2008). Gypsum as a monitor of the paleo-limnological-hydrological conditions in Lake Lisan and the Dead Sea. Geochimica et Cosmochimica Acta 72, 2491.
Van Rosmalen, G. M., Daudey, P. J., and Marchee, W. G. J., (1981). An analysis of growth experiments of gypsum crystals in suspension. Journal of Crystal Growth 52, 801-811.
Witkamp, G. J., Van der Eerden, J. P., and Van Rosmalen, G. M., (1990). Growth of gypsum : I. Kinetics. Journal of Crystal Growth 102, 281-289.
Yechieli, Y., Gavrieli, I., Berkowitz, B., and Ronen, D., (1998). Will the Dead Sea die? Geology 26, 755-758.
Zhang, J. and Nancollas, G. H., (1992). Influence of calcium/sulfate molar ratio on the growth rate of calcium sulfate dihydrate at constant supersaturation. Journal of Crystal Growth 118, 287-294.

Reznik et al., Fig. 1
Inhibitor+ Catalyst+
Evaporation +
I +
AC +
I<1 I>1
γ +γ -
I -
Ω- Sol+Ω- Sol+ Ω+ Sol-Ω+ Sol- Ω- Sol+Ω- Sol+ Ω= Sol-Ω= Sol- Ω= Sol-Ω= Sol-
Cat<An Cat=An Cat>An
Cat/An+Cat/An=Cat/An-LI +
R-R- R+R+ R+R+ R-R- R-R- R+R+
Ω+ Sol=Ω+ Sol=
R+ R=R= R+R+R-R-
Precipitation +
Ω- Sol=
R- R=
Ω- Sol=Ω- Sol=
R-R- R=R=
LI -
R=R= R-R- R=R= R-R-
Legend:
“+”=increase of value; “-”=decrease of value; “=“= no change; I=ionic strength; γ=activity coefficients; AC=aqueous complexes; LI=concentration of lattice ions; Cat=lattice cation activity; An=lattice anion activity; Ω=degree of saturation; Sol=solubility; R=precipitation rate
I =~

Reznik et al., Fig. 2
Reznik et al., Fig. 3
0
500
1000
1500
2000
2500
3000
3500
4000
0 200 400 600 800 1000 1200 1400
Experiment AN
InflowOutflow
Time (H)SO42-
con
cent
ratio
n (μ
mol
kg
solu
tion-1
)
0
500
1000
1500
2000
2500
3000
3500
4000
0 200 400 600 800 1000 1200 1400
Experiment AO
InflowOutflow
Time (H)SO42-
con
cent
ratio
n (μ
mol
kg
solu
tion-1
)
Reznik et al., Fig. 4
Kaolinite
0 3000
Control
0 3000
Mont-morillonite
0 3000
Calcite
0 3000
Aragonite
0 30002000
2200
2400
2600
2800
3000
3200Gypsum
0 3000
Kaolinite
0 3000
Control
0 3000
Mont-morillonite
0 3000
Calcite
0 3000
Aragonite
0 30002000
2200
2400
2600
2800
3000
3200Gypsum
0 3000
Kaolinite
0 3000
Control
0 3000
Mont-morillonite
0 3000
Calcite
0 3000
Aragonite
0 30002000
2200
2400
2600
2800
3000
3200Gypsum
0 3000
Kaolinite
0 3000
Control
0 3000
Mont-morillonite
0 3000
Calcite
0 3000
Aragonite
0 30002000
2200
2400
2600
2800
3000
3200Gypsum
0 3000
1
1
2
2
3
3
4
0 600 800Time (H)

Reznik et al., Fig. 5
0
1 10-8
2 10-8
3 10-8
4 10-8
0 0.05 0.1 0.15 0.2Gyp
sum
pre
cipi
tatio
n ra
te (m
ol s
-1 m
-2)
DSG1/2-1

Reznik et al., Fig. 6
0
5 10-7
1 10-6
1.5 10-6
2 10-6
2.5 10-6
3 10-6
3.5 10-6
0.01 0.1 1 10 100 1000
This studyZhang and Nancollas (1992)
Gyp
sum
pre
cipi
tatio
n ra
te (m
ol s
-1 m
-2)
Ca2+/SO42-

Reznik et al., Fig. 7
0
0.001
0.002
0.003
0.004
0.005
0.006
0.007
1.2 1.25 1.3 1.35
Diluted Dead SeaDead Sea 1980-2008End BrinesDead Sea 2008Bulk composition 1960UWM 1960LWM 1960
y = 0.047316 - 0.034484x R2= 0.94493
Density (g cm-3)
SO
42- c
once
ntra
tion
(m)

Reznik et al., Fig. 8
0.3
0.4
0.5
0.6
0.7
0.8
0.9
1
1.1
1.2 1.25 1.3 1.35
Diluted Dead SeaDead Sea 1980-2008End BrinesDead Sea 2008Bulk composition 1960UWM 1960LWM 1960
y = -5.1369 + 4.5944x R2= 0.96646
Density (g cm-3)
Ca2+
con
cent
ratio
n (m
)
Reznik et al., Fig. 9
10
100
1000
10000
1.2 1.25 1.3 1.35
Diluted Dead SeaDead Sea 1980-2008End BrinesDead Sea 2008Bulk composition 1960UWM 1960LWM 1960
y = 5.3732e-9 * e^(19.287x) R2= 0.96948
Density (g cm-3)
Ca2+
/ SO
42-

Reznik et al., Fig. 10
0
0.5
1
1.5
2
2.5
3
3.5
1.2 1.25 1.3 1.35
Diluted Dead SeaDead Sea 1980-2008End BrinesDead Sea 2008Bulk composition 1960UWM 1960LWM 1960
y = -13.332 + 11.891x R2= 0.93362
Density (g cm-3)
Gyp
sum
deg
ree
of s
atur
atio
n