knightpiesold - yukon
TRANSCRIPT

www.kn igh tp ieso ld .com
Knight Piésold Ltd. | Suite 1400 – 750 West Pender St, Vancouver, BC Canada V6C 2T8 | p. +1.604.685.0543 f. +1.604.685.0147
April 30, 2012 Mr. Steve Wilbur Victoria Gold Corp Suite 584 – 1055 Dunsmuir Street Vancouver, BV7X 1K8 Dear Steve, Re: Eagle Gold Project – Water Balance Model Transitional Summary 1. INTRODUCTION Knight Piésold Ltd. (KP) has been engaged by Victoria Gold Corporation (VIT) to provide a summary of the chronological progression of the site-wide water balance model that has been developed in support of the Eagle Gold Project (Project). The original water balance model was prepared for the Project Proposal and Pre-Feasibility Study (PFS) and was based on a 66 million tonne heap leach facility mine plan. Subsequent to that, a Feasibility Study (FS) of the Project based on a 92 million tonne heap leach facility mine plan was developed. The purpose of this letter is to highlight the refinements included in the FS water balance model, including a discussion of model assumptions and water management strategies, and the relative effects of the refinements as they pertain to the operations, closure and reclamation and post-closure monitoring phases of the Project. 2. WATER BALANCE MODEL OVERVIEW Pre-Feasibility Study Surface Water Balance Model The PFS Surface Water Balance Model (PFS SWBM) was an essential component of the Eagle Gold Project Proposal (Appendix 21 - Stantec, 2011a) for the 66 million tonne heap leach facility mine plan. The PFS SWBM was developed using a Microsoft Excel spreadsheet platform. This model utilizes a monthly time step and simulates the site-wide water balance as a flow-through model without the capacity to store water from one month to the next. The modeling timeline includes a baseline model simulation and an operational model simulation. The operational model simulation is the primary focus of the comparison in this letter. The operational model timeline includes 1.7 years of construction, 7.3 years of operation, 7 years of closure/reclamation and 5 years for post-closure monitoring. The model incorporates the following major Project components:
Open pit (OP)
Eagle Pup waste rock storage area (EP WRSA and associated storage facilities
Platinum Gulch waste rock storage area (PG WRSA) and associated storage facilities
Heap Leach Facility (HLF)
Mine Water Treatment Plant (MWTP) and associated storage facilities
Events Ponds, and
Dublin Gulch Diversion Channel (DGDC).
File No.:VA101-290/6-A.01 Cont. No.:VA12-00744

2 of 10 VA12-00744 April 30, 2012
Streamflow and/or site runoff volumes were predicted at specific nodes within the model. Where possible, model nodes were located at established hydrometric stations. Three water balance flowsheets that were presented in the Project Proposal (Appendix 18 – Stantec, 2011c) are included in Appendix A. These flowsheets summarize the flow rates at specific nodes in the PFS SWBM. These flowsheets illustrate the annual predicted volumes at the major model nodes and provide the basis for comparison to the FS model. The calendar timeline for the model spans from January 2012 to January 2035. The Project timelines and key milestones are listed in Table 1 and model assumptions are summarized in Table 2. An updated version of the PFS SWBM was subsequently provided as part of the “Eagle Gold Project Response to Request for Supplementary Information” report (Stantec, 2011e). The updated PFS SWBM was simulated using the GoldSim software and included a number of refinements to address water management issues identified during the YESAB adequacy review process. The water routing assumptions, Project components and model timeline of the updated Goldsim model are identical to the Excel model, with the GoldSim model platform providing enhanced capabilities for water storage routing and probabilistic modeling of precipitation conditions (stochastic analysis). The GoldSim PFS SWBM provided an intermediate step between the Excel water balance and the FS water balance model. For the purpose of this letter, the main focus of the study will be to compare the results of the PFS SWBM Excel version and those from the FS water balance model, with the results of the updated GoldSim PFS SWBM shown for information only. Feasibility Study Water Balance Model The FS Water Balance Model (FS WBM) was included as part of the Feasibility Water Management Plan (KP, 2012) in support of the Eagle Gold Project Feasibility Study for the 92 million tonne heap leach facility mine plan. The Project components and model nodes of the updated FS WBM are essentially the same as those outlined for the PFS SWBM, with the following refinements:
An updated mine plan and Project schedule for a 92 million tonne heap leach facility, including 9 years of operations and 10 years of closure/reclamation.
A revised water management plan and water routing for the mine site, based on the updated 92 million tonne heap leach facility mine plan and Project footprint (KP, 2012).
The updated FS WBM is simulated using the modeling software GoldSim, which is a dynamic modeling tool that provides enhanced capabilities for water storage routing and probabilistic modeling of precipitation conditions (stochastic analysis).
The FS WBM utilizes an optimized water management scenario to simulate the recycling of excess discharge from the HLF back to the HLF or events ponds under the following conditions: o When the inflow to the MWTP in any month exceeds the design capacity of the mine water treatment of
600 m3/hr, and/or o When the dilution ratio in Haggart Creek is less than 10:1 for a given discharge from the MWTP (i.e., in
this case defined as 10 parts Haggart Creek plus 1 part MWTP discharge to 1 part MWTP discharge). The water balance modeling effort for the Project is constantly being refined to optimize the water management plan for the site and minimize potential effects to the downstream environment. The FS WBM results presented in this letter include a few modifications from the version presented in the Feasibility Water Management Plan (KP, 2012):
For simplicity, the management of the excess water from the LDSP is sent directly to the MWTP, instead of being routed through the Events Ponds, as presented in the Feasibility Water Management Plan (KP, 2012). This helps to minimize the potential requirement for cyanide detoxification of this water, however it does

3 of 10 VA12-00744 April 30, 2012
result in more water being sent to the MWTP earlier in the mine life, as well as increase the makeup water requirement from groundwater. Moving forward, additional refinements to the model will include utilization of additional pond capacities (i.e. temporary storage in Events Ponds and/or the Eagle Pup WRSA collection pond) within the mine site in order to minimize the water sent to treatment and groundwater makeup water requirement.
The construction and post-closure monitoring phases of the mine life were not originally modeled in the FS WBM, which more focused on the phases with mine-related water demands and when the mine water treatment plant is operational. Water management for disturbed areas during construction is outlined in the erosion and sediment control section of the Water Management Plan (KP, 2012). Subsequently, in order to provide a basis for comparison to the PFS SWBM, the FS WBM has been revised to include post-closure monitoring by assuming that engineered soil covers capable of reducing net infiltration to 20% are applied to the HLF and WRSAs for their respective closure/reclamation phases.
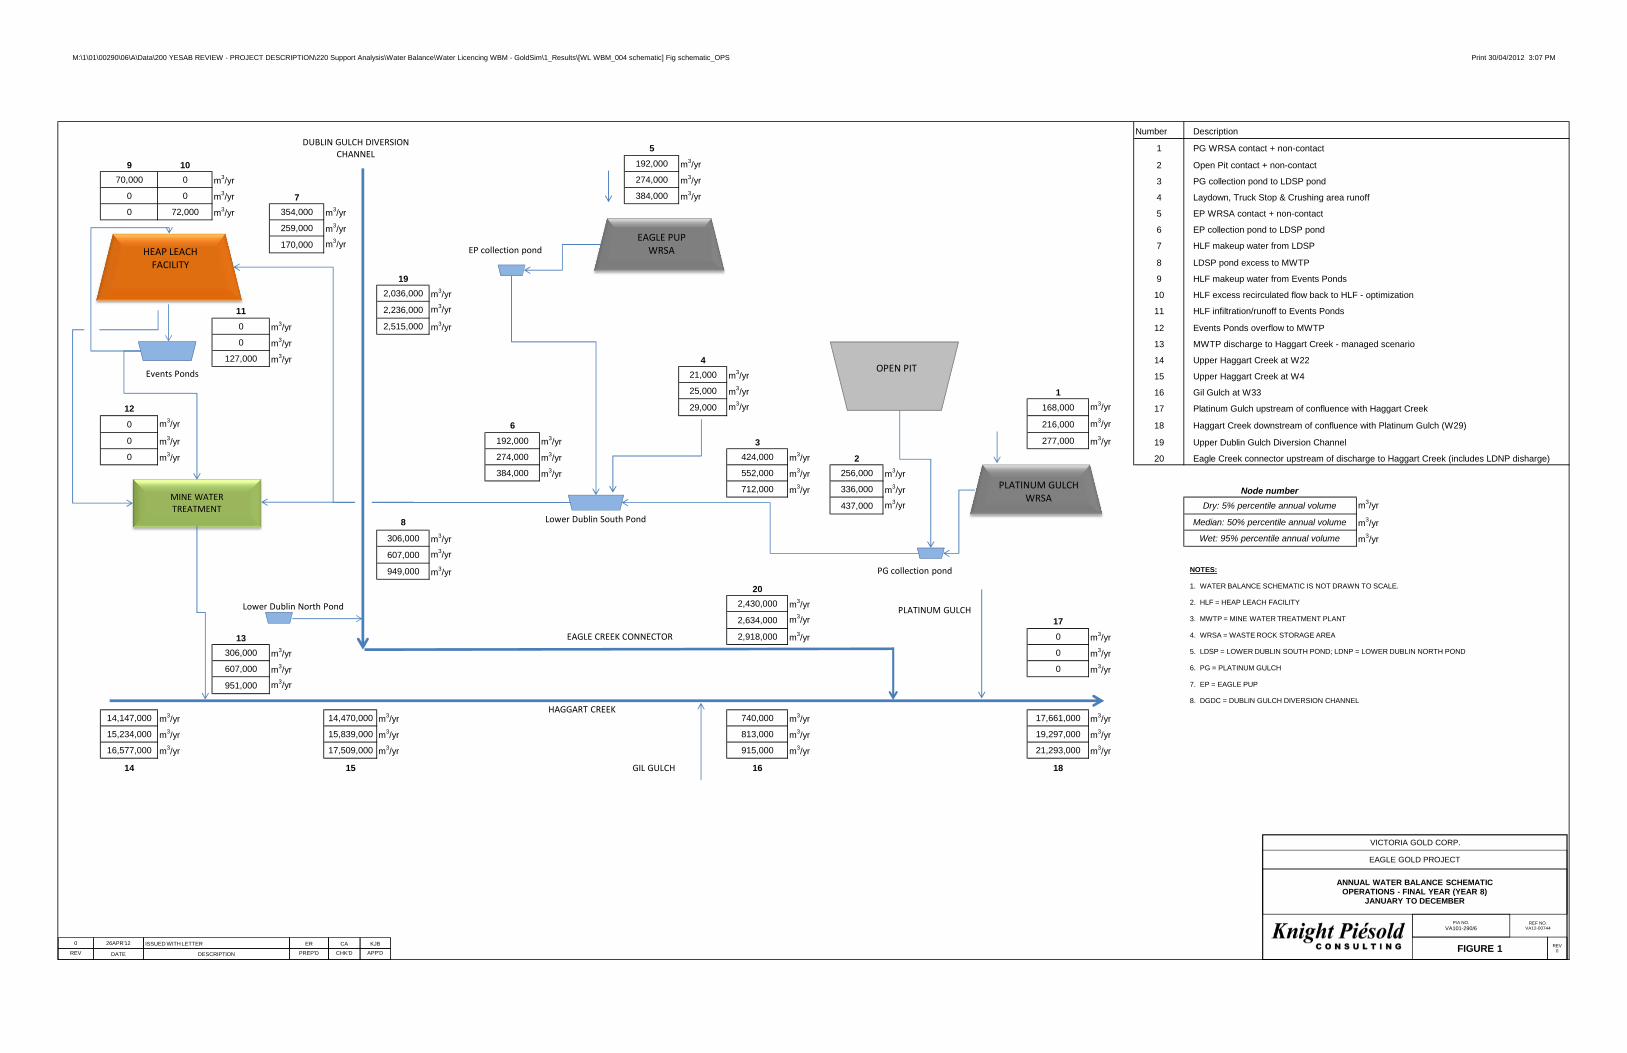
Figures 1 through 3 schematically illustrate the water routing and predicted annual volumes at key nodes in the model for operations, closure and post-closure mine phases. For modeling purposes, the arbitrary calendar timeline spans from January 2013 to January 2035. The Project timelines and key milestones are listed in Table 1 and model assumptions are summarized in Table 2. Details of the water routing assumptions for each mine facility through the modelling time frames for both the PFS SWBM and FS WBM are summarized in the following sections of this letter. 3. MODEL ASSUMPTIONS Average Hydrometeorological Conditions The average climatic and streamflow inputs developed for the PFS water balance model, as well as the runoff coefficients for the undisturbed basins, were based on the analyses completed by Stantec. This information is included in Appendix 7 (Stantec, 2011b) and Appendix 21 (Stantec, 2011a) of the Project Proposal. The average conditions were also adopted for the base case (deterministic) scenario of the FS WBM. Derivation of the precipitation and streamflow inputs are described further, below. Annual Precipitation and Evaporation The annual precipitation for each Project area sub-catchment was based on a regional linear regression equation relating elevation to annual precipitation, plus site specific factors. Development of the regional precipitation-elevation regression equation and site precipitation factors are discussed in Appendix 21 of the Project Proposal (Stantec, 2011a). The equation for annual precipitation is as follows:
0.173 203 ∗ Where:
x = reference catchment area elevation (m)
precipitationfactor = 1.4 for median conditions.

4 of 10 VA12-00744 April 30, 2012
A similar approach was used to determine the annual rainfall amount for each Project sub-catchment. The regional linear regression equation relating elevation to annual rainfall developed by Stantec (2011a) is as follows:
0.00010 0.7043 ∗ Where:
x = reference catchment area elevation (m)
The median annual precipitation for the Dublin Gulch catchment was estimated to be 577 mm (elevation 1,210 m) with 337 mm falling as rain and the remainder as snow. The monthly rainfall and snowfall amounts were based on the observed monthly distributions from the regional historical record for Keno Hill (Stantec, 2011a). Table 2 includes a summary of the primary hydrometeorological parameters for the Project. Various methods for estimating potential evapotranspiration and actual evapotranspiration were used for the water balance model, depending on the reference surface of the mine facility. Potential evapotranspiration (PET) is defined as the amount of evapotranspiration that would occur given an infinite supply of water from a crop surface and is often used to provide estimates of lake evaporation. For the PFS, mean annual lake evaporation was estimated to be 439 mm, based on an empirical equation for potential evapotranspiration, as described in Appendix 21 (Stantec, 2011a). For the FS, the mean annual evaporation was kept as 439 mm, which is likely higher than actual conditions, but this value has very little influence on the water balance as the pond surfaces are minimal and the balance is primarily driven by the heap leach facility. Actual evapotranspiration (AET) values for the heap leach facility and waste rock storage areas were based on empirical relationships for potential evapotranspiration (PET) and then adjusted to account for evaporation off a bare surface with a limited supply of water, as described in Appendix 21 (Stantec, 2011a). For the heap leach facility, the AET was estimated using an equation that relates precipitation to PET (Stantec 2011a). The annual actual evapotranspiration was estimated to be 225 mm for the PFS (Stantec, 2011a), while a higher value of a 299 mm was used for the FS, as defined in Tetratech’s technical memo “Eagle Gold Heap Leach Facility Water Balance – Revision 1” (Tetratech, 2012). This higher value is believed to better represent the losses from the surface of the heap leach facility. For waste rock piles and open pit, AET was estimated using a relationship which relates potential evapotranspiration to elevation and then adjusted by a coefficient to account for the reduced amount of water available for evaporation from a bare rock surface. For the PFS, the AET values range from 150 mm to 285 mm, depending on elevation, while for the FS a value of 115 mm was used to better reflect the limited the availability of water. This difference is reflected in the runoff coefficient values presented for various mine facilities in Table 2. The runoff coefficients represent the ratio of net precipitation to the total annual precipitation, with the ratio varying from 0.46 to 0.71 for the PFS, but held constant at 0.80 for the FS based on experience with typical values used for similar Projects in the Yukon. This ratio is effectively the annual runoff coefficient. The effect of higher runoff coefficients is higher predicted flow volumes for the mine facilities in the FS model. Baseline Monthly Streamflow For both the PFS and the FS, the average monthly streamflow values for natural catchment areas in the Project area were modelled with two components: (1) direct surface runoff due to precipitation inputs and (2) baseflow supplied by groundwater discharge. The main downstream receiving water body in the model is the reach of Haggart Creek that runs from upstream of the confluence with Dublin Gulch at W22 to downstream of the confluence with Platinum Gulch at W29. The baseline monthly surface water component of the streamflow for various locations on Haggart Creek (W4 and W29), Gil Gulch (W33), Dublin Gulch (W1) and

5 of 10 VA12-00744 April 30, 2012
Stewart Gulch (W36) was estimated based on applying a monthly runoff coefficient to the monthly rainfall plus snowmelt values (note that the runoff coefficients used were lower than what would be used if the baseflow component was not added). The monthly baseflow component of the total streamflow at each location was derived based on the unit area baseflow values from the baseline calibration model (Stantec, 2011a), multiplied by the assumed contributing catchment area for each location of interest. Climatic Variability PFS SWBM - The potential variability of climatic conditions was addressed by varying annual precipitation values, as well as varying monthly runoff coefficients and monthly unit area baseflow values for the natural sub-catchments. The different climatic scenarios modeled in the PFS SWBM were defined as ‘hydroclimatic’ scenarios, and include scenarios for the ‘wet’, ‘average’ (median) and ‘dry’ conditions.
Precipitation variability – Annual precipitation values for each hydroclimatic scenario were calculated by varying the site precipitation factor in the annual precipitation formula. Factors of 1.55, 1.4 and 1.0 were selected for wet, median and dry conditions, respectively. The precipitation factors were applied to the regionally derived annual precipitation value for each natural catchment and/or mine facility within the Project footprint. The monthly distribution of the rainfall and snowfall was based on regional precipitation patterns, adjusted for the elevation of the Project site area. The description of the hydroclimatic scenarios, as defined by Stantec (2011a), are: o The median scenario represents the annual precipitation value with a two year return interval, or a 50%
chance of exceedence in any given year. o The wet year scenario represents the annual precipitation value with a 20 year return period interval, or
a 5% chance of exceedance in any given year. o The dry year scenario represents the annual precipitation value with a 1.055 year return period interval,
or a 95% chance of exceedance in any given year.
Monthly runoff coefficients – Different runoff coefficients for each hydroclimatic scenario were used to simulate anticipated variations in hydrologic response to different climatic conditions. Similarly, different runoff coefficients were used for different months within a hydroclimatic scenario. Larger runoff coefficients correspond to increasing precipitation.
Monthly unit area baseflow values – Monthly unit area baseflow values were varied for each hydroclimatic scenario to simulate the monthly variability in baseflow. As with the runoff coefficients, higher baseflows corresponded to wetter conditions.
The development of the precipitation factors, monthly runoff coefficients, and unit area baseflow values for each hydroclimatic scenario were derived as part of the baseline calibration model and validation described in Appendix 21 (Stantec, 2011a). The variability of the precipitation factors and the hydrologic variables results in substantial variability in predicted streamflow volumes, and accordingly the estimates of wet and dry conditions are likely very conservative from a water management perspective. FS WBM - The potential variability of precipitation conditions was addressed by integrating stochastic functionality into the FS WBM. A Monte Carlo-type simulation was used to model monthly precipitation values as probability distributions rather than simply as mean values.
Precipitation variability - Monthly precipitation values were modeled using an underlying Gamma distribution. Monte Carlo simulations were run with 10,000 iterations, enabling a very large combination of wet, dry, and median months and years of precipitation to be considered. The results were then compiled as distributions for each month in each year, from which probabilities of occurrence were assessed for each model node of

6 of 10 VA12-00744 April 30, 2012
interest. The probabilities of occurrence presented for the water balance results represent the following conditions: o Median scenario – 50% chance of being equaled or exceeded in any given month or year o 95th percentile wet scenario – 5% chance of being equaled or exceeded in any given month or year, and o 5th percentile dry scenario – 95% chance of being equaled or exceeded in any given month or year.
The model was run with varying precipitation inputs but with constant runoff coefficients and monthly baseflow components. This contrasts with the PFS approach, and not surprisingly, results in much lower estimates of streamflow volume variability for the natural basins. A comparison of the variability of the predicted natural flow values for both the PFS and FS with measured regional flow data indicates that the PFS values show a higher variation compared to measured data, while the FS values are much less variable than the measured data. Accordingly, for future water balance modelling it is intended that natural flows will be simulated on the basis of flow inputs, as well as precipitation inputs, so that the variability of flows will more accurately reflect actual conditions. Water Management Plan The following section outlines the water routing assumption for each mine facility for the PFS and the FS water balance models. The year of mine life references the operational mine life (years) assigned to the model calendar time listed in Table 1, assuming mine start-up in September 2013 for the PFS and March 2013 for the FS. Although these start-up dates are arbitrary, the months are representative of plausible seasonal start-up scenarios and so are used for illustrative purposes. PFS SWBM water routing assumptions:
Eagle Pup WRSA o Operations/Closure - All contact (infiltration) and non-contact (runoff) water is collected in the Eagle Pup
(EP) pond and routed to the MWTP feed pond. Excess water, that is not required for makeup to the HLF, is sent to the MWTP until Year 15 (corresponding to two years after initiation of the HLF draindown).
o Closure/Reclamation – The engineered cover system placed on the WRSA is assumed to be functional as of September Year 10, with combined contact and non-contact water routed to the DGDC following passive treatment as of Year 15.
Platinum Gulch WRSA o Operations/Closure – Contact (infiltration) water is collected in the Platinum Gulch (PG) pond, with
excess water sent to the MWTP feed pond via OP sump dewatering until Year 10. Non-contact water (runoff) is directed to PG sediment collection pond and then routed to the PG channel (environment) during all mine phases.
o Closure/Reclamation – The engineered cover system placed on the WRSA is assumed to be functional as of September Year 5, with all contact water routed to the PG channel as of Year 10.
Open Pit (OP) o Operations – OP contact and non-contact water, and contact water from the PG WRSA, is sent to the
MWTP feed pond, with excess water sent to the MWTP via OP sump dewatering. o Closure/Reclamation – All OP water (contact and non-contact) and contact water from PG WRSA routed
to PG channel as of Year 10.

7 of 10 VA12-00744 April 30, 2012
Heap Leach Facility (HLF) o Operations/Closure – All contact (infiltration) and non-contact (runoff) water is sent to cyanide
detoxification facilities and then the MWTP. Treated water is discharged to Haggart Creek. Excess water is stored in the Events Ponds and sent to treatment until the HLF draindown is complete.
o Closure/Reclamation – The engineered cover system is assumed to be functional at the initiation of the HLF draindown in Year 12. Contact (infiltration) water (20% of net precipitation) is sent for cyanide detoxification and treatment via the MWTP feed pond. Non-contact (runoff) water is routed to Haggart Creek.
o Post-closure – All infiltration is routed to Haggart Creek via passive treatment systems. FS WBM water routing assumptions:
Eagle Pup WRSA o Operations/Closure – All contact (infiltration) and non-contact (runoff) water collected in the EP collection
pond is pumped to the LDSP until Year 14 (two years following the initiation of HLF draindown). o Closure/Reclamation – The engineered cover system on the WRSA is assumed to be functional as of
November Year 12, with combined contact and non-contact water routed to the DGDC via an in-line passive treatment system as of Year 14.
Platinum Gulch WRSA o Operations/Closure – All contact (infiltration) and non-contact (runoff) water collected in the PG
collection pond is pumped to the LDSP until Year 14 (two years following the initiation of HLF draindown).
o Closure/Reclamation – The engineered cover system on the WRSA is assumed to be functional as of March Year 7, with combined contact and non-contact water routed to the PG channel via an in-line passive treatment system as of Year 14.
Open Pit (OP) o Operations – All contact and non-contact (runoff) water is collected in the PG collection pond and sent to
the LDSP until Year 14 (two years after initiation of HLF draindown). o Closure/Reclamation – All contact and non-contact water is routed to PG channel via the passive
treatment system in Platinum Gulch as of Year 14.
Lower Dublin Gulch South Pond (LDSP) o Operations – The LDSP is an operational storage pond that accumulates mine water routed from Eagle
Pup, Platinum Gulch, and the OP. This water can then be dispatched to the HLF as makeup water, routed through the MWTP, or discharged to the DGDC, provided that the water meets discharge requirements. Process makeup water required for HLF operation is pumped to the process plant. Excess water from the LDSP, above the assumed operating storage capacity, will be sent to the MWTP.
o Closure – The LDSP collects all contact (infiltration) and non-contact (runoff) water collected from the WRSAs and the OP. Excess discharge is sent to the MWTP until Year 14.
o Closure/Reclamation – All water from the WRSAs is routed to locally-situated passive treatment systems and the LDSP is decommissioned as of Year 14.
Heap Leach Facility (HLF) o Operations/Closure – All excess contact (infiltration) and non-contact (runoff) water is routed to the
cyanide detoxification facility and the MWTP until the HLF cover system is assumed to be functional. o Closure/Reclamation – The engineered cover system is assumed to be functional in Year 14 (two years
after the initiation of HLF draindown). Contact (infiltration) water (20% net precipitation) is sent to the cyanide detoxification facility and the MWTP. Non-contact (runoff) water is routed to Haggart Creek.

8 of 10 VA12-00744 April 30, 2012
o Post-closure – All seepage is routed to Haggart Creek via the HLF passive treatment system. Runoff generated on the surface of the HLF is directed to the perimeter of the heap where drainage channels convey the non-contact water to environmental discharge points along the DGDC and Haggart Creek.
4. RESULTS Inflow to the Mine Water Treatment Plant A comparison of the predicted monthly inflow volumes to the MWTP for the median and wet scenarios is presented on Figures 4 and 5, respectively. The dry case was not shown as it is not as much of a concern in terms of inflow to the mine water treatment plant. The results shown for the FS WBM illustrate the ‘managed’ case, in which excess inflow to the MWTP is re-circulated back onto the HLF where it is temporarily delayed until there is sufficient capacity in the MWTP to treat it and/or there is sufficient flow in Haggart Creek to provide the required dilution. Operations During the Operations phase, the FS WBM predicts larger monthly flow volumes when compared to the PFS SWBM. This is likely due to the larger footprints and assumed higher runoff coefficients of the mine facilities, which generate more runoff on a monthly basis. This additional water will likely require treatment. Additionally, the FS model assumes that all water (contact and non-contact) generated from within each mine facility final footprint (i.e. open pit and WRSAs) is blended in the downstream collection ponds and sent to the LDSP, with any excess that is not required as makeup routed through the MWTP. Water management structures (i.e. water diversions and/or collection ponds) to convey and collect non-contact water from around or within the mine facilities were designed based on the maximum disturbed footprint without progressive reclamation factored in, which is a conservative approach from a water management perspective. The intent was to establish the water management structures prior to operations without the need for future relocation or modification (KP, 2012). This is notably different from the PFS SWBM, which assumes progressive reclamation to divert non-contact water generated from the undisturbed upslope areas or from within the final footprint and discharge directly to the environment. Note that the runoff coefficient values applied to the mine facilities for the median case of the PFS model are lower compared to analogous values in the FS model, resulting in less water being generated from a comparable footprint in the FS model. Closure/Post-closure For the Closure phase and into Post-Closure, Figures 4 and 5 indicate that the FS model predicts higher monthly inflow rates to the MWTP for the median and wet scenarios, respectively. The period of HLF draindown is an exception to this generalization. The increased flow in Years 10 and 11 of the FS model can be attributed to the net precipitation inputs to the heap exceeding the moisture losses to the ore. As ore production has ceased, this creates a larger positive water balance in the 92 Mt heap compared to the PFS 66 Mt heap. The higher monthly inflow rates for the PFS during draindown are likely a result of the following factors:
The PFS SWBM demonstrates higher variability in the wet scenario due to the variation of the precipitation factors and the hydrologic variables. This results in a substantial variation in predicted monthly volumes. This is clearly illustrated on Figure 5, when comparing the wet scenarios for both models, in Years 8, 12 and 13, when wet years were run for both models.
The FS WBM includes the ‘optimized’ water management strategy, which simulates the recycling of excess heap infiltrated runoff/seepage back onto the heap in the event that the predicted MWTP inflow volumes exceed the maximum treatment inflow rate, as defined by the water management objectives (discussed

9 of 10 VA12-00744 April 30, 2012
previously). Therefore, the MWTP inflows for the FS WBM are controlled at the upper limits. This does result in treatment being required for a longer duration compared to the PFS model.
The monthly inflow rates reporting to the MWTP for each phase of the mine life for the PFS SWBM and FS SWBM are summarized in a Table B.1 (included as Appendix B). Similarly included in this appendix are Tables B.2, B.3, and B.4, which summarize the monthly volumes predicted from the EP WRSA, PG WRSA (including the open pit), and the HLF for the post-closure phase, respectively. Also included in these tables are the results for the GoldSim version PFS SWBM for information purposes only. Annual Flow Volumes Summaries of the annual flow volumes predicted at key nodes for the FS WBM, for the wet, median, and dry scenarios, are illustrated on Figures 1, 2, and 3 for operations, closure, and post-closure conditions, respectively. The values presented represent 95th percentile (wet), 50th percentile (median), and 5th percentile (dry) conditions as generated from the 10,000 iterations run in the Monte Carlo simulation of the stochastic model. It should be noted that because of the manner in which the values were generated, and understanding that although 10,000 iterations produces a very representative sample but does not cover every theoretically possible result, the addition of quantile values at two contributing nodes may not exactly equal the quantile value at the common downstream node (i.e. On Figure 1, the sum of the node 13 and node 14 values does not exactly equal the corresponding node 15 value). Additionally, the annual volumes presented at upstream nodes that are unaffected by the Project (i.e. Haggart Creek at W22 – nodes 14 on Figures 1 and 2, and node 8 on Figure 3) will not be exactly equal for each year of the model because the results are based on different model runs with 10,000 iterations; however for all intents and purposes the volumes can be considered the same. The PFS SWBM flowsheets included in Appendix A can be compared to the FS WBM flow sheets (Figures 1 through 3). As expected, the amount of water generated over the life of the mine increases as the facility’s total footprint increases over time. Consequently, the requirements for water treatment also increase. The median predicted annual volumes in Haggart Creek are comparable for both models. However, the predicted annual volumes for the wet and dry scenarios of the PFS SWBM demonstrate much greater variability in predicted streamflow, as discussed earlier. This is considered a functional artifact of the manner in which the precipitation and hydrologic parameters were modeled in the PFS SWBM. REFERENCES Knight Piésold Ltd. (2012). Victoria Gold Corporation, Eagle Gold Project – Feasibility Water Management Plan
(Ref no. VA101-290/5-1, Rev 2). April 18, 2012. Stantec Ltd. (2011a). Appendix 21: Eagle Gold Project – Surface Water Balance Model Report. June 2011. Stantec Ltd. (2011b). Appendix 7: Eagle Gold Project – Environmental Baseline Report: 2010 Update for
Climate. Stantec Ltd. (2011c). Appendix 18: Eagle Gold Project – Water Management Plan. June 2011. Stantec Ltd. (2011d). Eagle Gold Project, Project Proposal for Executive Committee Review. Prepared for
Victoria Gold Corp. June 2011.


Print Apr/30/12 15:02:04
Mine Phase Period Details Mine Phase Period Details
01/01/2013 1 Mine start up in Sep 2013MWTP onlineHLF ore stacking and irrigation startsEP WRSA and PG WRSA stacking starts
Mine start up in Mar 2013MWTP onlineHLF ore stacking and irrigation startsEP WRSA and PG WRSA stacking starts
01/01/2014 2
01/01/2015 3
01/01/2016 4 Reclamation for PG WRSA begins Oct 2016 - PG WRSA closure cover construction begins
01/01/2017 5 Sep 2017 - PG WRSA cover functional
01/01/2018 6
01/01/2019 7 Mar 2019 - PG WRSA cover functional
01/01/2020 8 End of ore production in Dec 2020OP mining stopsEP WRSA stacking
01/01/2021 9 HLF Gold RecoveryJan 2021 - HLF supplemental gold recovery startsEP WRSA closure cap construction
Operations/ClosureEnd of ore production Nov 2021
HLF Gold Recovery begins
01/01/2022 10Jan 2022 - HLF Rinse startsOP and PG WRSA water drain to PG channelSep 2022 - EP WRSA cover functional
HLF Gold recovery/HLF Rinse Nov 2022 - HLF rinse commences
01/01/2023 11 HLF rinse
01/01/2024 12 HLF Rinse/HLF DraindownJan 2024 - HLF draindown starts; all HLF runoff routed to MWTPHLF closure cover construction begins
HLF rinse/draindownNov 2024 - HLF draindown commencesHLF closure cover construction beginsEP WRSA closure cover functional
01/01/2025 13
01/01/2026 14 Oct 2026 - EP WRSA and Suttle Gulch stockpile water routed to DGDCNov 2026 - Collection ponds (EP, PG, Lower Dublin South) discharge routed to passive treatment or DGDC
01/01/2027 15
01/01/2028 16
01/01/2029 17
01/01/2030 18 Dec 2030 - HLF draindown complete
01/01/2031 19
01/01/2032 20
01/01/2033 21
01/01/2034 22
01/01/2035 23
NOTE:
Operations
Closure
HLF Rinse
HLF Draindown
Jan 2034 - Events ponds and MWTP decommissionedReclaimed HLF runoff/infiltration directed to Haggart Creek via passive treatment systems
1. THE OPERATIONAL MINE LIFE PRESENTED IS ARBITRARILY ASSIGNED FOR THE WATER BALANCE COMPARISON, WITH YEAR 1 ASSUMED TO BE THE FIRST YEAR IN WHICH MINING OPERATIONS COMMENCES AND THEN CONTINUING TO THE END OF THE MODEL SIMULATION IN YEAR 23.
Calendar timeOperational Mine
Life (year)1
PFS SWBM 66 Mt
TABLE 1
VICTORIA GOLD CORP.EAGLE GOLD PROJECT
WATER BALANCE MODEL PROJECT SCHEDULE
M:\1\01\00290\06\A\Data\200 YESAB REVIEW - PROJECT DESCRIPTION\220 Support Analysis\Water Balance\Water Licencing WBM - GoldSim\1_Results\[Eagle Gold WBM_comparison_WBM_WL04.xlsx]Table 1
HLF draindown
Post-closure monitoring
Post-closure monitoring
Jan 2031 - Events Ponds and MWTP decommissionedReclaimed HLF runoff/infiltration directed to Haggart Creek via passive treatment systems
FS WBM 92 Mt
Operations
Closure
0 25APR'12 ER CAISSUED WITH LETTER VA12-00744 KJBDATE DESCRIPTION PREP'D CHK'D APP'DREV

Print Apr/30/12 15:00:12
COMPONENT UNITS PFS SWBM 66 Mt FS WBM 92 Mt
Ore Production tpd 26,000 29,500
Operational mine life years 7.5 8.75
Project Site Median Elevation (reference ) m 1,210 1,210
Mean Annual Precipitation mm 577 577
Mean Annual Rainfall mm 337 337
Mean Annual Snowfall mm 240 240
Sublimation % 20 20
Mean Annual Pond Evaporation mm 439 439
Annual Evaporation (bare surface - Heap, Ore Stockpile) mm 225 299
Runoff coefficients (proportion of annual precipitation)
EP Waste Rock Storage Area - 0.56 0.80
PG Waste Rock Storage Area 0.46 0.80
Open Pit footprint - 0.71 0.80
Laydown area, truck shop (disturbed) - - 0.80
Infiltration Rates
Waste Rock Storage Areas % 90 80
Heap Leach Facility during operations % 100 100
Capped surfaces (closure) % 20 20
Total Facilities Areas - final footprint
Eagle Pup WRSA m2 800,000 980,000
Platinum Gulch WRSA m2 330,000 410,000
HLF m2 854,155 1,134,970
Open Pit m2 640,548 810,000
Pond Capacities (normal operating capacity)
Eagle Pup Collection Pond m3 26,559 25,000
Platinum Gulch Sediment Collection Pond m3 37,546 -
Platinum Gulch Collection Pond m3 - 41,000
Lower Dublin North Pond m3 - 10,500
Lower Dublin South Pond m3 - 30,000
MWTP Feed Pond m3 13,449 -
HLF - Events Pond 1 (downstream) m3 87,500 92,153
HLF - Events Pond 2 (upstream) m3 87,500 90,693
HLF - Heap Pond (normal operating capacity) m3 200,000 200,000
Water Demand
Solution Application Rate m3/hr 1950 2,770
Ore Moisture
Initial moisture content % 3 to 5 5
Leaching moisture content % 13.3 13.3
Drilling water requirements m3/day 48.96 49
Sump capacity (operations) m3 48,375 48,375
Sump capacity (closure) m3 249,793 249,793
Waste rock dry density tonnes/m3 2 2
Waste rock moisture content % 2 2
NOTES:
5. THE NORMAL OPERATING CAPACITY FOR THE PONDS SHOWN DOES NOT TAKE INTO ACCOUNT THE STORM WATER CAPACITY.
2. THE RUNOFF COEFFICIENTS SHOWN FOR THE MINE FACILITIES TAKE INTO ACCOUNT PRECIPITATION LOSSES DUE TO ACTUAL EVAPOTRANSPIRATION.
3. THE INFILTRATION RATES SHOWN FOR THE MINE FACILITIES IS DEFINED ARE THE PORTION OF NET PRECIPITATION THAT INFILTRATES THROUGH THE FACILITIES AND/OR COVER, WITH THE REMAINDER OF THE NET PRECIPITATION ASSUMED TO BE SURFACE RUNOFF.4. THE INITIAL MOISTURE CONTENT OF ORE FOR THE PFS SWBM IS A FUNCTION OF NET PRECIPITATION (NET P): 3% FOR NET P = 0-35 MM; 4% FOR NET P = 35-50 MM AND 5% FOR NET P>50 MM.
Heap Leach Facility
Open Pit
Waste Rock Storage Areas
M:\1\01\00290\06\A\Data\200 YESAB REVIEW - PROJECT DESCRIPTION\220 Support Analysis\Water Balance\Water Licencing WBM - GoldSim\1_Results\[Eagle Gold WBM_comparison_WBM_WL04.xlsx]Assumptions (2)
1. THE OPEN PIT SUMP CAPACITY AND DRILLING WATER REQUIREMENTS WERE BASED ON THE STANTEC (2011a) REPORT.
Physical and Hydrometeorological
TABLE 2
VICTORIA GOLD CORP.EAGLE GOLD PROJECT
WATER BALANCE INPUT PARAMETERS
General
0 30ARP'12 ER CAISSUED WITH LETTER VA12-00744 KJBDATE DESCRIPTION PREP'D CHK'D APP'DREV
M:\1\01\00290\06\A\Data\200 YESAB REVIEW - PROJECT DESCRIPTION\220 Support Analysis\Water Balance\Water Licencing WBM - GoldSim\1_Results\[WL WBM_004 schematic] Fig schematic_OPS Print 30/04/2012 3:07 PM
Number Description
5 1 PG WRSA contact + non-contact
9 10 192,000 m3/yr 2 Open Pit contact + non-contact
70,000 0 m3/yr 274,000 m3/yr 3 PG collection pond to LDSP pond
0 0 m3/yr 7 384,000 m3/yr 4 Laydown, Truck Stop & Crushing area runoff
0 72,000 m3/yr 354,000 m3/yr 5 EP WRSA contact + non-contact
259,000 m3/yr 6 EP collection pond to LDSP pond
170,000 m3/yr 7 HLF makeup water from LDSP
8 LDSP pond excess to MWTP
19 9 HLF makeup water from Events Ponds
2,036,000 m3/yr 10 HLF excess recirculated flow back to HLF - optimization
11 2,236,000 m3/yr 11 HLF infiltration/runoff to Events Ponds
0 m3/yr 2,515,000 m3/yr 12 Events Ponds overflow to MWTP
0 m3/yr 13 MWTP discharge to Haggart Creek - managed scenario
127,000 m3/yr 4 14 Upper Haggart Creek at W22
21,000 m3/yr 15 Upper Haggart Creek at W4
25,000 m3/yr 1 16 Gil Gulch at W33
12 29,000 m3/yr 168,000 m3/yr 17 Platinum Gulch upstream of confluence with Haggart Creek
0 m3/yr 6 216,000 m3/yr 18 Haggart Creek downstream of confluence with Platinum Gulch (W29)
0 m3/yr 192,000 m3/yr 3 277,000 m3/yr 19 Upper Dublin Gulch Diversion Channel
0 m3/yr 274,000 m3/yr 424,000 m3/yr 2 20 Eagle Creek connector upstream of discharge to Haggart Creek (includes LDNP disharge)
384,000 m3/yr 552,000 m3/yr 256,000 m3/yr
712,000 m3/yr 336,000 m3/yr Node number
437,000 m3/yr Dry: 5% percentile annual volume m3/yr
8 Median: 50% percentile annual volume m3/yr
306,000 m3/yr Wet: 95% percentile annual volume m3/yr
607,000 m3/yr
949,000 m3/yr
20
2,430,000 m3/yr
2,634,000 m3/yr 17
13 2,918,000 m3/yr 0 m3/yr
306,000 m3/yr 0 m3/yr
607,000 m3/yr 0 m3/yr
951,000 m3/yr
14,147,000 m3/yr 14,470,000 m3/yr 740,000 m3/yr 17,661,000 m3/yr
15,234,000 m3/yr 15,839,000 m3/yr 813,000 m3/yr 19,297,000 m3/yr
16,577,000 m3/yr 17,509,000 m3/yr 915,000 m3/yr 21,293,000 m3/yr
14 15 16 18
OPEN PIT
0 26APR'12 ISSUED WITH LETTER ER CA KJB
DATE DESCRIPTION PREP'D CHK'D APP'DREV
ANNUAL WATER BALANCE SCHEMATIC OPERATIONS - FINAL YEAR (YEAR 8)
JANUARY TO DECEMBER
FIGURE 1
VICTORIA GOLD CORP.
EAGLE GOLD PROJECT
REV0
P/A NO. VA101-290/6
REF NO.VA12-00744
NOTES:
1. WATER BALANCE SCHEMATIC IS NOT DRAWN TO SCALE.
2. HLF = HEAP LEACH FACILITY
3. MWTP = MINE WATER TREATMENT PLANT
4. WRSA = WASTE ROCK STORAGE AREA
5. LDSP = LOWER DUBLIN SOUTH POND; LDNP = LOWER DUBLIN NORTH POND
6. PG = PLATINUM GULCH
7. EP = EAGLE PUP
8. DGDC = DUBLIN GULCH DIVERSION CHANNEL
HEAP LEACH FACILITY
EAGLE PUPWRSA
PLATINUM GULCHWRSAMINE WATER
TREATMENTLower Dublin South Pond
Events Ponds
EP collection pond
PG collection pond
HAGGART CREEK
EAGLE CREEK CONNECTOR
PLATINUM GULCH
DUBLIN GULCH DIVERSION CHANNEL
GIL GULCH
Lower Dublin North Pond

M:\1\01\00290\06\A\Data\200 YESAB REVIEW - PROJECT DESCRIPTION\220 Support Analysis\Water Balance\Water Licencing WBM - GoldSim\1_Results\[WL WBM_004 schematic] Fig schematic_closure Print 30/04/2012 3:07 PM
Number Description
5 1 PG WRSA contact + non-contact
9 10 315,000 m3/yr 2 Open Pit contact + non-contact
0 70,000 m3/yr 417,000 m3/yr 3 PG collection pond to LDSP pond
0 220,000 m3/yr 7 546,000 m3/yr 4 Laydown, Truck Stop & Crushing area runoff
0 388,000 m3/yr 0 m3/yr 5 EP WRSA contact + non-contact
0 m3/yr 6 EP collection pond to LDSP pond
0 m3/yr 7 HLF makeup water from LDSP
8 LDSP pond excess to MWTP
19 9 HLF makeup water from Events Ponds
2,050,000 m3/yr 10 HLF excess recirculated flow back to HLF - optimization
11 2,250,000 m3/yr 11 HLF infiltration/runoff to Events Ponds
715,000 m3/yr 2,536,000 m3/yr 12 Events Ponds overflow to MWTP
901,000 m3/yr 13 MWTP discharge to Haggart Creek - managed scenario
1,176,000 m3/yr 4 14 Upper Haggart Creek at W22
21,000 m3/yr 15 Upper Haggart Creek at W4
24,000 m3/yr 1 16 Gil Gulch at W33
12 29,000 m3/yr 164,000 m3/yr 17 Platinum Gulch upstream of confluence with Haggart Creek
898,000 m3/yr 6 211,000 m3/yr 18 Haggart Creek downstream of confluence with Platinum Gulch (W29)
1,084,000 m3/yr 315,000 m3/yr 3 272,000 m3/yr 19 Upper Dublin Gulch Diversion Channel
1,359,000 m3/yr 417,000 m3/yr 435,000 m3/yr 2 20 Eagle Creek connector upstream of discharge to Haggart Creek (includes LDNP disharge)
546,000 m3/yr 569,000 m3/yr 271,000 m3/yr
738,000 m3/yr 358,000 m3/yr Node number
468,000 m3/yr Dry: 5% percentile annual volume m3/yr
8 Median: 50% percentile annual volume m3/yr
769,000 m3/yr Wet: 95% percentile annual volume m3/yr
1,009,000 m3/yr
1,311,000 m3/yr
20
2,445,000 m3/yr
2,649,000 m3/yr 17
13 2,940,000 m3/yr 0 m3/yr
1,215,000 m3/yr 0 m3/yr
1,600,000 m3/yr 0 m3/yr
1,790,000 m3/yr
14,198,000 m3/yr 15,431,000 m3/yr 744,000 m3/yr 18,640,000 m3/yr
15,312,000 m3/yr 16,913,000 m3/yr 817,000 m3/yr 20,383,000 m3/yr
16,696,000 m3/yr 18,452,000 m3/yr 922,000 m3/yr 22,284,000 m3/yr
14 15 16 18
OPEN PIT
0 26APR'12 ISSUED WITH LETTER ER CA KJB
DATE DESCRIPTION PREP'D CHK'D APP'DREV
ANNUAL WATER BALANCE SCHEMATIC CLOSURE - FIRST YEAR OF HLF DRAINDOWN (YEAR 13)
JANUARY TO DECEMBER
FIGURE 2
VICTORIA GOLD CORP.
EAGLE GOLD PROJECT
REV0
P/A NO. VA101-290/6
REF NO.VA12-00744
NOTES:
1. WATER BALANCE SCHEMATIC IS NOT DRAWN TO SCALE.
2. HLF = HEAP LEACH FACILITY
3. MWTP = MINE WATER TREATMENT PLANT
4. WRSA = WASTE ROCK STORAGE AREA
5. LDSP = LOWER DUBLIN SOUTH POND; LDNP = LOWER DUBLIN NORTH POND
6. PG = PLATINUM GULCH
7. EP = EAGLE PUP
8. DGDC = DUBLIN GULCH DIVERSION CHANNEL
HEAP LEACH FACILITY
EAGLE PUPWRSA
PLATINUM GULCHWRSAMINE WATER
TREATMENTLower Dublin South Pond
Events Ponds
EP collection pond
PG collection pond
HAGGART CREEK
EAGLE CREEK CONNECTOR
PLATINUM GULCH
DUBLIN GULCH DIVERSION CHANNEL
GIL GULCH
Lower Dublin North Pond

M:\1\01\00290\06\A\Data\200 YESAB REVIEW - PROJECT DESCRIPTION\220 Support Analysis\Water Balance\Water Licencing WBM - GoldSim\1_Results\[WL WBM_004 schematic] Fig schematic_pc_1 Print 30/04/2012 3:07 PM
Number Description
5 1 PG WRSA contact + non-contact
315,000 m3/yr 2 Open Pit contact + non-contact
6 417,000 m3/yr 3 OP and PG WRSA water to Platinum Gulch
315,000 m3/yr 545,000 m3/yr 4 Laydown, Truck Stop & Crushing area runoff
417,000 m3/yr 5 EP WRSA contact + non-contact
545,000 m3/yr 6 EP WRSA water to DGDC
7 HLF infiltration/runoff to Haggart Creek
8 Upper Haggart Creek at W22
13 9 Upper Haggart Creek at W4
2,374,000 m3/yr 10 Gil Gulch at W33
2,669,000 m3/yr 11 Platinum Gulch upstream of confluence with Haggart Creek
3,062,000 m3/yr 12 Haggart Creek downstream of confluence with Platinum Gulch (W29)
13 Upper Dublin Gulch Diversion Channel
4
7 21,000 m3/yr
124,000 m3/yr 24,000 m3/yr 1 Node number
154,000 m3/yr 29,000 m3/yr 164,000 m3/yr Dry: 5% percentile annual volume m3/yr
191,000 m3/yr 212,000 m3/yr Median: 50% percentile annual volume m3/yr
272,000 m3/yr Wet: 95% percentile annual volume m3/yr
2
271,000 m3/yr
359,000 m3/yr
467,000 m3/yr
3
434,000 m3/yr
570,000 m3/yr
739,000 m3/yr
2,752,000 m3/yr
3,051,000 m3/yr 12
3,448,000 m3/yr 434,000 m3/yr
570,000 m3/yr
739,000 m3/yr
14,189,000 m3/yr 14,714,000 m3/yr 745,000 m3/yr 18,668,000 m3/yr
15,305,000 m3/yr 15,976,000 m3/yr 818,000 m3/yr 20,420,000 m3/yr
16,677,000 m3/yr 17,528,000 m3/yr 920,000 m3/yr 22,598,000 m3/yr
8 9 10 11
OPEN PIT
0 24APR'12 ISSUED WITH LETTER ER CA KJB
DATE DESCRIPTION PREP'D CHK'D APP'DREV
ANNUAL WATER BALANCE SCHEMATICPOST-CLOSURE (YEAR 22)JANUARY TO DECEMBER
FIGURE 3
VICTORIA GOLD CORP.
EAGLE GOLD PROJECT
REV0
P/A NO. VA101-290/6
REF NO.VA12-00744
NOTES:
1. WATER BALANCE SCHEMATIC IS NOT DRAWN TO SCALE.
2. HLF = HEAP LEACH FACILITY
3. MWTP = MINE WATER TREATMENT PLANT
4. WRSA = WASTE ROCK STORAGE AREA
5. LDSP = LOWER DUBLIN SOUTH POND; LDNP = LOWER DUBLIN NORTH POND
6. PG = PLATINUM GULCH
7. EP = EAGLE PUP
8. DGDC = DUBLIN GULCH DIVERSION CHANNEL
HEAP LEACH FACILITY
EAGLE PUPWRSA
PLATINUM GULCHWRSA
HAGGART CREEK
EAGLE CREEK CONNECTOR
PLATINUM GULCH
DUBLIN GULCH DIVERSION CHANNEL
GIL GULCH
Reclaimed catchment area (formerly captured by LDNP)

M:\1\01\00290\06\A\Data\200 YESAB REVIEW - PROJECT DESCRIPTION\220 Support Analysis\Water Balance\Water Licencing WBM - GoldSim\1_Results\[Eagle Gold WBM_comparison_WBM_WL04] Figure OPT MWTP_median Print 30/04/20123:04 PM
0
100,000
200,000
300,000
400,000
500,000
600,000
1 2 3 4 5 6 7 8 9 10 11 12 13 14 15 16 17 18 19 20 21 22
Flo
w r
ate
(m3/m
on
)
Mine Life
KP FS WBM
KP SWBM
Stantec PFS SWBM
MANAGED MONTHLY INFLOW TO THEMINE WATER TREATMENT PLANT
MEDIAN SCENARIO
FIGURE 4
VICTORIA GOLD CORP.
EAGLE GOLD PROJECT
REV0
P/A NO. VA101-290/6
REF NOVA12-00744
0 27APR'12 ISSUED WITH LETTER ER CA KJB
DATE DESCRIPTION PREP'D CHK'D APP'DREV
Draindown
OPERATIONS POST‐CLOSURECLOSURE
GoldRecovery
Rinse
NOTE:
1. OPERATION, CLOSURE AND POST-CLOSURE SCHEDULE BASED ON THE PFS.

M:\1\01\00290\06\A\Data\200 YESAB REVIEW - PROJECT DESCRIPTION\220 Support Analysis\Water Balance\Water Licencing WBM - GoldSim\1_Results\[Eagle Gold WBM_comparison_WBM_WL04] Figure OPT MWTP_wet Print 30/04/20123:04 PM
0
100,000
200,000
300,000
400,000
500,000
600,000
1 2 3 4 5 6 7 8 9 10 11 12 13 14 15 16 17 18 19 20 21 22
Flo
w r
ate
(m3/m
on
)
Mine Life
KP FS WBM
KP SWBM
Stantec PFS SWBM
MANAGED MONTHLY INFLOW TO THEMINE WATER TREATMENT PLANT
WET SCENARIO
FIGURE 5
VICTORIA GOLD CORP.
EAGLE GOLD PROJECT
REV0
P/A NO. VA101-290/6
REF NOVA12-00744
0 27APR'12 ISSUED WITH LETTER ER CA KJB
DATE DESCRIPTION PREP'D CHK'D APP'DREV
Draindown
OPERATIONS POST‐CLOSURECLOSURE
GoldRecovery
Rinse
NOTE:
1. OPERATION, CLOSURE AND POST-CLOSURE SCHEDULE BASED ON THE PFS.2. THE STANTEC PFS SWBM ONLY MODELLED WET YEAR PRECIPITAITON IN YEARS 8, 12-13 AND 19-20. THE REMAINING YEARS OF THE MODEL USE THE MEDIAN PRECIPTIATION CONDITIONS.

VA12-00744 April 30, 2012
APPENDIX A
PRE-FEASIBILITY STUDY SURFACE WATER BALANCE MODEL SUMMARY FLOW SHEETS
(Pages A-1 to A-3)

Water Nodes
Wet (m 3 /year)
Avg (m 3 /year)
Dry (m 3 /year)
Water Nodes
Wet (m 3 /year)
Avg (m 3 /year)
Dry (m 3 /year)
W1 3,588,982 2,040,140 1,043,556 MWTP2 915,596 243,974 0W26 406,840 239,158 75,993 MWTP3 915,596 243,974 0EP2 425,423 149,541 38,489 CMP 20,862 20,862 20,862 AN1 4,786 2,113 562 LDG2 27,076 16,865 10,576 AN2 3,191 1,408 375 W22 24,558,664 15,272,822 8,667,270 HLF1 47,878 22,139 6,131 HAG1 25,547,786 15,561,909 8,694,826 STT2 27,076 16,865 10,576 W33 1,375,608 816,768 446,400 PG1 210,431 98,135 26,596 DGDC 3,999,013 2,280,706 1,119,924 OP2 704,417 336,318 111,667 ECC 4,597,041 2,653,025 1,353,287 ECP 570,952 355,454 222,787 PG2 88,815 43,393 12,725 MWTP1 214,244 246,269 350,099 W29 31,609,249 19,075,095 10,507,237 EVP1 184,964 216,989 320,819 W35 2,182,605 1,297,082 709,971 HLF2 0 0 0 W5 37,019,538 22,236,394 12,458,805
#
#
# #
#
#
##
>
>>
A
AA
A
A
A
A
A
!
A
A
>
A
A
A
!
!!!
!
!
!
!
!
!
!
!
!
!
!
!
!
!
!
!
! !
!
!
!
!
!
!
!
!
!
!
!
!
!
! ! ! !
!
!
!
!
!
!
!
!
!
!
!
!
!
!
!
!
!
!
5
5
5
5
5
MINE WATERTREATMENT
PLANT
WATER BALANCE MODEL BOUNDARY
ANN GULCH (ANN)
EAGLE PUP (EP)
LYNX CREEK
OPEN PIT (OP)15 PUP
HAG
GART
CRE
EK
OLIV
E GU
LCH
DUBLIN GULCH (DG)
STEW
ART G
ULCH
GIL GULCH
PLATINUM GULCH [PLAT]
CASC
ALLE
N GU
LCH
STUTTLE GULCH [STUTT]
DUBLIN GULCH
CAMP
HEAP LEACH FACILITY (HLF-ANN)
SECONDARY STORAGE [HLF]
WASTE ROCK STORAGE AREA
(EP-WRSA)
Mi [HLF]
Mi [EP-WRSA]
SUMP [OP]
PROCESSPLANT
PRIMARY (SATURATED)STORAGE [HLF]
UPPER DG DIVERSION CHANNELENERGY
DISSIPATERS
LOWER DG DIVERSION CHANNEL
SEWAGE
CYANIDEDETOX
LOWER DG SEDIMENT CONTROL POND
Mi [PLAT-WRSA]
WASTE ROCK STORAGE AREA
(PLAT-WRSA)
MWTP PRODUCTPOND
MWTPFEEDPOND
EAGL
E CR
EEK
PG SCP
UPPER DG VELOCITY REDUCTION POND
EP WRSA SCP
LOWER DGVELOCITY REDUCTION POND
SOLUTION EMITTERS ANN SCP
COLLECTIONPOND
W22
CMP
AN1HAG1
MWTP2 HLF2
MWTP1
EVP1
HLF1
AN2
ECC
ECP
MWTP3
W33
W29
W35W5
OP1
PG1
STT2
OP2EP2
PG2
DGDC
LDG2
W26W1
Annual Flows through Operation Nodes for Wet, Average and DryHydroclimatic Conditions
Note: Model nodes are listed roughly in an upstream to downstream order
06-May-2011
JBWATER MANAGEMENT FLOW SHEET FOR OPERATIONS
EAGLE GOLD PROPERTYYUKON TERRITORY
1053550-198c
Legend! Model Node5 Discharge to Channel5 Withdrawal from ChannelA Environmental Monitoring Location> Groundwater Well! Emitters
Water Balance Model BoundaryDrainage BasinSurface Water StoragePlantMine FacilitySediment Control PondSurface Water IntakeConnectionOptional ConnectionContact Surface WaterContact Groundwater Optional RoutingDiversion Channel (DC)Energy DissipaterDiverted Runoff (DRO)Non-Contact Surface Water (SW)Non-Contact Captured Groundwater (GW)
# Regional GroundwaterInitial Moisture Content (Mi)Irrigation Water
SW
N/A
N/A4370 Dominion StreetBurnaby, British ColumbiaV5G 4L7Tel. (604) 436 3014 Fax. (604) 436 3752
Stantec
DATE
DRAWN BY
FIGURE NO.
PROJECTION
DATUM CHECKED BY
7.10-1A-1 of 3

#
#
# #
#
#
##
>
>>
A
AA
A
A
A
A
A
!
A
A
>
A
A
A
!
!!!
!
!
!
!
!
!
!
!
!
!
!
!
!
!
!
!
! !
!
!
!
!
!
!
!
!
!
!
!
!
!
! ! ! !
!
!
!
!
!
!
!
!
!
!
!
!
!
!
!
!
!
!
5
5
5
5
5
MINE WATERTREATMENT
PLANT
WATER BALANCE MODEL BOUNDARY
ANN GULCH (ANN)
EAGLE PUP (EP)
LYNX CREEK
OPEN PIT (OP)15 PUP
HAG
GART
CRE
EK
OLIV
E GU
LCH
DUBLIN GULCH (DG)
STEW
ART G
ULCH
GIL GULCH
PLATINUM GULCH [PLAT]
CASC
ALLE
N GU
LCH
STUTTLE GULCH [STUTT]
DUBLIN GULCH
CAMP
HEAP LEACH FACILITY (HLF-ANN)
SECONDARY STORAGE [HLF]
WASTE ROCK STORAGE AREA
(EP-WRSA)
Mi [HLF]
Mi [EP-WRSA]
SUMP [OP]
PROCESSPLANT
PRIMARY (SATURATED)STORAGE [HLF]
UPPER DG DIVERSION CHANNELENERGY
DISSIPATERS
LOWER DG DIVERSION CHANNEL
SEWAGE
CYANIDEDETOX
LOWER DGSEDIMENT CONTROL POND
Mi [PLAT-WRSA]
WASTE ROCK STORAGE AREA
(PLAT-WRSA)
MWTP PRODUCTPOND
MWTPFEEDPOND
EAGL
E CR
EEK
PG SCP
UPPER DGVELOCITY REDUCTION POND
EP WRSA SCP
LOWER DGVELOCITY REDUCTION POND
SOLUTION EMITTERS ANN SCP
COLLECTIONPOND
W22
HAG1
CMP
AN1
HAG2ECP
ECC
DGDC
MWTP3
MWTP1
MWTP2
EVP1HLF2
STT2
OP2 EP2
OP1
PG1
PG2
W35
W29
W5
AN2
W1W26
W33
HLF1
Annual Flows though Closure and Reclamation Nodes forWet, Average and Dry Hydroclimatic Conditions
BAWN BOY GULCH
06-May-2011
TGWATER MANAGEMENT FLOW SHEET FOR CLOSURE AND RECLAMATION
EAGLE GOLD PROPERTYYUKON TERRITORY
1053550-207
Legend! Model Node5 Discharge to Channel5 Withdrawal from ChannelA Environmental Monitoring Location> Groundwater Well! Emitters
Water Balance Model BoundaryDrainage BasinSurface Water StoragePlantMine FacilitySediment Control PondSurface Water IntakeConnectionOptional ConnectionContact Surface WaterContact Groundwater Optional RoutingDiversion Channel (DC)Energy DissipaterDiverted Runoff (DRO)Non-Contact Surface Water (SW)Non-Contact Captured Groundwater (GW)
# Regional GroundwaterInitial Moisture Content (Mi)Irrigation Water
SW
N/A
N/A4370 Dominion StreetBurnaby, British ColumbiaV5G 4L7Tel. (604) 436 3014 Fax. (604) 436 3752
Stantec
DATE
DRAWN BY
FIGURE NO.
PROJECTION
DATUM CHECKED BY
8.10-1
Water Nodes
Wet (m 3 /year)
Avg (m 3 /year)
Dry (m 3 /year)
Water Nodes
Wet (m 3 /year)
Avg (m 3 /year)
Dry (m 3 /year)
W1 3,588,982 2,040,140 1,043,556 MWTP2 1,917,268 1,210,880 764,562 W26 406,840 239,158 75,993 MWTP3 1,917,268 1,210,880 764,562 EP2 538,446 257,427 77,554 CMP 3,846 3,846 3,846 AN1 95 42 11 LDG2 27,076 16,865 10,576 AN2 63 28 7 W22 24,558,664 15,272,822 8,667,270 HLF1 1,005 463 119 HAG1 26,967,183 16,740,459 9,519,333 STT2 27,076 16,865 10,576 W33 1,375,608 816,768 446,400 PG1 209,226 98,135 27,021 DGDC 3,995,885 2,279,326 1,119,557 OP2 720,208 353,313 129,087 ECC 4,593,913 2,651,645 1,352,919 ECP 570,952 355,454 222,787 PG2 88,815 43,393 12,725 MWTP1 0 0 0 W29 33,025,518 20,252,265 11,331,377 EVP1 0 0 0 W35 2,182,605 1,297,082 709,971 HLF2 658,615 600,140 557,920 W5 37,019,538 22,236,394 12,458,805 Note: Annual water balance values represent 20% infiltration through Eagle Pup WRSA, Platinum Gulch WRSA and HeapLeach Facility covers. Note: Model nodes are listed roughly in an upstream to downstream order
A-2 of 3

#
#
# #
#
#
##
!
!
!
!
!
!
!
!
A
A
A
A
!
A
!
!
!
!
!
WATER BALANCE MODEL BOUNDARY
ANN GULCH (ANN)
EAGLE PUP (EP)
LYNX CREEK
OPEN PIT (OP)15 PUP
HAG
GART
CRE
EK
OLIV
E GUL
CH
DUBLIN GULCH (DG)
STEW
ART G
ULCH
GIL GULCH
PLATINUM GULCH [PLAT]
CASC
ALLE
N GU
LCH
STUTTLE GULCH [STUTT]
DUBLIN GULCH
HEAP LEACH FACILITY (HLF-ANN)
SUMP [OP]
PRIMARY (SATURATED)STORAGE [HLF]
UPPER DG DIVERSION CHANNEL
LOWER DG DIVERSION CHANNEL
EAGL
E CR
EEK
UPPER DGVELOCITY REDUCTION POND
W22
HAG1
ECCECP
W33
W29
W35W5
OP3
STT3EP3
HLF1
HLF3
PAS1
AN3
AN2
W1W26
DGDC
PG3
Annual Flows through Post Closure Monitoring Nodesfor Wet, Average and Dry Hydroclimatic Conditions
PG2
06-May-2011 9-1
TGWATER MANAGEMENT FLOW SHEET FORPOST-CLOSURE MONITORING
EAGLE GOLD PROPERTYYUKON TERRITORY
1053550-206
LS
N/A
N/A4370 Dominion StreetBurnaby, British ColumbiaV5G 4L7Tel. (604) 436 3014 Fax. (604) 436 3752
Stantec
DATE
DRAWN BY
FIGURE NO.
PROJECTION
DATUM CHECKED BY
Legend! Model NodeA Environmental Monitoring Location
Water Balance Model BoundaryDrainage BasinMine FacilityNon-Contact Surface Water (SW)Non-Contact Captured Groundwater (GW)
# Regional Groundwateroptional routingDiversion Channel (DC)Reclaimed Habitat
Model Node Wet (m 3 /year) Avg (m 3 /year) Dry (m 3 /year)W1 3,588,982 2,040,140 1,043,556 W26 406,840 239,158 75,993 EP3 537,961 256,675 77,966 AN3 95 42 11 AN2 63 28 7 HLF1 1,005 463 119 STT3 27,076 16,865 10,576 PG2 39,941 19,627 6,887 OP3 511,023 255,220 102,107 ECP 570,952 355,454 222,787 HLF3 121,576 63,101 20,881 PAS1 121,576 63,101 20,881 W22 24,558,664 15,272,822 8,667,270 HAG1 25,167,645 15,588,834 8,771,807 W33 1,375,608 816,768 446,400 DGDC 4,533,846 2,536,001 1,197,523 ECC 5,104,798 2,891,455 1,420,309 PG3 805,904 395,702 143,211 W29 32,453,955 19,692,759 10,781,727 W35 2,182,605 1,297,082 709,971 W5 37,019,538 22,236,394 12,458,805
Note: Annual water balance values represent 20% infiltration through Eagle PupWRSA, Platinum Gulch WRSA and Heap Leach Facility coversNote: Model nodes are listed roughly in an upstream to downstream order
A-3 of 3

VA12-00744 April 30, 2012
APPENDIX B
FEASIBILITY STUDY WATER BALANCE SUMMARY TABLES
(Pages B-1 to B-8)

5th percentile Median 95th percentile 5th percentile Median 95th percentile 5th percentile Median 95th percentile
- Operations 1 3 - - - - - - 0 0 0
- Operations 1 4 - - - - - - 0 0 0
- Operations 1 5 - - - - - - 0 0 0
- Operations 1 6 - - - - - - 0 0 0
- Operations 1 7 - - - - - - 0 4,420 94,644
- Operations 1 8 - - - - - - 0 0 67,475
Operations Operations 1 9 1,710 1,710 16,785 1,735 1,735 1,735 0 0 54,792
Operations Operations 1 10 1,767 1,767 9,027 1,736 1,736 1,736 0 0 21,350
Operations Operations 1 11 1,710 1,710 1,710 1,737 1,737 1,737 0 0 0
Operations Operations 1 12 1,767 1,767 1,767 1,738 1,738 1,738 0 0 0
Operations Operations 2 1 1,767 1,767 1,767 1,739 1,739 1,739 0 0 0
Operations Operations 2 2 1,596 1,596 1,596 1,740 1,740 1,740 0 0 0
Operations Operations 2 3 1,767 1,767 1,767 1,741 1,741 1,741 0 0 0
Operations Operations 2 4 1,710 1,710 1,710 1,742 1,742 1,742 0 0 0
Operations Operations 2 5 1,767 1,767 1,767 1,743 1,743 1,743 0 0 0
Operations Operations 2 6 1,710 1,710 1,710 1,744 1,744 1,744 0 0 108,219
Operations Operations 2 7 1,767 1,767 1,767 1,745 1,745 26,464 0 71,741 197,457
Operations Operations 2 8 1,767 1,767 1,767 1,746 1,746 32,904 0 41,693 140,052
Operations Operations 2 9 1,710 1,710 1,710 1,747 1,747 47,175 0 25,097 109,679
Operations Operations 2 10 1,767 1,767 1,767 1,748 1,748 30,733 0 0 41,223
Operations Operations 2 11 1,710 1,710 1,710 1,749 1,749 1,749 0 0 0
Operations Operations 2 12 1,767 1,767 1,767 1,750 1,750 1,750 0 0 0
Operations Operations 3 1 1,767 1,767 1,767 1,752 1,752 1,752 0 0 8,047
Operations Operations 3 2 1,596 1,596 1,596 1,753 1,753 1,753 0 0 7,880
Operations Operations 3 3 1,767 1,767 1,767 1,754 1,754 1,754 0 0 0
Operations Operations 3 4 1,710 1,710 1,710 1,755 1,755 1,755 0 0 0
Operations Operations 3 5 1,767 1,767 1,767 1,756 1,756 1,756 0 0 0
Operations Operations 3 6 1,710 1,710 1,710 1,757 1,757 1,757 0 143,880 234,842
Operations Operations 3 7 1,767 1,767 1,767 1,758 1,758 59,972 25,065 136,922 249,217
Operations Operations 3 8 1,767 1,767 1,767 1,759 1,759 68,318 0 83,874 204,473
Operations Operations 3 9 1,710 1,710 1,710 1,760 1,760 67,827 0 58,668 183,397
Operations Operations 3 10 1,767 1,767 1,767 1,761 1,761 52,165 0 0 50,828
Operations Operations 3 11 1,710 1,710 1,710 1,762 1,762 1,762 0 0 0
Operations Operations 3 12 1,767 1,767 1,767 1,763 1,763 1,763 0 0 0
Operations Operations 4 1 1,767 1,767 1,767 1,764 1,764 1,764 0 0 0
Operations Operations 4 2 1,653 1,653 1,653 1,765 1,765 1,765 0 0 0
Operations Operations 4 3 1,767 1,767 1,767 1,766 1,766 1,766 0 0 0
Operations Operations 4 4 1,710 1,710 1,710 1,767 1,767 1,767 0 0 0
Operations Operations 4 5 1,767 1,767 1,767 1,768 1,768 1,768 0 0 0
Operations Operations 4 6 1,710 1,710 1,710 1,769 1,769 57,506 46,184 167,334 264,693
Operations Operations 4 7 1,767 1,767 1,767 1,770 2,499 141,952 37,943 150,947 259,813
Operations Operations 4 8 30,982 30,982 30,982 1,771 15,731 122,129 0 104,849 212,333
Operations Operations 4 9 44,091 44,091 44,091 1,772 27,269 125,727 0 76,804 215,654
Operations Operations 4 10 5,654 5,654 5,654 1,773 3,043 60,350 0 7,764 77,451
Operations Operations 4 11 1,710 1,710 1,710 1,774 1,774 4,381 0 0 3,264
Mine Life (yrs) MonthMine Phase (PFS)
Print Apr/30/12 15:02:04
Mine Phase (FS)Stantec PFS SWBM KP GoldSim PFS WBM KP GoldSim FS WBM
TABLE B.1
VICTORIA GOLD CORP.EAGLE GOLD PROJECT
WATER BALANCE MODEL COMPARISON
MONTHLY DISCHARGE FROM MWTP (m3/mon)
B-1 of 8

5th percentile Median 95th percentile 5th percentile Median 95th percentile 5th percentile Median 95th percentileMine Life (yrs) MonthMine Phase (PFS) Mine Phase (FS)
Stantec PFS SWBM KP GoldSim PFS WBM KP GoldSim FS WBM
Operations Operations 4 12 1,767 1,767 1,767 1,775 1,775 1,775 0 0 12,496
Operations Operations 5 1 1,767 1,767 1,767 1,776 1,776 1,776 0 0 11,841
Operations Operations 5 2 1,596 1,596 1,596 1,778 1,778 1,778 0 11,731 11,731
Operations Operations 5 3 1,767 1,767 1,767 1,778 1,778 1,778 0 0 0
Operations Operations 5 4 1,710 1,710 1,710 1,780 1,780 1,780 0 0 0
Operations Operations 5 5 1,767 1,767 1,767 1,781 1,781 1,781 0 0 0
Operations Operations 5 6 44,261 44,261 44,261 1,782 1,782 1,782 0 159,568 268,999
Operations Operations 5 7 70,046 70,046 70,046 1,783 1,783 124,417 25,620 146,905 258,587
Operations Operations 5 8 55,825 55,825 55,825 1,784 1,784 141,205 0 97,870 213,326
Operations Operations 5 9 68,524 68,524 68,524 1,785 21,032 122,353 0 68,814 213,103
Operations Operations 5 10 5,435 5,435 5,435 1,786 1,786 48,252 0 0 67,520
Operations Operations 5 11 1,710 1,710 1,710 1,787 1,787 1,787 0 0 0
Operations Operations 5 12 1,767 1,767 1,767 1,788 1,788 1,788 0 0 0
Operations Operations 6 1 1,767 1,767 1,767 1,789 1,789 1,789 0 0 0
Operations Operations 6 2 1,596 1,596 1,596 1,790 1,790 1,790 0 0 0
Operations Operations 6 3 1,767 1,767 1,767 1,791 1,791 1,791 0 0 0
Operations Operations 6 4 1,710 1,710 1,710 1,792 1,792 1,792 0 0 0
Operations Operations 6 5 1,767 1,767 1,767 1,793 1,793 46,459 0 0 0
Operations Operations 6 6 9,065 9,065 9,065 1,794 23,277 135,228 4,276 119,172 232,484
Operations Operations 6 7 67,423 67,423 67,423 1,795 55,705 202,489 33,698 156,189 264,496
Operations Operations 6 8 55,069 55,069 55,069 1,796 41,394 146,449 0 120,707 218,299
Operations Operations 6 9 59,106 59,106 59,106 1,797 44,413 147,800 0 87,706 227,954
Operations Operations 6 10 15,859 15,859 15,859 1,798 8,030 63,437 0 0 64,652
Operations Operations 6 11 1,710 1,710 1,710 1,799 1,799 1,799 0 0 0
Operations Operations 6 12 1,767 1,767 1,767 1,800 1,800 1,800 0 0 0
Operations Operations 7 1 1,767 1,767 1,767 1,801 1,801 1,801 0 0 0
Operations Operations 7 2 1,596 1,596 1,596 1,802 1,802 1,802 0 0 10,803
Operations Operations 7 3 1,767 1,767 1,767 1,803 1,803 1,803 0 0 0
Operations Operations 7 4 1,710 1,710 1,710 1,804 1,804 1,804 0 0 0
Operations Operations 7 5 10,487 10,487 10,487 1,805 13,735 106,874 0 0 0
Operations Operations 7 6 77,817 77,817 77,817 1,806 65,190 171,312 10,517 129,659 227,558
Operations Operations 7 7 79,416 79,416 79,416 1,808 71,747 213,858 15,988 161,929 263,405
Operations Operations 7 8 67,424 67,424 67,424 1,809 55,866 160,715 0 147,513 220,514
Operations Operations 7 9 69,836 69,836 69,836 1,810 56,596 167,061 0 90,436 227,519
Operations Operations 7 10 1,767 6,845 41,886 1,811 1,811 59,664 0 0 51,687
Operations Operations 7 11 1,710 1,710 1,710 1,812 1,812 1,812 0 0 0
Operations Operations 7 12 1,767 1,767 1,767 1,813 1,813 1,813 0 0 0
Operations Operations 8 1 1,767 1,767 1,767 1,814 1,814 1,814 0 0 0
Operations Operations 8 2 1,653 1,653 1,653 1,815 1,815 1,815 0 0 0
Operations Operations 8 3 1,767 1,767 1,767 1,816 1,816 1,816 0 0 0
Operations Operations 8 4 1,710 1,710 1,710 1,817 1,817 1,817 0 0 0
Operations Operations 8 5 1,767 1,767 140,265 1,818 1,818 65,683 0 0 0
Operations Operations 8 6 1,710 55,401 264,374 1,819 58,484 183,182 30,116 152,205 256,030
Operations Operations 8 7 1,767 68,995 181,074 1,820 53,852 204,441 33,875 174,960 266,462
Operations Operations 8 8 1,767 52,606 150,010 1,821 37,498 154,150 0 157,340 222,301
Operations Operations 8 9 1,710 65,178 142,367 1,822 53,506 174,978 0 96,018 232,432
Operations Operations 8 10 1,767 24,401 55,186 1,823 11,419 80,757 0 0 91,044
Operations Operations 8 11 1,710 1,710 1,710 1,824 1,824 1,824 0 0 0
Operations Operations 8 12 1,767 1,767 1,767 1,825 1,825 1,825 0 0 0
Closure - HLF Au Recovery Operations 9 1 1,860 1,860 1,860 1,826 1,826 1,826 0 0 0
Closure - HLF Au Recovery Operations 9 2 1,680 1,680 1,680 1,826 1,826 1,826 0 0 0
Closure - HLF Au Recovery Operations 9 3 1,860 1,860 1,860 1,826 1,826 1,826 0 0 0
Closure - HLF Au Recovery Operations 9 4 1,800 1,800 1,800 1,826 1,826 7,852 0 0 0
Closure - HLF Au Recovery Operations 9 5 1,860 87,999 87,999 82,479 166,404 278,562 0 0 0
Closure - HLF Au Recovery Operations 9 6 100,389 123,782 123,782 63,470 137,070 253,095 51,289 164,729 269,422
Closure - HLF Au Recovery Operations 9 7 71,290 71,290 71,290 7,535 86,919 237,901 53,193 182,779 264,702
Closure - HLF Au Recovery Operations 9 8 64,383 64,383 64,383 9,030 75,823 184,991 12,968 164,968 223,337
B-2 of 8

5th percentile Median 95th percentile 5th percentile Median 95th percentile 5th percentile Median 95th percentileMine Life (yrs) MonthMine Phase (PFS) Mine Phase (FS)
Stantec PFS SWBM KP GoldSim PFS WBM KP GoldSim FS WBM
Closure - HLF Au Recovery Operations 9 9 67,412 67,412 67,412 17,503 82,514 206,104 0 111,293 238,441
Closure - HLF Au Recovery Operations 9 10 54,125 54,125 54,125 20,490 58,911 133,956 0 0 188,674
Closure - HLF Au Recovery Closure - HLF Au Recovery 9 11 18,901 18,901 18,901 5,532 14,940 40,287 0 0 0
Closure - HLF Au Recovery Closure - HLF Au Recovery 9 12 1,860 1,860 1,860 1,826 1,826 1,826 0 0 0
Closure - HLF Rinse Closure - HLF Au Recovery 10 1 1,860 1,860 1,860 47,786 47,786 47,786 0 0 0
Closure - HLF Rinse Closure - HLF Au Recovery 10 2 1,680 1,680 1,680 34,998 34,998 34,998 0 0 0
Closure - HLF Rinse Closure - HLF Au Recovery 10 3 1,860 1,860 1,860 30,287 30,287 30,287 0 0 0
Closure - HLF Rinse Closure - HLF Au Recovery 10 4 11,155 11,155 11,155 28,119 29,514 31,614 0 0 13,375
Closure - HLF Rinse Closure - HLF Au Recovery 10 5 140,260 140,260 140,260 149,273 191,603 252,472 0 0 240,319
Closure - HLF Rinse Closure - HLF Au Recovery 10 6 123,782 123,782 123,782 69,254 119,766 193,829 90,273 215,554 304,742
Closure - HLF Rinse Closure - HLF Au Recovery 10 7 71,290 71,290 71,290 23,755 73,769 170,663 134,459 186,378 263,046
Closure - HLF Rinse Closure - HLF Au Recovery 10 8 64,383 64,383 64,383 17,892 60,959 144,682 151,904 180,512 227,108
Closure - HLF Rinse Closure - HLF Au Recovery 10 9 85,426 85,426 85,426 9,485 35,065 96,814 170,594 209,738 264,125
Closure - HLF Rinse Closure - HLF Au Recovery 10 10 46,384 46,384 46,384 5,792 16,512 44,922 47,488 195,469 241,409
Closure - HLF Rinse Closure - HLF Rinse 10 11 6,348 6,348 6,348 1,066 1,066 1,066 3,353 119,652 119,652
Closure - HLF Rinse Closure - HLF Rinse 10 12 1,860 1,860 1,860 991 991 991 1,930 1,930 83,756
Closure - HLF Rinse Closure - HLF Rinse 11 1 930 930 930 913 913 913 1,421 1,421 53,095
Closure - HLF Rinse Closure - HLF Rinse 11 2 840 840 840 874 874 874 1,367 1,367 38,887
Closure - HLF Rinse Closure - HLF Rinse 11 3 930 930 930 839 839 839 1,346 1,346 33,652
Closure - HLF Rinse Closure - HLF Rinse 11 4 19,923 19,923 19,923 7,866 11,604 17,301 20,184 31,586 35,271
Closure - HLF Rinse Closure - HLF Rinse 11 5 200,860 200,860 200,860 75,915 108,190 155,674 212,596 305,080 390,730
Closure - HLF Rinse Closure - HLF Rinse 11 6 108,255 108,255 108,255 28,517 54,503 110,942 180,212 225,174 295,147
Closure - HLF Rinse Closure - HLF Rinse 11 7 76,243 76,243 76,243 14,719 46,143 128,491 138,353 185,878 265,760
Closure - HLF Rinse Closure - HLF Rinse 11 8 60,739 60,739 60,739 11,558 33,571 83,666 153,555 181,127 226,798
Closure - HLF Rinse Closure - HLF Rinse 11 9 71,937 71,937 71,937 8,949 34,076 95,357 177,787 210,349 264,065
Closure - HLF Rinse Closure - HLF Rinse 11 10 45,454 45,454 45,454 5,225 16,124 44,966 100,569 197,932 243,340
Closure - HLF Rinse Closure - HLF Rinse 11 11 5,448 5,448 5,448 533 533 533 11,036 119,652 119,652
Closure - HLF Rinse Closure - HLF Rinse 11 12 930 930 930 495 495 495 1,930 83,756 83,756
Closure - HLF Rinse Closure - HLF Rinse 12 1 465 465 465 457 457 457 1,421 1,421 53,095
Closure - HLF Rinse Closure - HLF Rinse 12 2 435 435 435 433 433 433 1,367 1,367 38,887
Closure - HLF Rinse Closure - HLF Rinse 12 3 1,863 1,863 1,863 412 412 412 1,346 1,346 33,652
Closure - HLF Rinse Closure - HLF Rinse 12 4 25,725 25,725 25,725 7,466 11,216 16,999 20,443 32,236 35,321
Closure - HLF Rinse Closure - HLF Rinse 12 5 202,875 202,875 202,875 75,235 108,371 156,160 213,499 306,391 392,479
Closure - HLF Rinse Closure - HLF Rinse 12 6 272,638 272,638 272,638 151,366 177,163 233,701 180,805 225,041 294,848
Closure - HLF Draindown Closure - HLF Rinse 12 7 292,599 347,667 445,313 122,164 164,635 242,918 137,969 186,093 263,163
Closure - HLF Draindown Closure - HLF Rinse 12 8 153,564 199,706 281,041 140,727 162,443 200,609 153,864 180,896 227,110
Closure - HLF Draindown Closure - HLF Rinse 12 9 80,314 145,145 227,217 160,539 188,632 247,180 177,958 210,110 264,435
Closure - HLF Draindown Closure - HLF Rinse 12 10 50,937 83,051 128,607 130,757 169,889 208,550 102,012 197,794 244,169
Closure - HLF Draindown Closure - HLF Draindown 12 11 19,988 23,364 28,014 42,867 48,041 97,473 11,628 119,652 119,652
Closure - HLF Draindown Closure - HLF Draindown 12 12 9,988 10,091 10,193 35,587 35,587 35,587 83,756 83,756 83,756
Closure - HLF Draindown Closure - HLF Draindown 13 1 7,983 8,061 8,139 30,379 30,379 30,379 53,095 53,095 53,095
Closure - HLF Draindown Closure - HLF Draindown 13 2 6,222 6,258 6,293 26,621 26,621 26,621 38,887 38,887 38,887
Closure - HLF Draindown Closure - HLF Draindown 13 3 6,142 6,152 6,162 23,770 23,770 23,770 33,652 33,652 33,652
Closure - HLF Draindown Closure - HLF Draindown 13 4 15,658 32,246 57,627 24,241 25,734 28,047 31,047 32,812 35,329
Closure - HLF Draindown Closure - HLF Draindown 13 5 77,363 228,129 459,451 49,284 62,312 81,495 242,470 305,015 392,972
Closure - HLF Draindown Closure - HLF Draindown 13 6 47,649 124,857 263,057 28,475 39,079 61,369 183,255 225,713 294,768
Closure - HLF Draindown Closure - HLF Draindown 13 7 83,599 91,620 104,699 21,525 34,095 65,492 139,306 185,997 262,454
Closure - HLF Draindown Closure - HLF Draindown 13 8 73,162 73,162 73,162 18,932 27,520 48,036 154,493 180,592 227,354
Closure - HLF Draindown Closure - HLF Draindown 13 9 84,248 84,248 84,248 16,982 27,045 51,367 180,635 211,213 263,937
Closure - HLF Draindown Closure - HLF Draindown 13 10 45,650 45,650 45,650 14,372 18,749 30,055 176,640 200,110 244,744
Closure - HLF Draindown Closure - HLF Draindown 13 11 8,421 8,421 8,421 11,717 11,717 11,717 119,652 119,652 119,652
Closure - HLF Draindown Closure - HLF Draindown 13 12 4,456 4,456 4,456 10,939 10,939 10,939 83,756 83,756 83,756
Closure - HLF Draindown Closure - HLF Draindown 14 1 4,136 4,136 4,136 13,531 13,531 13,531 53,095 53,095 53,095
Closure - HLF Draindown Closure - HLF Draindown 14 2 3,763 3,763 3,763 6,403 6,403 6,403 38,887 38,887 38,887
Closure - HLF Draindown Closure - HLF Draindown 14 3 3,713 3,713 3,713 9,125 9,125 9,125 33,652 33,652 33,652
Closure - HLF Draindown Closure - HLF Draindown 14 4 25,807 25,807 25,807 11,552 13,050 15,348 31,069 32,823 35,306
Closure - HLF Draindown Closure - HLF Draindown 14 5 192,168 192,168 192,168 40,786 53,822 72,909 241,499 305,701 390,768
B-3 of 8

5th percentile Median 95th percentile 5th percentile Median 95th percentile 5th percentile Median 95th percentileMine Life (yrs) MonthMine Phase (PFS) Mine Phase (FS)
Stantec PFS SWBM KP GoldSim PFS WBM KP GoldSim FS WBM
Closure - HLF Draindown Closure - HLF Draindown 14 6 102,836 102,836 102,836 18,819 29,225 51,312 183,801 225,380 293,634
Closure - HLF Draindown Closure - HLF Draindown 14 7 77,747 77,747 77,747 13,125 25,509 57,041 139,528 185,537 262,316
Closure - HLF Draindown Closure - HLF Draindown 14 8 62,748 62,748 62,748 11,262 19,981 40,404 153,906 180,533 227,108
Closure - HLF Draindown Closure - HLF Draindown 14 9 72,218 72,218 72,218 10,145 20,379 43,961 180,188 211,394 262,583
Closure - HLF Draindown Closure - HLF Draindown 14 10 21,626 21,626 21,626 8,372 12,633 23,758 176,342 199,418 243,518
Closure - HLF Draindown Closure - HLF Draindown 14 11 2,929 2,929 2,929 6,274 6,274 6,274 119,652 119,652 119,652
Closure - HLF Draindown Closure - HLF Draindown 14 12 2,926 2,926 2,926 5,885 5,885 5,885 83,756 83,756 83,756
Closure - HLF Draindown Closure - HLF Draindown 15 1 2,877 2,877 2,877 5,885 5,885 5,885 53,095 53,095 53,095
Closure - HLF Draindown Closure - HLF Draindown 15 2 2,683 2,683 2,683 5,626 5,626 5,626 38,887 38,887 38,887
Closure - HLF Draindown Closure - HLF Draindown 15 3 2,777 2,777 2,777 5,496 5,496 5,496 33,652 33,652 33,652
Closure - HLF Draindown Closure - HLF Draindown 15 4 15,202 15,202 15,202 8,048 9,531 11,821 31,070 32,812 35,280
Closure - HLF Draindown Closure - HLF Draindown 15 5 108,177 108,177 108,177 35,158 48,008 67,122 242,342 304,316 390,213
Closure - HLF Draindown Closure - HLF Draindown 15 6 12,373 12,373 12,373 16,078 26,602 49,266 183,256 225,690 295,701
Closure - HLF Draindown Closure - HLF Draindown 15 7 11,297 11,297 11,297 10,444 22,848 55,937 134,456 184,038 264,704
Closure - HLF Draindown Closure - HLF Draindown 15 8 8,542 8,542 8,542 9,036 17,792 38,532 24,014 178,198 226,346
Closure - HLF Draindown Closure - HLF Draindown 15 9 8,679 8,679 8,679 7,975 18,232 42,306 16,363 202,335 258,868
Closure - HLF Draindown Closure - HLF Draindown 15 10 4,917 4,917 4,917 6,331 10,626 21,730 9,236 179,352 232,977
Closure - HLF Draindown Closure - HLF Draindown 15 11 1,239 1,239 1,239 4,330 4,330 4,330 6,949 6,949 119,652
Closure - HLF Draindown Closure - HLF Draindown 15 12 1,222 1,222 1,222 4,200 4,200 4,200 6,756 6,756 83,756
Closure - HLF Draindown Closure - HLF Draindown 16 1 1,199 1,199 1,199 5,496 5,496 5,496 6,563 6,563 53,095
Closure - HLF Draindown Closure - HLF Draindown 16 2 1,164 1,164 1,164 2,775 2,775 2,775 6,370 6,370 38,887
Closure - HLF Draindown Closure - HLF Draindown 16 3 1,153 1,153 1,153 5,237 5,237 5,237 6,177 6,177 33,652
Closure - HLF Draindown Closure - HLF Draindown 16 4 3,569 3,569 3,569 6,643 8,133 10,433 7,849 9,085 32,494
Closure - HLF Draindown Closure - HLF Draindown 16 5 22,515 22,515 22,515 33,743 46,977 66,333 29,795 41,575 284,084
Closure - HLF Draindown Closure - HLF Draindown 16 6 12,097 12,097 12,097 14,949 25,241 48,187 14,582 25,312 45,716
Closure - HLF Draindown Closure - HLF Draindown 16 7 11,019 11,019 11,019 9,290 21,505 53,849 15,706 28,071 50,025
Closure - HLF Draindown Closure - HLF Draindown 16 8 8,262 8,262 8,262 7,818 16,522 36,206 10,523 19,966 36,102
Closure - HLF Draindown Closure - HLF Draindown 16 9 8,397 8,397 8,397 6,940 17,224 41,433 10,486 18,624 32,309
Closure - HLF Draindown Closure - HLF Draindown 16 10 4,633 4,633 4,633 5,263 9,557 21,042 6,888 10,057 16,255
Closure - HLF Draindown Closure - HLF Draindown 16 11 953 953 953 3,423 3,423 3,423 5,212 5,212 5,212
Closure - HLF Draindown Closure - HLF Draindown 16 12 934 934 934 3,293 3,293 3,293 5,019 5,019 5,019
Closure - HLF Draindown Closure - HLF Draindown 17 1 909 909 909 3,293 3,293 3,293 5,019 5,019 5,019
Closure - HLF Draindown Closure - HLF Draindown 17 2 867 867 867 3,293 3,293 3,293 4,826 4,826 4,826
Closure - HLF Draindown Closure - HLF Draindown 17 3 860 860 860 3,293 3,293 3,293 4,826 4,826 4,826
Closure - HLF Draindown Closure - HLF Draindown 17 4 3,273 3,273 3,273 5,963 7,493 9,735 6,465 7,624 9,206
Closure - HLF Draindown Closure - HLF Draindown 17 5 22,218 22,218 22,218 32,839 45,960 64,733 26,294 37,453 52,167
Closure - HLF Draindown Closure - HLF Draindown 17 6 11,798 11,798 11,798 14,144 24,460 46,956 15,129 25,666 43,343
Closure - HLF Draindown Closure - HLF Draindown 17 7 10,736 10,736 10,736 8,678 21,153 53,815 12,842 25,353 46,734
Closure - HLF Draindown Closure - HLF Draindown 17 8 7,995 7,995 7,995 7,381 15,952 36,080 9,661 18,944 35,303
Closure - HLF Draindown Closure - HLF Draindown 17 9 8,147 8,147 8,147 6,220 16,307 41,177 9,048 17,097 31,120
Closure - HLF Draindown Closure - HLF Draindown 17 10 4,401 4,401 4,401 4,765 9,081 20,283 5,750 8,924 14,972
Closure - HLF Draindown Closure - HLF Draindown 17 11 737 737 737 2,904 2,904 2,904 4,246 4,246 4,246
Closure - HLF Draindown Closure - HLF Draindown 17 12 735 735 735 3,682 3,682 3,682 4,246 4,246 4,246
Closure - HLF Draindown Closure - HLF Draindown 18 1 727 727 727 2,775 2,775 2,775 4,053 4,053 4,053
Closure - HLF Draindown Closure - HLF Draindown 18 2 700 700 700 1,860 1,860 1,860 4,053 4,053 4,053
Closure - HLF Draindown Closure - HLF Draindown 18 3 710 710 710 3,537 3,537 3,537 4,053 4,053 4,053
Closure - HLF Draindown Closure - HLF Draindown 18 4 3,140 3,140 3,140 5,580 7,065 9,284 7,067 8,195 9,744
Closure - HLF Draindown Closure - HLF Draindown 18 5 22,102 22,102 22,102 32,652 45,701 64,461 25,541 36,745 51,685
Closure - HLF Draindown Closure - HLF Draindown 18 6 11,698 11,698 11,698 13,615 24,164 45,818 12,970 23,647 40,732
Closure - HLF Draindown Closure - HLF Draindown 18 7 10,612 10,612 10,612 8,300 20,653 52,294 13,340 25,692 46,458
Closure - HLF Draindown Closure - HLF Draindown 18 8 7,787 7,787 7,787 6,888 15,639 35,668 9,012 18,483 34,747
Closure - HLF Draindown Closure - HLF Draindown 18 9 7,854 7,854 7,854 5,979 15,992 39,746 8,757 16,714 30,147
Closure - HLF Draindown Closure - HLF Draindown 18 10 4,045 4,045 4,045 4,279 8,660 19,994 5,141 8,367 14,477
Closure - HLF Draindown Closure - HLF Draindown 18 11 343 343 343 2,439 2,439 2,439 3,667 3,667 3,667
Closure - HLF Draindown Closure - HLF Draindown 18 12 186 186 186 2,432 2,432 2,432 3,667 3,667 3,667
Post-closure Monitoring Closure - HLF Draindown 19 1 93 93 93 91 91 91 3,667 3,667 3,667
Post-closure Monitoring Closure - HLF Draindown 19 2 84 84 84 87 87 87 3,474 3,474 3,474
B-4 of 8

5th percentile Median 95th percentile 5th percentile Median 95th percentile 5th percentile Median 95th percentileMine Life (yrs) MonthMine Phase (PFS) Mine Phase (FS)
Stantec PFS SWBM KP GoldSim PFS WBM KP GoldSim FS WBM
Post-closure Monitoring Closure - HLF Draindown 19 3 93 93 93 84 84 84 3,474 3,474 3,474
Post-closure Monitoring Closure - HLF Draindown 19 4 2,535 2,535 2,535 1,483 2,233 3,342 5,308 6,450 8,014
Post-closure Monitoring Closure - HLF Draindown 19 5 21,501 21,501 21,501 15,085 21,543 30,867 25,066 36,196 51,307
Post-closure Monitoring Closure - HLF Draindown 19 6 11,109 11,109 11,109 5,595 10,820 21,744 13,884 24,500 41,794
Post-closure Monitoring Closure - HLF Draindown 19 7 10,053 10,053 10,053 2,905 9,188 25,551 11,737 24,293 45,630
Post-closure Monitoring Closure - HLF Draindown 19 8 7,320 7,320 7,320 2,191 6,554 16,859 8,566 18,034 34,750
Post-closure Monitoring Closure - HLF Draindown 19 9 7,484 7,484 7,484 1,710 6,719 18,897 8,449 16,462 30,224
Post-closure Monitoring Closure - HLF Draindown 19 10 1,488 3,742 6,937 985 3,139 8,815 4,780 7,951 14,075
Post-closure Monitoring Closure - HLF Draindown 19 11 90 90 90 53 53 53 3,281 3,281 3,281
Post-closure Monitoring Closure - HLF Draindown 19 12 93 93 93 50 50 50 3,281 3,281 3,281
Post-closure Monitoring Closure - HLF Draindown 20 1 47 47 47 46 46 46 3,281 3,281 3,281
Post-closure Monitoring Closure - HLF Draindown 20 2 44 44 44 46 46 46 3,281 3,281 3,281
Post-closure Monitoring Closure - HLF Draindown 20 3 47 47 47 46 46 46 3,281 3,281 3,281
Post-closure Monitoring Closure - HLF Draindown 20 4 979 2,490 4,833 1,458 2,215 3,381 6,095 7,249 8,886
Post-closure Monitoring Closure - HLF Draindown 20 5 8,103 21,455 42,259 15,087 21,673 31,448 25,034 36,250 51,998
Post-closure Monitoring Closure - HLF Draindown 20 6 3,511 11,064 21,190 5,536 10,897 22,421 13,555 24,520 42,648
Post-closure Monitoring Closure - HLF Draindown 20 7 2,957 10,006 18,840 2,865 9,006 24,518 11,458 23,854 44,302
Post-closure Monitoring Closure - HLF Draindown 20 8 2,162 7,274 13,725 2,220 6,538 16,672 8,313 17,654 34,109
Post-closure Monitoring Closure - HLF Draindown 20 9 2,050 7,439 14,160 1,742 6,831 19,057 8,175 16,239 30,022
Post-closure Monitoring Closure - HLF Draindown 20 10 3,696 3,696 3,696 985 3,098 8,773 4,610 7,720 13,851
Post-closure Monitoring Closure - HLF Draindown 20 11 45 45 45 46 46 46 3,088 3,088 3,088
Post-closure Monitoring Closure - HLF Draindown 20 12 47 47 47 46 46 46 3,088 3,088 3,088
Post-closure Monitoring Closure - HLF Draindown 21 1 47 47 47 46 46 46 3,088 3,088 3,088
Post-closure Monitoring Closure - HLF Draindown 21 2 42 42 42 46 46 46 3,088 3,088 3,088
Post-closure Monitoring Closure - HLF Draindown 21 3 47 47 47 46 46 46 3,088 3,088 3,088
Post-closure Monitoring Closure - HLF Draindown 21 4 2,490 2,490 2,490 1,452 2,199 3,328 4,921 6,068 7,632
Post-closure Monitoring Closure - HLF Draindown 21 5 21,455 21,455 21,455 15,005 21,543 31,048 24,678 35,912 50,964
Post-closure Monitoring Closure - HLF Draindown 21 6 11,064 11,064 11,064 5,558 10,758 22,249 13,525 24,121 42,141
Post-closure Monitoring Closure - HLF Draindown 21 7 10,006 10,006 10,006 2,977 9,262 25,048 11,597 24,061 44,681
Post-closure Monitoring Closure - HLF Draindown 21 8 7,274 7,274 7,274 2,189 6,617 16,633 8,228 17,799 34,049
Post-closure Monitoring Closure - HLF Draindown 21 9 7,439 7,439 7,439 1,728 6,736 18,931 8,141 16,117 29,889
Post-closure Monitoring Closure - HLF Draindown 21 10 3,696 3,696 3,696 981 3,184 8,877 4,601 7,827 13,955
Post-closure Monitoring Closure - HLF Draindown 21 11 45 45 45 46 46 46 3,088 3,088 3,088
Post-closure Monitoring Closure - HLF Draindown 21 12 47 47 47 46 46 46 3,088 3,088 3,088
Post-closure Monitoring Closure - HLF Draindown 22 1 47 47 47 46 46 46 3,088 3,088 3,088
Post-closure Monitoring Closure - HLF Draindown 22 2 42 42 42 46 46 46 4,053 4,053 4,053
Post-closure Monitoring Closure - HLF Draindown 22 3 47 47 47 46 46 46 3,088 3,088 3,088
Post-closure Monitoring Closure - HLF Draindown 22 4 2,490 2,490 2,490 1,453 2,201 3,337 4,926 6,073 7,661
Post-closure Monitoring Closure - HLF Draindown 22 5 21,455 21,455 21,455 14,972 21,576 31,087 24,708 35,950 51,391
Post-closure Monitoring Closure - HLF Draindown 22 6 11,064 11,064 11,064 5,534 10,818 22,053 13,370 24,213 41,856
Post-closure Monitoring Closure - HLF Draindown 22 7 10,006 10,006 10,006 2,887 8,993 24,865 11,394 23,635 44,472
Post-closure Monitoring Closure - HLF Draindown 22 8 7,274 7,274 7,274 2,216 6,543 16,533 8,301 17,664 33,898
Post-closure Monitoring Closure - HLF Draindown 22 9 7,439 7,439 7,439 1,761 6,829 19,179 8,220 16,236 30,151
Post-closure Monitoring Closure - HLF Draindown 22 10 3,696 3,696 3,696 977 3,070 8,662 4,594 7,686 13,741
Post-closure Monitoring Closure - HLF Draindown 22 11 45 45 45 46 46 46 0 0 0
Post-closure Monitoring Post-closure Monitoring 22 12 47 47 47 46 46 46 0 0 0
NOTES:
1. PFS = PRE-FEASIBILITY STUDY; FS = FEASIBILITY STUDY
2. SWBM = SURFACE WATER BALANCE MODEL; WBM = WATER BALANCE MODEL
3. PFS WATER BALANCE MODEL ASSUMES CAMP GREY WATER IS ROUTED THROUGH MWTP DURING ALL MONTHS OF SIMULATION.
M:\1\01\00290\06\A\Data\200 YESAB REVIEW - PROJECT DESCRIPTION\220 Support Analysis\Water Balance\Water Licencing WBM - GoldSim\1_Results\[Eagle Gold WBM_comparison_WBM_WL04.xlsx]Summary table
0 27APR'12 ER CAISSUED WITH LETTER VA12-00744 KJB
DATE DESCRIPTION PREP'D CHK'D APP'DREV
B-5 of 8

5th percentile Median 95th percentile 5th percentile Median 95th percentile 5th percentile Median 95th percentile
Closure - HLF Draindown Closure - HLF Rinse 12 7 0 0 0 11,850 30,273 86,887 0 0 0
Closure - HLF Draindown Closure - HLF Rinse 12 8 0 0 0 7,776 22,935 60,107 0 0 0
Closure - HLF Draindown Closure - HLF Rinse 12 9 0 0 0 7,800 25,994 72,706 0 0 0
Closure - HLF Draindown Closure - HLF Rinse 12 10 0 0 0 8,940 20,470 44,353 0 0 0
Closure - HLF Draindown Closure - HLF Draindown 12 11 0 0 0 1,549 3,646 9,287 0 0 0
Closure - HLF Draindown Closure - HLF Draindown 12 12 0 0 0 359 359 359 0 0 0
Closure - HLF Draindown Closure - HLF Draindown 13 1 0 0 0 209 209 209 0 0 0
Closure - HLF Draindown Closure - HLF Draindown 13 2 0 0 0 120 120 120 0 0 0
Closure - HLF Draindown Closure - HLF Draindown 13 3 0 0 0 90 90 90 0 0 0
Closure - HLF Draindown Closure - HLF Draindown 13 4 0 0 0 5,493 8,301 12,650 0 0 0
Closure - HLF Draindown Closure - HLF Draindown 13 5 0 0 0 55,181 80,237 117,422 0 0 0
Closure - HLF Draindown Closure - HLF Draindown 13 6 0 0 0 32,082 50,723 90,114 0 0 0
Closure - HLF Draindown Closure - HLF Draindown 13 7 0 0 0 11,762 30,475 86,948 0 0 0
Closure - HLF Draindown Closure - HLF Draindown 13 8 0 0 0 7,987 22,849 59,198 0 0 0
Closure - HLF Draindown Closure - HLF Draindown 13 9 0 0 0 8,002 26,200 72,370 0 0 0
Closure - HLF Draindown Closure - HLF Draindown 13 10 0 0 0 9,007 20,484 44,489 0 0 0
Closure - HLF Draindown Closure - HLF Draindown 13 11 0 0 0 1,558 3,676 9,147 0 0 0
Closure - HLF Draindown Closure - HLF Draindown 13 12 0 0 0 359 359 359 0 0 0
Closure - HLF Draindown Closure - HLF Draindown 14 1 0 0 0 209 209 209 0 0 0
Closure - HLF Draindown Closure - HLF Draindown 14 2 0 0 0 120 120 120 0 0 0
Closure - HLF Draindown Closure - HLF Draindown 14 3 0 0 0 90 90 90 0 0 0
Closure - HLF Draindown Closure - HLF Draindown 14 4 0 0 0 5,515 8,332 12,654 0 0 0
Closure - HLF Draindown Closure - HLF Draindown 14 5 0 0 0 55,163 80,269 117,322 0 0 0
Closure - HLF Draindown Closure - HLF Draindown 14 6 0 0 0 32,047 50,579 88,931 0 0 0
Closure - HLF Draindown Closure - HLF Draindown 14 7 0 0 0 11,864 30,368 87,738 0 0 0
Closure - HLF Draindown Closure - HLF Draindown 14 8 0 0 0 7,752 22,594 59,203 0 0 0
Closure - HLF Draindown Closure - HLF Draindown 14 9 0 0 0 7,874 26,369 71,019 0 0 0
Closure - HLF Draindown Closure - HLF Draindown 14 10 22,408 22,408 22,408 8,786 20,248 43,310 0 0 0
Closure - HLF Draindown Closure - HLF Draindown 14 11 4,195 4,195 4,195 1,540 3,602 8,985 0 0 0
Closure - HLF Draindown Closure - HLF Draindown 14 12 349 349 349 359 359 359 70 70 70
Closure - HLF Draindown Closure - HLF Draindown 15 1 195 195 195 209 209 209 41 41 41
Closure - HLF Draindown Closure - HLF Draindown 15 2 132 132 132 120 120 120 23 23 23
Closure - HLF Draindown Closure - HLF Draindown 15 3 104 104 104 90 90 90 17 17 17
Closure - HLF Draindown Closure - HLF Draindown 15 4 9,790 9,790 9,790 5,506 8,295 12,602 5,286 8,397 12,804
Closure - HLF Draindown Closure - HLF Draindown 15 5 83,030 83,030 83,030 55,261 80,083 117,423 63,194 94,090 136,912
Closure - HLF Draindown Closure - HLF Draindown 15 6 50,908 50,908 50,908 32,497 50,474 90,124 53,818 85,803 135,715
Closure - HLF Draindown Closure - HLF Draindown 15 7 32,930 32,930 32,930 12,010 30,075 88,746 39,893 75,659 135,571
Closure - HLF Draindown Closure - HLF Draindown 15 8 24,190 24,190 24,190 7,815 22,962 60,575 30,149 59,172 107,330
Closure - HLF Draindown Closure - HLF Draindown 15 9 28,444 28,444 28,444 7,860 26,511 72,400 25,242 49,878 88,637
Closure - HLF Draindown Closure - HLF Draindown 15 10 22,408 22,408 22,408 8,907 20,333 43,728 11,802 23,336 41,690
Closure - HLF Draindown Closure - HLF Draindown 15 11 4,195 4,195 4,195 1,556 3,634 9,007 1,209 3,462 7,745
Closure - HLF Draindown Closure - HLF Draindown 15 12 349 349 349 359 359 359 70 70 70
Closure - HLF Draindown Closure - HLF Draindown 16 1 195 195 195 209 209 209 41 41 41
Closure - HLF Draindown Closure - HLF Draindown 16 2 132 132 132 120 120 120 23 23 23
Closure - HLF Draindown Closure - HLF Draindown 16 3 104 104 104 90 90 90 17 17 17
Closure - HLF Draindown Closure - HLF Draindown 16 4 9,790 9,790 9,790 5,544 8,346 12,672 5,274 8,464 12,953
Closure - HLF Draindown Closure - HLF Draindown 16 5 83,030 83,030 83,030 55,350 80,452 117,757 62,844 94,790 138,581
Closure - HLF Draindown Closure - HLF Draindown 16 6 50,908 50,908 50,908 32,191 50,467 90,275 53,957 86,160 137,040
Closure - HLF Draindown Closure - HLF Draindown 16 7 32,930 32,930 32,930 11,663 29,878 88,159 39,404 75,866 135,476
Closure - HLF Draindown Closure - HLF Draindown 16 8 24,190 24,190 24,190 7,737 22,627 58,799 29,849 58,859 105,234
Closure - HLF Draindown Closure - HLF Draindown 16 9 28,444 28,444 28,444 7,963 26,678 72,615 25,317 49,992 88,563
Closure - HLF Draindown Closure - HLF Draindown 16 10 22,408 22,408 22,408 8,864 20,303 44,212 11,744 23,284 41,857
Closure - HLF Draindown Closure - HLF Draindown 16 11 4,195 4,195 4,195 1,541 3,618 9,176 1,186 3,447 7,869
Closure - HLF Draindown Closure - HLF Draindown 16 12 349 349 349 359 359 359 70 70 70
Closure - HLF Draindown Closure - HLF Draindown 17 1 195 195 195 209 209 209 41 41 41
Closure - HLF Draindown Closure - HLF Draindown 17 2 132 132 132 120 120 120 23 23 23
Closure - HLF Draindown Closure - HLF Draindown 17 3 104 104 104 90 90 90 17 17 17
Closure - HLF Draindown Closure - HLF Draindown 17 4 9,790 9,790 9,790 5,485 8,362 12,579 5,245 8,449 12,823
Closure - HLF Draindown Closure - HLF Draindown 17 5 83,030 83,030 83,030 55,129 80,370 116,978 63,022 94,647 136,354
Closure - HLF Draindown Closure - HLF Draindown 17 6 50,908 50,908 50,908 32,248 50,576 89,677 53,435 85,747 136,083
Closure - HLF Draindown Closure - HLF Draindown 17 7 32,930 32,930 32,930 11,744 30,396 88,601 39,680 76,216 136,246
Closure - HLF Draindown Closure - HLF Draindown 17 8 24,190 24,190 24,190 7,846 22,918 58,641 30,083 59,216 105,064
Closure - HLF Draindown Closure - HLF Draindown 17 9 28,444 28,444 28,444 7,885 26,099 72,716 25,089 49,337 88,895
Closure - HLF Draindown Closure - HLF Draindown 17 10 22,408 22,408 22,408 8,924 20,413 43,864 11,780 23,386 41,927
Closure - HLF Draindown Closure - HLF Draindown 17 11 4,195 4,195 4,195 1,550 3,639 9,059 1,201 3,466 7,783
Closure - HLF Draindown Closure - HLF Draindown 17 12 349 349 349 359 359 359 70 70 70
Closure - HLF Draindown Closure - HLF Draindown 18 1 195 195 195 209 209 209 41 41 41
Closure - HLF Draindown Closure - HLF Draindown 18 2 132 132 132 120 120 120 23 23 23
Closure - HLF Draindown Closure - HLF Draindown 18 3 104 104 104 90 90 90 17 17 17
Closure - HLF Draindown Closure - HLF Draindown 18 4 9,790 9,790 9,790 5,537 8,331 12,503 5,306 8,426 12,710
Closure - HLF Draindown Closure - HLF Draindown 18 5 83,030 83,030 83,030 55,434 80,266 116,771 63,025 94,802 137,156
Closure - HLF Draindown Closure - HLF Draindown 18 6 50,908 50,908 50,908 32,244 50,575 88,492 53,147 85,833 134,442
Closure - HLF Draindown Closure - HLF Draindown 18 7 32,930 32,930 32,930 11,919 30,191 87,319 39,736 76,115 135,051
Closure - HLF Draindown Closure - HLF Draindown 18 8 24,190 24,190 24,190 7,759 22,793 59,490 29,916 59,011 105,754
Closure - HLF Draindown Closure - HLF Draindown 18 9 28,444 28,444 28,444 8,162 26,011 71,394 25,713 49,409 87,906
Closure - HLF Draindown Closure - HLF Draindown 18 10 22,408 22,408 22,408 8,829 20,286 44,221 11,739 23,285 42,235
Closure - HLF Draindown Closure - HLF Draindown 18 11 4,195 4,195 4,195 1,536 3,657 9,141 1,180 3,482 7,843
Closure - HLF Draindown Closure - HLF Draindown 18 12 349 349 349 359 359 359 70 70 70
Post-closure Monitoring Closure - HLF Draindown 19 1 195 195 195 209 209 209 41 41 41
Post-closure Monitoring Closure - HLF Draindown 19 2 132 132 132 120 120 120 23 23 23
Post-closure Monitoring Closure - HLF Draindown 19 3 104 104 104 90 90 90 17 17 17
Post-closure Monitoring Closure - HLF Draindown 19 4 9,790 9,790 9,790 5,496 8,316 12,488 5,248 8,406 12,729
Post-closure Monitoring Closure - HLF Draindown 19 5 83,030 83,030 83,030 55,235 80,076 116,506 62,733 94,351 137,130
Post-closure Monitoring Closure - HLF Draindown 19 6 50,908 50,908 50,908 32,162 50,119 88,314 53,127 85,530 134,510
Post-closure Monitoring Closure - HLF Draindown 19 7 32,930 32,930 32,930 11,852 30,495 88,766 39,918 76,289 136,024
Post-closure Monitoring Closure - HLF Draindown 19 8 24,190 24,190 24,190 7,725 22,950 59,653 29,803 59,039 106,140
Post-closure Monitoring Closure - HLF Draindown 19 9 28,444 28,444 28,444 7,617 26,109 71,898 24,596 49,500 88,565
Post-closure Monitoring Closure - HLF Draindown 19 10 12,456 22,408 37,110 8,904 20,232 44,173 11,801 23,241 42,119
Post-closure Monitoring Closure - HLF Draindown 19 11 1,768 4,195 7,522 1,548 3,633 9,126 1,197 3,460 7,832
Post-closure Monitoring Closure - HLF Draindown 19 12 247 349 451 359 359 359 70 70 70
Post-closure Monitoring Closure - HLF Draindown 20 1 117 195 273 209 209 209 41 41 41
Post-closure Monitoring Closure - HLF Draindown 20 2 96 132 167 120 120 120 23 23 23
Post-closure Monitoring Closure - HLF Draindown 20 3 94 104 114 90 90 90 17 17 17
Post-closure Monitoring Closure - HLF Draindown 20 4 3,682 9,790 19,133 5,533 8,381 12,765 5,289 8,480 13,006
Post-closure Monitoring Closure - HLF Draindown 20 5 29,702 83,030 168,352 55,374 80,710 118,845 63,184 95,031 139,622
Post-closure Monitoring Closure - HLF Draindown 20 6 14,809 50,908 109,107 32,271 51,026 91,437 52,840 86,327 138,035
Post-closure Monitoring Closure - HLF Draindown 20 7 5,837 32,930 77,064 12,049 30,109 86,133 40,099 75,820 134,083
Post-closure Monitoring Closure - HLF Draindown 20 8 4,448 24,190 56,401 7,677 22,769 58,992 29,926 58,828 105,275
Post-closure Monitoring Closure - HLF Draindown 20 9 4,709 28,444 62,266 7,975 26,188 72,981 25,347 49,562 89,457
Post-closure Monitoring Closure - HLF Draindown 20 10 17,759 22,408 28,807 8,875 20,212 44,010 11,789 23,216 41,970
Post-closure Monitoring Closure - HLF Draindown 20 11 4,195 4,195 4,195 1,559 3,603 9,096 1,214 3,434 7,810
Post-closure Monitoring Closure - HLF Draindown 20 12 349 349 349 359 359 359 70 70 70
Post-closure Monitoring Closure - HLF Draindown 21 1 195 195 195 209 209 209 41 41 41
Post-closure Monitoring Closure - HLF Draindown 21 2 132 132 132 120 120 120 23 23 23
Post-closure Monitoring Closure - HLF Draindown 21 3 104 104 104 90 90 90 17 17 17
Post-closure Monitoring Closure - HLF Draindown 21 4 9,790 9,790 9,790 5,508 8,319 12,563 5,244 8,417 12,742
Post-closure Monitoring Closure - HLF Draindown 21 5 83,030 83,030 83,030 55,214 80,199 117,156 62,828 94,593 137,120
Post-closure Monitoring Closure - HLF Draindown 21 6 50,908 50,908 50,908 32,056 50,386 90,644 53,200 85,610 136,254
Post-closure Monitoring Closure - HLF Draindown 21 7 32,930 32,930 32,930 11,981 30,506 86,991 40,668 76,506 134,587
Post-closure Monitoring Closure - HLF Draindown 21 8 24,190 24,190 24,190 7,913 22,956 59,235 30,006 59,417 105,756
Post-closure Monitoring Closure - HLF Draindown 21 9 28,444 28,444 28,444 7,982 26,122 72,203 25,373 49,377 88,009
Post-closure Monitoring Closure - HLF Draindown 21 10 22,408 22,408 22,408 9,026 20,359 44,938 12,002 23,322 42,448
Post-closure Monitoring Closure - HLF Draindown 21 11 4,195 4,195 4,195 1,555 3,687 9,197 1,208 3,510 7,884
Post-closure Monitoring Closure - HLF Draindown 21 12 349 349 349 359 359 359 70 70 70
Post-closure Monitoring Closure - HLF Draindown 22 1 195 195 195 209 209 209 41 41 41
Post-closure Monitoring Closure - HLF Draindown 22 2 132 132 132 120 120 120 23 23 23
Post-closure Monitoring Closure - HLF Draindown 22 3 104 104 104 90 90 90 17 17 17
Post-closure Monitoring Closure - HLF Draindown 22 4 9,790 9,790 9,790 5,511 8,327 12,601 5,258 8,431 12,822
Post-closure Monitoring Closure - HLF Draindown 22 5 83,030 83,030 83,030 55,097 80,374 117,158 62,895 94,631 138,401
Post-closure Monitoring Closure - HLF Draindown 22 6 50,908 50,908 50,908 32,087 50,493 90,249 52,952 85,986 136,271
Post-closure Monitoring Closure - HLF Draindown 22 7 32,930 32,930 32,930 11,847 30,004 86,745 39,773 75,717 134,749
Post-closure Monitoring Closure - HLF Draindown 22 8 24,190 24,190 24,190 7,876 22,922 59,374 30,049 59,244 105,938
Post-closure Monitoring Closure - HLF Draindown 22 9 28,444 28,444 28,444 8,007 26,218 73,353 25,443 49,743 89,205
Post-closure Monitoring Closure - HLF Draindown 22 10 22,408 22,408 22,408 8,787 20,159 43,431 11,671 23,208 41,546
Post-closure Monitoring Closure - HLF Draindown 22 11 4,195 4,195 4,195 1,551 3,577 8,989 1,203 3,410 7,731
Post-closure Monitoring Post-closure Monitoring 22 12 349 349 349 359 359 359 70 70 70
NOTES:
1. PFS = PRE-FEASIBILITY STUDY; FS = FEASIBILITY STUDY
2. SWBM = SURFACE WATER BALANCE MODEL; WBM = WATER BALANCE MODEL
4. THE STANTEC PFS SWBM MEDIAN SCENARIO REPRESENTS AN ANNUAL PRECIPITATION WITH A 2-YR RETURN PERIOD (FOR ALL YEARS OF SIMULATION), WHILE THE 5TH (DRY) AND 95TH (WET) SCENARIOS REPRESENT AN ANNUAL PRECIPITATION WITH A 20-YR RETURN PERIOD (SELECT YEARS SHADED IN GREY).
5. THE KP WBM (PFS AND FS) VARIES THE MONTHLY PRECIPITATION VALUES WITH MONTHLY PROBABILITY DISTRIBUTIONS USING A MONTE CARLO SIMULATION IN THE GOLDSIM SOFTWARE.
Print Apr/30/12 15:02:04
3. THE KP PFS GOLDSIM MODEL ASSUMES THE EAGLE PUP WRSA RUNOFF AND SEEPAGE GO TO PASSIVE TREATMENT AS SOON AS THE CLOSURE COVER IS EFFECTIVE IN YEAR 10. THE STANTEC PFS MODEL ASSUMES THE EAGLE PUP WRSA WATER IS ROUTED TO PASSIVE TREATMENT ONLY ONCE THE COLLECTION POND IS DECOMMISSIONED IN YEAR 14.
TABLE B.2
VICTORIA GOLD CORP.EAGLE GOLD PROJECT
WATER BALANCE MODEL COMPARISON
MONTHLY DISCHARGE FROM EAGLE PUP WASTE ROCK STORAGE AREA TO PASSIVE TREATMENT (m3/mon)
KP GoldSim FS WBM
M:\1\01\00290\06\A\Data\200 YESAB REVIEW - PROJECT DESCRIPTION\220 Support Analysis\Water Balance\Water Licencing WBM - GoldSim\1_Results\[Eagle Gold WBM_comparison_WBM_WL04.xlsx]Summary table_EP
Mine Phase (PFS) Mine Phase (FS) Mine Life (yrs) MonthStantec PFS SWBM KP GoldSim PFS WBM
0 27APR'12 ER CAISSUED WITH LETTER VA12-00744 KJB
DATE DESCRIPTION PREP'D CHK'D APP'DREV
B-6 of 8

5th percentile Median 95th percentile 5th percentile Median 95th percentile 5th percentile Median 95th percentile
Closure - HLF Draindown Closure - HLF Rinse 12 7 0 0 0 3,443 38,231 129,306 0 0 0
Closure - HLF Draindown Closure - HLF Rinse 12 8 0 0 0 3,945 33,194 91,310 0 0 0
Closure - HLF Draindown Closure - HLF Rinse 12 9 0 0 0 9,109 39,474 107,788 0 0 0
Closure - HLF Draindown Closure - HLF Rinse 12 10 0 0 0 8,578 20,864 52,114 0 0 0
Closure - HLF Draindown Closure - HLF Draindown 12 11 0 0 0 1,683 2,548 4,875 0 0 0
Closure - HLF Draindown Closure - HLF Draindown 12 12 0 0 0 1,269 1,269 1,269 0 0 0
Closure - HLF Draindown Closure - HLF Draindown 13 1 0 0 0 1,269 1,269 1,269 0 0 0
Closure - HLF Draindown Closure - HLF Draindown 13 2 0 0 0 1,269 1,269 1,269 0 0 0
Closure - HLF Draindown Closure - HLF Draindown 13 3 0 0 0 1,269 1,269 1,269 0 0 0
Closure - HLF Draindown Closure - HLF Draindown 13 4 0 0 0 9,126 13,171 19,437 0 0 0
Closure - HLF Draindown Closure - HLF Draindown 13 5 0 0 0 76,914 113,606 167,018 0 0 0
Closure - HLF Draindown Closure - HLF Draindown 13 6 0 0 0 19,697 55,771 120,564 0 0 0
Closure - HLF Draindown Closure - HLF Draindown 13 7 0 0 0 3,405 38,041 128,253 0 0 0
Closure - HLF Draindown Closure - HLF Draindown 13 8 0 0 0 4,198 32,989 91,693 0 0 0
Closure - HLF Draindown Closure - HLF Draindown 13 9 0 0 0 9,157 40,205 107,188 0 0 0
Closure - HLF Draindown Closure - HLF Draindown 13 10 8,205 8,205 8,205 8,577 21,025 51,749 0 0 0
Closure - HLF Draindown Closure - HLF Draindown 13 11 1,501 1,501 1,501 1,687 2,560 4,817 0 0 0
Closure - HLF Draindown Closure - HLF Draindown 13 12 0 0 0 1,269 1,269 1,269 0 0 0
Closure - HLF Draindown Closure - HLF Draindown 14 1 0 0 0 1,269 1,269 1,269 0 0 0
Closure - HLF Draindown Closure - HLF Draindown 14 2 0 0 0 1,269 1,269 1,269 0 0 0
Closure - HLF Draindown Closure - HLF Draindown 14 3 0 0 0 1,269 1,269 1,269 0 0 0
Closure - HLF Draindown Closure - HLF Draindown 14 4 4,055 4,055 4,055 9,158 13,215 19,444 0 0 0
Closure - HLF Draindown Closure - HLF Draindown 14 5 33,632 33,632 33,632 77,360 113,657 166,625 0 0 0
Closure - HLF Draindown Closure - HLF Draindown 14 6 19,864 19,864 19,864 19,964 55,469 119,593 0 0 0
Closure - HLF Draindown Closure - HLF Draindown 14 7 11,888 11,888 11,888 3,444 37,534 128,864 0 0 0
Closure - HLF Draindown Closure - HLF Draindown 14 8 8,601 8,601 8,601 3,756 32,645 91,481 0 0 0
Closure - HLF Draindown Closure - HLF Draindown 14 9 10,388 10,388 10,388 8,965 40,390 105,064 0 0 0
Closure - HLF Draindown Closure - HLF Draindown 14 10 8,205 8,205 8,205 8,462 20,667 50,830 0 0 0
Closure - HLF Draindown Closure - HLF Draindown 14 11 1,501 1,501 1,501 1,679 2,529 4,750 0 0 0
Closure - HLF Draindown Closure - HLF Draindown 14 12 0 0 0 1,269 1,269 1,269 1,662 1,662 1,662
Closure - HLF Draindown Closure - HLF Draindown 15 1 0 0 0 1,269 1,269 1,269 1,269 1,269 1,269
Closure - HLF Draindown Closure - HLF Draindown 15 2 0 0 0 1,269 1,269 1,269 1,269 1,269 1,269
Closure - HLF Draindown Closure - HLF Draindown 15 3 0 0 0 1,269 1,269 1,269 1,269 1,269 1,269
Closure - HLF Draindown Closure - HLF Draindown 15 4 4,055 4,055 4,055 9,144 13,163 19,369 9,134 13,777 20,355
Closure - HLF Draindown Closure - HLF Draindown 15 5 33,632 33,632 33,632 77,589 113,497 166,437 95,814 142,512 207,237
Closure - HLF Draindown Closure - HLF Draindown 15 6 19,864 19,864 19,864 20,188 55,797 121,680 59,166 104,546 179,013
Closure - HLF Draindown Closure - HLF Draindown 15 7 11,888 11,888 11,888 3,536 37,362 132,578 48,054 104,427 201,218
Closure - HLF Draindown Closure - HLF Draindown 15 8 8,601 8,601 8,601 4,020 33,208 93,282 33,803 73,889 144,682
Closure - HLF Draindown Closure - HLF Draindown 15 9 10,388 10,388 10,388 9,016 40,383 107,007 31,350 65,713 122,945
Closure - HLF Draindown Closure - HLF Draindown 15 10 8,205 8,205 8,205 8,582 20,809 51,407 13,938 28,225 54,900
Closure - HLF Draindown Closure - HLF Draindown 15 11 1,501 1,501 1,501 1,685 2,543 4,759 2,774 3,716 5,508
Closure - HLF Draindown Closure - HLF Draindown 15 12 0 0 0 1,269 1,269 1,269 1,662 1,662 1,662
Closure - HLF Draindown Closure - HLF Draindown 16 1 0 0 0 1,269 1,269 1,269 1,269 1,269 1,269
Closure - HLF Draindown Closure - HLF Draindown 16 2 0 0 0 1,269 1,269 1,269 1,269 1,269 1,269
Closure - HLF Draindown Closure - HLF Draindown 16 3 0 0 0 1,269 1,269 1,269 1,269 1,269 1,269
Closure - HLF Draindown Closure - HLF Draindown 16 4 4,055 4,055 4,055 9,200 13,237 19,469 9,116 13,877 20,578
Closure - HLF Draindown Closure - HLF Draindown 16 5 119,018 119,018 119,018 77,200 114,259 168,121 95,392 143,499 209,691
Closure - HLF Draindown Closure - HLF Draindown 16 6 58,873 58,873 58,873 20,278 55,346 121,575 59,673 104,728 180,962
Closure - HLF Draindown Closure - HLF Draindown 16 7 44,864 44,864 44,864 3,338 36,831 129,971 48,159 103,777 199,644
Closure - HLF Draindown Closure - HLF Draindown 16 8 38,088 38,088 38,088 3,752 32,889 89,334 33,335 73,547 140,360
Closure - HLF Draindown Closure - HLF Draindown 16 9 44,835 44,835 44,835 9,190 40,576 107,461 31,706 65,968 123,498
Closure - HLF Draindown Closure - HLF Draindown 16 10 24,449 24,449 24,449 8,486 20,783 51,579 13,796 28,179 55,128
Closure - HLF Draindown Closure - HLF Draindown 16 11 2,753 2,753 2,753 1,679 2,536 4,829 2,764 3,710 5,560
Closure - HLF Draindown Closure - HLF Draindown 16 12 1,294 1,294 1,294 1,269 1,269 1,269 1,662 1,662 1,662
Closure - HLF Draindown Closure - HLF Draindown 17 1 1,294 1,294 1,294 1,269 1,269 1,269 1,269 1,269 1,269
Closure - HLF Draindown Closure - HLF Draindown 17 2 1,168 1,168 1,168 1,269 1,269 1,269 1,269 1,269 1,269
Closure - HLF Draindown Closure - HLF Draindown 17 3 1,294 1,294 1,294 1,269 1,269 1,269 1,269 1,269 1,269
Closure - HLF Draindown Closure - HLF Draindown 17 4 15,385 15,385 15,385 9,114 13,259 19,335 9,072 13,855 20,383
Closure - HLF Draindown Closure - HLF Draindown 17 5 119,018 119,018 119,018 76,958 113,842 165,378 95,519 143,229 206,149
Closure - HLF Draindown Closure - HLF Draindown 17 6 58,873 58,873 58,873 19,950 55,178 120,459 59,058 103,829 178,137
Closure - HLF Draindown Closure - HLF Draindown 17 7 44,864 44,864 44,864 3,380 37,758 131,755 48,287 104,726 200,372
Closure - HLF Draindown Closure - HLF Draindown 17 8 38,088 38,088 38,088 4,023 32,716 90,569 33,589 73,273 141,865
Closure - HLF Draindown Closure - HLF Draindown 17 9 44,835 44,835 44,835 8,896 39,994 107,841 31,074 65,363 123,480
Closure - HLF Draindown Closure - HLF Draindown 17 10 24,449 24,449 24,449 8,572 20,817 51,169 13,998 28,192 54,776
Closure - HLF Draindown Closure - HLF Draindown 17 11 2,753 2,753 2,753 1,683 2,545 4,781 2,770 3,718 5,524
Closure - HLF Draindown Closure - HLF Draindown 17 12 1,294 1,294 1,294 1,269 1,269 1,269 1,662 1,662 1,662
Closure - HLF Draindown Closure - HLF Draindown 18 1 1,294 1,294 1,294 1,269 1,269 1,269 1,269 1,269 1,269
Closure - HLF Draindown Closure - HLF Draindown 18 2 1,168 1,168 1,168 1,269 1,269 1,269 1,269 1,269 1,269
Closure - HLF Draindown Closure - HLF Draindown 18 3 1,294 1,294 1,294 1,269 1,269 1,269 1,269 1,269 1,269
Closure - HLF Draindown Closure - HLF Draindown 18 4 15,385 15,385 15,385 9,189 13,215 19,226 9,164 13,820 20,215
Closure - HLF Draindown Closure - HLF Draindown 18 5 119,018 119,018 119,018 77,504 113,959 165,786 95,593 143,506 207,530
Closure - HLF Draindown Closure - HLF Draindown 18 6 58,873 58,873 58,873 19,838 55,597 118,049 58,737 104,393 175,401
Closure - HLF Draindown Closure - HLF Draindown 18 7 44,864 44,864 44,864 3,456 37,450 128,543 48,782 104,441 198,017
Closure - HLF Draindown Closure - HLF Draindown 18 8 38,088 38,088 38,088 3,941 33,119 91,160 33,612 73,841 142,463
Closure - HLF Draindown Closure - HLF Draindown 18 9 44,835 44,835 44,835 9,221 39,823 105,884 31,678 65,203 122,333
Closure - HLF Draindown Closure - HLF Draindown 18 10 24,449 24,449 24,449 8,428 20,768 51,841 13,779 28,171 55,307
Closure - HLF Draindown Closure - HLF Draindown 18 11 2,753 2,753 2,753 1,678 2,552 4,814 2,762 3,725 5,549
Closure - HLF Draindown Closure - HLF Draindown 18 12 1,294 1,294 1,294 1,269 1,269 1,269 1,662 1,662 1,662
Post-closure Monitoring Closure - HLF Draindown 19 1 1,294 1,294 1,294 1,269 1,269 1,269 1,269 1,269 1,269
Post-closure Monitoring Closure - HLF Draindown 19 2 1,168 1,168 1,168 1,269 1,269 1,269 1,269 1,269 1,269
Post-closure Monitoring Closure - HLF Draindown 19 3 1,294 1,294 1,294 1,269 1,269 1,269 1,269 1,269 1,269
Post-closure Monitoring Closure - HLF Draindown 19 4 15,385 15,385 15,385 9,129 13,193 19,205 9,077 13,790 20,243
Post-closure Monitoring Closure - HLF Draindown 19 5 119,018 119,018 119,018 77,147 113,297 165,041 95,180 142,820 207,433
Post-closure Monitoring Closure - HLF Draindown 19 6 58,873 58,873 58,873 19,947 55,226 118,833 58,497 104,024 176,192
Post-closure Monitoring Closure - HLF Draindown 19 7 44,864 44,864 44,864 3,438 38,077 132,289 48,618 105,112 201,038
Post-closure Monitoring Closure - HLF Draindown 19 8 38,088 38,088 38,088 3,847 32,787 92,519 33,246 73,319 144,140
Post-closure Monitoring Closure - HLF Draindown 19 9 44,835 44,835 44,835 8,661 39,635 106,919 30,866 65,127 122,751
Post-closure Monitoring Closure - HLF Draindown 19 10 11,242 24,449 42,896 8,557 20,777 51,989 13,901 28,120 55,244
Post-closure Monitoring Closure - HLF Draindown 19 11 1,804 2,753 4,076 1,682 2,542 4,808 2,769 3,716 5,545
Post-closure Monitoring Closure - HLF Draindown 19 12 1,294 1,294 1,294 1,269 1,269 1,269 1,662 1,662 1,662
Post-closure Monitoring Closure - HLF Draindown 20 1 1,294 1,294 1,294 1,269 1,269 1,269 1,269 1,269 1,269
Post-closure Monitoring Closure - HLF Draindown 20 2 1,210 1,210 1,210 1,269 1,269 1,269 1,269 1,269 1,269
Post-closure Monitoring Closure - HLF Draindown 20 3 1,294 1,294 1,294 1,269 1,269 1,269 1,269 1,269 1,269
Post-closure Monitoring Closure - HLF Draindown 20 4 6,478 15,385 28,985 9,184 13,286 19,604 9,137 13,901 20,657
Post-closure Monitoring Closure - HLF Draindown 20 5 35,542 119,018 243,328 77,646 114,479 169,097 95,870 143,880 211,193
Post-closure Monitoring Closure - HLF Draindown 20 6 25,736 58,873 128,299 19,498 55,946 122,624 58,297 104,814 180,896
Post-closure Monitoring Closure - HLF Draindown 20 7 16,326 44,864 102,222 3,537 37,385 126,704 48,365 104,338 195,797
Post-closure Monitoring Closure - HLF Draindown 20 8 17,099 38,088 80,470 3,810 32,934 91,612 33,681 73,576 142,900
Post-closure Monitoring Closure - HLF Draindown 20 9 9,387 44,835 86,087 9,205 40,178 107,456 31,716 65,436 123,739
Post-closure Monitoring Closure - HLF Draindown 20 10 22,489 24,449 27,131 8,541 20,594 51,270 13,939 28,015 54,668
Post-closure Monitoring Closure - HLF Draindown 20 11 2,753 2,753 2,753 1,687 2,530 4,796 2,776 3,705 5,535
Post-closure Monitoring Closure - HLF Draindown 20 12 1,294 1,294 1,294 1,269 1,269 1,269 1,662 1,662 1,662
Post-closure Monitoring Closure - HLF Draindown 21 1 1,294 1,294 1,294 1,269 1,269 1,269 1,269 1,269 1,269
Post-closure Monitoring Closure - HLF Draindown 21 2 1,168 1,168 1,168 1,269 1,269 1,269 1,269 1,269 1,269
Post-closure Monitoring Closure - HLF Draindown 21 3 1,294 1,294 1,294 1,269 1,269 1,269 1,269 1,269 1,269
Post-closure Monitoring Closure - HLF Draindown 21 4 15,385 15,385 15,385 9,148 13,197 19,313 9,071 13,806 20,262
Post-closure Monitoring Closure - HLF Draindown 21 5 119,018 119,018 119,018 77,245 113,760 166,505 95,246 143,241 207,520
Post-closure Monitoring Closure - HLF Draindown 21 6 58,873 58,873 58,873 19,785 55,150 121,790 58,746 104,118 179,221
Post-closure Monitoring Closure - HLF Draindown 21 7 44,864 44,864 44,864 3,542 38,675 129,329 49,776 105,769 198,467
Post-closure Monitoring Closure - HLF Draindown 21 8 38,088 38,088 38,088 3,912 33,285 90,996 33,411 74,073 142,224
Post-closure Monitoring Closure - HLF Draindown 21 9 44,835 44,835 44,835 9,237 39,665 106,677 31,771 65,067 122,976
Post-closure Monitoring Closure - HLF Draindown 21 10 24,449 24,449 24,449 8,678 21,091 52,385 14,027 28,444 55,635
Post-closure Monitoring Closure - HLF Draindown 21 11 2,753 2,753 2,753 1,685 2,565 4,837 2,773 3,736 5,566
Post-closure Monitoring Closure - HLF Draindown 21 12 1,294 1,294 1,294 1,269 1,269 1,269 1,662 1,662 1,662
Post-closure Monitoring Closure - HLF Draindown 22 1 1,294 1,294 1,294 1,269 1,269 1,269 1,269 1,269 1,269
Post-closure Monitoring Closure - HLF Draindown 22 2 1,168 1,168 1,168 1,269 1,269 1,269 1,269 1,269 1,269
Post-closure Monitoring Closure - HLF Draindown 22 3 1,294 1,294 1,294 1,269 1,269 1,269 1,269 1,269 1,269
Post-closure Monitoring Closure - HLF Draindown 22 4 15,385 15,385 15,385 9,152 13,209 19,366 9,091 13,827 20,382
Post-closure Monitoring Closure - HLF Draindown 22 5 119,018 119,018 119,018 76,866 113,967 166,588 95,315 143,377 209,491
Post-closure Monitoring Closure - HLF Draindown 22 6 58,873 58,873 58,873 19,705 55,445 120,802 58,379 104,303 178,619
Post-closure Monitoring Closure - HLF Draindown 22 7 44,864 44,864 44,864 3,431 37,013 128,516 48,845 103,970 197,642
Post-closure Monitoring Closure - HLF Draindown 22 8 38,088 38,088 38,088 3,909 33,100 90,770 33,461 73,752 141,845
Post-closure Monitoring Closure - HLF Draindown 22 9 44,835 44,835 44,835 9,232 40,358 108,330 31,772 65,672 124,483
Post-closure Monitoring Closure - HLF Draindown 22 10 24,449 24,449 24,449 8,454 20,491 50,938 13,852 27,845 54,341
Post-closure Monitoring Closure - HLF Draindown 22 11 2,753 2,753 2,753 1,684 2,519 4,752 2,771 3,694 5,502
Post-closure Monitoring Post-closure Monitoring 22 12 1,294 1,294 1,294 1,269 1,269 1,269 1,662 1,662 1,662
NOTES:
1. PFS = PRE-FEASIBILITY STUDY; FS = FEASIBILITY STUDY
2. SWBM = SURFACE WATER BALANCE MODEL; WBM = WATER BALANCE MODEL
3. THE STANTEC PFS SWBM ONLY SIMULATES OVERFLOW FROM THE OPEN PIT SUMP AS OF YEAR 16, WHEREAS THE KP PFS GOLDSIM MODEL SHOWS OVERFLOW FROM THE OP SUMP AS OF YEAR 10.
4. THE STANTEC PFS SWBM MEDIAN SCENARIO REPRESENTS AN ANNUAL PRECIPITATION WITH A 2-YR RETURN PERIOD (FOR ALL YEARS OF SIMULATION), WHILE THE 5TH (DRY) AND 95TH (WET) SCENARIOS REPRESENT AN ANNUAL PRECIPITATION WITH A 20-YR RETURN PERIOD (SELECT YEARS SHADED IN GREY).
5. THE KP WBM (PFS AND FS) VARIES THE MONTHLY PRECIPITATION VALUES WITH MONTHLY PROBABILITY DISTRIBUTIONS USING A MONTE CARLO SIMULATION IN THE GOLDSIM SOFTWARE.
Print Apr/30/12 15:02:04
TABLE B.3
VICTORIA GOLD CORP.EAGLE GOLD PROJECT
WATER BALANCE MODEL COMPARISON
MONTHLY DISCHARGE FROM PLATINUM GULCH WRSA AND OPEN PIT SUMP TO PASSIVE TREATMENT (m3/mon)
KP GoldSim FS WBM
M:\1\01\00290\06\A\Data\200 YESAB REVIEW - PROJECT DESCRIPTION\220 Support Analysis\Water Balance\Water Licencing WBM - GoldSim\1_Results\[Eagle Gold WBM_comparison_WBM_WL04.xlsx]Summary table_PG_OP
Mine Phase (PFS) Mine Phase (FS) Mine Life (yrs) MonthStantec PFS SWBM KP GoldSim PFS WBM
0 27APR'12 ER CAISSUED WITH LETTER VA12-00744 KJB
DATE DESCRIPTION PREP'D CHK'D APP'DREV
B-7 of 8

5th percentile Median 95th percentile 5th percentile Median 95th percentile 5th percentile Median 95th percentile
Post-closure Monitoring Closure - HLF Draindown 19 1 93 93 93 91 91 91 0 0 0
Post-closure Monitoring Closure - HLF Draindown 19 2 84 84 84 87 87 87 0 0 0
Post-closure Monitoring Closure - HLF Draindown 19 3 93 93 93 84 84 84 0 0 0
Post-closure Monitoring Closure - HLF Draindown 19 4 2,535 2,535 2,535 1,483 2,233 3,342 0 0 0
Post-closure Monitoring Closure - HLF Draindown 19 5 21,501 21,501 21,501 15,085 21,543 30,867 0 0 0
Post-closure Monitoring Closure - HLF Draindown 19 6 11,109 11,109 11,109 5,595 10,820 21,744 0 0 0
Post-closure Monitoring Closure - HLF Draindown 19 7 10,053 10,053 10,053 2,905 9,188 25,551 0 0 0
Post-closure Monitoring Closure - HLF Draindown 19 8 7,320 7,320 7,320 2,191 6,554 16,859 0 0 0
Post-closure Monitoring Closure - HLF Draindown 19 9 7,484 7,484 7,484 1,710 6,719 18,897 0 0 0
Post-closure Monitoring Closure - HLF Draindown 19 10 1,488 3,742 6,937 985 3,139 8,815 0 0 0
Post-closure Monitoring Closure - HLF Draindown 19 11 90 90 90 53 53 53 0 0 0
Post-closure Monitoring Closure - HLF Draindown 19 12 93 93 93 50 50 50 0 0 0
Post-closure Monitoring Closure - HLF Draindown 20 1 47 47 47 46 46 46 0 0 0
Post-closure Monitoring Closure - HLF Draindown 20 2 44 44 44 46 46 46 0 0 0
Post-closure Monitoring Closure - HLF Draindown 20 3 47 47 47 46 46 46 0 0 0
Post-closure Monitoring Closure - HLF Draindown 20 4 979 2,490 4,833 1,458 2,215 3,381 0 0 0
Post-closure Monitoring Closure - HLF Draindown 20 5 8,103 21,455 42,259 15,087 21,673 31,448 0 0 0
Post-closure Monitoring Closure - HLF Draindown 20 6 3,511 11,064 21,190 5,536 10,897 22,421 0 0 0
Post-closure Monitoring Closure - HLF Draindown 20 7 2,957 10,006 18,840 2,865 9,006 24,518 0 0 0
Post-closure Monitoring Closure - HLF Draindown 20 8 2,162 7,274 13,725 2,220 6,538 16,672 0 0 0
Post-closure Monitoring Closure - HLF Draindown 20 9 2,050 7,439 14,160 1,742 6,831 19,057 0 0 0
Post-closure Monitoring Closure - HLF Draindown 20 10 3,696 3,696 3,696 985 3,098 8,773 0 0 0
Post-closure Monitoring Closure - HLF Draindown 20 11 45 45 45 46 46 46 0 0 0
Post-closure Monitoring Closure - HLF Draindown 20 12 47 47 47 46 46 46 0 0 0
Post-closure Monitoring Closure - HLF Draindown 21 1 47 47 47 46 46 46 0 0 0
Post-closure Monitoring Closure - HLF Draindown 21 2 42 42 42 46 46 46 0 0 0
Post-closure Monitoring Closure - HLF Draindown 21 3 47 47 47 46 46 46 0 0 0
Post-closure Monitoring Closure - HLF Draindown 21 4 2,490 2,490 2,490 1,452 2,199 3,328 0 0 0
Post-closure Monitoring Closure - HLF Draindown 21 5 21,455 21,455 21,455 15,005 21,543 31,048 0 0 0
Post-closure Monitoring Closure - HLF Draindown 21 6 11,064 11,064 11,064 5,558 10,758 22,249 0 0 0
Post-closure Monitoring Closure - HLF Draindown 21 7 10,006 10,006 10,006 2,977 9,262 25,048 0 0 0
Post-closure Monitoring Closure - HLF Draindown 21 8 7,274 7,274 7,274 2,189 6,617 16,633 0 0 0
Post-closure Monitoring Closure - HLF Draindown 21 9 7,439 7,439 7,439 1,728 6,736 18,931 0 0 0
Post-closure Monitoring Closure - HLF Draindown 21 10 3,696 3,696 3,696 981 3,184 8,877 0 0 0
Post-closure Monitoring Closure - HLF Draindown 21 11 45 45 45 46 46 46 0 0 0
Post-closure Monitoring Closure - HLF Draindown 21 12 47 47 47 46 46 46 0 0 0
Post-closure Monitoring Closure - HLF Draindown 22 1 47 47 47 46 46 46 0 0 0
Post-closure Monitoring Closure - HLF Draindown 22 2 42 42 42 46 46 46 0 0 0
Post-closure Monitoring Closure - HLF Draindown 22 3 47 47 47 46 46 46 0 0 0
Post-closure Monitoring Closure - HLF Draindown 22 4 2,490 2,490 2,490 1,453 2,201 3,337 0 0 0
Post-closure Monitoring Closure - HLF Draindown 22 5 21,455 21,455 21,455 14,972 21,576 31,087 0 0 0
Post-closure Monitoring Closure - HLF Draindown 22 6 11,064 11,064 11,064 5,534 10,818 22,053 0 0 0
Post-closure Monitoring Closure - HLF Draindown 22 7 10,006 10,006 10,006 2,887 8,993 24,865 0 0 0
Post-closure Monitoring Closure - HLF Draindown 22 8 7,274 7,274 7,274 2,216 6,543 16,533 0 0 0
Post-closure Monitoring Closure - HLF Draindown 22 9 7,439 7,439 7,439 1,761 6,829 19,179 0 0 0
Post-closure Monitoring Closure - HLF Draindown 22 10 3,696 3,696 3,696 977 3,070 8,662 0 0 0
Post-closure Monitoring Closure - HLF Draindown 22 11 45 45 45 46 46 46 0 0 0
Post-closure Monitoring Post-closure Monitoring 22 12 47 47 47 46 46 46 0 0 0
Post-closure Monitoring Post-closure Monitoring 23 1 47 47 47 46 46 46 0 0 0
Post-closure Monitoring Post-closure Monitoring 23 2 42 42 42 46 46 46 0 0 0
Post-closure Monitoring Post-closure Monitoring 23 3 47 47 47 46 46 46 0 0 0
Post-closure Monitoring Post-closure Monitoring 23 4 2,490 2,490 2,490 1,453 2,201 3,337 1,822 2,972 4,544
Post-closure Monitoring Post-closure Monitoring 23 5 21,455 21,455 21,455 14,972 21,576 31,087 21,478 32,693 47,797
Post-closure Monitoring Post-closure Monitoring 23 6 11,064 11,064 11,064 5,534 10,818 22,053 10,590 20,976 39,321
Post-closure Monitoring Post-closure Monitoring 23 7 10,006 10,006 10,006 2,887 8,993 24,865 8,336 20,773 41,282
Post-closure Monitoring Post-closure Monitoring 23 8 7,274 7,274 7,274 2,216 6,543 16,533 5,257 14,662 31,107
Post-closure Monitoring Post-closure Monitoring 23 9 7,439 7,439 7,439 1,761 6,829 19,179 5,030 12,953 26,432
Post-closure Monitoring Post-closure Monitoring 23 10 3,696 3,696 3,696 977 3,070 8,662 1,487 4,710 10,768
Post-closure Monitoring Post-closure Monitoring 23 11 45 45 45 46 46 46 0 0 0
Post-closure Monitoring Post-closure Monitoring 23 12 47 47 47 46 46 46 0 0 0
Post-closure Monitoring Post-closure Monitoring 24 1 47 47 47 46 46 46 0 0 0
Post-closure Monitoring Post-closure Monitoring 24 2 42 42 42 46 46 46 0 0 0
Post-closure Monitoring Post-closure Monitoring 24 3 47 47 47 46 46 46 0 0 0
Post-closure Monitoring Post-closure Monitoring 24 4 2,490 2,490 2,490 1,453 2,201 3,337 1,865 3,005 4,562
Post-closure Monitoring Post-closure Monitoring 24 5 21,455 21,455 21,455 14,972 21,576 31,087 21,832 32,897 48,241
Post-closure Monitoring Post-closure Monitoring 24 6 11,064 11,064 11,064 5,534 10,818 22,053 10,643 21,030 39,315
Post-closure Monitoring Post-closure Monitoring 24 7 10,006 10,006 10,006 2,887 8,993 24,865 8,280 20,966 42,000
Post-closure Monitoring Post-closure Monitoring 24 8 7,274 7,274 7,274 2,216 6,543 16,533 5,189 14,635 31,685
Post-closure Monitoring Post-closure Monitoring 24 9 7,439 7,439 7,439 1,761 6,829 19,179 5,113 13,135 27,127
Post-closure Monitoring Post-closure Monitoring 24 10 3,696 3,696 3,696 977 3,070 8,662 1,507 4,677 10,930
Post-closure Monitoring Post-closure Monitoring 24 11 45 45 45 46 46 46 0 0 0
Post-closure Monitoring Post-closure Monitoring 24 12 47 47 47 46 46 46 0 0 0
Post-closure Monitoring Post-closure Monitoring 25 1 47 47 47 46 46 46 0 0 0
Post-closure Monitoring Post-closure Monitoring 25 2 42 42 42 46 46 46 0 0 0
Post-closure Monitoring Post-closure Monitoring 25 3 47 47 47 46 46 46 0 0 0
Post-closure Monitoring Post-closure Monitoring 25 4 2,490 2,490 2,490 1,453 2,201 3,337 1,837 2,979 4,574
Post-closure Monitoring Post-closure Monitoring 25 5 21,455 21,455 21,455 14,972 21,576 31,087 21,518 32,972 48,079
Post-closure Monitoring Post-closure Monitoring 25 6 11,064 11,064 11,064 5,534 10,818 22,053 10,583 21,204 38,689
Post-closure Monitoring Post-closure Monitoring 25 7 10,006 10,006 10,006 2,887 8,993 24,865 8,273 20,766 41,998
Post-closure Monitoring Post-closure Monitoring 25 8 7,274 7,274 7,274 2,216 6,543 16,533 5,082 14,518 31,199
Post-closure Monitoring Post-closure Monitoring 25 9 7,439 7,439 7,439 1,761 6,829 19,179 5,163 13,241 26,717
Post-closure Monitoring Post-closure Monitoring 25 10 3,696 3,696 3,696 977 3,070 8,662 1,492 4,710 10,679
Post-closure Monitoring Post-closure Monitoring 25 11 45 45 45 46 46 46 0 0 0
Post-closure Monitoring Post-closure Monitoring 25 12 47 47 47 46 46 46 0 0 0
NOTES:
1. PFS = PRE-FEASIBILITY STUDY; FS = FEASIBILITY STUDY
2. SWBM = SURFACE WATER BALANCE MODEL; WBM = WATER BALANCE MODEL
3. PFS WATER BALANCE MODELS, BOTH STANTEC AND KP, INCLUDES CAMP GREY WATER IN ALL MONTHS OF SIMULATION.
4. THE STANTEC PFS SWBM MEDIAN SCENARIO REPRESENTS AN ANNUAL PRECIPITATION WITH A 2-YR RETURN PERIOD (FOR ALL YEARS OF SIMULATION), WHILE THE 5TH (DRY) AND 95TH (WET) SCENARIOS REPRESENT AN ANNUAL PRECIPITATION WITH A 20-YR RETURN PERIOD (SELECT YEARS SHADED IN GREY).
5. THE KP WBM (PFS AND FS) VARIES THE MONTHLY PRECIPITATION VALUES WITH MONTHLY PROBABILITY DISTRIBUTIONS USING A MONTE CARLO SIMULATION IN THE GOLDSIM SOFTWARE.
Print Apr/30/12 15:02:04
TABLE B.4
VICTORIA GOLD CORP.EAGLE GOLD PROJECT
WATER BALANCE MODEL COMPARISON
MONTHLY DISCHARGE FROM HEAP LEACH FACILITY TO PASSIVE TREATMENT (m3/mon)
KP GoldSim FS WBM
M:\1\01\00290\06\A\Data\200 YESAB REVIEW - PROJECT DESCRIPTION\220 Support Analysis\Water Balance\Water Licencing WBM - GoldSim\1_Results\[Eagle Gold WBM_comparison_WBM_WL04.xlsx]Summary table HLF
Mine Phase (PFS) Mine Phase (FS) Mine Life (yrs) MonthStantec PFS SWBM KP GoldSim PFS WBM
0 27APR'12 ER CAISSUED WITH LETTER VA12-00744 KJB
DATE DESCRIPTION PREP'D CHK'D APP'DREV
B-8 of 8