kristine grimsrud, knut einar rosendahl, halvor briseid ... · and algeria. since the early...
TRANSCRIPT

Discussion Papers
Statistics NorwayResearch department
No. 733 •January 2013
Kristine Grimsrud, Knut Einar Rosendahl,Halvor Briseid Storrøsten and Marina Tsygankova
Short run effects of bleaker prospects for oligopolistic producers of a non-renewable resource


Discussion Papers No. 733, January 2013 Statistics Norway, Research Department
Kristine Grimsrud, Knut Einar Rosendahl, Halvor Briseid Storrøsten and Marina Tsygankova
Short run effects of bleaker prospects for oligopolistic producers of a non-renewable resource
Abstract: In a non-renewable resource market with imperfect competition, the resource owners’ supply is governed both by current demand and by the resource rent. New information regarding future market conditions will typically affect the resource rent and hence current supply. Bleaker prospects will tend to accelerate extraction. We show, however, that for resource owners with substantial resource stocks, a more pessimistic outlook may in fact slow down early extraction. The explanation is that for players with extensive resource stocks, the resource rent is limited and supply is more driven by current market considerations. As players with less resources accelerate their supply, it may be optimal for the large resource owners to cut back on their supply. We illustrate this in the case of the European gas market, finding that the shale gas revolution may lead to an accelerated supply by most gas producers, but a postponement of Russian gas extraction.
Keywords: Exhaustible Resource Extraction, Cournot Competition, Natural Gas.
JEL classification: Q31, Q41, D43.
Acknowledgements: We are grateful to Torbjørn Hægeland for valuable comments to an earlier draft. Financial support from the Petrosam programme of the Research Council of Norway is acknowledged.
Address: Kristine Grimsrud, Statistics Norway, Research Department. E-mail: [email protected]
Knut Einar Rosendahl UMB School of Economics and Business and Statistics Norway. E-mail: [email protected]
Halvor Briseid Storrøsten, Statistics Norway, Research Department. E-mail: [email protected]
Marina Tsygankova, Thomson Reuters Point Carbon. E-mail: [email protected]

Discussion Papers comprise research papers intended for international journals or books. A preprint of a Discussion Paper may be longer and more elaborate than a standard journal article, as it may include intermediate calculations and background material etc.
© Statistics Norway Abstracts with downloadable Discussion Papers in PDF are available on the Internet: http://www.ssb.no http://ideas.repec.org/s/ssb/dispap.html For printed Discussion Papers contact: Statistics Norway Telephone: +47 62 88 55 00 E-mail: [email protected] ISSN 0809-733X Print: Statistics Norway

3
Sammendrag
Tilbudet av en ikke-fornybar ressurs i et marked med imperfekt konkurranse er bestemt av
ressursrenten og hensynet til dagens pris. Ny informasjon om fremtidige hendelser påvirker
ressursrenten og dermed dagens tilbud av ressursen. Dårligere markedsutsikter akselererer gjerne
utvinningen. Vi viser imidlertid at dårligere markedsutsikter kan redusere dagens tilbud fra store
ressurseiere. Dette skjer fordi ressursknapphet, og dermed ressursrenten, spiller en mindre rolle for
disse aktørene, mens hensynet til å opprettholde en god pris er viktig. Når aktører med mindre
ressurser akselererer produksjon pga. dårligere markedsutsikter kan det dermed være optimalt for
innehavere av en stor ressursbase å forsinke produksjonen og begrense prisfallet. Vi illustrerer at dette
er relevant for det europeiske gassmarkedet. Her finner vi at potensialet for skifergass bidrar til
akselerert produksjon fra alle gassprodusenter unntatt Russland, som reduserer dagens tilbud av gass.

1 Introduction
The European gas market has for decades been dominated by the supply from
�ve large gas producing countries, i.e., Russia, Norway, the UK, the Netherlands
and Algeria. Since the early 1980�s these countries have jointly accounted for
two thirds or more of total gas supply to the European Union. As a consequence,
the European gas market has usually been modelled as a Cournot game in the
economics literature (see, e.g., Golombek et al., 1995, 1998; Holz et al., 2008,
2009; Zwart, 2009).
The resource bases of the �ve mentioned countries are very heterogeneous,
however, and their gas supply have developed quite di¤erently. Whereas UK
gas production in 2011 was 60% below its peak supply in 2000, Russian and
Algerian gas production and exports to Europe are expected to increase over
the next couple of decades (see e.g. IEA, 2012). This di¤erence re�ects to a large
degree that the reserve-to-production ratio (R/P-ratio), i.e., remaining reserves
divided by current annual production, are very di¤erent for the �ve countries.
According to BP (2012), Russia and Algeria have R/P-ratios of 74 and 58 years,
respectively, while the �gure for the UK is merely 4.5 years. Norway and the
Netherlands are in between with with R/P ratios of 20 and 17 years, respectively.
As reserves can be increased through exploration and technical improvements,
the R/P-ratios should not be taken too literally.1 Still, the �gures clearly show
that the �ve countries are in quite di¤erent positions with respect to future
market in�uence.
This heterogeneity points to the fact that natural gas is a non-renewable re-
source. That is, gas resources extracted today cannot be extracted in the future.
Hence, gas resource owners should consider the optimal path for extraction of
their resources. Intuitively, the optimal extraction path for a resource owner
depends on how market conditions develop over time. Thus, a substantial shift
in expectations about future supply or demand will tend to change the optimal
extraction path, and is therefore expected to a¤ect current extraction as well. A
recent example of such a shift in expectations is the shale gas revolution in the
United States (see e.g. IEA, 2012, and Gabriel et al., 2013). Substantial cost
reductions in extracting shale gas have signi�cantly altered the expectations
1 In fact, remaining gas reserves in Russia increased from 2001 to 2011, and decreased farless than accumulated extraction over this period in Algeria and Norway.
4

about future gas production in the U.S. (see e.g. the totally di¤erent trade
projections for the U.S. in EIA, 2007 and EIA, 2012).
In this paper we investigate how altered expectations regarding future mar-
ket conditions a¤ect current supply in a non-renewable resource market char-
acterized by oligopolistic competition. Although we mainly have the European
gas market in mind, our study is also relevant for other non-renewable markets
with imperfect competition such as the global oil market. In line with previous
studies of the European gas market, we assume Cournot competition between
the largest suppliers to this market.
If new information arrives about less demand or more supply in the future
from other sources, the producers will as a �rst response shift some of its ex-
traction towards the present as future pro�tability declines. This is intuitive,
and is also the core of the so-called Green paradox literature (e.g., Sinn, 2008,
Gerlagh, 2010, and Hoel, 2010).
We are, however, particularly interested in whether heterogeneity with re-
spect to remaining reserves has a bearing on the response of the individual
producer. First, we analyze this question using a theoretical model with two
Cournot producers that di¤er with respect to reserve levels. We �nd that al-
though total supply will go up initially, this is not necessarily the case for the
individual producer. If one producer has a su¢ ciently large share of remaining
reserves, we show that initial supply from this producer will drop when future
market considerations become less pro�table. The reason is that current supply
from a producer with large reserves is driven more by the current market con-
dition and less by the resource rent. Hence, when the other producer moves its
extraction towards the present, it becomes optimal for the producer with large
reserves to cut back on its own early extraction.
We next construct a dynamic numerical model for the European gas market,
and analyze how new information about future unconventional gas supply may
change the current market. Our simulation results suggest that this will lead to
higher initial gas supply from all Cournot producers but Russia, who reduces
its exports to Europe. As indicated above, Russia has vast reserves of gas.
According to BP (2012), Russia�s remaining reserves are almost six times higher
than the combined reserves of the �ve other big suppliers to the European
market referred to above. A major share of Russian gas production is consumed
domestically though, but natural gas is hardly a scarce resource in Russia. Thus,
there is little need for Russia to curb its current extraction in order to save more
resources for the future, and they act almost like a static Cournot player in the
5

model. Hence, when other gas producers increase their initial supply, Russia
cuts back.
Our results imply that the production pro�le of heterogeneous �rms may
be very di¤erently a¤ected by changes in future demand under oligopoly. This
could be particularly relevant for policy if the government cares about the com-
position of supply. For example, policies that reduce future demand for gas (e.g.,
subsidies to development of renewable energy) may alleviate current European
dependence on gas imports from Russia.2 Moreover, we �nd that Cournot
competition in strategic substitutes induces the Cournot �rms to moderate the
increase in aggregate current production induced by bleaker future prospects,
as compared to a resource market with competitive �rms. This suggests that
market power may alleviate (but not remove) the green paradox, because the
increase in early production and emissions caused by lower future demand is
dampened.
The economics literature on optimal extraction of non-renewable resources
goes back to the seminal paper by Hotelling (1931), who concluded that the
price of the resource would increase with the interest rate. Of particular rel-
evance to the present paper is the theory of �oil�igopoly developed by Salant
(1976). By taking a dynamic Nash-Cournot approach to model the oil market,
Salant (1976) captured two aspects that are central in many resource markets:
imperfect competition and exhaustible resources. The theory of �oil�igopoly has
later been extended by Loury (1986), and Polasky (1992) who also found empir-
ical support for the predictions of the theory using data on proved reserves and
production in a cross-section of oil exporting countries. More recently, Boyce
and Voitassak (2008) examined a model of �oil�igopoly featuring exploration of
new reserves. They �nd that �rms holding smaller proved reserves should be
observed doing more research, and claims that this prediction is consistent with
country-level production and reserve data in the post-World War II era. An-
other strand of literature relevant to the present paper examines current e¤ects
of changes in future values of resource stocks. This may either be caused by
future competition (e.g. a backstop technology) or policy changes, see e.g. Heal
(1976) and the green paradox literature cited above. Finally, Chakravorty et al.
(2011) show that when technological progress in an alternative energy source
2European dependence on Russian gas is discussed at:http://www.heritage.org/research/reports/2009/01/europe-should-reduce-dependence-on-russian-energy-and-develop-competitive-energy-markets.
6

can occur through learning-by-doing, resource owners face competing incentives
to extract rents from the resource and to prevent expansion of the new technol-
ogy. It is then not necessarily the case that scarcity-driven higher traditional
energy prices over time will induce alternative energy supply as resources are
exhausted.
2 Theoretical analysis
This section considers a decline in the residual demand for the �rms� joint
resource production at time t0 2 [T; T 0], with T 0 > T and under the assumptionthat both �rms produce at time t0.3 The model is formulated in continuous
time, but to simplify the exposition we divide the time of analysis into two time
periods: period 1 refers to the time before the decline in demand (t 2 [0; T )),and period 2 refers to the time after the decline in demand (t 2 [T;1)).The model assumes that there are two Cournot �rms i and j, each with
resource extraction �ow rate at time t given by qit � 0 and qjt � 0, respectively.Constant marginal extraction costs are denoted ci and cj , whereas r refers to the
discount rate. Sit and Sjt denote the �nite resource stocks of the �rms at time
t and the resource price is pt = K� � qit � qjt, with subscript � = 1; 2 referringto the two time periods. We assume that marginal costs are less than the choke
price (K� > ci; cj). The decline in future residual demand is modelled as a fall
in the parameter K2. The decline may be caused by the entry of new producers,
the development of viable renewable substitutes, introduction of end-use taxes,
or changes in consumer preferences. In the numerical model in Section 3 we
examine the European gas market, and the decline in future residual demand
is caused by shale gas development in the US. The model is best examined by
backwards induction.
2.1 Production in period 2
In the second time period �rm i maximizes pro�ts:
�i = maxqit
Z 1
T
e�rt[(K2 � qit � qjt)� ci]qitdt; (1)
3The theoretical analysis is at �rm level, whereas the players are countries in the numericalmodel in Sections 3 and 4.
7

subject to the binding resource stock constraint:Z 1
T
qit = SiT :
The remaining resource stock of producer i at time t is Sit = SiT �R tTqi�d� ,
which implies _Sit = �qit. We observe that the pro�ts earned in period 2 equalsthe salvage value of the resource at the end of period 1. It is clear from the
above equations that the shadow value of the resource stock is positive for �nite
resource stocks (@�i=@SiT > 0) and increasing in the parameter K2, that is,
@ (@�i=@SiT ) =@K2 > 0 for �nite stock SiT .
2.2 Production in period 1
In the �rst time period �rm i maximizes pro�ts:
maxqit
Z T
0
e�rt[(K1 � qit � qjt)� ci]qitdt+ �i
subject to equation (1) and the resource constraint:Z T
0
qit � Si0:
The current value Hamiltonian is H = [(K1 � qit � qjt) � ci � �it]qit, whichis concave in qit. According to the Maximum principle, the pro�t maximizing
extraction path must satisfy:
Hqt = K1 � ci � 2qit � qjt � �it = 0; (2)
_�it � r�it = �HSit = 0; (3)
�iT =@�i@SiT
; (4)
where equation (4) is the transversality condition. It states that the shadow
price of the resource at time T must equal the marginal contribution of the
resource to the salvage value @�i=@SiT . In terms of our model, the marginal
discounted value of the resource must be equal across the two time periods.
Otherwise, the �rm could increase the present value of pro�ts by moving resource
8

extraction from one period to the other.
Solving the di¤erential equation (3) we get �it = Cert, where the constant
C solves the boundary condition CerT = �iT . Hence, we have �it = �iT er(t�T ).
Insertion in (2) yields K1 � ci � 2qi � qj � �iT er(t�T ) = 0. Solving this systemof two equations, and using (4), we have:
qit =1
3
�Ai +
�@�j@SjT
� 2 @�i@SiT
�er(t�T )
�; (5)
with Ai = K1 � 2ci + cj . Di¤erentiating with respect to the demand parameterin period 2 (K2) we get:
@qit@K2
=1
3
�@(@�j=@SjT )
@K2� 2@(@�i=@SiT )
@K2
�er(t�T ); (6)
Equation (6) captures two opposing e¤ects on �rm i�s production caused by a
reduction in future demand (�@qit=@K2). First, we have an intertemporal e¤ect
captured by the second part of the parenthesis in (6): a decline in future demand
induces the resource owning �rm i to increase current production. The reason
is that the discounted net present value of the resource must be equalized across
time, and the relative fall in future net present value of the resource, caused by
the decline in future demand, can be o¤set by moving production from period 2
to period 1. However, for the same reason the competitor �rm j also increases
production in period 1. As the �rms�production levels are strategic substitutes,
this leads us to the second and static e¤ect captured by the �rst part of the
parenthesis in (6): when the other �rm j increases current production, the
product price decreases and induces �rm i to produce less. This is a well known
result from analysis of Cournot competition (Tirole, 1988).
In general it is ambiguous whether the intertemporal or the static e¤ect
dominates for an individual �rm, but total current production must increase
(because the static e¤ect is caused by the price decrease). This is easily seen
from (6), which implies that the change in aggregate production is:
@qit@K2
+@qjt@K2
= �13
�@(@�j=@SjT )
@K2+@(@�i=@SiT )
@K2
�er(t�T ) < 0;
which is negative for �nite resource stocks Si0 or Sj0 (and zero if both stocks
are in�nite). That is, a decrease in future demand (decline in K2) increases
current aggregate production. In the particular case of identical �rms, both
9

�rms will increase their production in period 1. This result is related to the
Green paradox literature (see Section 1).
Assume instead that the two �rms di¤er and, for the sake of argument, that
the reserve-to-production ratio of �rm i is su¢ ciently large that the extraction
in period 1 approximately does not a¤ect the discounted value of the remaining
resource in time 2; i.e., @�i=@SiT � 0 (while we still have @�j=@SjT > 0). Then(6) becomes:
@qit@K2
� 1
3
�@@�j=@SjT@K2
�er(t�T ) > 0;
for �rm i. It follows that �rm i would reduce supply in period 1 if demand
decreases in period 2 (i.e., a decrease in K2). Obviously, as total production
increases, the smaller resource stock owning �rm j increases production more
than �rm i decreases its production:
@qjt@K2
� �23
�@@�j=@SjT@K2
�er(t�T ) < 0:
The approximation @�i=@SiT � 0 is only reasonable for very large stock owners.If Si0 is not that large, the sign of @qit=@K2 in (6) is ambiguous.4 We state the
following result:
Proposition 1 In a non-renewable market with two Cournot players and lin-ear demand, a resource owner that endows a su¢ ciently large share of total
reserves will reduce (increase) current production if future demand for the re-
source declines (increases).
Proof. The Proposition follows from equation (6).
The result arises from the two opposing mechanisms discussed under equa-
tion (6), and the observation that �rms with ample resources and thus low
scarcity values care little about saving resources for future use while market
power considerations remain important. Therefore, the intertemporal e¤ect is
weak and the static e¤ect dominates for owners of su¢ ciently large resource
stocks. Indeed, at the limit, a �rm with very large resources may have approx-
imately zero net present value of an additional unit of the resource. Such a
�rm does not delay any production due to scarcity considerations and only the
4 It can be shown that the Maximum principle leads to the equation r eTi + e�r eTi = 1 +3rSi=Ai + rT � erT in period 2, with Ai = K1 � 2ci + cj . These equations do not admitanalytical solutions for the optimal time horizon in period 2 ( eTi). Therefore, a reduced formsolution for @qit=@K2 is not possible.
10

strategic e¤ect matters. This �rm unambiguously decreases production. We
also observe that, while Salant (1976) argues that a cartel of (large) resource
owners restricts its sales so as to take over the market after the competition has
exhausted its reserves, Proposition 1 does not depend upon this mechanism.
Proposition 1 was derived in the case of 2 players with strict assumptions
on the functional forms. However, the economic intuition behind the result
suggests that it may be valid in the more general case. In this respect, it is
of interest that the numerical model for the European gas market in the next
section, with several Cournot players and isoelastic gas demand, indicates that
the shale gas revolution will lead to accelerated supply of most gas producers,
but postponement of Russian gas extraction.
3 Numerical model description
We now turn to the European gas market, and simulate the e¤ects of a positive
shift in future supply of gas to this market. A relevant interpretation here is the
signi�cant change of view over the last �ve years regarding the future prospects
of unconventional gas. Major technological progress in hydraulic fracturing and
horizontal drilling have substantially increased the expected supply of shale gas
in the U.S. over the next few decades (see, e.g., Gabriel et al., 2013), and also
increased unconventional supply expectations in Europe and elsewhere in the
world in the longer term.
The European gas market currently has �ve large suppliers: Russia, Norway,
the Netherlands, the UK and Algeria. In addition there is some domestic pro-
duction in several other European countries, as well as relatively small imports
from other parts of the world (mainly through LNG). Consistent with previous
models of the European gas market (cf. Section 1), we model the large suppliers
as Cournot players. The exception is the UK, where remaining reserves are low
and production is not coordinated across companies.5 To simplify, we consider
supply from the UK and other smaller European producers as exogenous.6 The
5There is no explicit supply coordination among companies on the Norwegian continentalshelf either. However, Norwegian authorities can to a large degree regulate the total extractionlevel through licensing of �elds and pipelines. Moreover, Statoil has a dominating position inNorway. The Dutch authorities explicitly regulate the extraction rate of the major Groningen�eld.
6We assume that production from these countries declines by a �xed annual rate, so thataccumulated production over time equal reported reserves at the end of 2009. Total supply in2015 from these countries is then only slightly above Dutch supply in 2009. Hence, modellingthis supply as competitive and not too price-responsive would not alter our results notably.
11
joint supply of LNG and pipeline imports from other sources than Russia and
Algeria is modelled as a linear increasing function of the price. The inverse
supply function is assumed to tilt downward over time, re�ecting that more gas
imports are expected to become available over the next few decades (cf. e.g.
IEA, 2012).
As we focus on the supply side e¤ects in the European gas market, we
consider a single, representative gas consumer. We include not only EU gas
consumption, but also consumption in the rest of Europe (including Ukraine
and Belarus). European gas demand (DE) is assumed to be decreasing in the
gas price, but instead of a linear demand schedule as in Section 2 we assume
a �xed long-run price elasticity �E (set equal to �E = �0:5).7 Over time, gasdemand increases due to growth in GDP. The income elasticity is calibrated
based on projections of gas consumption by the IEA (2011a).
The four Cournot players take the supply from the other players as given
in their optimization problem. However, they do take into account the price
e¤ects on the demand side and on the supply of imported gas (besides Russia
and Algeria). That is, they consider that an increase in production will lead to a
lower gas price due to demand reactions, but the price reduction is moderated by
reduced gas import. Formally, they have the following maximization problem:8
�i = maxqit
TXt=0
(1 + r)�t�pEt (qt)� cit(Ait)� c�it
�qit; (7)
subject to:
Ait+1 = Ait + qit (8)
where Ait denotes accumulated production, and c�it transport costs to the Eu-
ropean market, pEt (qt) the residual demand schedule facing the oligolipolistic
prodecers, and r is the producer discount rate. The discount rate is set to 5
percent in the simulations. Note that we do not assume a �xed resource stock
as in the theoretical model. Instead we assume that unit costs are increasing in
accumulated production, so that only a �nite resource level will have unit ex-
traction costs below the prevailing price at a given point in time. To be speci�c,
7There is no clear consensus in the literature regarding direct price elasticities for naturalgas (see, e.g., Andersen et al., 2011). -0.5 is well within the range of long-run estimates foundin the literature.
8 In the numerical model we simulate the market for a su¢ ciently high but �nite numberof years, T . We test the e¤ects of changing the level of T , checking that the reported resultsare una¤ected by the choice of T .
12

we assume that extraction costs develop according to the following:
cit(Ait) = c0i e�iAit��it (9)
where we also allow for exogenous technological progress through the annual
rate �i. c0i is the initial unit extraction costs, which are based on IEA (2009).
The parameter �i is crucial because it determines how quickly unit costs rise as
accumulated production increases. Intuitively, the parameter will be higher the
less reserves a country has. We calibrate the parameters based on reserve data
from BP (2012).9
From the optimization problem above we derive the following �rst order
condition for the Cournot players:
cit(Ait) + cTit + �it = p
Et ��1 +
qit�EDE � �tpEt
�(10)
where �it now denotes the (positive) shadow price of the resource, and �t is the
slope of the import supply function (which increases over time). This condition
corresponds to equation (2) in Section 2, with total marginal costs (which is the
marginal costs of production plus the shadow price) equal to marginal revenue.
The shadow price �it develops according to:
�it = (1 + r)�it�1 � �icit(Ait)qit (11)
Russia is the largest gas supplier in the European market. However, the
biggest share of Russian gas production is consumed domestically. Hence, in
order to model Russian gas export to Europe appropriately, we also model
the Russian gas market. Gas demand in Russia is also modeled with a �xed
price elasticity �R, but we assume the elasticity to be half as big as the one in
Europe.10
Russian gas prices are highly regulated. Over the last few years, prices have
9We simply assume that all reported reserves in the baseyear can be economically extractedat the baseyear price. In other words: We assume that unit costs (plus transport costs)become equal to the baseyear price when all reported reserves have been extracted (and thereis no technological change). For Algeria, however, we take into account that a large share ofAlgerian production is consumed domestically or exported elsewhere. Thus, we reduce thereserves destined for Europe by 50%.10There are few studies of Russian price elasticities for gas. Solodnikova (2003) �nds no
signi�cant price e¤ects at all, partly because a large part of Russian gas consumers is notfacing any price on their marginal gas consumption. Tsygankova (2010) uses an elasticity of-0.4, as market reforms are expected to bring on more price responsiveness in the Russian gasmarket.
13

been increased, as Russian authorities have signalled that prices to a larger
degree should re�ect market prices in Europe. However, full netback pricing
(i.e., prices equal to European prices minus transport costs to Europe) seems
less likely than before, given the signi�cant price increases in the European
market over the last �ve years. Moreover, from a Russian welfare perspective,
netback pricing is not optimal given that Russia exploits its market power in
the European market. The optimal policy is rather to set prices equal to the
full marginal costs of production, including the shadow costs of the resource.
Hence, in our model we assume that Russia will follow such a price policy in
the long run. This is fairly consistent with actual gas prices in Russia in the
baseyear 2009. We then have the following �rst order condition for the Russian
gas market:
cRt(ARt) + �Rt = pRt (12)
Equations (8) and (11) must then be extended for the Russian producer to
account for both exports and supply to the domestic market.
So far we have described what we refer to as the Benchmark scenario. Next,
we assume that in the Shale gas scenario, large volumes of extra gas are supplied
into the European market. This could be a mixture of U.S. LNG exports, other
LNG volumes that are rerouted from the U.S. to the European market, and
European shale gas (e.g., in Poland). We treat these extra volumes, which
gradually come into the market after 2020 and reach a plateau of 150 bcm in
2035, as exogenous.11
Since the model does not distinguish between investments and production
decisions, nor account for costs of adjustments, the model will tend to over-
estimate the initial e¤ects of a shift in expectations. However, we are mostly
interested in the direction of change in initial supply, and not so much in the
size.11Although there is no doubt that there has been a major shift in expectations regarding
future production of unconventional gas, there is no consensus about the size of this shift norits impact on the European gas market. To put our numbers into perspective, however, in2007 EIA expected that the U.S. would import around 150 bcm in 2030. Five years later,EIA expects an export level in 2035 of 70 bcm (EIA, 2007, 2012). Moreover, EIA (2011)expects European unconventional gas production to increase from practically nothing in 2015to around 70 bcm in 2035. IEA (2012) is less optimistic about European unconventionalgas production, but projects global unconventional gas supply to increase by 800 bcm in theperiod 2010-2035 (New Policies Scenario).
14

Figure 1: Supply of gas to the European market in Benchmark and Shale_gasscenarios. Bcm per year
4 Simulation results
4.1 Benchmark scenario
We now turn to the simulation results, where we are interested in the e¤ects of a
shift in expectations regarding future supply to the European gas market, that
is, the di¤erence between the scenarios shale gas and Benchmark. First, how-
ever, let us consider the Benchmark scenario, and check that it �ts reasonably
well with actual and projected supply (and demand). Figure 1 displays how sup-
ply from di¤erent producers develop until 2050. We see that Russian exports to
Europe almost double during this period, increasing Russia�s market share from
32% in 2009 to 54% in 2050. Exports from Norway and the Netherlands are
reduced by respectively one third and two thirds, while Algerian exports �rst
increase and then decrease to a level one quarter above baseyear levels.12 LNG
and other imports besides Russia/Algeria triple over this period, while other
12 In calibrating the model, we added a temporary cost element for Algeria, which declinesto zero after 25 years. This cost element re�ects political and other unquanti�ed costs thatmay explain why Algeria, with total unit costs comparable with Norway but more reserves,produce only two thirds of Norwegian output.
15

Figure 2: Price of gas in the European market in Benchmark and Shale_gasscenarios. $ per toe
domestic production in Europe declines substantially (by assumption). Total
gas consumption increases by around 10% until 2050. This is less than what
the IEA (2012) and others now project, but remember that the Benchmark sce-
nario by construction has an outdated view on future supply of unconventional
gas (because shale gas is not included).13 Without shale gas in the benchmark
model, the gas prices will higher and as a result, the gas consumption lower
than in IEA�s projections. The direction of changes in market shares observed
in the �gure are in line with most expectations about the European gas market,
whether or not unconventional gas supply is accounted for.
The gas price in Europe increases from 280 to 500 $ in real prices per toe
during the period 2009-2050 (see Figure 2), re�ecting diminishing levels of prof-
itable gas resources in most countries. The exceptions are Russia, which still
holds large volumes of not too costly gas in 2050, and imports from other regions
(e.g., LNG). As a consequence, Russian domestic prices stay around 100 $ per
toe during the whole time horizon (Russian gas demand increases by two thirds
during this time period).
13 In the Shale_gas scenario, European gas demand increases by around 20% during thesame period.
16
4.2 Increased supply of unconventional gas
We next consider the e¤ects of adding substantial volumes of unconventional
gas into the European market, gradually increasing from zero in 2020 to 150
bcm from 2035 onwards. From Figure 2 we see that the gas price increases much
more slowly in the shale gas scenario than in the Benchmark scenario, and is
50-90 $ per toe below the Benchmark price during the last 20 years of our time
horizon. We further notice that the gas price drops in the shale gas scenarios
even before the extra volumes of unconventional gas enter the market.
The explanation for the immediate price e¤ect is that the future price de-
crease gives non-renewable resource owners incentives to move some of its pro-
duction forward in time, cf. the theoretical discussion above. As seen in Figure
1, all gas producers reduce their supply from around 2025 in the shale gas sce-
nario (compared to the Benchmark scenario). Moreover, Norway, Algeria and
the Netherlands all produce more in the shale gas scenario than in the Bench-
mark scenario in the �rst 15 years. Hence we obtain the immediate price drop.
The results so far are as expected, given the �ndings in previous literature
(e.g., the Green paradox literature referred to in Section 1). However, we notice
from Figure 1 that Russian gas exports to Europe do not increase initially -
it declines persistently throughout our time horizon in the shale gas scenario
vis-a-vis the Benchmark scenario. Thus, Russia acts quite di¤erently from the
other Cournot players.
The reason is that Russia has vast amounts of gas reserves. Hence, its
behaviour is more driven by the current market situation than by future market
expectations. This is seen in Figure 3, which shows how unit production costs,
the shadow price of the resource, and the oligopoly rent for Russia develop over
time in the two scenarios. As the �gure shows, the shadow price is in the range
10-20 $ per toe, whereas the oligopoly rent increases from 150 $ per toe initially
to 350 $ per toe in 2050 in the Benchmark scenario. Thus, the non-renewability
issue is not particularly pressing for Russia. When the other Cournot players
produce more initially in the shale gas scenario, it is optimal for Russia to cut
back on its supply to Europe.
These results are consistent with the �ndings in Section 2, where we con-
sidered a large player with su¢ ciently large resources. Here we have seen that
Russia has so much more gas resources than other players in the European mar-
ket that an increase in future supply to this market will reduce Russian supply
both today and in after the entry of shale gas.
17
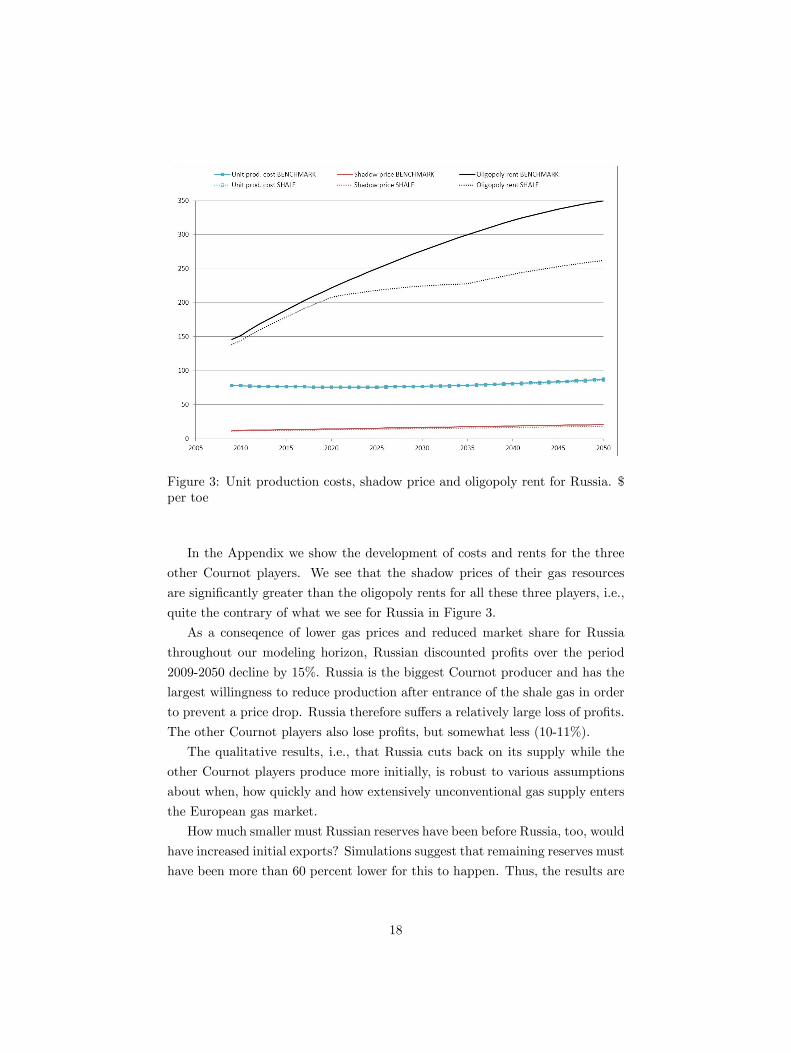
Figure 3: Unit production costs, shadow price and oligopoly rent for Russia. $per toe
In the Appendix we show the development of costs and rents for the three
other Cournot players. We see that the shadow prices of their gas resources
are signi�cantly greater than the oligopoly rents for all these three players, i.e.,
quite the contrary of what we see for Russia in Figure 3.
As a conseqence of lower gas prices and reduced market share for Russia
throughout our modeling horizon, Russian discounted pro�ts over the period
2009-2050 decline by 15%. Russia is the biggest Cournot producer and has the
largest willingness to reduce production after entrance of the shale gas in order
to prevent a price drop. Russia therefore su¤ers a relatively large loss of pro�ts.
The other Cournot players also lose pro�ts, but somewhat less (10-11%).
The qualitative results, i.e., that Russia cuts back on its supply while the
other Cournot players produce more initially, is robust to various assumptions
about when, how quickly and how extensively unconventional gas supply enters
the European gas market.
How much smaller must Russian reserves have been before Russia, too, would
have increased initial exports? Simulations suggest that remaining reserves must
have been more than 60 percent lower for this to happen. Thus, the results are
18

also robust with respect to Russia�s remaining reserve level.14
4.3 Other potential reductions in future residual demand
So far we have focused on additional supply of unconventional gas. However, the
future residual demand for gas could be altered in other ways, too. How would
that a¤ect initial supply from the Cournot producers? Would we get the same
qualitative results? To test this, we have simulated the e¤ects of i) a downward
shift in the inverse supply function of LNG/pipeline imports, ii) a downward
shift in gas demand, and iii) introduction of a unit tax on gas consumption.
With increased imports through LNG and pipelines (i.e., besides Russian/Algerian
and unconventional gas), implemented through a more rapid fall in the inverse
supply function of such imports after 2025, we get quite similar results as with
more unconventional gas. That is, Russian exports to Europe decline initially,
while exports from Norway, the Netherlands and Algeria increase. Note that
the construction of this scenario di¤ers qualitatively from the shale gas scenario
- in the latter scenario we make an exogenous quantity shift while in the former
scenario we make the import supply function more price-responsive.
A downward shift in the demand function after 2025 also leads to the same
qualitative results with respect to initial supply from the four Cournot players.
On the other hand, introducing a unit tax on gas consumption from 2025
leads to increased initial supply from Russia as well as from the other Cournot
producers. The reason is that the consumption tax shifts down the inverse
demand function facing the producers, implying that the producers face a less
elastic demand. As a result, it is more pro�table for large producers to curb pro-
duction in order to raise the price they receive. Thus, being the biggest producer
(especially after 2025), Russia cuts back its supply to Europe relatively more
than the other Cournot players. Hence, Russia�s incentives to save resources
before 2025 are reduced more than in the other scenarios with reduced future
residual demand. At the same time, the other Cournot players� incentives to
accelerate extraction is dampened compared to the other scenarios (since Rus-
sia to a larger degree cuts back on its future supply). Altogether, all Cournot
producers �nd it pro�table to slightly increase their initial supply.
In terms of the theoretical model, Russia, being the largely dominant pro-
ducer, reduces future supply substantially in order to exploit the enhanced
14 It is not straightforward to relate the reserve levels of the four Cournot players to theanalytical model in Section 2, as Russia also supplies its domestic market in the numericalmodel.
19

market power granted by the decline in demand elasticity. This strengthens
the intertemporal e¤ect on Russia to accelerate production, because it reduces
Russia�s incentive to save resources for the future. Moreover, it weakens the
interemporal e¤ect on the other countries. The reason is that the decline in
future Russian supply ameliorates the e¤ect of future taxation. The associated
low acceleration of supply from non-Russia then decreases the static e¤ect on
Russia to reduce current production. This explains why a tax policy that de-
creases both future demand and future demand elasticity may induce Russia to
increase early supply, whereas incidents that primarily reduce future demand
induce Russia to cut back early supply.
The last example illustrates that Russia does not have endless resources after
all. It is optimal for this producer, too, to consider future as well as current
market conditions. In addition to supplying European gas consumers, Russia
has to supply its domestic market as well, which consumes a large share of
Russian gas production. Thus, the impacts on initial market shares of changes in
future market conditions depend not only on whether residual demand increases
or decreases, but also on how it is changed.
5 Conclusions
In a non-renewable resource market, supply is governed both by current prices
and the resource rent. As is well known, new information about bleaker future
market conditions reduces the resource rent and thereby accelerates supply.
In this paper, we have investigated how changed expectations about future
market conditions a¤ect current supply in a non-renewable market characterized
by Cournot competition in strategic substitutes. We �nd that market power in-
duces �rms to cut back some of the increase in aggregate short-run production
induced by bleaker future prospects, as compared to a resource market with
competitive �rms. Indeed, a �rm that endows a su¢ ciently large share of the
resource may reduce current production if the net present value of the resource
declines in the future. The reason is that players with extensive resources care
less about scarcity issues and the resource rent, whereas current market consid-
erations is important. Therefore, as players with less resources accelerate their
supply, it may be optimal for a large player to cut back on its supply in order
to counteract the associated fall in the resource price.
Our results demonstrate that the production pro�le of heterogeneous �rms�
20

may be di¤erently a¤ected by changes in future demand under oligopoly. This
is particularly relevant if the government cares about the composition of supply,
e.g. because of energy security reasons. In this respect, it is interesting that our
numerical simulation suggests that bleaker prospects for oligopolistic exporters
of conventional gas to Europe, caused by the shale gas revolution in the US,
will induce Russia to reduce short run exports of gas to Europe, whereas all
other producers increase current production. The explanation is that natural
gas is hardly a scarce resource in Russia and, consequently, there is little need
for Russia to curb its current extraction in order to save more resources for the
future. Hence, they act almost like a static Cournot player. That is, when other
gas producers increase their supply, Russia cuts back.
Our results also suggest that market power may alleviate the so-called green
paradox, because the acceleration of production and emissions caused by lower
future demand is dampened. Importantly, however, aggregate production un-
ambiguously increases in the short run also under Cournot competition. The
green paradox is therefore not completely removed.
In order to derive theoretical results, the analytical model featured quite
strict assumptions about functional forms. It is arguably reasonable, however,
to expect that the mechanisms detected will be present in more general cases.
In this respect, we observe that the theoretical results are supported by the
more sophisticated numerical model.
21

6 Appendix
Here we present 3 �gures from the numerical simulation.
Figure 4: Unit production costs, shadow price and oligopoly rent for Norway. $per toe
22

Figure 5: Unit production costs, shadow price and oligopoly rent for Algeria. $per toe
Figure 6: Unit production costs, shadow price and oligopoly rent for the Nether-lands. $ per toe
23

References
Andersen, T.B., O.B. Nilsen and R. Tveteras (2011): How is demand for
natural gas determined across European industrial sectors? Energy Policy 39,
5499�5508.
Boyce, J. R., and L. Vojtassak (2008): An �oil�igopoly theory of exploration,
Resource and Energy Economics, 30, 428-454.
BP (2012): BP Statistical Review of World Energy 2012, London: BP.
Chakravorty, U., A. Leach, and M. Moreaux (2011): Would hotelling kill
the electric car?, Journal of Environmental Economics and Management, 61,
281-296.
EIA (2007): International Energy Outlook 2007, Washington, DC: US De-
partment of Energy/Energy Information Administration.
EIA (2011): International Energy Outlook 2011, Washington, DC: US De-
partment of Energy/Energy Information Administration.
EIA (2012): International Energy Outlook 2012, Washington, DC: US De-
partment of Energy/Energy Information Administration.
Gabriel, S.A., A. Moe, K.E. Rosendahl and M. Tsygankova (2013): The
Likelihood and Potential Implications of a Natural Gas Cartel, forthcoming in
R. Fouquet (ed.): Handbook on energy and climate change, Cheltenham, UK:
Edward Elgar Publishing.
Gerlagh, R. (2011): Too Much Oil, CESifo Economic Studies 57, 79�102.
Golombek, R., E. Gjelsvik and K.E. Rosendahl (1995): E¤ects of Liberal-
izing the Natural Gas Market in Western Europe, The Energy Journal 16 (1),
85-111.
Golombek, R., E. Gjelsvik and K.E. Rosendahl (1998): Increased Compe-
tition on the Supply Side of the Western European Natural Gas Market, The
Energy Journal 19 (3), 1-18.
Heal, G. (1976): The Relationship between Price and Extraction Cost for
a Resource with a Backstop Technology, The Bell Journal of Economics, 7,
371-378.
Hoel, M. (2011): The Supply Side of CO2 with Country Heterogeneity, Scan-
dinavian Journal of Economics 113, 846�865.
Holz, F., von Hirchhausen, C. and C. Kemfert (2008): A strategic model of
European gas supply (GASMOD). Energy Economics 30 (3), 766�788.
Holz, F., von Hirchhausen, C. and C. Kemfert (2009): Perspectives of the
European Natural Gas Markets Until 2025, The Energy Journal 30, Special
24

Issue "World Natural Gas Markets and Trade: A Multi-Modeling Perspective",
137-150.
Hotelling, H. (1931): The economics of exhaustible resources. Journal of
Political Economy 39, 137�175.
IEA (2009): World Energy Outlook 2009, Paris: OECD/IEA.
IEA (2011a): World Energy Outlook 2011, Paris: OECD/IEA.
IEA (2011b): Are we entering a golden age of gas? Special report, World
Energy Outlook 2011, Paris: OECD/IEA.
IEA (2012): World Energy Outlook 2012, Paris: OECD/IEA.
Loury, G. C. (1986): A Theory of �Oil�Igopoly: Cournot Equilibrium in Ex-
haustible Resource Markets with Fixed Supplies, International Economic Re-
view, 27, 285-301.
Polasky, S. (1992): Do oil producers act as �Oil�igopolists?, Journal of Envi-
ronmental Economics and Management, 23, 216-247.
Salant, S. (1976): Exhaustible Resources and Industrial Structure: A Nash-
Cournot Approach to the World Oil Market, Journal of Political Economy 84
(5), 1079-1093.
Sinn, H.W. (2008): Public Policies against Global Warming: A Supply Side
Approach, International Tax and Public Finance 15, 360�394.
Solodnikova, K. (2003): Estimation of Energy Demand Elasticities in Russia,
Master�s Thesis, New Economic School, Moscow.
Tirole, J. (1988): The theory of industrial organization. Cambridge, Mass.
and London: MIT Press.
Tsygankova, M. (2010): When is a breakup of Gazprom good for Russia?
Energy Economics 32, 908�917.
Zwart, G. (2009): European Natural Gas Markets: Resource Constraints
and Market Power Market Arbitrage: European and North American Natural
Gas Prices, The Energy Journal 30, Special Issue "World Natural Gas Markets
and Trade: A Multi-Modeling Perspective", 151-166.
25

From:Statistics Norway
Postal address:PO Box 8131 DeptNO-0033 Oslo
Offi ce address:Kongens gate 6, OsloOterveien 23, Kongsvinger
E-mail: [email protected]: www.ssb.noTelephone: + 47 62 88 50 00
ISSN 0809-733X
B Return to:Statistisk sentralbyråNO-2225 Kongsvinger
Desig
n: Siri B
oq
uist