lake whatcom watershed total phosphorus and … whatcom watershed total phosphorus and bacteria...
TRANSCRIPT

Lake Whatcom Watershed Total Phosphorus and Bacteria
Total Maximum Daily Loads
Volume 1. Water Quality Study Findings
November 2008
Publication No. 08-03-024

Lake Whatcom Watershed Total Phosphorus and Bacteria TMDLs: WQ Study Findings Page 2
Publication and Contact Information This report is available on the Department of Ecology’s website at www.ecy.wa.gov/biblio/0803024.html Data for this project are available at Ecology’s Environmental Information Management (EIM) website www.ecy.wa.gov/eim/index.htm. Search User Study ID, WHATCOM.
Ecology’s Study Tracker Code for this study is 02-051. For more information contact: Publications Coordinator Environmental Assessment Program P.O. Box 47600 Olympia, WA 98504-7600 E-mail: [email protected] Phone: 360-407-6764 Washington State Department of Ecology - www.ecy.wa.gov/
o Headquarters, Olympia 360-407-6000 o Northwest Regional Office, Bellevue 425-649-7000 o Southwest Regional Office, Olympia 360-407-6300 o Central Regional Office, Yakima 509-575-2490 o Eastern Regional Office, Spokane 509-329-3400
Cover photo: Lake Whatcom looking southeast over the city of Bellingham.
Any use of product or firm names in this publication is for descriptive purposes only and does not imply endorsement by the author or the Department of Ecology. If you need this publication in an alternate format, call Joan LeTourneau at 360-407-6764. Persons with hearing loss can call 711 for Washington Relay Service. Persons with a speech disability can call 877-833-6341.

Lake Whatcom Watershed Total Phosphorus and Bacteria TMDLs: WQ Study Findings Page 3
Lake Whatcom Watershed Total Phosphorus and Bacteria
Total Maximum Daily Loads
Volume 1. Water Quality Study Findings
by
Paul Pickett
Environmental Assessment Program Washington State Department of Ecology
Olympia, Washington 98504-7710
and
Steve Hood Bellingham Field Office
Washington State Department of Ecology Bellingham, Washington 98225
Waterbody Numbers WA-01-9170 WA-01-3150 WA-01-Ande WA-01-Aust WA-01-Bran WA-01-Carp WA-01-Eucl WA-01-Mill WA-01-Silv WA-01-Smit

Lake Whatcom Watershed Total Phosphorus and Bacteria TMDLs: WQ Study Findings Page 4
This page is purposely left blank
Lake Whatcom Watershed Total Phosphorus and Bacteria TMDLs: WQ Study Findings Page 5
Table of Contents
Page
List of Figures ......................................................................................................................7
List of Tables .......................................................................................................................9
Abstract ..............................................................................................................................11
Executive Summary ...........................................................................................................13 The problem with too much phosphorus .....................................................................13 State targets Lake Whatcom for improvement ............................................................14 Standards set to protect lake ........................................................................................14 Watershed description ..................................................................................................14 Study methods ..............................................................................................................15 Study quality assurance evaluation ..............................................................................15 TMDL analyses ............................................................................................................15
What is a Total Maximum Daily Load (TMDL)? .............................................................21 Federal Clean Water Act requirements ........................................................................21 TMDL process overview .............................................................................................21 Elements required in a TMDL .....................................................................................22 Total Maximum Daily Load analyses: Loading capacity ............................................22 Surrogate measures ......................................................................................................23
Why is Ecology conducting a TMDL study in this watershed? .......................................25 Overview ......................................................................................................................25 Study area.....................................................................................................................25 Pollutants addressed by this TMDL .............................................................................26 Impaired beneficial uses and waterbodies on Ecology’s 303(d) list of impaired waters ...........................................................................................................................26 Why are we doing this TMDL now? ...........................................................................27
Water Quality Standards and Beneficial Uses ...................................................................29 Dissolved oxygen .........................................................................................................29 Bacteria ........................................................................................................................31 Aesthetic values and phosphorus .................................................................................32
Watershed Description .......................................................................................................33 Lake characteristics ......................................................................................................33 Watershed characteristics .............................................................................................34 Pollutant sources ..........................................................................................................35
Goals and Objectives .........................................................................................................39 Project goals .................................................................................................................39 Study objectives ...........................................................................................................39
Study Methods ...................................................................................................................41
Study Quality Assurance Evaluation .................................................................................43

Lake Whatcom Watershed Total Phosphorus and Bacteria TMDLs: WQ Study Findings Page 6
Results and Discussion ......................................................................................................44
TMDL Analyses .................................................................................................................45 Dissolved oxygen and total phosphorus ......................................................................45 Bacteria ........................................................................................................................78
Public Participation ............................................................................................................86
Conclusions ........................................................................................................................87 Dissolved oxygen and total phosphorus ......................................................................87 Bacteria ........................................................................................................................87
Recommendations ..............................................................................................................89 Dissolved oxygen and total phosphorus ......................................................................89 Bacteria ........................................................................................................................90
References ..........................................................................................................................91
Figures................................................................................................................................97
Appendix A. Glossary and Acronyms ............................................................................141
Appendices B-H are printed as a separate document (Publication No. 08-03-024AppB-H) Appendix B. Data Quality Analysis Appendix C. Water Quality Data Appendix D. Phytoplankton Identification Summaries Appendix E. Lake Whatcom CE-QUAL-W2 Calibration Error Statistics Appendix F. Bacterial Analysis Method Appendix G. Tributary Regression Statistics Appendix H. Responsiveness Summary

Lake Whatcom Watershed Total Phosphorus and Bacteria TMDLs: WQ Study Findings Page 7
List of Figures
Page
Figure 1. Lake Whatcom Study Area (Lake and Subbasins). ...........................................99
Figure 2. Lake Whatcom Basins 1 and 2 with Sampling Locations. ..............................100
Figure 3. Lake Whatcom Basin 3 with Sampling Locations. .........................................101
Figure 4. Land Use Cover for Base Case (2002-03 conditions), from Cadmus and CDM, 2007b. ...................................................................................................102
Figure 5. Lake Whatcom Site 1 Hydrolab® Profiles (Basin 1). .....................................103
Figure 6. Lake Whatcom Site 2 Hydrolab® Profiles (Basin 2). .....................................104
Figure 7. Lake Whatcom Site 3 Hydrolab® Profile (Basin 3 North). ............................105
Figure 8. Lake Whatcom Site 4 Hydrolab® Profiles (Basin 3 South). ...........................106
Figure 9. Lake Whatcom Geneva Sill Hydrolab® Profiles. ...........................................107
Figure 10. Lake Whatcom Strawberry Sill Hydrolab® Profiles. .....................................108
Figure 11. Site 1 Diurnal Dissolved Oxygen Measurements (Basin 1). .........................109
Figure 12. Site 1 Diurnal Temperature Measurements (Basin 1). ..................................110
Figure 13. Basin 1 Diurnal pH Measurements. ...............................................................111
Figure 14. Site 1 Diurnal Conductivity Measurements (Basin 1). ..................................112
Figure 15. Phytoplankton Phyla – 2002, Site 1 (Basin 1). ..............................................113
Figure 16. Phytoplankton Phyla – 2002, Site 2 (Basin 2). ..............................................114
Figure 17. Phytoplankton Phyla – 2002, Site 3 (Basin 3 North). ...................................115
Figure 18. Phytoplankton Phyla – 2003, Site 1 (Basin 1). ..............................................116
Figure 19. Phytoplankton Phyla – 2003, Site 2 (Basin 2). ..............................................117
Figure 20. Phytoplankton Phyla – 2003, Site 3 (Basin 3 North). ...................................118
Figure 21. CE_QUAL-W2 Model Layout. .....................................................................119
Figure 22. CE_QUAL-W2 Model Grid. .........................................................................120
Figure 23. Lake Whatcom Bathymetry and Model Segmentation. ................................121
Figure 24. Land Use Cover for Full Buildout Case, from Cadmus and CDM, 2007b. ..122
Figure 25. Example of Cumulative Volume Method for Evaluating Dissolved Oxygen Levels. .............................................................................................123
Figure 26. Comparison of Base Scenario (2002-03) to Full Rollback Scenario, in Terms of Cumulative Volumes of Dissolved Oxygen in Basin 1 (segments 60 and 61), June-October. ............................................................124

Lake Whatcom Watershed Total Phosphorus and Bacteria TMDLs: WQ Study Findings Page 8
Figure 27. Comparison of Full Buildout Scenario to Full Rollback Scenario, in Terms of Cumulative Volumes of Dissolved Oxygen in Basin 1 (segments 60 and 61), June-October. ............................................................125
Figure 28. Comparison of Full Rollback Scenario to Full Rollback With Natural Hydrology Scenario, in Terms of Cumulative Volumes of Dissolved Oxygen in Basin 1 (segments 60 and 61), June-October. .............................126
Figure 29. Comparison of Base Scenario with 85.54% Reduction in Development to Full Rollback Scenario, in Terms of Cumulative Volumes of Dissolved Oxygen in Basin 1 (segments 60 and 61), June-October. ...........127
Figure 30. Comparison of Full Buildout Scenario with 94.60% Reduction in Development to Full Rollback Scenario, in Terms of Cumulative Volumes of Dissolved Oxygen in Basin 1 (segments 60 and 61), June-October. ................................................................................................128
Figure 31. Comparison of Base Scenario with Base Scenario with no Georgia Pacific withdrawal (moved to Whatcom Creek), in Terms of Cumulative Volumes of Dissolved Oxygen in Basin 1 (segments 60 and 61), June-October. ................................................................................................129
Figure 32. Effectiveness of Stormwater Pollution Control Strategy Based on Design Size. ...................................................................................................130
Figure 33. Total Phosphorus 2003 Loading by Category for TMDL Scenarios. ...........131
Figure 34. Total Phosphorus 2003 Loading for the Base Scenario. ...............................132
Figure 35. Total Phosphorus 2003 Loading for the Full Rollback Scenario. .................133
Figure 36. Total Phosphorus 2003 Loading for the Full Buildout Scenario. ..................134
Figure 37. Total Phosphorus 2003 Loading for the Partial Rollback from Base Scenario. ........................................................................................................135
Figure 38. Total Phosphorus 2003 Loading for the Partial Rollback from Full Rollback Scenario. ........................................................................................136
Figure 39. Modeled Phosphorus Loading from Each Tributary for Base and Full Buildout Scenarios, Shown by Land Use Type. ...........................................137
Figure 40. Modeled Phosphorus Loading from Each Tributary for Base and Full Buildout Scenarios Expressed as the Ratio to the Full Rollback Scenario, Shown by Land Use Type. ............................................................................138
Figure 41. Allowable Phosphorus Loading from Each Tributary for two Partial Rollback Scenarios, Shown by Land Use Type. ...........................................139
Figure 42. Allowable Phosphorus Loading from Each Tributary for Two Partial Rollback Scenarios Expressed as the Ratio to the Full Rollback Scenario, Shown by Land Use Type. ............................................................................140

Lake Whatcom Watershed Total Phosphorus and Bacteria TMDLs: WQ Study Findings Page 9
List of Tables
Page
Table 1. Waterbodies and Parameters on the 2004 303(d) List Addressed by This Report. ........................................................................................................26
Table 2. Additional Lake Whatcom 303(d) Listings Not Addressed by This Report. .....27
Table 3. Lake Whatcom Morphometric Data. ..................................................................33
Table 4. Lake Whatcom Model Scenarios. .......................................................................48
Table 5. Model Groundwater Flow and Phosphorus. .......................................................52
Table 6. Comparison of Model First-Order and Zero-Order Sediment Phosphorus Release (kg/d) to the Water Column From July 30 to August 28, 2002. ...........55
Table 7. Total Acres per Subbasin by Land Use Category – Base Scenario. ...................60
Table 8. Percentages per Subbasin by Land Use Category – Base Scenario. ...................61
Table 9. Total Acres per Subbasin by Land Use Category – Full Buildout Scenario. .....62
Table 10. Percentages per Subbasin by Land Use Category – Full Buildout Scenario. ...63
Table 11. Facilities Which Will Receive Wasteload Allocations. ....................................71
Table 12. Scenarios Showing Developed Acres, Undeveloped (forest and wetland) Acres, and Total Phosphorus Loading by Tributary. .........................................74
Table 13. Lake Whatcom Tributaries 2002-03 Fecal Coliform Concentrations. .............80
Table 14. Lake Whatcom Tributaries Fecal Coliform Load Allocations. ........................82
Lake Whatcom Watershed Total Phosphorus and Bacteria TMDLs: WQ Study Findings Page 10
This page is purposely left blank

Lake Whatcom Watershed Total Phosphorus and Bacteria TMDLs: WQ Study Findings Page 11
Abstract Lake Whatcom is impaired for dissolved oxygen due to phosphorus loading. Tributaries to the lake fail to meet Washington State standards for fecal coliform bacteria. The goal of this study is to determine Total Maximum Daily Loads (TMDLs) of these two pollutants. During 2002-03, several agencies conducted monitoring surveys of the lake and tributaries. For dissolved oxygen (DO), a CE-QUAL-W2 lake model was calibrated for those two years. An HSPF watershed model was developed to predict streamflow and phosphorus lake model tributary inputs based on land-use conditions. Watershed model land uses were adjusted to produce scenarios for evaluating Lake Whatcom’s response to phosphorus. Land uses for 2002-03 conditions (Base scenario) were changed to mixed forest to estimate natural loading of phosphorus (Full Rollback scenario). Base land uses were changed to maximum allowable development levels to estimate future loading (Full Buildout scenario). Finally, land uses in the Base and Full Buildout scenarios were each partially modified to meet water quality standards. DO levels were compared between scenarios using the cumulative distributions of lake volumes with different DO values. The DO lake criterion of 0.2 mg/L was subtracted from the Full Rollback scenario to create site-specific targets for this TMDL. Loading capacities for total phosphorus and for developed acres that generate phosphorus loading at 2003 levels were calculated for two pollutant-reduction scenarios. This was done to provide information for the future selection of final loading capacity and allocations. Bacteria levels in 11 tributary streams and drains did not meet standards. The statistical rollback method was used to determine geometric mean targets for bacteria corresponding to the 90th percentile criteria of 100 cfu/100 mg/L. A Beales ratio estimator formula was used to calculate the annual fecal coliform loads, and bacteria reduction targets were calculated. Pollutant allocations are recommended for tributary fecal coliform bacteria.

Lake Whatcom Watershed Total Phosphorus and Bacteria TMDLs: WQ Study Findings Page 12
Acknowledgements The authors of this report would like to thank the following people for their contribution to this study:
• City of Bellingham – Peg Wendling, Clare Fogelsong, Mike Sowers, Mike Easley, Anthony Lorenz, Derrick Bullock, Bill Miller, Bill Evans, Wendy Steffensen, Geoff Smyth, Bill McCourt, and Michelle Evans.
• Western Washington University – Robin Matthews, Mike Hilles, Joan Vandersypen, and Robert Mitchell.
• Whatcom County – Sue Blake.
• Lake Whatcom Water and Sewer District – Chip Anderson.
• Utah State University – Andy Bookter.
• Washington State Department of Ecology – Jing Liu, Bob Cusimano, Charles Pitz, Karol Erickson, Will Kendra, Helen Bresler, Anise Ahmed, Richard Grout, Doug Allen, Marcia Geidel, Ann Butler, Joan LeTourneau, Cindy Cook, and Gayla Lord.
• U.S. Environmental Protection Agency – Dave Ragsdale, Mark Filippini, and Jayne Carlin.
• HydroLogic Services – Joanne Greenberg.
• Portland State University – Scott Wells, Chris Berger, and Robert Annear.
• CDM – Scott Coffey, Steve Wolosoff, Greg McGrath, Malena Foster, and Richard Wagner.
• Cadmus Group – Linda Blake.
• GeoEngineers, Inc – Dave Cook.
• National Atmospheric Deposition Program – Christopher Lehmann.
Many other people not listed here have also helped, including citizens and agency staff who provided comments, and the authors thank them as well.

Lake Whatcom Watershed Total Phosphorus and Bacteria TMDLs: WQ Study Findings Page 13
Executive Summary In response to requirements of the federal Clean Water Act, the Washington State Department of Ecology (Ecology) has conducted a study that lays the groundwork for restoring dissolved oxygen in Lake Whatcom and reducing fecal coliform bacteria in some of the lake’s tributaries to levels that meet Washington State standards. Meeting those standards will ensure that the lake will continue to (1) be a clean source of drinking water for 96,000 people in Bellingham and Whatcom County, (2) support fish, birds, plants and animals, and (3) provide aesthetic and recreational value to the community. Researchers have determined that excess phosphorus in the lake is the main cause of declining oxygen levels. This study quantifies how much phosphorus the lake can process naturally and still supply enough oxygen to meet state standards. To set phosphorus limits, Ecology used scientific computer models to examine the relationship between the acres of developed surfaces such as roads, roofs, decks, and lawns and the amount of phosphorus carried by stormwater into the water below. Based on the modeling analysis, phosphorus levels would meet dissolved oxygen standards if they were equivalent to 85.5% fewer acres of 2003 development, or 94.6% fewer acres than the total development allowed under 2003 zoning. These numbers paint a dramatic picture of how much work needs to be done to meet phosphorus limits. It will be up to local government leaders to develop strategies and pass laws that improve stormwater management so stormwater is absorbed, filtered, and released into the lake more naturally, as if most of the development is not there. The pollutant limits recommended by this study will enhance efforts already under way by local governments, advocacy groups, and individual residents to improve and sustain water quality in Lake Whatcom.
The problem with too much phosphorus In Washington State at least 260 bodies of water are polluted because of phosphorus. Phosphorus is a common ingredient in household detergents and fertilizers, is used in many industrial processes, and occurs naturally in soil and human and animal wastes. Phosphorus behaves as a fertilizer, accelerating plant and algae growth. When plants and algae die, bacteria consume oxygen that is dissolved in the water, leaving less oxygen. Oxygen is essential for fish and aquatic life to survive. The results of accelerated plant and algae growth in the water can require an increase in drinking water treatment chemicals that form carcinogenic byproducts and add treatment costs.

Lake Whatcom Watershed Total Phosphorus and Bacteria TMDLs: WQ Study Findings Page 14
State targets Lake Whatcom for improvement The federal Clean Water Act requires states to set water quality standards and prepare a list of waterbodies that fail to meet those standards, based on tests for specific polluting substances. For each waterbody on the list, called the 303(d) list of impaired waterbodies, Ecology must determine how much of those pollutants the waterbody can process and still meet standards. The amount of allowable pollutants is called the total maximum daily load, or TMDL. Years of sampling, data collection, and monitoring showed Lake Whatcom dissolved oxygen at levels low enough to land the lake on the 303(d) list. Further study showed fecal coliform levels in most tributaries are too high. For every TMDL study, a follow-up Implementation Plan addresses how and when sources will reach compliance with their allocation of allowable pollutants, and sets monitoring guidelines for the TMDL’s effectiveness.
Standards set to protect Lake Whatcom and its tributaries In this TMDL study, fisheries and aquatic life are protected by dissolved oxygen criteria in Washington State Water Quality Standards. In lakes, human actions may not decrease the one-day minimum oxygen concentration more than 0.2 mg/L below estimated natural conditions. To protect human health, fecal coliform bacteria in the lake and its tributaries must not exceed a geometric mean value of 50 colony forming units/100 mL, with not more than 10% of all samples exceeding 100 cfu/100 mL. These criteria are protective enough for drinking water, recreation, and aesthetics.
Watershed description Lake Whatcom is a large natural lake located in Whatcom County (Figure ES-1). The northwest end of the lake lies within the city of Bellingham. The lake consists of three distinct lake basins separated by glacial sills. Basin 1, closest to Bellingham, contains only 2% of the lake’s volume. Basin 2 is slightly smaller. Basin 3 contains 96% of the lake’s volume. The lake is a complex system, and the arrangement of the basins keeps pools of water in the lake a long time rather than moving water through quickly. Lake Whatcom is included in Watershed Resource Inventory Area (WRIA) 1, which includes the Nooksack watershed. The study area for this TMDL consists of Lake Whatcom and its 22 tributary subbasins, extending to the Electric Avenue Bridge near the control dam at the lake’s outlet. The diversion from the middle fork of the Nooksack River is also being examined in this study.

Lake Whatcom Watershed Total Phosphorus and Bacteria TMDLs: WQ Study Findings Page 15
Land uses in Lake Whatcom are predominantly urban, rural residential, and forestry. The northwest end of the lake is the most urban, and the southeast end is the least developed. The existing population within the watershed is about 13,000, but current zoning will allow growth in the watershed to about 28,000 people.
Study methods Study methods followed the procedures described in the Quality Assurance Project Plan for this study. Monitoring surveys were conducted by the City of Bellingham from January to June 2002, and by Ecology from July 2002 to January 2004. Other data collected by various other organizations were used.
Study quality assurance evaluation Monitoring at all locations followed standard data quality assurance procedures. The quality of the data has been reviewed, unacceptable data have been removed from the analysis, and questionable data qualified. The remaining data are credible and representative, and appropriate for use in TMDL development.
TMDL analyses Increasing oxygen by decreasing phosphorus Two linked water quality models were used to develop the dissolved oxygen TMDL:
1. CE-QUAL-W2 analyzed Lake Whatcom hydrodynamics, temperature, and water quality constituents. The model was calibrated to 2002-03 observed lake levels and water quality profiles.
2. HSPF calculated flows and phosphorus concentrations from tributaries to the lake. The model looked at existing watershed land uses and was calibrated to measured flow and phosphorus. All other tributary water quality constituents were estimated from measured values based on time of year and estimated flow.
The TMDL used the models to examine three scenarios:
1. Full Rollback – Changes 2002-03 land uses to a natural land cover of mixed forest and wetland.
2. Base – 2002-03 land uses.
3. Full Buildout – Changes 2002-03 land uses to the maximum amount of development allowed by current zoning.

Lake Whatcom Watershed Total Phosphorus and Bacteria TMDLs: WQ Study Findings Page 16
To account for changes in pollution and flows over time, the model used 2003 conditions multiple times as if they were consecutive years. This makes the results more dependent on tributary loading and less dependent on initial conditions. To meet water quality standards, reductions of human-caused sources of total phosphorus were calculated by reducing development from both the Base and Full Buildout scenarios. This allowed scenarios to be compared in terms of developed acres, based on the land uses and associated phosphorus loading monitored and modeled for 2003 conditions. The loading capacity of the lake was estimated as an annual average of between 14.15 kg/day of total phosphorus, or between 524 and 563 developed acres that generate phosphorus at 2003 levels (see Table ES-1), depending on where development occurs and the effectiveness of pollutant control activities. This represents an 85.5% reduction of developed acres from the Base scenario and a 94.6% reduction of developed acres from the Full Buildout scenario. The Environmental Protection Agency describes how developed acres translate to phosphorus loading in a 2008 work plan from Massachusetts in which pollution control strategies were evaluated for their ability to remove phosphorus. One strategy used to filter 1.6 inches of precipitation through soil reduced phosphorus by 90% (Figure E-2). If the same strategy were used for a new development or for retrofitting existing development, only 10% of the area would count as developed acres that generate phosphorus loading. Fecal coliform bacteria Eleven creeks and drains (tributaries to Lake Whatcom) were found to exceed standards for fecal bacteria. In order to meet standards, the TMDL study sets reductions in fecal coliform of up to 92% in the dry season and from 37% to 96% in the wet season, depending on the current levels of bacteria and the flow of water through the tributaries. (See Table ES-2). This study recommends pollutant targets for fecal coliform in all tributaries that fail to meet standards. The reductions necessary to meet targets will be used as the basis for load allocations when the final TMDL is submitted to EPA. Pollutant allocations The amount of allowable pollutants assigned to each source – stormwater outfalls, creeks, or general runoff – will depend on whether the city and county can provide reasonable assurance that they will reduce pollution throughout the watershed. If the city and county cannot assure Ecology that they will reduce pollution throughout the watershed, then additional reductions will be required from the stormwater under their permits.

Lake Whatcom Watershed Total Phosphorus and Bacteria TMDLs: WQ Study Findings Page 17
Figure ES-1. Lake Whatcom TMDL study area showing tributary watersheds and monitoring locations.

Lake Whatcom Watershed Total Phosphorus and Bacteria TMDLs: WQ Study Findings Page 18
Figure ES-2. Effectiveness of stormwater pollution control strategy based on design size (from Massachusetts study [EPA, 2008])

Lake Whatcom Watershed Total Phosphorus and Bacteria TMDLs: WQ Study Findings Page 19
Table ES-1. Scenarios showing developed acres, undeveloped (forest and wetland) acres, and total phosphorus loading by tributary.
Tributary Subbasin
Name
Full Rollback Scenario Base Scenario 85.5% rollback from
Base Scenario Full Buildout Scenario 94.6% rollback from Full Buildout Scenario
forest & wetland
acres
2003 TP
(kg/yr)
developed acres
forest & wetland
acres
2003 TP
(kg/yr)
developed acres
forest & wetland
acres
2003 TP
(kg/yr)
developed acres
forest & wetland
acres
2003 TP
(kg/yr)
developed acres
forest & wetland
acres
2003 TP
(kg/yr)
Academy 780.0 36.3 187.4 592.7 117.1 27.1 753.0 41.6 620.7 159.3 215.4 33.5 746.5 38.9
Agate 2135.5 99.6 512.3 1623.5 320.3 74.1 2061.8 114.0 1698.1 437.4 589.2 91.7 2043.8 106.7
Anderson 2591.5 262.0 225.0 2366.5 256.8 32.5 2558.9 234.8 559.6 2032.0 400.3 30.2 2561.4 239.9
Austin 5331.6 300.8 325.7 5005.5 410.4 47.1 5284.1 304.2 1196.4 4135.0 796.8 64.6 5266.8 314.8
South Bay 2426.8 233.8 292.4 2134.4 367.5 42.3 2384.5 255.1 1121.0 1305.9 730.7 60.5 2366.3 262.7
Bloedel 82.7 1.3 22.9 59.8 8.9 3.3 79.4 2.4 54.2 28.5 19.3 2.9 79.8 2.2
Blue Canyon 3381.1 373.0 229.8 3151.1 407.8 33.2 3347.7 383.4 389.4 2991.7 463.8 21.0 3360.1 381.6
Brannian 2439.9 232.1 112.5 2327.7 232.9 16.3 2423.9 218.5 174.5 2265.3 253.7 9.4 2430.4 218.1
Cable 111.0 2.1 63.1 47.9 16.5 9.1 101.9 4.2 98.4 12.7 22.2 5.3 105.7 3.2
Carpenter 1149.6 68.2 173.0 976.7 142.7 25.0 1124.7 74.7 766.9 382.9 316.9 41.4 1108.4 76.8
Donovan 61.8 1.2 26.1 35.7 7.7 3.8 58.0 2.1 48.1 13.8 12.8 2.6 59.2 1.8
Eagle Ridge 90.1 4.2 21.6 68.5 13.5 3.1 87.0 4.8 71.6 18.5 24.9 3.9 86.2 4.5 Geneva
(Euclid Ck) 224.9 6.0 63.8 161.2 18.1 9.2 215.8 7.7 162.0 63.0 34.1 8.7 216.3 7.5
Fir 545.1 58.3 19.3 525.8 64.0 2.8 542.4 58.9 102.1 443.0 91.0 5.5 539.6 59.7 Hillsdale
(Silver Beach Ck) 729.3 13.1 252.2 477.0 133.7 36.5 692.7 30.2 704.6 24.6 256.8 38.0 691.1 25.8
Oriental (Mill Wheel Ck) 583.5 10.3 159.3 424.2 58.8 23.0 560.5 17.3 388.3 195.3 126.3 21.0 562.6 16.6
North Shore 1195.6 72.9 217.8 977.7 163.3 31.5 1164.0 88.6 464.0 731.6 228.7 25.1 1170.6 83.0
Olsen 2423.7 313.3 29.1 2395.1 325.8 4.2 2420.0 315.2 183.7 2240.1 376.1 9.9 2413.9 316.8
Silver Beach 328.2 15.1 79.4 248.9 49.4 11.5 316.8 17.5 262.0 66.2 91.0 14.1 314.1 16.3
Smith 3192.5 227.5 107.0 3085.4 233.1 15.5 3177.0 228.3 170.5 3021.9 235.5 9.2 3183.2 227.9
Strawberry 774.0 33.2 342.4 431.5 141.0 49.5 724.3 48.0 679.2 94.8 258.8 36.7 737.4 44.4
Sudden Valley 605.6 44.0 163.8 441.6 133.3 23.7 581.8 55.4 516.8 88.7 300.8 27.9 577.6 56.0
Total 31183.9 2408.3 3625.9 27558.6 3623 524 30660 2506.9 10432.2 20752.2 5845.2 563 30621 2505.3
Other Sources
MFN diversion 293.1 293.1 293.1 293.1 293.1
Groundwater 2203.4 2203.4 2203.4 2203.4 2203.4
Precipitation 162.6 162.6 162.6 162.6 162.6
Total 5067.6 6281.8 5166.0 8504.3 5164.4
TP = Total Phosphorus; kg/yr = kilograms per year; Ck = Creek

Lake Whatcom Watershed Total Phosphorus and Bacteria TMDLs: WQ Study Findings Page 20
Table ES-2. Lake Whatcom tributaries fecal coliform load allocations.
Tributary
Wet Season Targets (November-April) Geometric
Mean (cfu/100 mL)
Highest Tenth %
(cfu/100 mL)
Load Allocation (cfu/day)
Reduction (%)
Anderson Creek 50 100 1.5E+10 0% Austin Creek 14 100 1.2E+10 -51% Brannian Creek 50 100 1.4E+08 0% Cable Street Drain 4 100 --1 -60% Carpenter Creek 12 100 1.3E+09 -20% Euclid Creek 12 100 6.2E+08 -77% Mill Wheel Creek 39 100 1.2E+09 -74% Olsen Creek 50 100 9.3E+09 0% Park Place Drain 25 100 --1 -92% Silver Beach Creek 17 100 1.6E+09 -88% Smith Creek 50 100 4.3E+08 0%
Tributary
Dry Season Targets (May-October) Geometric
Mean (cfu/100 mL)
Highest Tenth %
(cfu/100 mL)
Load Allocation (cfu/day)
Reduction (%)
Anderson Creek 13 100 9.0E+09 -75% Austin Creek 17 100 1.3E+10 -85% Brannian Creek 31 100 4.9E+08 -37% Cable Street Drain 3 100 --1 -90% Carpenter Creek 31 100 1.2E+09 -55% Euclid Creek 22 100 7.6E+08 -50% Mill Wheel Creek 42 100 1.1E+09 -92% Olsen Creek 22 100 1.2E+10 -53% Park Place Drain 18 100 --1 -92% Silver Beach Creek 31 100 1.6E+09 -96% Smith Creek 31 100 7.5E+08 -39%
1No flows available for calculating loads.

Lake Whatcom Watershed Total Phosphorus and Bacteria TMDLs: WQ Study Findings Page 21
What is a Total Maximum Daily Load (TMDL)?
Federal Clean Water Act requirements The Clean Water Act established a process to identify and clean up polluted waters. Under the Clean Water Act, each state is required to have its own water quality standards designed to protect, restore, and preserve water quality. Water quality standards consist of designated uses for protection, such as cold water biota and drinking water supply, as well as criteria, usually numeric criteria, to achieve those uses. Every two years, states are required to prepare a list of waterbodies – lakes, rivers, streams, or marine waters – that do not meet water quality standards. This list is called the 303(d) list. To develop the list, Ecology compiles its own water quality data along with data submitted by local, state, and federal governments, tribes, industries, and citizen monitoring groups. All data are reviewed to ensure that they were collected using appropriate scientific methods before the data are used to develop the 303(d) list. The 303(d) list is part of the larger Water Quality Assessment. The Water Quality Assessment is a list that tells a more complete story about the condition of Washington’s water. This list divides waterbodies into five categories: Category 1 – Meets standards for parameter(s) for which it has been tested.
Category 2 – Waters of concern.
Category 3 – Waters with no data available.
Category 4 – Polluted waters that do not require a TMDL because: 4a. – Has an approved TMDL and it is being implemented. 4b. – Has a pollution control plan in place that should solve the problem. 4c. – Is impaired by a non-pollutant such as low water flow, dams, culverts.
Category 5 – Polluted waters that require a TMDL – the 303(d) list.
TMDL process overview The Clean Water Act requires that a Total Maximum Daily Load (TMDL) be developed for each of the waterbodies on the 303(d) list. A TMDL identifies how much pollution needs to be reduced or eliminated to achieve clean water. Then Ecology works with the local community to develop (1) a strategy to control the pollution and (2) a monitoring plan to assess effectiveness of the water quality improvement activities.

Lake Whatcom Watershed Total Phosphorus and Bacteria TMDLs: WQ Study Findings Page 22
Elements required in a TMDL The goal of a TMDL is to ensure the impaired waters, and any other water not meeting water quality standards, will attain water quality standards. A TMDL includes a written, quantitative assessment of water quality problems and of the pollutant sources that cause the problem. The TMDL determines the amount of a given pollutant that can be discharged to the waterbody and still meet standards (the loading capacity) and allocates that load among the various sources. If the pollutant comes from a discrete (point) source such as a municipal or industrial facility’s discharge pipe, that facility’s share of the loading capacity is called a wasteload allocation. If the pollutant comes from a set of diffuse (nonpoint) source such as general urban, residential, or farm runoff, the cumulative share is called a load allocation. The TMDL must also consider seasonal variations and include a margin of safety that takes into account any lack of knowledge about the causes of the water quality problem or its loading capacity. A reserve capacity for future loads from growth pressures is sometimes included as well. The sum of the wasteload and load allocations, the margin of safety, and any reserve capacity must be equal to or less than the loading capacity. TMDL = Loading Capacity
= sum of all wasteload allocations + sum of all load allocations + margin of safety
Prior to submitting a final TMDL to EPA for approval, Ecology develops a Summary Implementation Strategy which is a concise, conceptual description of activities planned or underway to implement the TMDL, meet Load and wasteload allocations, and achieve improved water quality. After EPA approves the TMDL, Ecology, in cooperation with local interests, will develop a Detailed Implementation Plan, which describes specific strategies for meeting water quality standards: • What actions • When • Who is responsible • Sources for funding and other needed resources
Total Maximum Daily Load analyses: Loading capacity Identification of the contaminant loading capacity for a waterbody is an important step in developing a TMDL. EPA defines the loading capacity as the greatest amount of loading that a waterbody can receive without violating water quality standards (EPA, 2001). The loading capacity provides a reference for calculating the amount of pollution reduction needed to bring a waterbody into compliance with standards. The portion of the receiving water’s loading capacity assigned to a particular source is a load or wasteload allocation. By definition, a TMDL is the sum of the allocations, which must not exceed the loading capacity.

Lake Whatcom Watershed Total Phosphorus and Bacteria TMDLs: WQ Study Findings Page 23
Surrogate measures Loading of the nutrient phosphorus that causes lower dissolved oxygen levels in Lake Whatcom are calculated in this TMDL in units of kilograms of phosphorus per day. However, it has been shown that the highest concentrations of phosphorus come from the most developed drainages in the Lake Whatcom watershed (Matthews et al., 1996–2007). A very large fraction of the loading capacity is represented by the natural loading of phosphorus. Expressing loading targets in terms of mass/day is of limited value in guiding management activities needed throughout the watershed to solve existing water quality problems. To provide more meaningful/measurable pollutant loading targets, this TMDL may also incorporate measures other than daily loads of phosphorus. EPA regulations [40 CFR 130.2(i)] allow other appropriate measures, or surrogate measures in a TMDL. The Report of the Federal Advisory Committee on the Total Maximum Daily Load (TMDL) Program (EPA, 1998) includes the following guidance on the use of surrogate measures for TMDL development:
When the impairment is tied to a pollutant for which a numeric criterion is not possible, or where the impairment is identified but cannot be attributed to a single traditional “pollutant,” the state should try to identify another (surrogate) environmental indicator that can be used to develop a quantified TMDL, using numeric analytical techniques where they are available, and best professional judgment (BPJ) where they are not.
Potential surrogate measures for use in this TMDL are discussed below. The ultimate need for, and the selection of, a surrogate measure for use in setting allocations will depend on how usefully the proposed surrogate measure matches with the implementation strategy selected.
Lake Whatcom Watershed Total Phosphorus and Bacteria TMDLs: WQ Study Findings Page 24
This page is purposely left blank
Lake Whatcom Watershed Total Phosphorus and Bacteria TMDLs: WQ Study Findings Page 25
Why is Ecology conducting a TMDL study in this watershed?
Overview Ecology is conducting a TMDL study in this watershed because Lake Whatcom was placed on the 303(d) list of impaired waterbodies in 1998. This decision was made because in the basin closest to Bellingham (Basin 1) the rate at which oxygen levels declined in the bottom of the lake in the summer had increased over time. This information indicated that oxygen levels were below natural levels. Silver Beach Creek was also on the 1998 303(d) list of impaired waterbodies for excess fecal coliform bacteria. In 2001 all of the potential TMDLs for Watershed Resource Inventory Area (WRIA) 1 were evaluated to determine which projects should be initiated first. Because Lake Whatcom supports aquatic life, is vulnerable to additional degradation, and is a very important drinking water supply, it was determined that it should be started first. The TMDL for bacteria was included because it would be a minimal additional cost to collect the samples for bacteria at the same time as other samples were collected. The purpose of this TMDL study is to identify the amount of pollution that can enter Lake Whatcom and its tributaries and still meet Washington State water quality standards. Meeting the water quality standard based on oxygen levels in the lake will mean controlling the growth of algae through the control of the limiting nutrient (phosphorus) entering the lake from tributaries and other sources in the watershed. For bacteria, meeting standards will mean reducing bacteria in the tributaries themselves.
Study area The study area for this TMDL consists of Lake Whatcom and its tributary subbasins (Figure 1). The downstream point of the study area is the Electric Avenue Bridge near the lake’s outlet. The diversion from the Middle Fork Nooksack River to Lake Whatcom is also being considered in this study. Lake Whatcom is included in WRIA 1, which includes the Nooksack watershed. This WRIA has been the focus of a watershed planning process since 1998 (www.ecy.wa.gov/apps/watersheds/planning/01.html). For this study, the Historical, Existing, and Future land use covers from the watershed planning process were used in this TMDL. The WRIA 1 Watershed Management Plan was formally adopted in June 2005.

Lake Whatcom Watershed Total Phosphorus and Bacteria TMDLs: WQ Study Findings Page 26
Pollutants addressed by this TMDL This TMDL addresses low dissolved oxygen levels in Lake Whatcom caused by nutrient inputs to the lake, in particular phosphorus. Tributary streams that do not meet standards for fecal coliform bacteria are also being addressed.
Impaired beneficial uses and waterbodies on Ecology’s 303(d) list of impaired waters The main beneficial uses to be protected by this TMDL are salmonid fisheries, primary contact recreation, aesthetics, and drinking water supply. The 303(d) listings being addressed in this study are shown in Table 1. Table 1. Waterbodies and Parameters on the 2004 303(d) List Addressed by This Report.
Waterbody Parameter Listing ID
Grid
Cel
l N
umbe
r
Grid
Cel
l La
titud
e
Grid
Cel
l Lo
ngitu
de
Whatcom Lake Dissolved Oxygen 5846 48122H4G1 48.765 122.415
Whatcom Lake Total Phosphorus 8621 48122H3D3 48.735 122.335
Waterbody Parameter Listing ID
Tow
nshi
p
Ran
ge
Sect
ion
Silver Beach Creek Fecal Coliform 7120 38N 03E 22
A detailed description of the analysis that led to the 303(d) listings for total phosphorus and dissolved oxygen can be found in the project plan (Cusimano et al., 2002). The key issue has been the trend of worsening dissolved oxygen over time (Erickson, 1997; Pelletier, 1998). In particular, anoxic conditions form in the hypolimnion (the deepest parts of the lake) earlier in the year and persist later in the year. Researchers at Western Washington University (WWU) and Ecology have documented the linkage of nutrient inputs, especially phosphorus, with the worsening dissolved oxygen trend (Matthews et al., 2002a). This watershed has other water quality issues that will not be addressed in this TMDL. In particular, additional 303(d) listings for contamination of fish tissue by mercury, dieldrin, and PCBs occur in Lake Whatcom, but are not addressed in this report (Table 2).

Lake Whatcom Watershed Total Phosphorus and Bacteria TMDLs: WQ Study Findings Page 27
Table 2. Additional Lake Whatcom 303(d) Listings Not Addressed by This Report.
Parameter Medium Listing ID
Grid
Cel
l N
umbe
r
Grid
Cel
l La
titud
e
Grid
Cel
l Lo
ngitu
de
Mercury Fish Tissue 15892 48122H4D0 48.765 122.405
Mercury Fish Tissue 15893 48122H3B1 48.715 122.315
Mercury Fish Tissue 15889 48122H4E7 48.745 122.375 Mercury Fish Tissue 15891 48122G3H1 48.675 122.315
Mercury Fish Tissue 15895 48122H4F1 48.755 122.415
Mercury Fish Tissue 15890 48122G2H6 48.675 122.265
Mercury Fish Tissue 15894 48122H3C2 48.725 122.325
Dieldrin Fish Tissue 14024 48122H3D3 48.735 122.335 Total PCBs Fish Tissue 14025 48122H3D3 48.735 122.335
Ecology determined that mercury in Lake Whatcom is not a suitable parameter to address with a TMDL because the sources are primarily from atmospheric deposition and are not readily controlled by a TMDL (Norton, 2004). However this TMDL will help to address mercury concentration in fish tissue. Mercury in fish tissue is an organic form of mercury, methyl mercury. Sediments in low oxygen conditions favor the conversion of mercury from inorganic forms to organic forms. Decreasing the duration and intensity of low oxygen conditions at the sediment boundary will favor mercury deposition in sediments instead of accumulation in fish tissue. There is not enough information at this time to determine if the control of dissolved oxygen is sufficient for Lake Whatcom to meet water quality standards for mercury in fish tissue. Total PCBs in fish tissue in Lake Whatcom are at levels similar to lakes without a direct controllable source of PCBs. For pollutants without a source to be controlled a TMDL is not a suitable tool to ensure meeting water quality standards. The pesticide Dieldrin is not registered for use in the United States. Without a source to be controlled a TMDL is not a useful tool to ensure meeting water quality standards.
Why are we doing this TMDL now? Each year Ecology completes TMDL studies and selects new ones to begin on a priority basis as resources become available. This TMDL project was initiated in 2001 as a high priority to address impairment of the use of the lake as source water for municipal drinking water supply and the support of aquatic life, as well as assessing the lake’s vulnerability to additional degradation.

Lake Whatcom Watershed Total Phosphorus and Bacteria TMDLs: WQ Study Findings Page 28
There are many ways that the lake is vulnerable to additional degradation. The most obvious is from population growth and ongoing development in the watershed. Less obvious is that because of the lake’s long mean water residence time, phosphorus entering the lake may not manifest an immediate water quality impact, but will continue to influence it for several years. The observed acceleration in algae growth and declining dissolved oxygen is associated with the cumulative and increasing amounts of phosphorus entering the lake in recent years. Sampling over many years has consistently shown that the highest concentrations of phosphorus come from the most developed areas (Matthews et al., 1996-2008) Phosphorus leaves the lake through withdrawals of water, outflow to Whatcom Creek, and deposition in sediments. The most serious but least obvious source of vulnerability to additional degradation is that, as the anoxia of the hypolimnion increases in duration and severity, phosphorus lost to the sediments can reenter the water column. Under low oxygen conditions, phosphorus becomes more soluble, and the export of phosphorus from the lake to the sediments is reduced or even reversed, causing the sediments to be a source of phosphorus. The result is a positive feedback loop that may take many years to stabilize. Reductions in loading from runoff may not meet the target dissolved oxygen levels for years because of the internal loading from the sediments. The decline in water quality associated with increases in pollutants as documented by the Institute of Watershed Studies (Matthews et al., 2003-2007), highlights the importance of initiating control measures to begin reversing this trend.

Lake Whatcom Watershed Total Phosphorus and Bacteria TMDLs: WQ Study Findings Page 29
Water Quality Standards and Beneficial Uses Lake Whatcom is a critical water supply source for approximately 86,000 Whatcom County residents, including those in the City of Bellingham and in the Lake Whatcom Water and Sewer District (formerly Water District No. 10). The city uses its water supply for industrial and commercial uses. The number of direct withdrawals by single family residences is not known but is estimated to be between 150 and 400 (Buroker, 2007). Lake Whatcom provides habitat to both warm-water and cold-water fish. The lake provides the brood stock for the Brannian Creek Hatchery, which is the state’s source of kokanee for fish planting throughout the state. The bass fishing tournaments in Lake Whatcom attract many fishers from throughout the state. The lake also provides source water for the Washington Department of Fish and Wildlife’s Whatcom Falls Fish Hatchery, which raises cutthroat and rainbow trout for stocking lakes and ponds throughout northwest Washington. Lake Whatcom also provides flow for water quality purposes in Whatcom Creek during low-flow periods. Lake Whatcom is a regional recreation destination for swimming and boating. Many homes have docks with water craft which residents use throughout the year.
Dissolved oxygen Aquatic organisms are very sensitive to reductions in the level of dissolved oxygen in the water. The health of fish and other aquatic species depends on maintaining an adequate supply of oxygen dissolved in the water. Growth rates, swimming ability, susceptibility to disease, and the relative ability to endure other environmental stressors and pollutants are all affected by dissolved oxygen levels. While direct mortality due to inadequate dissolved oxygen can occur, the state’s criteria are designed to maintain conditions that support healthy populations of fish and other aquatic life. Oxygen levels can fluctuate over the day and night in response to changes in climatic conditions as well as the respiratory requirements of aquatic plants and algae. In a lake, oxygen levels can also vary seasonally as the deeper, cooler layer of the lake (the hypolimnion) is isolated from sources of oxygen in warmer surface waters (the epilimnion) in the warm months, and respiration of aquatic life in the hypolimnion consumes the supply of oxygen. Typically the hypolimnion develops in the spring, maintains its maximum thickness during the summer, and erodes from the top downward in the fall, until the lake is again fully mixed in the winter. Of particular interest in this TMDL is the connection between nutrients and the decline of oxygen in the hypolimnion. Phosphorus is the limiting nutrient for most of the lake and most of the year (Matthews et al., 2002a). Excess phosphorus promotes additional algae growth. Algae settling into the hypolimnion and decaying increases the consumption of oxygen in the

Lake Whatcom Watershed Total Phosphorus and Bacteria TMDLs: WQ Study Findings Page 30
hypolimnion. The monitoring that led to the 303(d) listing showed that the rate of oxygen loss was increasing, leading to low oxygen levels in the hypolimnion developing more quickly and earlier in the year. Since the health of aquatic species is tied predominantly to the pattern of daily minimum dissolved oxygen concentrations, the criteria are typically expressed as the lowest 1-day minimum dissolved oxygen concentration that occurs in a waterbody. However stratified lakes need to be treated differently because, seasonally, dissolved oxygen reaches very low levels under natural conditions that would not support any of the numeric criteria. In the Washington State water quality standards, freshwater aquatic life use categories are described using key species (salmonid versus warm-water species) and life-stage conditions (spawning versus rearing). Minimum concentrations of dissolved oxygen are used as criteria to protect different categories of aquatic communities [WAC 173-201A-200; 2003 edition]. Lakes have specific standards for protecting dissolved oxygen conditions. For all lakes, and for reservoirs with a mean annual retention time of greater than 15 days, human actions considered cumulatively may not decrease the 1-day minimum oxygen concentration more than 0.2 mg/L below estimated natural conditions. Stratified lakes may be very sensitive to small changes that affect the thermal differences between the bottom of a lake and the top. The thermal differences create stratified layers where water quality may vary widely over the water column. This dynamic quality of the lake and the method of modeling the lake create challenges for applying the standards to model results. In the lake model (described later in this report), lake dissolved oxygen concentrations are available for each model cell at a specified time interval. To balance temporal resolution with output file size, three-hour intervals were chosen. The daily minimum is estimated using the lowest of the eight daily values. Over most of the model, except the deepest areas of Basin 3, the model cells are one-meter thick. The model resolution is such that small vertical differences are easily seen. Therefore, comparing different scenarios on a cell-by-cell or day-by-day basis may show differences that are indicative of physical changes but not of impairment of aquatic uses. An alternative approach is to aggregate data on dissolved oxygen levels from the model output over a volume of the lake representing critical segments and over a season representing a critical time period. In other words, for a critical period of time, the results of a model run are compared to an estimate of natural dissolved oxygen levels by examining the cumulative aggregation of oxygen levels by volume. In practice this is done by identifying the spatial and temporal extents of interest and adding up the total volume of the lake in the model cells that have less than a particular dissolved oxygen level. The cumulative volume at each dissolved oxygen level in one scenario is compared to the dissolved oxygen level for the same cumulative volume from a scenario that estimates the natural dissolved oxygen levels. If for a given aggregated volume of water, the oxygen level in the test

Lake Whatcom Watershed Total Phosphorus and Bacteria TMDLs: WQ Study Findings Page 31
scenario water is below the oxygen level of the same volume of natural water by more than 0.2 mg/L, then the criterion is not met. For example, if a test case has a million cubic meters of water with less than 2.0 mg/L, and under the natural scenario an aggregation of a million cubic meters of water has 2.2 mg/L at the 2.0 mg/L oxygen level, the criterion is met. A step-by-step example of the procedure used is provided in the section Application of standards to model results later in this report.
Bacteria Bacteria criteria are set to protect people who work and play in and on the water from waterborne illnesses. In the Washington State water quality standards, fecal coliform is used as an indicator bacteria for the state’s freshwaters (e.g., lakes and streams), because it indicates the presence of waste from humans and other warm-blooded animals. Waste from warm-blooded animals is more likely to contain pathogens that will cause illness in humans than waste from cold-blooded animals. The fecal coliform criteria are set at levels that have been shown to maintain low rates of serious intestinal illness (gastroenteritis) in people. The Extraordinary Primary Contact use is intended for waters capable of “providing extraordinary protection against waterborne disease or that serve as tributaries to extraordinary quality shellfish harvesting areas.” To protect this use category: “Fecal coliform organism levels must not exceed a geometric mean value of 50 colonies/100 mL, with not more than 10 percent of all samples (or any single sample when less than ten sample points exist) obtained for calculating the geometric mean value exceeding 100 colonies/100 mL” [WAC 173-201A-200(2)(b), 2003 edition]. Because of the variability of bacteria levels, compliance is based on meeting both the geometric mean criterion and the 10% of samples (or single sample if less than ten total samples) limit. These two measures used in combination ensure that bacterial pollution in a waterbody will be maintained at levels that will not cause a greater risk to human health than intended. The water quality standards state:
When averaging bacteria sample data for comparison to the geometric mean criteria, it is preferable to average by season and include five or more data collection events within each period. Averaging of data collected beyond a thirty-day period, or beyond a specific discharge event under investigation, is not permitted when such averaging would skew the data set so as to mask noncompliance periods.
The criteria for fecal coliform are based on allowing minimal risk of illness to humans that work or play in a waterbody. The criteria used in the state standards are designed to allow seven or fewer illnesses out of every 1,000 people swimming or bathing in the water. If the concentration of fecal coliform in the water rises above the numeric criterion, human sources need to be controlled to bring concentrations back into compliance with the standard.

Lake Whatcom Watershed Total Phosphorus and Bacteria TMDLs: WQ Study Findings Page 32
The specific level of illness rates caused by bacteria from animal waste (versus human waste) cannot be calculated. However, warm-blooded animals are a common source of serious waterborne illness for humans, especially animals managed by humans and thus exposed to human-derived pathogens.
Aesthetic values and phosphorus Aesthetic narrative criteria are defined in WAC 173-201A-160(2)(b) and apply to all existing and designated uses for fresh water. The standards state that: Aesthetic values must not be impaired by the presence of materials or their effects, excluding those of natural origin, which offend the senses of sight, smell, touch, or taste. (See WAC 173-201A-230 for guidance on establishing lake nutrient standards to protect aesthetics.) Although this TMDL is addressing a 303(d) listing for total phosphorus, there are no numeric criteria for phosphorus. The listing is based on the narrative criterion:
• Studies have identified Lake Whatcom as phosphorus-limited except for a small period of time in late fall in Basin 1 (Matthews et al., 2002a).
As identified above under the discussion on dissolved oxygen, phosphorus has an effect on dissolved oxygen by stimulating algal growth. Excess algae not only contributes to dissolved oxygen depletion but can affect aesthetic values. The phosphorus reductions necessary to meet dissolved oxygen criteria will control the algae that cause the aesthetic impairment. Therefore this TMDL will use dissolved oxygen as the criterion to determine loading limits for total phosphorus, which will be linked back to land-use practices and nutrient deposition and transport processes. The levels of total phosphorus necessary to meet the numeric dissolved oxygen criterion will be more than adequate to meet the narrative criterion.
Lake Whatcom Watershed Total Phosphorus and Bacteria TMDLs: WQ Study Findings Page 33
Watershed Description
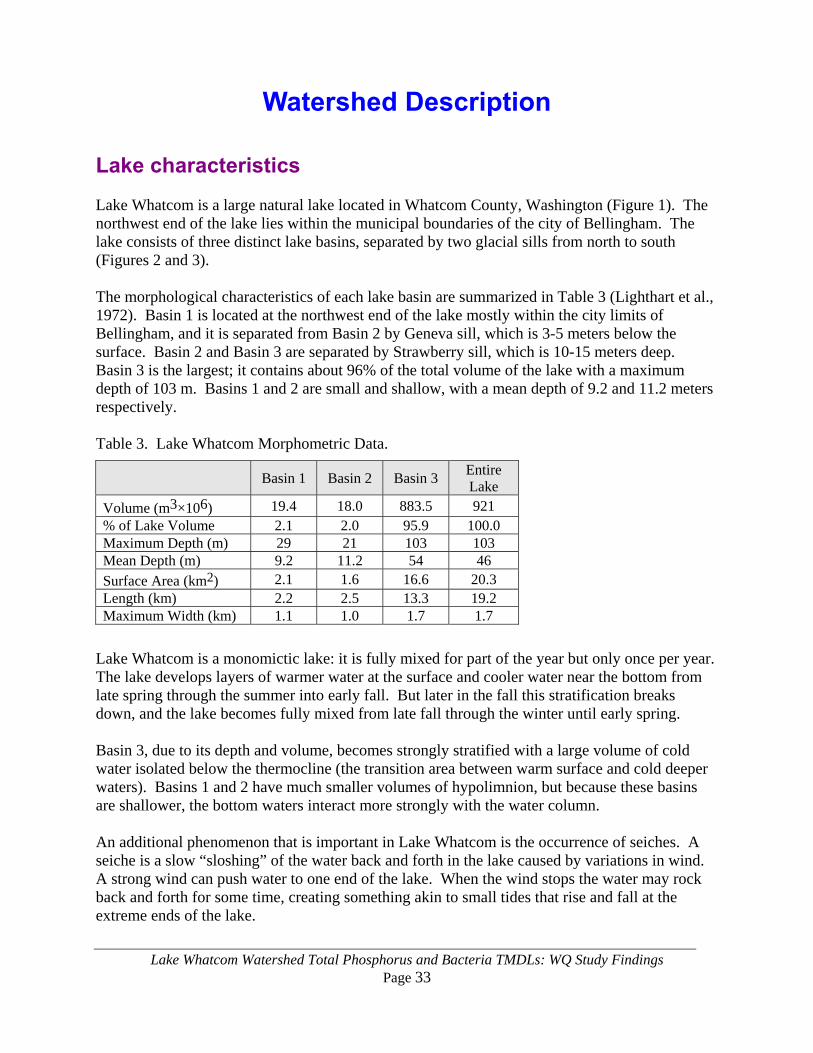
Lake characteristics Lake Whatcom is a large natural lake located in Whatcom County, Washington (Figure 1). The northwest end of the lake lies within the municipal boundaries of the city of Bellingham. The lake consists of three distinct lake basins, separated by two glacial sills from north to south (Figures 2 and 3). The morphological characteristics of each lake basin are summarized in Table 3 (Lighthart et al., 1972). Basin 1 is located at the northwest end of the lake mostly within the city limits of Bellingham, and it is separated from Basin 2 by Geneva sill, which is 3-5 meters below the surface. Basin 2 and Basin 3 are separated by Strawberry sill, which is 10-15 meters deep. Basin 3 is the largest; it contains about 96% of the total volume of the lake with a maximum depth of 103 m. Basins 1 and 2 are small and shallow, with a mean depth of 9.2 and 11.2 meters respectively. Table 3. Lake Whatcom Morphometric Data.
Basin 1 Basin 2 Basin 3 Entire Lake
Volume (m3×106) 19.4 18.0 883.5 921 % of Lake Volume 2.1 2.0 95.9 100.0 Maximum Depth (m) 29 21 103 103 Mean Depth (m) 9.2 11.2 54 46 Surface Area (km2) 2.1 1.6 16.6 20.3 Length (km) 2.2 2.5 13.3 19.2 Maximum Width (km) 1.1 1.0 1.7 1.7
Lake Whatcom is a monomictic lake: it is fully mixed for part of the year but only once per year. The lake develops layers of warmer water at the surface and cooler water near the bottom from late spring through the summer into early fall. But later in the fall this stratification breaks down, and the lake becomes fully mixed from late fall through the winter until early spring. Basin 3, due to its depth and volume, becomes strongly stratified with a large volume of cold water isolated below the thermocline (the transition area between warm surface and cold deeper waters). Basins 1 and 2 have much smaller volumes of hypolimnion, but because these basins are shallower, the bottom waters interact more strongly with the water column. An additional phenomenon that is important in Lake Whatcom is the occurrence of seiches. A seiche is a slow “sloshing” of the water back and forth in the lake caused by variations in wind. A strong wind can push water to one end of the lake. When the wind stops the water may rock back and forth for some time, creating something akin to small tides that rise and fall at the extreme ends of the lake.
Lake Whatcom Watershed Total Phosphorus and Bacteria TMDLs: WQ Study Findings Page 34
The effect of a seiche in Lake Whatcom is to cause rhythmic rising and falling of the surface and thermocline, which in turn can at times allow cold water from the hypolimnion in Basin 3 to slop over the Strawberry sill into Basin 2. As described below, this can have a strong influence on temperatures and oxygen dynamics in Basins 1 and 2. A critical effect of the stratification of Lake Whatcom is the isolation of cold water in the hypolimnion. This water receives very little oxygen from the air, because diffusion through the thermocline is very slow, allowing oxidation in the sediments to use any oxygen dissolved in the water. As a result, hypolimnetic waters are often very low in oxygen or completely anoxic. Phosphorus in the lake interacts with anoxic hypolimnetic waters in two important ways:
• Phosphorus entering the water column from the watershed increases algal growth in surface waters. Then when algae settle to the bottom of the lake, their decay uses oxygen which in turn increases the volume of anoxic water and duration of anoxic conditions.
• Anoxic conditions in the hypolimnion can produce reducing conditions in the sediment, which then causes phosphorus to release into the water column. This phosphorus source, sometimes called “internal loading,” can add to algae growth. This cycling of phosphorus from the water column to the sediments and back to the water column can result in the creation of a “bank” of phosphorus in the sediment. This bank can continue to add phosphorus to the lake for years or even decades after surface sources are reduced.
Watershed characteristics The watershed topography surrounding Lake Whatcom is dominated by rugged, mountainous terrain adjacent to Basin 3, and low-relief foothills adjacent to Basins 1 and 2. Valleys in the south end of the lake (from Anderson Creek to South Bay) and north of Agate Bay (Carpenter and Olsen Creeks) are filled with unconsolidated glacial sediments. The rest of the watershed is covered by shallow soils over bedrock, with Darrington Phyllite metamorphic bedrock in the southeast end and Chuckanut formation sedimentary bedrock surrounding the rest of the lake. For a map of these formations and a more detailed description of the watershed’s geology see Pitz (2005). As part of developing the WRIA 1 Watershed Management Plan, the 22 sub-drainages of the lake’s watershed shown in Figure 1 were delineated. The Plan includes an assessment of existing conditions, and through a contract with Utah State University, the development of computer models for surface and groundwater quantity and quality, a model for assessing instream flow needs, and an integrated Decision Support System. The Plan also provides recommendations for implementation actions, including an Instream Flow Selection and Adoption action process, and recommendations for improved water management, conservation, and reuse. All of the major tributaries and many of the intermittent tributaries in the watershed flow into Basin 3, which receives 87% of the drainage from the watershed. The remaining watershed areas are drained by intermittently flowing streams, surface runoff directly into the lake, or
Lake Whatcom Watershed Total Phosphorus and Bacteria TMDLs: WQ Study Findings Page 35
man-made drainage systems (Delahunt, 1990). The seven perennial tributaries flowing into Lake Whatcom are Anderson, Smith, Olsen, Carpenter, Austin, Brannian, and Fir Creeks. The principal source of groundwater inflows are the unconsolidated sediments in the valleys, with a minor fraction entering from bedrock areas (Pitz, 2005). The City of Bellingham diverts water from the Middle Fork of the Nooksack River to Lake Whatcom via Mirror Lake and Anderson Creek at the south end of Basin 3 (Figure 1). The diversion operates during the fall and winter when the lake is below 312 feet above mean sea level, and continuously during the spring and summer when sufficient water is available in the Middle Fork. During the summer, it is often the major water source for the lake. Recently, the city has voluntarily decreased its diversion during low-flow periods to help maintain instream flows in the Middle Fork of the Nooksack River and protect salmon. Instream flows are being re-examined by the city, tribes, and other parties as agreed to in the WRIA 1 Watershed Management Plan. Future operation and management of the diversion is a core element of these negotiations. The natural outlet of Lake Whatcom, Whatcom Creek, is located at the northwest end of Basin 1 and drains to Bellingham Bay. The City of Bellingham regulates outlet flow and lake level by a manually controlled dam, which the city constructed in 1938 (URS, 1985). The city operates the dam to provide additional water storage and prevent flooding. Flow into Whatcom Creek can be reduced if water supply is low. The natural flow to Whatcom Creek is controlled by a natural sill at 308.8 feet (COB, 2007). The Washington Department of Fish and Wildlife withdraws water for the Whatcom Falls Hatchery from the lake in Basin 1. The City of Bellingham’s intake is about 12 meters deep and is located about 366 meters offshore in Basin 2. The Lake Whatcom Water and Sewer District intake is located in a protected cove of Basin 3 at a depth of 21 meters. Land uses in Lake Whatcom are predominantly urban, rural residential, and forestry (Figure 4). Only a very small fraction of the watershed is used for agriculture, mostly for grazing. The general trend is that the northwest end of the lake is most urban, the southeast end and northeast shore are the least developed, and the southwest shore is a mixture for forest and pockets of residential development. The dominant land-use dynamic of the watershed is growth in the city of Bellingham and development of the unincorporated areas into residential use. The existing population within the watershed is about 13,000 based on the 2000 census. Current zoning will allow an increase of up to about 28,000 residents within the watershed (Hisch Consulting Services, 1998).
Pollutant sources Key watershed processes important to this TMDL study are the deposition, release, and transport of phosphorus in the watershed. Some processes that can be hypothesized for this watershed from past studies, field observations, and research in other watersheds include:
Lake Whatcom Watershed Total Phosphorus and Bacteria TMDLs: WQ Study Findings Page 36
• Deposition of phosphorus in domestic livestock and pet manure, both on the land and directly into storm conveyances and streams.
• Use of phosphorus-based fertilizers on lawns, gardens, landscaping, and commercial agriculture and silviculture.
• Release of phosphorus from on-site sewage disposal (septic systems) both from surfacing wastewater and from percolation of wastewater into shallow interflow or deep groundwater soil layers. Phosphorus in wastewater can enter wastewater both from human body waste and from phosphorus detergents and other household products.
• Transport of phosphorus adsorbed to soil particles by erosion. Erosion can occur from the heavy rainfall on the land surface, especially from dirt roads, construction sites, and other areas cleared of vegetation, and from streambank erosion. Sediment in stormwater conveyances and streams can also be deposited and resuspended by variation in flow.
• Aerial deposition on a regional scale of phosphorus adsorbed to dust particles. Phosphorus can be transported from the land surface by direct wash-off of phosphorus-bearing materials or percolation into the soil. Once in the soil, phosphorus can be adsorbed onto soil particles or enter shallow interflow or deeper groundwater in dissolved form. Soil particles can be eroded into a stream, and interflow and groundwater may also carry its phosphorus load to a stream. All these processes can also occur directly into the lake from the lake shore. In a forest, significant quantities of water are retained in the canopy. When the rainfall reaches the forest floor, the organic matter in the top layers of soil can store up to a foot of rainfall. This storage of rainfall during a storm allows water to continue to infiltrate into the soil columns even after the storm has passed. Because those storage functions are lost when the forest is removed and because the soil covered by impervious surface is no longer available for infiltration, we see dramatic changes as the land is developed. It has long been noted that the highest concentrations of phosphorus come from the most developed drainages in the Lake Whatcom watershed (Matthews et al., 1996 – 2007). For that reason, this TMDL focuses on controlling the phosphorus from the developed areas. One direct source of phosphorus to the lake that has been suggested is gas-power boats. Any impact on the lake from boats would be through exhaust gasses. The lake is not currently listed for primary gasoline constituents or combustion by-products. Phosphorus in unleaded gasoline is limited to 0.005 grams per gallon or approximately 0.002 g/kg, making it a very minor contributor. Because both Whatcom County and the City of Bellingham have prohibited two-stroke engines using carburetors, and because of the short duration of boating season on Lake Whatcom, it is believed the contribution of phosphorus from boating activity is not significant. Processes that affect phosphorus and bacteria are similar. Fecal coliform bacteria is deposited to the land surface or directly to water from many of the same sources, including livestock, pets, and septic systems.
Lake Whatcom Watershed Total Phosphorus and Bacteria TMDLs: WQ Study Findings Page 37
High stream bacteria levels during low-flow conditions generally indicate a direct source, since stormwater flow is absent and dilution is low. Most commonly this occurs from as point source of wastewater or from direct animal access, but can also be caused by dumping of manure (such as litter boxes). Studies have also shown that dry weather baseflow from stormwater conveyances can also have high bacteria levels, possibly from urban wildlife or runoff of lawn watering. High bacteria levels during high-flow periods generally reflect the washoff of manure or septic system effluent. The typical pattern is to see the highest bacteria levels at the beginning of a storm after a dry spell, or in late fall after the frequency of storms increase and the ground becomes saturated. By late winter, materials may have already washed off, active deposition is low, and the volume of rainfall is creating dilution, resulting in relatively low levels of bacteria. Some research has shown regrowth of bacteria in nutrient-enriched sediments. This is most commonly found in wetlands or in areas where manure or food waste has been deposited. The TMDL study results discussed below will provide information on the effect of these processes on both tributary and lake phosphorus and bacteria levels. Detailed understanding of processes for certain sources and land uses will take additional research over time.

Lake Whatcom Watershed Total Phosphorus and Bacteria TMDLs: WQ Study Findings Page 38
This page is purposely left blank

Lake Whatcom Watershed Total Phosphorus and Bacteria TMDLs: WQ Study Findings Page 39
Goals and Objectives
Project goals The major goal of this project is to quantify the impacts of pollutants that affect dissolved oxygen concentrations in Lake Whatcom, and make recommendations for limits of these pollutants with respect to the assimilative capacity of the lake. Another goal is to quantify the concentrations of bacteria in some of the tributaries to Lake Whatcom and make recommendations for limits that will meet the water quality criteria.
Study objectives The original objectives of this project were described in the Quality Assurance Project Plan (Cusimano et al., 2002). These objectives will be met in two phases: a technical study report (Volume 1, this report); and a TMDL submittal report (Volume 2, to be developed after publication of this report). The specific objectives addressed in this report are:
• Develop a two-dimensional hydrodynamic and water quality model (CE-QUAL-W2 model) of Lake Whatcom to determine the capacity of the lake to assimilate sources of oxygen-consuming substances (i.e., pollutants that directly or indirectly exert an oxygen demand).
• Gather existing data, and conduct water quantity and water quality sampling surveys that can be used to calibrate the CE-QUAL-W2 model.
• Use the CE-QUAL-W2 model to determine the potential of phosphorus sources to violate the dissolved oxygen criterion.
• Collect bacteria data and quantify the distribution of bacteria concentrations in tributaries to Lake Whatcom.
After publication, this report will guide the development of a summary Implementation Plan, which in turn will help determine TMDL allocations, both of which will be included in the TMDL submittal report. The specific objectives to be addressed in the TMDL submittal report are:
• Determine wasteload allocations for point sources and load allocations for nonpoint sources of oxygen-consuming substances (direct and indirect) that will meet dissolved oxygen criteria.
• Determine bacteria load allocations for Lake Whatcom tributaries that will meet the Washington State water quality criteria.

Lake Whatcom Watershed Total Phosphorus and Bacteria TMDLs: WQ Study Findings Page 40
This page is purposely left blank
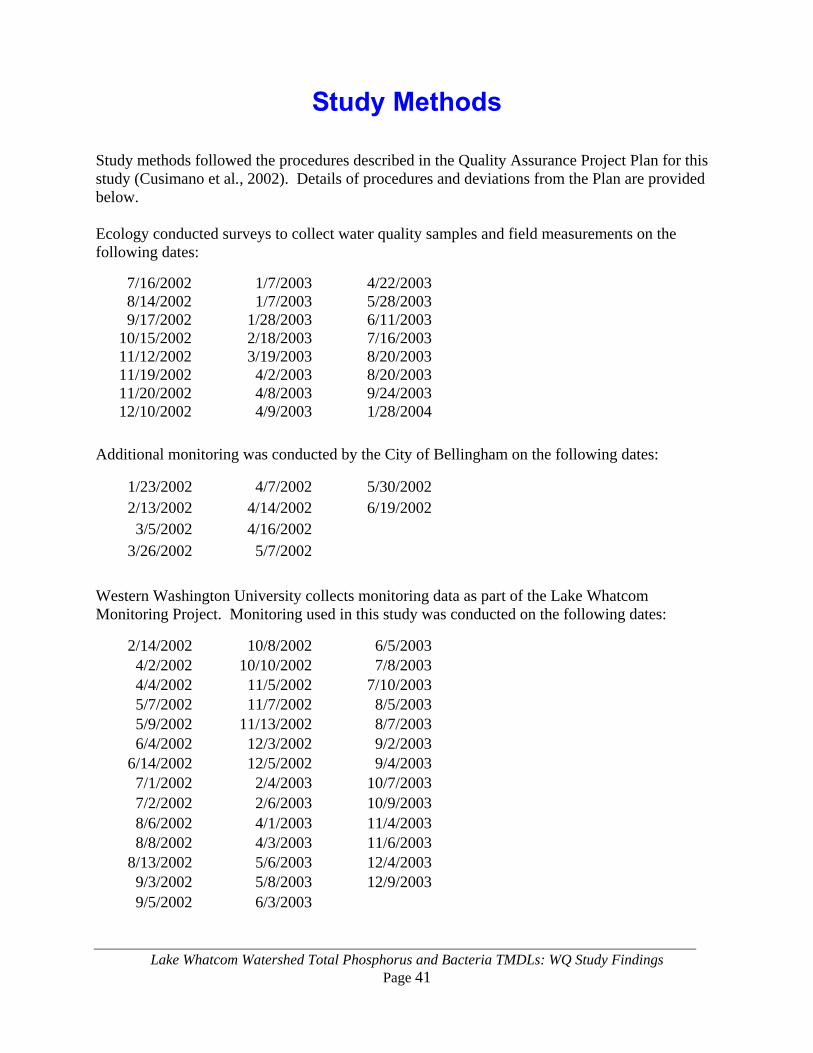
Lake Whatcom Watershed Total Phosphorus and Bacteria TMDLs: WQ Study Findings Page 41
Study Methods Study methods followed the procedures described in the Quality Assurance Project Plan for this study (Cusimano et al., 2002). Details of procedures and deviations from the Plan are provided below. Ecology conducted surveys to collect water quality samples and field measurements on the following dates:
7/16/2002 1/7/2003 4/22/20038/14/2002 1/7/2003 5/28/20039/17/2002 1/28/2003 6/11/2003
10/15/2002 2/18/2003 7/16/200311/12/2002 3/19/2003 8/20/200311/19/2002 4/2/2003 8/20/200311/20/2002 4/8/2003 9/24/200312/10/2002 4/9/2003 1/28/2004
Additional monitoring was conducted by the City of Bellingham on the following dates:
1/23/2002 4/7/2002 5/30/20022/13/2002 4/14/2002 6/19/20023/5/2002 4/16/2002
3/26/2002 5/7/2002 Western Washington University collects monitoring data as part of the Lake Whatcom Monitoring Project. Monitoring used in this study was conducted on the following dates:
2/14/2002 10/8/2002 6/5/20034/2/2002 10/10/2002 7/8/20034/4/2002 11/5/2002 7/10/20035/7/2002 11/7/2002 8/5/20035/9/2002 11/13/2002 8/7/20036/4/2002 12/3/2002 9/2/2003
6/14/2002 12/5/2002 9/4/20037/1/2002 2/4/2003 10/7/20037/2/2002 2/6/2003 10/9/20038/6/2002 4/1/2003 11/4/20038/8/2002 4/3/2003 11/6/2003
8/13/2002 5/6/2003 12/4/20039/3/2002 5/8/2003 12/9/20039/5/2002 6/3/2003

Lake Whatcom Watershed Total Phosphorus and Bacteria TMDLs: WQ Study Findings Page 42
Lists of all the parameters analyzed in the laboratory or measured in the field can be found in Appendix B. During synoptic surveys, nine tributary sites were monitored, as well as 23 lake stations (4 mid-lake locations at multiple depths) and one station at the lake outlet. A nearshore location was monitored for nutrients during one survey, and two catch basins were monitored for bacteria during several surveys. Monitoring locations are shown in Figures 2 and 3. The original goal of sampling six tributaries during three storm events was only partially met. Only two storm events were monitored: November 19-20, 2002 and April 8-9, 2003; two tributaries were monitored in November and two were monitored in April. Times for the storm- event samples are only available for the April event, providing only one opportunity for a pollutant time series and a flow-weighted average of nutrients during a storm event. Hydrolab® multiparameter meters were used to measure dissolved oxygen, pH, conductivity, and temperature in the tributaries and for lake profile and diurnal measurements. Lake profiles were measured during eight surveys in the four mid-lake stations and over the two sills between basins. Diurnal monitoring occurred in Basin 1 at 30-minute intervals during six surveys (2-3 days duration), including two different depths during four of the surveys. Dissolved oxygen was also measured with the Winkler method as part of quality assurance procedures for the Hydrolab® meters.

Lake Whatcom Watershed Total Phosphorus and Bacteria TMDLs: WQ Study Findings Page 43
Study Quality Assurance Evaluation A detailed analysis of data quality methods and results are provided in Appendix B. A summary of the conclusions from this analysis follows. • Data quality for laboratory parameters is acceptable. Laboratory qualifications must be taken
into account when using the data. In addition, field duplicates indicate that total suspended solids, total non-volatile suspended solids, and fecal coliform bacteria have more variability than originally targeted. This variability should be taken into account when the data are used.
• Differences for three out of eight paired dissolved oxygen measurements using the Winkler method slightly exceeded the target of ±0.2 mg/L, but the pooled standard deviation for the paired differences met the target. These results are typical of the method, and Winkler measurements are of acceptable quality.
• Hydrolab® dissolved oxygen measurements often fell outside data quality targets. Some profile measurements were corrected with Winkler data and may have accuracy that approaches the Winkler reading. Overall variability is high, but not unusual for lake profile monitoring. The magnitudes of the observed differences between paired values are not unexpected, since dissolved oxygen conditions in the lake can be highly variable temporally and spatially and small changes in the times and locations of the measurements can result in significantly different measurement values. The dissolved oxygen data are considered acceptable for use as qualified data, for which the high observed variability must be taken into account.
• Data collected by the City of Bellingham, Western Washington University, GeoEngineers
Inc., and the National Atmospheric Deposition Program meet data quality standards and are acceptable for use in this study.
Lake Whatcom Watershed Total Phosphorus and Bacteria TMDLs: WQ Study Findings Page 44
Results and Discussion Results of monitoring conducted in this study are provided in Appendix C. Results are also available through Ecology’s Environmental Information Management (EIM) system (http://apps.ecy.wa.gov/eimreporting/Detail.asp?Type=Study&ID=4261891). EIM also provides the specific monitoring locations. Lake Whatcom profiles from Hydrolab® monitoring are shown in Figures 5 through 10. Most interesting are the classic lake stratified temperature profiles in all basins, which are tracked over time by anoxia in the hypolimnion of Basins 1 and 2. Basin 3, however, shows well-oxygenated water over the profile despite the existence of the strong temperature gradient, which reflects the much greater volume and depth of Basin 3. The strong dissolved oxygen gradients and anoxia of Basin 1 represent the critical conditions of this study. Diurnal measurements in Basin 1 are shown in Figures 11 through 14. The dominant patterns of these time series are the stronger diurnal signal for measurements at the surface, and the higher dissolved oxygen at the five-to-ten meter depth where there is greater phytoplankton activity and less interaction with the atmosphere. Figures 15 through 20 show the variation in populations of different phytoplankton over the course of the two study years (2002-03) in the three basins. These graphs illustrate how species composition varies seasonally. Phytoplankton identification summaries are provided in Appendix D. These results will be discussed in further detail in the following section.

Lake Whatcom Watershed Total Phosphorus and Bacteria TMDLs: WQ Study Findings Page 45
TMDL Analyses
Dissolved oxygen and total phosphorus Analytical framework As called for in the Project Plan, the tool for linking nutrient inputs to Lake Whatcom dissolved oxygen impairment is the lake response model CE-QUAL-W2. As described by the Portland State University (PSU) website - www.ce.pdx.edu/w2/:
CE-QUAL-W2 is a water quality and hydrodynamic model in 2D (longitudinal-vertical) for rivers, estuaries, lakes, reservoirs and river basin systems. W2 models basic eutrophication processes such as temperature-nutrient-algae-dissolved oxygen-organic matter and sediment relationships. The current model release enhancements have been developed under research contracts between the Corps [U.S. Army Corps of Engineers] and Portland State University under supervision of Dr. Scott Wells. The lake model was calibrated to the two calendar years of 2002-2003. However, because of the relatively long time that water resides in Lake Whatcom (15 years or more), the results of a two- year evaluation are highly dependent on initial conditions, and adjustments in loading require simulating longer periods of time to more closely approach equilibrium. Simulating additional calibration years is always desirable in terms of helping build confidence in the model as a tool. The CE-QUAL-W2 model does a reasonable job of predicting lake conditions for two calibration years. Each additional calibration year may marginally increase the effectiveness of the model, but to significantly improve the model, many additional years would need to be calibrated. The expected benefit from simulating additional years must then be balanced with available funds for the effort. Ideally, the model would be calibrated for a large number of years (equal to or greater than the residence time of the lake), but for this study, there were not enough time and resources available. Therefore, an approach was employed in which model output conditions from the end of a one- or two-year simulation were used as the initial input conditions for rerunning another 1- or 2-year simulation of the model. This looping can be repeated multiple times, and provides a means to extrapolate the two-year model to estimate the effects of a longer timeframe. This approach diminishes the importance of the initial conditions and increases the relevance of the simulated loads. The initial calibrated model began in February near the date when profile measurements were taken. To allow looping, the model was revised to begin on January 1 so that loops could begin and end on the calendar year.

Lake Whatcom Watershed Total Phosphorus and Bacteria TMDLs: WQ Study Findings Page 46
The Project Plan envisioned two possible paths for determining watershed loads for use in the CE-QUAL-W2 lake model. The preferred path was a model developed by Utah State University as part of the WRIA 1 Watershed Management Project. However, the development of this model was delayed and is not yet available for use. The alternative was to estimate watershed loadings with a multivariate regression approach. This approach has been applied in previous Ecology studies (e.g., Albertson et al., 2002) based on the approach of Cohn et al. (1992). It provides empirical estimates of the parameter based on the dependent variables of time of year and streamflow. The method provides reasonable estimates of interpolated values without the calibration of an additional physically-based model. The regressions follow the form:
log(c) = bo + b1 log(Q/A) + b2[ log (Q/A) ]2
+ b3sin(2πfy) + b4cos(2πfy) + b5sin(4πfy) + b6cos(4πfy), where:
c = the concentration of the constituent of interest Q/A = the flow divided by the watershed area
fy = the year fraction (between 0.0 [Jan 1, 00:00] and 1.0 [Dec 31, 23:59]) bn = coefficients (n = 0 to 6) determined by best fit to observed data Inputs to the lake model were developed for 22 subbasins based on WRIA watershed delineation. Model input time series of nutrients, total organic carbon, conductivity, and alkalinity were developed for nine index subbasins using the regression approach. The other 13 subbasins were paired with index subbasins. This method was also applied to the Middle Fork Nooksack River to predict water quality for diversion inputs. Appendix G presents the output from the Systat® statistical program with the regression parameters for model inputs. However, the regression model for tributary inflows has limitations, and local partners involved in TMDL development expressed a desire for a more quantitative linkage between land uses, pollutant control practices, and tributary nutrient concentrations. The regression does not provide this linkage. Therefore, regressions were used for model inputs other than phosphorus, which have little effect on model results. Another approach was used for phosphorus. Funding from EPA was available to develop a more sophisticated watershed model for flow and total phosphorus. EPA sent out a Request For Proposals, and Cadmus Group (with subcontractor CDM) was selected to work on the project. In consultation with the City of Bellingham, Whatcom County, and Ecology, they examined the data available to calibrate models and selected HSPF. A significant factor in the selection was that the City had contracted with Hydrologic Services to calibrate a related model, HFAM, for the water quantity predictions. U.S. Geological Survey (USGS) describes HSPF as follows (http://water.usgs.gov/cgi-bin/man_wrdapp?hspf):
HSPF simulates for extended periods of time the hydrologic, and associated water quality, processes on pervious and impervious land surfaces and in streams and well-mixed impoundments. HSPF uses continuous rainfall and other meteorologic records to compute
Lake Whatcom Watershed Total Phosphorus and Bacteria TMDLs: WQ Study Findings Page 47
streamflow hydrographs and pollutographs…HSPF is generally used to assess the effects of land-use change, reservoir operations, point or nonpoint source treatment alternatives, flow diversions, etc. The model was developed in the early 1960's as the Stanford Watershed Model. In the 1970's, water-quality processes were added. Development of a FORTRAN version incorporating several related models using software engineering design and development concepts was funded by the Athens, Ga., Research Lab of EPA in the late 1970's. In the 1980's, preprocessing and postprocessing software, algorithm enhancements, and use of the USGS WDM system were developed jointly by the USGS and EPA.
The overall approach to the TMDL analysis is as follows (see Table 4 for a summary of model scenarios):
• Calibrate the HSPF watershed model to observed flows and phosphorus loads.
• Calibrate the lake model using flows and phosphorus from the watershed model. The calibration run, simulating conditions for calendar years 2002 and 2003, is also called the Base scenario.
• Use the watershed model to develop a pre-development scenario (termed Full Rollback or FRB) and a full development scenario (Full Buildout or FBO).
• Run the Base, Full Buildout, and Full Rollback scenarios with multiple loops until stable solutions are reached.
• Compliance with dissolved oxygen criteria is determined by comparing the difference in the lake dissolved oxygen results for the Full Rollback scenario and the other scenarios to the 0.2 mg/L criterion.
• Determine the lake’s loading capacity by reducing development levels from the Base and Full Buildout scenarios until dissolved oxygen standards are met (Partial Rollback from Base and Partial Rollback from Full Buildout). This was done by converting a ratio of all land covers, other than forest and wetland covers, to mixed forest.
• Determine targets for phosphorus loading and developed acres for each subbasin that correspond to the Partial Rollback loading capacity scenarios.
• Load and wasteload allocations and a Summary Implementation Strategy will be presented in the final TMDL report (Volume 2) after consultation with local partners and other public input.
A sensitivity analysis is a tool where model inputs and parameters are adjusted one-by-one to evaluate the relative response of the model to those inputs and parameters. A full sensitivity analysis can be resource-intensive, especially for models as complex as HSPF and CE-QUAL-W2. For that reason, comprehensive sensitivity analyses have not yet been conducted for these models. However, if resources become available in the future, sensitivity analysis could be a useful tool to better understand the models and the watershed and lake processes contributing to lake dissolved oxygen dynamics.

Lake Whatcom Watershed Total Phosphorus and Bacteria TMDLs: WQ Study Findings Page 48
Table 4. Lake Whatcom Model Scenarios.
ID Name Concentrations Hydrology Purpose
BAS Base Calibration (Jan 2002-Dec 2003)
Calibration (Jan 2002-Dec 2003)
Reference to observed conditions
FRB Full Rollback HSPF with natural watershed
HSPF with natural watershed
Effect of no watershed development
FBO Full Buildout HSPF with projected complete watershed development
HSPF with projected complete watershed development
Effect of full watershed development
PRB Partial Rollback
from Base of 85.5%
HSPF with watershed development reduced by 85.5% from Base to FRB
HSPF with watershed development reduced by 85.5% from Base to FRB
Identify % reduction needed to meet WQS if starting point is 2003 conditions
PRF Partial Rollback
from FBO of 94.6%
HSPF with watershed development reduced by 94.6% from FBO to FRB
HSPF with watershed development reduced by 94.6% from FBO to FRB
Identify % reduction needed to meet WQS if starting point is Full Buildout conditions
NHY Natural
Hydrology and Loading
HSPF with natural watershed
HSPF with natural watershed; no withdrawals or diversion inflows; natural lake outlet control
Evaluate human-caused hydrologic change impact to FRB watershed
WQS = Washington State Water Quality Standards.
Development of HSPF watershed model The results in this report are based on the HSPF model developed by Cadmus and CDM under contract by EPA (Cadmus and CDM, 2007a; 2007b). The calibration was done based on tributary flow data and water quality measurements for six tributaries: Anderson, Austin, Euclid, Mill Wheel, Olsen, and Smith Creeks. The model was developed using the same meteorological data used for the lake model and the land use cover developed in the WRIA 1 Watershed Management Project. The land use cover was developed by using the 1992 National Land Cover Dataset and updated from aerial photography from a flight in 2000. The land use cover used for model calibration (Base scenario) is shown in Figure 4. The selection of HSPF as an alternative represents a refinement from the proposed multiple linear regression at drainage scale. HSPF simulates different drainages than those defined by the WRIA 1 Watershed Management Project. This allows the use of more uniform soils and slopes within each model unit. The HSPF results were translated into the WRIA drainages to allow input to the lake model. The land use covers for existing and Full Buildout conditions estimated development levels in each tributary watershed. The HSPF model divided residential development into pervious and impervious surfaces. Water quality data used to calibrate the model were collected near the mouths of the major tributaries to the lake. These factors generalize the data by tributary watershed. In other words, the HSPF results are appropriate on a wide scale but may not be as applicable on a site-by-site basis. For details of the HSPF model development, refer to Cadmus and CDM (2007a).

Lake Whatcom Watershed Total Phosphorus and Bacteria TMDLs: WQ Study Findings Page 49
The model provided flow and total phosphorus concentration time series for the 22 tributary subbasins that were used for lake model calibration under 2002-2003 conditions. The loading from the calibrated model is consistent with literature values and measured in stream concentrations of phosphorus. This model was then applied to develop flow and phosphorus time series for the other TMDL scenarios. The watershed loading model calculates flow based on:
• Input precipitation to the land surface. • Infiltration rates for different land use covers. • Water flow characteristics for different land use covers. • Routing of water between separate compartments for surface runoff, subsurface interflow,
and active groundwater, based on slope and stream cross-section. The watershed loading model calculates pollutant loading based on:
• Pollutant buildup rates. • Pollutant wash-off rates. • Loss of pollutant with infiltration or instream processes through the use of a first-order decay
rate. When the HSPF model estimates phosphorus loading estimates, individual actions and sources (such as septic systems, leaking sewers, and pet waste) are not evaluated. They are however integrated as part of the land cover sources through the calibration process. As part of developed land, there will be some leaking sewers, failing septic systems, and problems with pet waste disposal. As the TMDL is implemented, sources associated with runoff processes will be mitigated. Diligent enforcement of other laws will be necessary to control other sources. To link the watershed loading model to the lake response model, a translator tool was developed using an Excel spreadsheet and visual basic macros. This tool has several functions:
• Translate data from HSPF watersheds (HSPF output file format) to the WRIA 1 watersheds (CE-QUAL-W2 input file format).
• Convert from U.S. standard units of pounds, feet, and acres to metric units of grams and meters.
• Partition total phosphorus into the organic, algal, and inorganic fractions. Development of CE-QUAL-W2 lake model Model structure The structure of the CE-QUAL-W2 model is shown in Figures 21 and 22. Some definitions of terminology will help the reader in the subsequent discussions:
• Basin: As described above, Lake Whatcom has three basins which are like lakes within a lake separated by shallow sills. Basin 1 is at the northwest end closest to the City of Bellingham, while Basin 3 is at the southeast end and contains most of the lake’s volume.
Lake Whatcom Watershed Total Phosphorus and Bacteria TMDLs: WQ Study Findings Page 50
Basins are not a unit that is used in the CE-QUAL-W2 model but are important when defining Branches.
• Waterbody: A group of Branches with similar properties. In the Lake Whatcom model, Waterbody 1 includes Branches 1, 2, and 3, and Waterbody 2 includes Branches 4 and 5.
• Branch: A group of segments with properties similar to each other but different from those in other branches. Branches allow connecting two linear features of a lake such as South Bay to the main lake. Figure 21 shows the five branches used in the Lake Whatcom model: Branch 1 representing Basin 3, Branch 2 representing South Bay, Branch 3 representing Agate Bay, Branch 4 representing Basins 1 and 2, and Branch 5 representing the cove at Silver Beach Creek.
• Segment: A section of the lake that runs vertically top to bottom and laterally from shore to shore (numbered 2 through 63 in Figure 21), and made up of multiple layers. Segments range in length from 60 to 800 meters with a median length of 300 meters.
• Layer: A collection of cells representing a specific depth in all segments (shown in Figure 22 in side view). Layers of 1 meter depth are used for the top 79 layers; layers 80 and deeper are 3 meters thick.
• Cell: The computational unit in the CE-QUAL-W2 model, representing a volume in a specific location in the lake. Each cell corresponds to a specific layer in a specific segment in the lake model grid.
Model input data Input data for the CE-QUAL-W2 lake model were developed from a variety of sources. A complete list of model input parameters can be found in Appendix E. The methods for developing the principal inputs are described below: • Bathymetry. The bathymetry data file was developed based on data from the Lake
Whatcom 1999-2000 Area and Capacity Survey conducted by the U.S. Bureau of Reclamation. The data from this survey were entered into ArcView, and using Spatial Analyst, used to develop 1-meter interval contour polygons from elevation of -5 meter to 97 meter (City of Bellingham datum). Contour polygons were cleaned up and merged into one shape file and used for calculating segment length and cell width. A shapefile for model segmentation was developed, and the contour polygons were intersected with the segmentation shapefile to develop volumes for each model cell. Cell dimensions were then calculated and confirmed by checking against the depth-volume curve of the lake. During calibration some adjustments were made to cell dimensions and bottom elevation at the inter-basin sills to improve the model’s ability to match observed data. Lake volume was preserved overall. In order to match hydrodynamic predictions with data, small volumes of water were eliminated that were artificially distorted by the need to fit grid structure. Lake bathymetry and model segmentation are shown in Figure 23.

Lake Whatcom Watershed Total Phosphorus and Bacteria TMDLs: WQ Study Findings Page 51
• Initial Conditions. February 2002 profile data from WWU were used as the first estimate of initial conditions. Initial conditions were then modified as part of model calibration, by interpolating between December 2001 and February 2002 profile data to estimate January 1, 2002 conditions.
• Lake Level. Daily lake level data were provided by the City of Bellingham. Lake levels for
2002 were adjusted based on City staff comments about meter calibration.
• Outflow data. Outflow data were provided by the City of Bellingham and were updated for 2002-2003, by reviewing Sutron data files, paper recording, rating curve, and other reported data with adjustments based on best estimates for missing data or errors in the record.
• Precipitation Data. Precipitation data from Geneva Gate House, Smith, and Brannian gauges were used as follows: o For Waterbody 1, weighting factors provided by WWU were used to calculate
precipitation amounts ([Smith * 0.4610] + [Brannian * 0.3146]). o For Waterbody 2, data collected at Geneva Gate House were used for precipitation
amounts. For missing data at Geneva, a regression with Smith was used. o Precipitation temperatures were based on the average air temperature at Smith and
Brannian for Branches 1, 3, 4, and 5; while for Branch 2, air temperatures were used from Brannian only.
o Precipitation water quality data were obtained from the stations monitored by the National Atmospheric Deposition Program (NPDP, 2005) most representative of the Lake Whatcom area.
• Meteorological Data.
o Cloud cover data were from Bellingham Airport (KBLI). o Wind speed data were from Smith directly when available; otherwise Airport wind
speeds modified by a regression to Smith were used. o Wind direction data were from Smith when available; otherwise Airport wind direction
values were used adjusted by a correction factor based on the difference between the Smith and Airport directions.
o Solar radiation was based on the bigger value from either Smith or Brannian. When neither station was available, irradiance was predicted from a Ryan-Stolzenbach global model of solar radiation on a horizontal surface, with values modified by cloud cover.
o Air temperature and dew point temperatures from Brannian and Smith were averaged.
• Tributary Flow. Continuous flow and temperature data were collected on the following major tributaries: Austin, Anderson, Brannian, Carpenter, Euclid, Mill Wheel, Olsen, Silver Beach, and Smith Creeks. WWU maintained flow gauges on Anderson, Austin, and Smith, while USGS gauged Brannian, Carpenter, Euclid, Mill Wheel, Olsen, and Silver Beach Creeks. Flow measurements were used for calibration of the HSPF watershed model.

Lake Whatcom Watershed Total Phosphorus and Bacteria TMDLs: WQ Study Findings Page 52
• Tributary Temperature. Temperature time series were collected using tidbit data from the city. For those creeks or watersheds without tidbit data, data from an index creek were used. Gaps in the temperature time series, especially in November and December 2003, were filled using the simple response temperature model rTemp, calibrated to temperature data from earlier in the year. The rTemp model predicts a time series of water temperatures in response to heat fluxes determined by meteorological data, groundwater inflow, and other forcing functions (see www.ecy.wa.gov/programs/eap/models.html).
• Tributary Constituents. As described earlier, multivariate regressions were used to determine time series for inorganic and organic phosphorus; nitrate-nitrite, ammonia, and organic nitrogen; conductivity; and total organic carbon. Total phosphorus time series were modeled using HSPF and then apportioned into phosphorus constituents using ratios from the regressions. Other parameters were assigned values from the study monitoring data, multivariate regressions, or from literature values.
• Groundwater Inputs. The Lake Whatcom groundwater study (Pitz, 2005) provided the
information for groundwater inputs. Inflows from shallow unconsolidated aquifers were represented in the model with eight point tributary inputs representing the alluvial formations in valleys that flow towards the lake. Bedrock aquifer inputs were represented as distributed tributary inputs for Branches 2, 3, and 4. The Branch 1 distributed tributary contains residual flows that complete the water balance for calibration.
Groundwater inflows were set at the maximum precipitation-based flow (Scenario 2 in Table 1, Pitz [2005]). Input constituents were derived from the groundwater study data, except for groundwater temperatures which were derived from data collected as part of the Whatcom Creek gasoline spill and fire remediation (Cook, 2005). Groundwater was categorized into three quality regimes and assigned to different areas of the lake based on location of the observed values. Table 5 summarizes the flows and phosphorus concentrations used in the lake model.
Table 5. Model Groundwater Flow and Phosphorus.
Location Input type File name Flow (cms)
Concentration (mg/L) PO4 ORGP TP
Basin 3
distributed
Cdt_br1.npt 0 0.038 0.100 0.138 South Bay Cdt_br2.npt 0.0843 0.095 0.062 0.157 Agate Bay Cdt_br3.npt 0.0729 0.082 0.093 0.175 Basin 1&2 Cdt_br4.npt 0.0396 0.038 0.100 0.138 Anderson Valley
tributary
Ctr_gw2.npt 0.0843 0.038 0.100 0.138 Brannian Valley Ctr_gw4.npt 0.0153 0.038 0.100 0.138 South Bay Ctr_gw8.npt 0.0153 0.038 0.100 0.138 Blue Canyon Ctr_gw12.npt 0.0153 0.095 0.062 0.157 South of Austin Ctr_gw16.npt 0.0153 0.038 0.100 0.138 Smith Ctr_gw20.npt 0.0153 0.038 0.100 0.138 North Shore Ctr_gw24.npt 0.0153 0.038 0.100 0.138 Olsen Ctr_gw28.npt 0.0153 0.038 0.100 0.138
PO4 – orthophosphate ORGP – organic phosphorus TP – total phosphorus

Lake Whatcom Watershed Total Phosphorus and Bacteria TMDLs: WQ Study Findings Page 53
Pitz (2005) notes that his estimates of phosphorus loading from groundwater were upper-bound estimates. A number of factors could decrease actual phosphorus inputs from groundwater, including low oxygen and redox conditions in the groundwater and sediments, iron compounds that provide sorption sites for phosphorus, and oxygenated surface water that causes precipitation of these iron compounds. However, the information available for calibration of the model did not suggest that a reduction of phosphorus inputs was needed. Baseflow phosphorus levels in tributaries and the groundwater phosphorus levels used in the HSPF model are lower than the model’s groundwater direct inputs to the lake. This likely reflects several factors:
o Lower phosphorus levels may reasonably occur higher in the watershed as compared to locations adjacent to the lake where direct measurements were taken for characterizing lake inputs.
o Phosphorus levels may be reduced more by passing through well-aerated sediments in the stream as compared to lake sediments.
o Phosphorus uptake by plants and algae in the stream may further reduce phosphorus levels as compared to the levels directly entering the lake through groundwater.
1. Water withdrawals. The City of Bellingham provided the flow time series for withdrawals
for Water District #10, the City of Bellingham water treatment plant, the Georgia Pacific mill, and the Fish Hatchery.
2. Light Extinction. Light extinction was estimated from the five best solar radiation profiles
(i.e., data collected on clear days without cloud effects on the profile data) during summer monitoring in 2002 and 2003.
Model calibration Calibration consisted of matching model results to observed measurements as closely as possible by adjusting internal model variables (also termed “coefficients”). Measured data for calibration came both from Ecology and WWU lake survey data. Hydrolab dissolved oxygen (DO) data were used for DO calibration. Monitored DO variability was taken into account by calibrating the model to a large data set of DO values, so the overall pattern of DO was captured and variability around any given data point was minimized. Also, the model was calibrated to many other parameters which help characterize the lake productivity, including ammonia nitrogen, nitrite-nitrate nitrogen, orthophosphorus, total phosphorus, chlorophyll a, pH, temperature, and total persulfate nitrogen. Calibration of the lake model occurred in three stages over the course of the project: 1. Initial Calibration. Portland State University conducted an initial calibration of the
CE-QUAL-W2 lake model based on 2002-03 conditions, and published a calibration report (Berger and Wells, 2005). Details of the calibration process and results can be found in that report.

Lake Whatcom Watershed Total Phosphorus and Bacteria TMDLs: WQ Study Findings Page 54
The initial calibration report reached the following conclusion: In general, the model reproduces the lake responses to the known boundary conditions. The average absolute mean error of model predictions was 0.64 degrees Celsius for temperature, 0.69 mg/L for dissolved oxygen, 0.97 ug/l for chlorophyll a, 0.22 for pH and 0.004 mg/L for total phosphorus.
2. Recalibration with variable sediment stoichiometry. During the review of the calibration
report for the lake response model, local partners expressed their concern with the ability of the model to predict interactions between water column particulates (including algae), nutrients, and sediments. As a result, Ecology contracted with Portland State University to add a dynamic sediment stoichiometry feature to the CE-QUAL-W2 model and recalibrate the improved the model (Berger and Wells, 2007a). As described by Berger and Wells:
Variable stoichiometry of sediments has been added to the Lake Whatcom water quality model. There are now sediment phosphorus, sediment nitrogen, and sediment carbon compartments. The sediment carbon stoichiometry is variable because organic matter and algae may have differing carbon stoichiometry. The decay rate of sediment in a model cell is the mass averaged decay rate of the labile particulate organic matter (LPOM) and refractory particulate organic matter (RPOM) groups.
The model now includes two sediment compartments with different decay rates: (1) a zero-order decay that simulates the anoxic release of nutrients and (2) a first-order variable decay rate as described above. The two sediment compartments also have different nutrient release rates into the water column. Lake sediment samples were not analyzed for the water quality study, and direct measurements of sediment decay or nutrient release rates were not made. However, water column nutrient concentrations are affected by the nutrient flux from the sediments, and the model’s ability to replicate water column nutrient data is due to accurately simulating this flux and sediment nutrient concentrations. Therefore, uncertainty in sediment concentrations, decay rates, or nutrient fluxes to the water column is small because the values chosen need to accurately predict water column nutrient concentrations. The zero-order sediment compartment has constant sediment oxygen demand and anoxic nutrient release. The amount of nutrients released by the first-order sediment compartment depends on the amount of organic matter settling from the water column, which is dependent on the external loads from tributaries, groundwater, and precipitation. The first-order compartment is predictive because the amount of nutrient release due to sediment decay is dependent on the external loading of a management scenario. Although the anoxic release of the sediments in the zero-order compartment is constant, it represents a small fraction of the sediment nutrient release. Table 6 compares the daily phosphorus load released by the first-order sediment compartment and the zero-order compartment from July 30 to August 28, 2002. About all the phosphorus released by the sediments originated from the predictive, first-order sediment compartment.

Lake Whatcom Watershed Total Phosphorus and Bacteria TMDLs: WQ Study Findings Page 55
The 2003 average annual external loading to Lake Whatcom is also shown in Table 6 for comparison. However, in comparing these values, several issues should be kept in mind:
o Internal loading is actually a recycling of nutrients from the sediments. The net flux of nutrients on an annual basis is likely into the sediments. The values in Table 6 represent flux from the sediment only for the month of August.
o Internal loading is in equilibrium with external loading and lake productivity, and as external sources are reduced over time, internal nutrient release will decrease as well.
o External loading is expressed on an annual basis because the long residence time of the lake ensures that nutrients entering in the winter will still have an impact on the lake in the summer. However, the internal phosphorus release from sediments occurs in the hypolimnion during stratified, anoxic conditions. The photic zone is above the hypolimnion, and most of the nutrients released by the sediments will not be available to algae until the hypolimnetic water is mixed with epilimnetic water. Therefore, only a small fraction of that nutrient release may be available to phytoplankton during most of the growing season. The remainder is released in the fall.
Table 6. Comparison of Model First-Order and Zero-Order Sediment Phosphorus Release (kg/d) to the Water Column From July 30 to August 28, 2002.
Sediment Source Basins 1 and 2 Basin 3 All Basins Zero-order sediment compartment
Phosphorus release 0.0038 0.0013 0.0051
First-order sediment compartment Phosphorus release 2.720 5.070 7.790
Total release 2.724 5.071 7.795 Zero-order fraction 0.14% 0.03% 0.07%
2003 Average Annual External Loading 2.088 15.120 17.208
3. Recalibration with watershed model inputs. As discussed above, an opportunity arose to
develop the HSPF model to predict tributary flows and phosphorus. Tributary inputs using this method were developed and an additional recalibration completed for the lake model (Berger and Wells, 2007b).
A total of 109 different model coefficients are available for calibration, and 78 were adjusted during model calibration. Table E-2 in Appendix E lists and describes the model coefficients with the default and final calibration values used. One model variable deserves special discussion. The model wind sheltering coefficient adjusts the wind speed time series from meteorological stations to estimate local wind speeds for each segment. The wind sheltering coefficient is a major calibration parameter for large lakes, since it affects heat exchange and the wind shear producing surface turbulence. The model adequately simulated the depth of the thermocline which indicates that the overall amount of turbulent energy transferred to the lake over the course of a year due to wind shear was correct. Since the depth of thermocline was correctly predicted for each year, the hypolimnion volume was correctly predicted.

Lake Whatcom Watershed Total Phosphorus and Bacteria TMDLs: WQ Study Findings Page 56
Although the wind sheltering coefficients were set to 2003-04 conditions, they are applicable to future applications of the model for other years. Hypolimnion dissolved oxygen deficits are controlled by long-term nutrient loads rather than instantaneous wind speeds at the water surface. There are differences in the wind sheltering coefficient at different segments and time of year, but the total amount of turbulent energy transferred at the air-surface interface is unlikely to vary significantly year to year, making the wind conditions (speed and direction) and wind sheltering coefficients applicable for other years with larger or smaller tributary loadings. The first step in calibration of the lake model was determining a water balance for the lake. In CE-QUAL-W2, uncertainty in the water balance is addressed by creating a water source that varies between in- and out-flows and results in lake volumes that match observed lake levels. For the lake model, the balance was added as a groundwater source to Basin 3. Flows into the lake are treated as groundwater inflows with the appropriate parameter concentrations, while flows out of the lake carry the ambient concentrations of the lake. Water balance flows represent significant fluxes of nutrient load to and from the lake. However, the model did adequately predict total phosphorus concentrations in the lake, and if loading created by the water balance flow had been excessive, the model would not have calibrated to total phosphorus. Also, the water balance flow may be positive or negative. Although the positive flows contributed a nutrient load to the lake, negative flows, which correspond to outflows, remove nutrients from the lake, helping to diminish the impact of larger water balance flows. A water balance program is available that calculates the time series to be used for the water balance groundwater source. However, calibration of the lake model showed that this program produced a water balance with wide swings between in- and out-flows between time steps. To further reduce the impact of load fluxes produced by these flows, the water balance was smoothed with a seven-day running average. The resulting water balance time series reduces overall loading flux, is more realistic, and still matches lake levels well. A calibration history and a summary of calibration statistics for the final calibration are provided in Appendix E. Both static graphs and animations of observed versus modeled results were developed by Portland State University and can be found in their report (Berger and Wells, 2007a) and on Ecology’s website: www.ecy.wa.gov/programs/wq/tmdl/watershed/tmdl_info-nwro.html#whatcom_lake. As an additional check of modeling quality, Ecology had both the watershed and lake models reviewed by an independent contractor funded by EPA (Butcher, 2008). This review identified areas where additional work would be beneficial, but found that overall the models were suitable for TMDL development:
Despite various shortcomings noted above, the Whatcom models appear credible and useful, although improvements will always be possible. The key question here is whether the models are sufficiently well developed to satisfy their intended decision purposes relevant to developing a TMDL and associated load allocations and wasteload allocations for Lake Whatcom. The models do appear generally suitable for this purpose insofar as lake responses of interest are strongly controlled by flow and TP load.

Lake Whatcom Watershed Total Phosphorus and Bacteria TMDLs: WQ Study Findings Page 57
Ecology is satisfied with the quality of data used in modeling and of the model itself. Model calibration statistics indicate a well-calibrated model that is acceptable for use for this TMDL analysis. Model looping Calibration was conducted with only the two-year model. Then the looping methodology was applied to develop long-term simulations for comparison to standards. The looping methodology revealed some challenges for developing long-term modeling scenarios. Long-term looped scenarios (nine two-year loops) were evaluated for the stability of results. In general, the changes in results between iterations for all parameters decreased with each loop and they approached equilibrium values. This is a desirable result since it indicates a stable solution resulting from the repetition of the loops. However, dissolved oxygen results in looped scenarios also were strongly affected by increasing nitrogen limitation in later loops. The scenario with highest loading, Full Buildout, became fully nitrogen-limited in two loops, while the scenario with the lowest loading, Full Rollback, became fully nitrogen-limited in six loops. This is problematic since the extent of nitrogen limitation has never been observed and distorts dissolved oxygen results, and many of the processes that take over under nitrogen-limiting conditions are not modeled. Several reasons were hypothesized for this trend towards nitrogen limitation: • The two years of calibration, 2002 and 2003, represent a dry and an average year. Therefore
wet years with larger nitrogen loading are not represented. • Calibration based on two years will be unable to capture other long-term trends, including
variable nutrient kinetics that might affect the balance of phosphorus and nitrogen. • Nitrogen-fixing by blue-green algae which would increase available nitrogen is not simulated
in the model. It is important to note that studies have shown that Lake Whatcom can be nitrogen-limited at times (Matthews et al., 2002a). However, nitrogen limitation in the lake usually occurs from the presence of excess phosphorus. Adequate controls on phosphorus are expected to maintain the lake in a phosphorus-limited state. Therefore, the appropriate course for this TMDL is to focus on phosphorus limitation and avoid nitrogen-limited conditions. For the model scenarios, looping was limited to only one year (2003) since this was more of an average year with higher nitrogen loading. The approach to scenario development was to run the two years once and then loop 2003 as six additional times. The seven simulated years is approximately the hydraulic retention time of the lake during 2003. Natural and future conditions scenarios Land use cover that shows estimates of historic conditions and future conditions were developed as part of the WRIA 1 Watershed Management Plan. The land use cover for historic conditions
Lake Whatcom Watershed Total Phosphorus and Bacteria TMDLs: WQ Study Findings Page 58
for Lake Whatcom is all Mixed Forest and Wetland. This cover was applied to the watershed model for the Full Rollback scenario (FRB). The loading of the Full Rollback scenario estimates the loading under natural conditions. In the HSPF model as calibrated, all forests react the same as Mixed Forest, exhibiting the same runoff and phosphorus loading characteristics. The models were calibrated to managed forests, and that may introduce some additional loading above loading from an unmanaged old-growth forest. The managed forests in the Lake Whatcom watershed are regulated by the Washington State Forest Practices Act. That act has a provision for Watershed Analysis which has been completed for the Lake Whatcom watershed. Watershed analysis provides an additional level of protection based on site-specific factors. Over half the lands are managed by the State Department of Natural Resources. Management of those lands is additionally constrained by a Landscape Management Plan, which includes oversight by local governments. These layers of constraint make it difficult to estimate what additional loading may occur due to ongoing forest management or how much less loading occurred from forests absent any harvest or management. As identified in the Quality Assurance Project Plan the best estimate of natural conditions for the natural forest in the Lake Whatcom Watershed is the least developed watershed in Lake Whatcom. Instead of directly applying the runoff characteristics of Smith Creek as originally described in the Project Plan, the calibrated HSPF model was used to account for variations in slope and runoff distances. The future land-use cover considers all land to be developed to the level allowed by zoning. For large parcels in residential areas, a small portion is considered residential and the remainder is pasture. This cover, shown in Figure 24, was applied to the Full Buildout scenario (FBO). Tables 7 and 8 show the distribution of land uses per subbasin for the Base scenario in terms of acreage and percent of the subbasin, respectively, while Tables 9 and 10 show the acreage and percent of the subbasin for land uses under the Full Buildout Scenario. Land uses for Full Rollback are all in the category of Mixed Forest. The redistribution of land into land-use categories was the mechanism used to increase or reduce total phosphorus loading for the scenarios. These land-use covers were used to develop the watershed model that produced water and phosphorus inputs for the lake model. All other input values remained constant between scenarios. The water balances for these scenarios were adjusted by modifying Whatcom Creek outflows to maintain the match with 2003-04 lake levels. In particular, groundwater inputs were not changed because little information is available about the effect of human activities on groundwater nutrient levels, and the amount of groundwater nutrients that would be present absent human contributions is unknown. The effect of future actions on groundwater levels is also uncertain. Measures to reduce phosphorus in surface tributaries may or may not affect groundwater phosphorus concentrations. The losses of phosphorus in the sediments as water enters the lake are also poorly understood. During implementation of the TMDL, this may be a fruitful area for further investigation. Therefore

Lake Whatcom Watershed Total Phosphorus and Bacteria TMDLs: WQ Study Findings Page 59
keeping groundwater nutrient levels constant is preferable to arbitrary estimates of increases or reductions under development levels. The Full Rollback scenario estimates dissolved oxygen system-potential values that are the best estimates of the natural condition of the waterbody. The analysis was based on the cumulative volume of water in critical segments of the lake during critical times. In this case, the estimate of naturally low dissolved oxygen concentrations typifying historic conditions shows that use of this allowance is appropriate. Critical season and locations Critical aspects of dissolved oxygen depletion trends observed in Lake Whatcom are (1) formation of anoxia in the hypolimnion earlier in the summer, and (2) the development of anoxia and hypoxia covering a larger portion of the water column over a longer period. The critical time period for oxygen depletion is identified as June - October, which starts with the period where the lake becomes stratified and oxygen depletion of the hypolimnion appears, and ends when stratification breaks up and oxygen depletion in the hypolimnion dissipates. Standards were evaluated using the daily minimum dissolved oxygen values. No evidence for a critical season was found for phosphorus inputs. Phosphorus that enters the system during the entire year, including the fall or winter, has an effect on algal growth in the spring and summer and has an effect the rate of hypolimnetic oxygen decline during the critical period for oxygen depletion. The critical segments showing the greatest impairment by pollution increases have been identified as Segments 61 and 62. Those segments represent the deepest locations in Basin 1.

Lake Whatcom Watershed Total Phosphorus and Bacteria TMDLs: WQ Study Findings Page 60
Table 7. Total Acres per Subbasin by Land Use Category – Base Scenario.
HSPF Subbasin Name HSPF Land Use Category Total Acres
of Subbasin Agriculture Deciduous Forest Developed Evergreen
Forest Mixed Forest Open Water/
Wetlands Developed– Impervious
Mirror Lake - 54 - 8 33 25 13 - 134 Anderson Creek 77 591 6 1,015 756 126 6 2 2,579 NE Lake Whatcom Inflow 1 11 152 2 329 161 4 2 1 663 NE Lake Whatcom Inflow 2 2 453 15 1,436 1,106 201 24 4 3,241 Smith Creek - 498 - 1,486 1,174 105 - - 3,263 Smith Creek Outlet - 12 1 4 18 4 0.1 0 40 Olsen Creek - 375 11 1,220 824 16 0.2 3 2,448 Carpenter Creek 4 147 35 186 347 37 1 10 766 N Lake Whatcom Inflow 1 255 88 187 484 104 14 24 1,156 Silver Beach Creek 0.2 104 175 88 272 27 - 47 712 NW Lake Whatcom Inflow 114 1,355 521 224 1,223 116 24 141 3,718 Brannian Creek - 493 1 1,071 634 97 2 0 2,298 Brannian Creek Outflow - 17 10 11 28 2 1 3 70 S Lake Whatcom Inflow 0.4 698 105 489 805 153 28 28 2,307 Upper Austin Creek 1 100 6 1,306 340 5 - 2 1,759 Beaver Creek 0.2 598 99 1,134 1,168 8 1 27 3,036 Austin Creek - 9 12 62 32 0.5 - 3 118 Austin Creek Outflow - 26 120 110 109 9 28 32 433 SW Lake Whatcom Inflow 2 0.4 130 197 258 287 9 15 53 950 SW Lake Whatcom Inflow 1 - 69 258 51 122 11 1 70 582 Euclid Creek - 55 67 66 133 2 - 18 340 Mill Wheel Creek - 75 123 104 231 3 4 33 574
Total 212 6,264 1,852 10,843 10,288 1,062 164 500 31,185 Percent 1% 20% 5.9% 35% 33% 3% 1% 1.6% 100%
Percentages > 10% in Bold

Lake Whatcom Watershed Total Phosphorus and Bacteria TMDLs: WQ Study Findings Page 61
Table 8. Percentages per Subbasin by Land Use Category – Base Scenario.
HSPF Subbasin Name HSPF Land Use Category Subbasin %
of Study Area Agriculture Deciduous
Forest Developed Evergreen Forest
Mixed Forest Open Water/
Wetlands Developed– Impervious
Mirror Lake - 40.7% - 5.8% 24.8% 18.9% 9.9% - 0.4% Anderson Creek 3.0% 22.9% 0.2% 39.3% 29.3% 4.9% 0.2% 0.1% 8.3% NE Lake Whatcom Inflow 1 1.7% 23.0% 0.4% 49.6% 24.4% 0.6% 0.3% 0.1% 2.1% NE Lake Whatcom Inflow 2 0.1% 14.0% 0.5% 44.3% 34.1% 6.2% 0.7% 0.1% 10.4% Smith Creek - 15.3% - 45.6% 36.0% 3.2% - - 10.5% Smith Creek Outlet - 30.7% 3.5% 9.2% 45.3% 10.1% 0.2% 1.0% 0.1% Olsen Creek - 15.3% 0.4% 49.8% 33.7% 0.6% 0.0% 0.1% 7.9% Carpenter Creek 0.5% 19.2% 4.6% 24.2% 45.3% 4.8% 0.1% 1.2% 2.5% N Lake Whatcom Inflow 0.1% 22.0% 7.6% 16.2% 41.8% 9.0% 1.2% 2.1% 3.7% Silver Beach Creek 0.0% 14.6% 24.6% 12.3% 38.2% 3.7% - 6.6% 2.3% NW Lake Whatcom Inflow 3.1% 36.4% 14.0% 6.0% 32.9% 3.1% 0.7% 3.8% 11.9% Brannian Creek - 21.5% 0.1% 46.6% 27.6% 4.2% 0.1% 0.0% 7.4% Brannian Creek Outflow - 24.0% 14.4% 15.1% 39.5% 2.3% 0.9% 3.9% 0.2% S Lake Whatcom Inflow 0.0% 30.2% 4.6% 21.2% 34.9% 6.6% 1.2% 1.2% 7.4% Upper Austin Creek 0.1% 5.7% 0.3% 74.2% 19.3% 0.3% - 0.1% 5.6% Beaver Creek 0.0% 19.7% 3.3% 37.4% 38.5% 0.3% 0.0% 0.9% 9.7% Austin Creek - 7.4% 10.4% 52.3% 26.8% 0.4% - 2.8% 0.4% Austin Creek Outflow - 6.0% 27.7% 25.4% 25.1% 2.0% 6.4% 7.5% 1.4% SW Lake Whatcom Inflow 2 0.0% 13.7% 20.7% 27.2% 30.2% 0.9% 1.6% 5.6% 3.0% SW Lake Whatcom Inflow 1 - 11.8% 44.3% 8.8% 21.0% 1.9% 0.2% 12.0% 1.9% Euclid Creek - 16.0% 19.5% 19.5% 39.0% 0.7% - 5.3% 1.1% Mill Wheel Creek - 13.1% 21.5% 18.2% 40.3% 0.5% 0.7% 5.8% 1.8%
Percentages > 10% in Bold

Lake Whatcom Watershed Total Phosphorus and Bacteria TMDLs: WQ Study Findings Page 62
Table 9. Total Acres per Subbasin by Land Use Category – Full Buildout Scenario.
HSPF Subbasin Name HSPF Land Use Category Total
Acres of Subbasin Agriculture Deciduous
Forest Developed Evergreen Forest
Mixed Forest Open Water/
Wetlands Developed– Impervious
Mirror Lake 15 41 13 2 21 25 13 3 133 Anderson Creek 283 415 90 986 643 132 5 24 2,579 NE Lake Whatcom Inflow 1 54 107 13 313 120 51 2 3 663 NE Lake Whatcom Inflow 2 73 402 42 1,416 1,035 245 16 11 3,241 Smith Creek - 490 - 1,476 1,161 136 - - 3,262 Smith Creek Outlet 1 0 2 - - 37 0.1 1 40 Olsen Creek 137 308 25 1,205 751 15 0.2 7 2,448 Carpenter Creek 328 26 92 107 157 32 1 25 766 N Lake Whatcom Inflow 176 150 122 159 377 131 8 33 1,156 Silver Beach Creek 258.1 3 328 1 16 18 0.0 89 712 NW Lake Whatcom Inflow 1,789 439 835 11 287 106 24 226 3,717 Brannian Creek - 487 9 1,070 631 96 2 2 2,297 Brannian Creek Outflow 5 9 12 7 13 20 1 3 70 S Lake Whatcom Inflow 615.3 439 283 316 411 138 28 77 2,307 Upper Austin Creek 87 98 1,239 305 4 26 1,759 Beaver Creek 69.2 532 378 943 1,007 2 1 102 3,036 Austin Creek - - 93 - - - - 25 118 Austin Creek Outflow 10 0 303 8 2 - 27 82 433 SW Lake Whatcom Inflow 2 198.9 14 485 56 49 2 14 131 950 SW Lake Whatcom Inflow 1 73 21 350 11 28 2 1 95 582 Euclid Creek 24 31 169 34 35 1 - 46 340 Mill Wheel Creek - 29 292 67 98 5 4 79 574
Total 4,109 4,032 4,034 9,427 7,147 1,198 146 1,092 31,184 Percent 13% 13% 13% 30% 23% 4% 0% 4% 100%
Percentages > 10% in Bold

Lake Whatcom Watershed Total Phosphorus and Bacteria TMDLs: WQ Study Findings Page 63
Table 10. Percentages per Subbasin by Land Use Category – Full Buildout Scenario.
HSPF Subbasin Name HSPF Land Use Category Subbasin %
of Study Area Agriculture Deciduous
Forest Developed Evergreen Forest
Mixed Forest Open Water/
Wetlands Developed– Impervious
Mirror Lake 11.3% 30.9% 9.7% 1.5% 15.8% 18.9% 9.4% 2.6% 0.4% Anderson Creek 11.0% 16.1% 3.5% 38.2% 24.9% 5.1% 0.2% 0.9% 8.3% NE Lake Whatcom Inflow 1 8.1% 16.1% 1.9% 47.2% 18.1% 7.7% 0.3% 0.5% 2.1% NE Lake Whatcom Inflow 2 2.3% 12.4% 1.3% 43.7% 31.9% 7.6% 0.5% 0.4% 10.4% Smith Creek - 15.0% - 45.2% 35.6% 4.2% - - 10.5% Smith Creek Outlet 1.3% 0.0% 4.9% - - 92.2% 0.3% 1.3% 0.1% Olsen Creek 5.6% 12.6% 1.0% 49.2% 30.7% 0.6% 0.0% 0.3% 7.9% Carpenter Creek 42.8% 3.4% 12.0% 14.0% 20.5% 4.1% 0.1% 3.2% 2.5% N Lake Whatcom Inflow 15.2% 13.0% 10.6% 13.7% 32.6% 11.3% 0.7% 2.9% 3.7% Silver Beach Creek 36.2% 0.5% 46.0% 0.1% 2.2% 2.5% 0.0% 12.5% 2.3% NW Lake Whatcom Inflow 48.1% 11.8% 22.5% 0.3% 7.7% 2.8% 0.6% 6.1% 11.9% Brannian Creek - 21.2% 0.4% 46.6% 27.5% 4.2% 0.1% 0.1% 7.4% Brannian Creek Outflow 7.5% 13.1% 17.1% 9.9% 18.2% 28.7% 0.9% 4.6% 0.2% S Lake Whatcom Inflow 26.7% 19.0% 12.3% 13.7% 17.8% 6.0% 1.2% 3.3% 7.4% Upper Austin Creek - 5.0% 5.5% 70.4% 17.3% 0.2% - 1.5% 5.6% Beaver Creek 2.3% 17.5% 12.5% 31.1% 33.2% 0.1% 0.0% 3.4% 9.7% Austin Creek - - 78.7% - - - - 21.3% 0.4% Austin Creek Outflow 2.2% 0.1% 70.1% 1.9% 0.5% - 6.3% 19.0% 1.4% SW Lake Whatcom Inflow 2 20.9% 1.4% 51.0% 5.9% 5.2% 0.2% 1.5% 13.8% 3.0% SW Lake Whatcom Inflow 1 12.6% 3.7% 60.2% 1.9% 4.9% 0.3% 0.1% 16.3% 1.9% Euclid Creek 6.9% 9.2% 49.7% 10.0% 10.4% 0.3% - 13.5% 1.1% Mill Wheel Creek - 5.0% 50.9% 11.7% 17.1% 0.9% 0.7% 13.8% 1.8%
Percentages > 10% in Bold

Lake Whatcom Watershed Total Phosphorus and Bacteria TMDLs: WQ Study Findings Page 64
Application of standards to model results Basis of cumulative volume approach Conditions in Lake Whatcom pose a particular challenge to evaluating compliance with the Washington State standards by comparing two scenarios. Both modeled and measured conditions often show high variability over time and space. Because of changes in lake level, water flow, the lake seiche, thermal stratification, algae levels, and other conditions, measurements show variability and are difficult to pin to a specific location and time. Therefore, it is difficult to make a consistent comparison between a model cell and point in the lake at any given time. Small changes in inflows or evaporation can change the thermal balance and hydrodynamic characteristics. Therefore, conditions in the same cell at the same time in two different model scenarios may differ because of physical processes not directly related to pollutant loading. To address the variability, an alternative method was developed to compare scenarios and determine compliance with the standards. The method determines whether the same volumes of water have the same dissolved oxygen levels in different scenarios. Or to put it another way, the standards grant a dissolved oxygen allowance of 0.2 mg/L compared to natural conditions. Therefore, the volume of water at or below a target level of a given natural dissolved oxygen concentration less 0.2 mg/L should be equal to the volume of water in another scenario at the target dissolved oxygen level. When these volumes are summed for different dissolved oxygen levels, a curve can be developed of the cumulative volumes as a function of dissolved oxygen levels. One strength of this approach is that it minimizes the effect of measurement and model variability on the analysis. For example, although both measurements and model calibration show variability above 0.2 mg/L, when comparing two model runs as cumulative volumes, the variability in scenario results will appear in similar locations in both series of cumulative volumes so that they tend to offset each other. Therefore the 0.2 mg/L dissolved oxygen differential will be less affected by model or measurement variability, and be representative of the overall patterns of dissolved oxygen concentrations. This approach allows a comparison at all oxygen levels. Different aquatic life, from fish to bacteria, have different oxygen needs. A test for meeting water quality criteria must protect all uses; therefore, all oxygen levels are important. The habitat to be protected could be considered the volume of the water column for free swimming life or the surface area of the bottom for benthic organisms. Quantifying the habitat by model cells was rejected because the volume of cells can vary widely. In the CE-QUAL-W2 model, the cells near the bottom of the water column are much smaller than other cells. By using the volume of each cell in the analysis, all water is given the same weight. Cumulative volume method As described earlier in the Dissolved Oxygen subsection of the Water Quality Standards and Beneficial Uses section, volumes are aggregated from the lowest oxygen levels to the highest

Lake Whatcom Watershed Total Phosphorus and Bacteria TMDLs: WQ Study Findings Page 65
oxygen levels, reflecting the need to protect against loss of oxygen. If one scenario’s volume is greater than another’s, then extra volume with the highest oxygen levels would be left out of the analysis, introducing a small margin of safety. Similarly, results are expressed in volume instead of a percentile or relative frequency because in the future we may need to evaluate scenarios that have different total volumes. If percentiles were used, then a scenario that has a larger total volume could have the same percentile of oxygen as a scenario with a lower total volume, but the scenario with less volume overall would also have less volume of high quality water. Therefore, use of volumes is more protective of the highest oxygen levels. Cumulative volumes of the daily minimum oxygen levels were evaluated for comparison to the standards. The CE-QUAL-W2 model provides results at a user-selected time step. For this project, oxygen levels for each model cell were output every three hours, or eight times a day, and daily minimums were selected from the model output. This resolution picked up both diurnal and shorter period (16 to 18 hour) oscillations based on internal waves. Shorter intervals would have resulted in slightly lower minimums, but the amount of data required would increase substantially. Data from the critical time period and critical spatial region were aggregated for each day of the critical period based on the volume of water in each model cell and the daily minimum oxygen level in each cell. The critical spatial region selected was the entire water column. Compared to the Full Rollback scenario, surface waters under the Base and Full Buildout scenarios typically have higher minimum oxygen levels. In all scenarios, portions of the hypolimnion are anoxic. The critical locations are those depths where dissolved oxygen is dropping towards anoxic. The thickness and duration of anoxia varies between scenarios. Spatially the anoxia begins near the bottom in the spring, rises to the metalimnion in the summer, and drops to the bottom again in the fall. The deepest waters will consistently be near 0 mg/L of oxygen. The surface waters will have highest oxygen levels. Therefore the mid-level water layers where the criteria are likely to be violated will be characterized by intermediate oxygen levels or by the widest changes between scenarios. When the entire water column is evaluated, the areas with deficits fall out in the middle of the cumulative volume curve, so limiting the analysis to less than the full water column is unnecessary. The volume of the surface cells of the model are defined for a one-meter thickness. Internally the model adjusts the top layer to slightly greater than, or slightly less than, one meter to keep an accurate track of the volume of the lake. The comparisons of the cumulative volume aggregation assume the top layer is the nominal one-meter thickness. This layer has oxygen levels that approach equilibrium with the atmosphere. The values between scenarios differ only slightly, and dissolved oxygen deficits are not found in surface waters. Therefore, the complex task of calculating the adjusted volume is not justified
Lake Whatcom Watershed Total Phosphorus and Bacteria TMDLs: WQ Study Findings Page 66
Comparison of cumulative volumes The cumulative volume with less than a specified level of dissolved oxygen was developed for the Full Rollback scenario and used as the natural baseline for evaluation of standards. Results of each alternative scenario were then aggregated into a curve of cumulative volume by dissolved oxygen level, and the difference between the curves compared to the 0.2 mg/L less than natural conditions criterion. Figure 25 illustrates this approach. The comparison of the cumulative volume of oxygen levels was performed using the following numerical method. The daily minimum dissolved oxygen values from the model output were read into the statistical program R: (R, 2008). The data were formatted into a three-dimensional array of model layers, segments, and time periods. The volumes of the cells for each segment, layer, and day were put into data bins based on the oxygen level. The bin size selected for this analysis was 0.1 mg/L of dissolved oxygen. The total volume in each bin was then divided by the number of days, so that periods of different length could be compared. The bin size of one half of the 0.2 mg/L criterion was selected as suitable to ensure capturing measurable changes. A sensitivity analysis was conducted for the Partial Rollback scenarios to determine the effect of bin size. Evaluations at 0.05, 0.02, and 0.01 mg/L bin size were conducted. With a bin size of 0.01, an exceedance of the criterion was found in four bins representing 0.01 mg/L or less of deficit. As this is much smaller than the 0.2 mg/L allowance, this was determined to be not significant. A curve was developed by plotting the dissolved oxygen level on the x axis and the total volume of water in the bins at or below that dissolved oxygen level on the y-axis. Curves developed for the Full Rollback conditions scenario, the criteria based on Full Rollback conditions, and the other model scenarios can then be used to compare these scenarios. The cumulative volume curve of a scenario is compared to the Full Rollback cumulative volume curve in the following steps, illustrated in Figure 25:
1. Chose a dissolved oxygen level from the test scenario curve and read the corresponding volume.
2. Read across to the right to the same volume for the natural scenario curve, and determine the dissolved oxygen level for that point on the natural scenario curve.
3. The target for the scenario is the Full Rollback oxygen minus 0.2 mg/L, and this target value becomes the criteria for the given volume of water.
4. If the dissolved oxygen level for a given volume of water for the test scenario is less than the criterion for that volume, there is a deficit.
5. The total deficit between both curves can be expressed in grams of dissolved oxygen (volume of water multiplied by dissolved oxygen concentration). It is the area to the right of the curve for the scenario being evaluated, and to the left of the curve for the criteria wherever there is a deficit.

Lake Whatcom Watershed Total Phosphorus and Bacteria TMDLs: WQ Study Findings Page 67
For a scenario to meet standards, the curve for that scenario must show no deficit compared to the curve for Full Rollback less 0.2 mg/L. Generally the lowest oxygen levels are found in the deepest water. As phosphorus loading increases with increased development, the oxygen levels increase in much of the lake, especially in the unstratified lake and in surface waters during stratification. This is due to the photosynthetic production of oxygen by algae. It is when the algae settles into the hypolimnion and decays that the deeper water experiences a decline in oxygen levels. It is important to realize, however, that areas and times of elevated oxygen do not compensate for the oxygen deficits. Oxygen deficits are regulated to prevent several sources of resource damage. Low levels of oxygen make phosphorus in sediments more soluble, thus fertilizing the lake. There are organisms in lake sediments that cannot migrate to portions of the lake to avoid low oxygen conditions. In very low oxygen conditions, bacteria reduce sulfate to sulfide, and the resulting hydrogen sulfide can be toxic to aquatic life. The bacteria that reduce sulfate also enhance the conversation of mercury from relatively innocuous inorganic mercury to methyl mercury that enters the food web and is concentrated in fish. These processes are site specific, and excess oxygen at other locations in the lake does not mitigate the oxygen deficit. The results of applying this approach are shown in Figures 26 and through 31. • In Figure 26, the dashed blue line is offset 0.2 mg/L from the aggregation of the Full
Rollback curve to establish the criteria curve for this TMDL, which is then compared to the distribution for the Base scenario. The volume of water that fails to meet the criteria (the difference between the two lines) is shown in red.
• Similarly, Figure 27 shows the comparison of the Full Buildout scenario to the criteria curve. This graph shows that the dissolved oxygen deficit grows with increasing development and phosphorus loading.
• Figure 28 shows a special case where loading is held constant at the Full Rollback level but hydrology is changed.
• Figure 29 shows a Partial Rollback from Base scenario that meets the criteria, and Figure 30 shows a Partial Rollback from Full Buildout scenario that meets the criteria.
• Figure 31 shows the comparison of the Base scenario to a scenario where the Georgia Pacific mill withdrawal was set to zero and Whatcom Creek increased by the same amount.
Effect of hydrologic changes In all of the scenarios above (Full Rollback, Full Buildout, and Partial Rollback), the only hydrologic changes are those associated with altered land-use cover. Several other alterations of lake hydrology were held constant: • The amount of water diverted from the Middle Fork of the Nooksack to Lake Whatcom. • The amount of water withdrawn for use by the City of Bellingham, the Georgia Pacific mill,
the Lake Whatcom Water and Sewer District, and the Washington Department of Fish and Wildlife fish hatchery.
• Operation of the lake outlet control structure and flow to Whatcom Creek.

Lake Whatcom Watershed Total Phosphorus and Bacteria TMDLs: WQ Study Findings Page 68
To evaluate the cumulative effect of these modifications to the lake’s hydrology, an additional scenario has been evaluated. The Full Rollback scenario was modified to provide a more natural hydrology. In this scenario, the lake level is controlled by using the spillway feature of the CE-QUAL-W2 model, which provides a fixed elevation at the outlet (a simulation of the natural lake outlet) instead of using the dam at the outlet to control flows to Whatcom Creek. The diversion of water from the Middle Fork Nooksack River into the lake was removed from the model as well as withdrawals from the lake for consumptive uses. This natural hydrology scenario (with hydromodifications removed) is not used to estimate natural conditions for the purpose of determining compliance with standards, but is provided to demonstrate the effects of the hydrologic modifications. The reason that it is not used for standards compliance is that any changes in oxygen from flow modification are not the result of a discharge of a pollutant. Also, the changes in loading associated with the Middle Fork Diversion and consumptive withdrawals are associated with the exercise of water rights that are not regulated by a TMDL. By using constant hydrologic conditions, the evaluation of allowable pollutant loadings should be less dependent on hydrologic variation. If in the future major hydrologic changes are contemplated, we can evaluate natural loading under those new hydrologic conditions and compare it to the proposed allocations to ensure that water quality standards will still be met. The 2002-2003 seasons for the TMDL study represent a period when the Georgia Pacific (GP) mill was phasing out operations and annual water use was dropping. Before GP reduced their water demand, the city had agreed to voluntarily keep enough water in the Middle Fork of the Nooksack River to support salmon. If GP had continued to demand the high levels of water they had in the past, the lake surface would have been much lower. However, their demand decreased shortly after the diversion was reduced. In the period that is being modeled, GP did continue to use considerable quantities of water (about 2/3 of what the rest of the city used). In 2000 and previous years, the GP mill was using about 12 billion gallons per year, but in 2002 and 2003, the mill’s water use had dropped to 3 billion gallons per year. Since 2006, water use is less than 1 billion gallons per year. This change in Lake Whatcom’s flow balance has raised some questions about how the elimination of the GP mill water withdrawal might affect the water quality of the lake. The model was run to examine the question: what if the GP mill had shut down prior to 2002 and the water they had used was spilled over to Whatcom Creek? To examine that question, one additional model scenario was run where the Base scenario was changed by setting the GP withdrawal to zero and adding that water to the Whatcom Creek outflows. The resulting change to lake dissolved oxygen levels was very small. There was about a 0.02 mg/L increase in dissolved oxygen at oxygen levels where the base scenario is deficient. For comparison, the Base scenario requires additional 1.07 mg/L oxygen to meet criteria in the same range. The results of these scenarios are shown in Figure 31.

Lake Whatcom Watershed Total Phosphorus and Bacteria TMDLs: WQ Study Findings Page 69
Loading capacity Partial Rollback approach To determine the total phosphorus loading capacity of Lake Whatcom, the human caused phosphorus loads from tributary basins were reduced by reducing the acreage of developed lands. The Base and Full Buildout scenarios were selected as conditions to bracket possible TMDL end points. Development at the time of TMDL implementation will be more widespread than the Base scenario (which represents conditions in 2002-2003). Similarly, major land purchases by the City of Bellingham and Whatcom County to limit future building in the watershed will prevent the Full Buildout scenario from coming to pass. Therefore, these two scenarios bracket the conditions that will be used for planning implementation of the TMDL. Also, these extremes provide information intended to assist land use managers on the choices to be made. Partial Rollback scenarios were used to determine the loading capacity. For each rollback scenario, the reduction in human-caused pollution was calculated by reducing the level of development by a fixed percentage across the watershed (CDM, 2008). In each case, the percentage of acreage was subtracted from the Agriculture, Developed, and Open land use categories in the original Existing or Full Buildout scenario and added to the Mixed Forest category. The Evergreen, Deciduous, and Water/Wetlands acreages were not changed. Several iterations of the model were made to find the percent reduction that most closely met the 0.2 mg/L dissolved oxygen deficit criterion. These scenarios also provide insight to differences in the lake’s response to the location of pollutant inputs. In general, the Base scenario and Partial Rollback from Base will have a higher concentration of development at the northwest end of the lake. And the Full Buildout and Partial Rollback from Full Buildout will have a lower concentration of development at the northwest end of the lake. In addition to identifying the reduction in phosphorus loading necessary to restore water quality in the lake, this technical assessment evaluated the relationship between phosphorus loading and human development in the watershed. The loading capacity of the lake for phosphorus was determined by reducing the acreage of development (returning those acres to pre-development conditions) until phosphorus loads allowed dissolved oxygen criteria to be met. Loading capacity as developed acres These reduced acreages will be referred to as developed acres in this TMDL. They represent the acreage not in mixed forest or wetland that generates total phosphorus loading based on the land uses and associated phosphorus delivery monitored and modeled for 2003 conditions. Developed acreage qualifies as a possible surrogate measure for phosphorus loading to fulfill the requirements of Section 303(d). The watershed can support higher levels of development and still meet water quality standards only if those land uses produce nutrient loading that looks like loading levels from much lower levels of development. In other words, those acres have

Lake Whatcom Watershed Total Phosphorus and Bacteria TMDLs: WQ Study Findings Page 70
effectively less development because of the use of pollution control strategies to keep nutrient loading to low levels. This measure came about for two reasons: 1. Phosphorus loading for the Partial Rollback scenarios was developed by converting a fraction
of the area in each watershed that was in the developed land covers (not forest or wetland) to forested land cover. That means that the same fraction of impervious, pervious developed, agriculture, and open land is changed throughout the watershed. In some areas greater reductions in mass of phosphorus for each unit of land converted are achieved and in other areas less is achieved. But similarly a mass of phosphorus entering the lake may affect the dissolved oxygen differently based on where it enters the lake.
2. It suggests a useful measure of progress. Treatment of stormwater to remove the fraction of
phosphorus necessary is not proven. Instead it is anticipated that restoring natural hydrology through storage and infiltration will be used as a source-control measure to prevent phosphorus from entering stormwater. An allocation that focuses on how many acres remain that need retrofitting with enhanced storage and infiltration could provide a more useful and uniform tool to measure progress.
The results of the Partial Rollback analysis are shown in Figures 29 and 30. As can be seen in the figures, there is no oxygen deficit and the scenarios therefore are in compliance with the standards. These two scenarios indicate that the loading capacity of Lake Whatcom is 14.15 kg/day total phosphorus as an annual average, or between 524 and 563 developed acres that generate phosphorus loading at 2003 levels, depending on where development occurs and where the developed acres are reduced through nutrient pollution-control strategies. This represents an 85.5% reduction in developed acres from the Base scenario, and a 94.6% reduction in developed acres in the Full Buildout scenario. An example of how the concept of actual developed acres might be translated into developed acres that generate phosphorus loading at 2003 levels is given in an EPA work plan related to the Lower Charles River nutrient TMDL in Massachusetts (EPA, 2008). In the plan, pollution- control strategies are evaluated for their ability to remove phosphorus based on the design size of the strategy. Figure 32 shows that a strategy to infiltrate a 1.6 inch precipitation event would reduce phosphorus on Type B soils by 90%. If this type of pollution-control strategy were in place for a road or a roof, only 10% of the actual acres would count as developed acres that generate total phosphorus loading at 2002-03 levels. Different scenarios have a different distribution of where the loading enters the lake. Under Partial Rollback from Full Buildout, development is spread more widely in the basin. The reductions necessary are slightly higher, but the total developed acres that generate phosphorus loading at 2003 levels are also higher. To a small extent, this may occur because development in Basin 3 is farther from the more sensitive Basin 1. A more significant factor may be that more of the developed acres are in the agricultural and open land classes.

Lake Whatcom Watershed Total Phosphorus and Bacteria TMDLs: WQ Study Findings Page 71
Process for determining Load and Wasteload Allocations and Implementation Approach for setting allocations As discussed under the Loading Capacity section, this report provides two scenarios, derived from Base and Full Buildout conditions that bracket the ultimate loading capacity and pollutant allocations. Ecology is not recommending Load or wasteload allocations at this time. After publication of this report, Ecology will begin a process to finalize a TMDL and develop an Summary Implementation Strategy. During this process, Ecology will work with its local partners to determine the scenario that is most feasible to implement. Ecology will determine the final loading capacity and allocations from that process. The purpose of the TMDL is to meet the requirements of state and federal law to correct water quality impairments, but more than that, Ecology wants to work with local governments to solve real water quality problems. If no action were taken to implement a TMDL and control phosphorus loading to the lake, continued deterioration of the lake will occur. This could lead ultimately to conditions such as blue-green algae blooms and fish kills that make use of the lake for drinking water, recreation, and fisheries difficult. In general, wasteload allocations are provided to National Pollutant Discharge Elimination System (NPDES) discharges, while load allocations are provided to all other pollutant sources within the loading capacity. In this TMDL, wasteload allocations will be provided to address the Phase II Municipal Stormwater Permits for the City of Bellingham and Whatcom County (Table 11) as well as Construction sites covered by NPDES permits. The modeling of loading is aggregated to watershed drainage as defined by the WRIA 1 Watershed Management Project. Ecology committed to local governments to separate allocations to those same drainages as the TMDL study was developed. In Table 11, the phrase “Consistent with subbasin allocation, based on point of stormwater discharge” means that the wasteload allocation will be consistent with the total allocation made for the drainage that receives the stormwater, in proportion to the area covered by the permit.
Table 11. Facilities Which Will Receive Wasteload Allocations.
Permit Number Facility Name Permit Type Wasteload Allocation
WAR04-5550 City of Bellingham General Permit Storm
Water Municipal Consistent with subbasin allocation, based on point of stormwater discharge
WAR04-5557 Whatcom County
Consider a stormwater source that discharges into Silver Beach Creek. It would receive a wasteload allocation consistent with the allocations made to the Hillsdale drainage proportional to the area covered by the permit. All other sources of phosphorus loading will be provided load allocations to cover the balance of the allocation for the drainage.

Lake Whatcom Watershed Total Phosphorus and Bacteria TMDLs: WQ Study Findings Page 72
This study does not separate phosphorus loading, or developed acres that generate phosphorus loading, at 2003 levels as point sources and nonpoint sources. Stormwater runoff is the primary source of nutrient loading, and falls into both point source and nonpoint source categories separated only by whether or not NPDES permit coverage is required for the discharge. It is assumed that all sources will control stormwater runoff contamination to meet either wasteload allocation or load allocations. If the City of Bellingham and Whatcom County provide reasonable assurance that sources that are not part of their Municipal NPDES Stormwater permit will be reduced at the same level as the sources that are part of their permit, both the wasteload allocation and the load allocation are equal to the percent reduction to meet the loading capacity. Each separately evaluated discharge is expected to meet its respective allocations. Ecology recognizes that there are limits to what both the city and county can do to guarantee changes to existing privately owned development. However, the local governments have the best tools for reducing nonpoint sources located within their jurisdictional boundaries through their land use control authority. An essential part of reasonable assurance is a commitment from the city and county to use these tools (for example, by passing ordinances that require best management practices or treatment of discharges from private storm drainage systems). Therefore it is assumed that the wasteload allocations will be dependent on reductions in load allocations being met, and reasonable assurance must be provided that the reductions necessary to meet the load allocations will be made. If reasonable assurance cannot be provided that the load allocations can be met, the wasteload allocations will need to be reduced further. The main method of controlling pollution discharged under an NPDES permit for a Municipal Separate Storm Sewer System (also called a Municipal Stormwater permit) is through the development and implementation of a Stormwater Management Plan. The Municipal Stormwater permit only regulates discharges from a municipality’s stormwater system. Therefore, the controls are required only on areas that discharge stormwater into the municipal stormwater system. However, many of the provisions are equally applicable to reducing pollution discharges from nonpoint sources. Program elements such as public education and outreach have essentially the same impact on all stormwater discharges regardless of whether the discharges enter a municipal stormwater system or are discharged directly to a receiving water. Other controls, such as responding to complaints of illicit discharges, are relatively simple to extend from municipal stormwater system discharges to all illicit discharges. The City of Bellingham and Whatcom County, by voluntarily extending their program to cover all areas in their jurisdiction within the watersheds of the affected tributaries, can help provide reasonable assurance that load allocations will be met. Loading and developed acres results Allocations, like loading capacity, will be expressed both in terms of total phosphorus loading and developed acres that generate phosphorus loading at 2003 levels. Table 12 shows the total

Lake Whatcom Watershed Total Phosphorus and Bacteria TMDLs: WQ Study Findings Page 73
phosphorus loading for each watershed – as well as from the Middle Fork Nooksack diversion, groundwater inflows, and precipitation – for the five scenarios. The loading for the five scenarios are shown by category in Figure 33, and pie charts showing the loading in Table 12 for each scenario are presented in Figures 34-38. Final load allocations will likely look like the Partial Rollback scenarios, following an approach that expresses load allocations in terms of developed acres that generate phosphorus loading at 2003 levels and the loading generated by those acres. However, the proportion of loading allocated to each subbasin will depend on the implementation strategy selected and how it will address existing development versus new development. The city and county will identify where new development will take place and how it will control loading. They will each also identify where existing development will be altered to control loading. This will be used to generate the loading that is used to establish the TMDL. The loading capacity of the lake will be divided among the subbasins. The loading capacity allocated to the subbasin will then be divided into a load allocation and wasteload allocation to the City of Bellingham and Whatcom County as appropriate. Ecology will determine final allocations and a Summary Implementation Strategy through consultation with local partners prior to the completion and submittal of the TMDL. That determination will be based on the set of pollution-control strategies selected and how they are applied to both existing and future developed acres. Figure 39 shows the modeled phosphorus loading from each tributary subbasin for the Base and Full Buildout scenarios with the proportions that originate from each land-use category. The relative development of the drainages tributary to Basin 1, such as Hillsdale and Mill Wheel, can be seen from the high proportion of impervious and pervious developed land uses. This graph also shows the relatively undeveloped state of watersheds like Brannian and Smith, and how total phosphorus loading greatly increases with the development of watersheds like Austin and South Bay. The loading level of the Full Rollback scenario is also indicated on the graph. Figure 40 shows modeled phosphorus loading by tributary and land use in a different format. In this figure, loading has been divided by the Full Rollback loading, so that Brannian and Smith are about at 1.0, since they are relatively undeveloped, and highly developed basins like Cable and Bloedel have loading ratios over 6 for the Base scenario and exceeding 10 for Full Buildout. The effect of development on increasing total phosphorus loading over Full Rollback levels is demonstrated vividly by this graph.
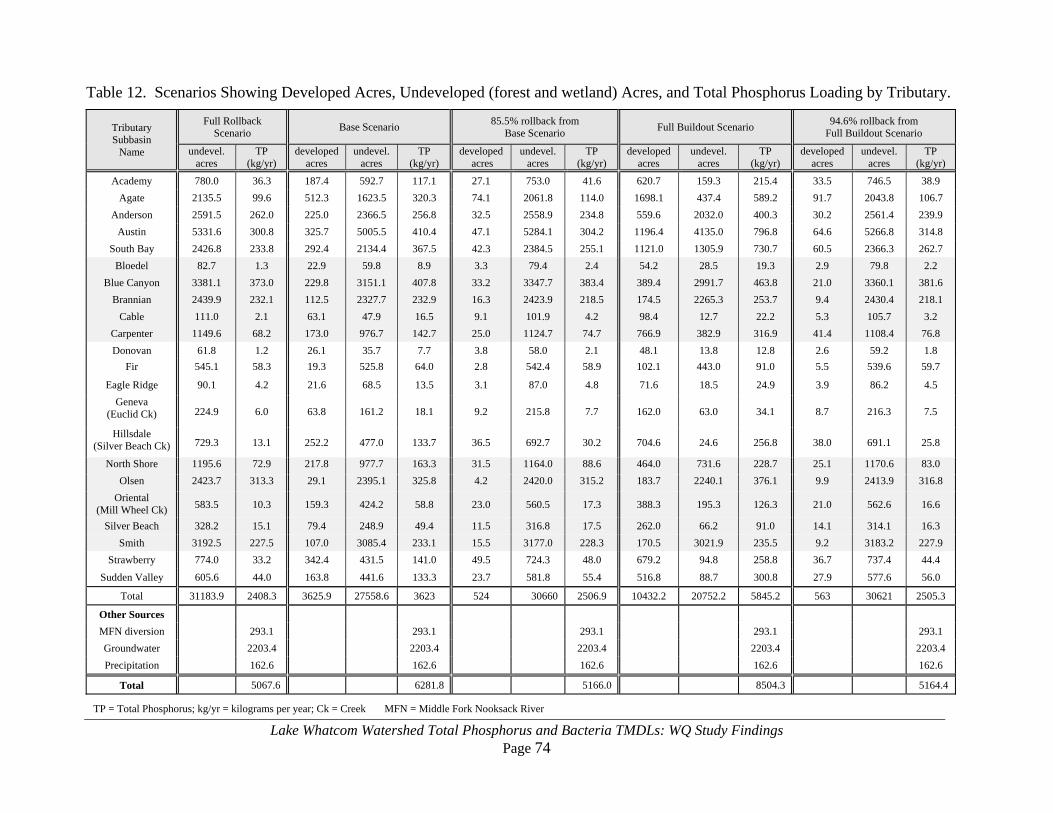
Lake Whatcom Watershed Total Phosphorus and Bacteria TMDLs: WQ Study Findings Page 74
Table 12. Scenarios Showing Developed Acres, Undeveloped (forest and wetland) Acres, and Total Phosphorus Loading by Tributary.
Tributary Subbasin
Name
Full Rollback Scenario Base Scenario 85.5% rollback from
Base Scenario Full Buildout Scenario 94.6% rollback from Full Buildout Scenario
undevel. acres
TP (kg/yr)
developed acres
undevel. acres
TP (kg/yr)
developed acres
undevel. acres
TP (kg/yr)
developed acres
undevel. acres
TP (kg/yr)
developed acres
undevel. acres
TP (kg/yr)
Academy 780.0 36.3 187.4 592.7 117.1 27.1 753.0 41.6 620.7 159.3 215.4 33.5 746.5 38.9 Agate 2135.5 99.6 512.3 1623.5 320.3 74.1 2061.8 114.0 1698.1 437.4 589.2 91.7 2043.8 106.7
Anderson 2591.5 262.0 225.0 2366.5 256.8 32.5 2558.9 234.8 559.6 2032.0 400.3 30.2 2561.4 239.9 Austin 5331.6 300.8 325.7 5005.5 410.4 47.1 5284.1 304.2 1196.4 4135.0 796.8 64.6 5266.8 314.8
South Bay 2426.8 233.8 292.4 2134.4 367.5 42.3 2384.5 255.1 1121.0 1305.9 730.7 60.5 2366.3 262.7 Bloedel 82.7 1.3 22.9 59.8 8.9 3.3 79.4 2.4 54.2 28.5 19.3 2.9 79.8 2.2
Blue Canyon 3381.1 373.0 229.8 3151.1 407.8 33.2 3347.7 383.4 389.4 2991.7 463.8 21.0 3360.1 381.6 Brannian 2439.9 232.1 112.5 2327.7 232.9 16.3 2423.9 218.5 174.5 2265.3 253.7 9.4 2430.4 218.1
Cable 111.0 2.1 63.1 47.9 16.5 9.1 101.9 4.2 98.4 12.7 22.2 5.3 105.7 3.2 Carpenter 1149.6 68.2 173.0 976.7 142.7 25.0 1124.7 74.7 766.9 382.9 316.9 41.4 1108.4 76.8 Donovan 61.8 1.2 26.1 35.7 7.7 3.8 58.0 2.1 48.1 13.8 12.8 2.6 59.2 1.8
Fir 545.1 58.3 19.3 525.8 64.0 2.8 542.4 58.9 102.1 443.0 91.0 5.5 539.6 59.7
Eagle Ridge 90.1 4.2 21.6 68.5 13.5 3.1 87.0 4.8 71.6 18.5 24.9 3.9 86.2 4.5 Geneva
(Euclid Ck) 224.9 6.0 63.8 161.2 18.1 9.2 215.8 7.7 162.0 63.0 34.1 8.7 216.3 7.5
Hillsdale (Silver Beach Ck) 729.3 13.1 252.2 477.0 133.7 36.5 692.7 30.2 704.6 24.6 256.8 38.0 691.1 25.8
North Shore 1195.6 72.9 217.8 977.7 163.3 31.5 1164.0 88.6 464.0 731.6 228.7 25.1 1170.6 83.0 Olsen 2423.7 313.3 29.1 2395.1 325.8 4.2 2420.0 315.2 183.7 2240.1 376.1 9.9 2413.9 316.8
Oriental (Mill Wheel Ck) 583.5 10.3 159.3 424.2 58.8 23.0 560.5 17.3 388.3 195.3 126.3 21.0 562.6 16.6
Silver Beach 328.2 15.1 79.4 248.9 49.4 11.5 316.8 17.5 262.0 66.2 91.0 14.1 314.1 16.3 Smith 3192.5 227.5 107.0 3085.4 233.1 15.5 3177.0 228.3 170.5 3021.9 235.5 9.2 3183.2 227.9
Strawberry 774.0 33.2 342.4 431.5 141.0 49.5 724.3 48.0 679.2 94.8 258.8 36.7 737.4 44.4
Sudden Valley 605.6 44.0 163.8 441.6 133.3 23.7 581.8 55.4 516.8 88.7 300.8 27.9 577.6 56.0
Total 31183.9 2408.3 3625.9 27558.6 3623 524 30660 2506.9 10432.2 20752.2 5845.2 563 30621 2505.3
Other Sources MFN diversion 293.1 293.1 293.1 293.1 293.1 Groundwater 2203.4 2203.4 2203.4 2203.4 2203.4 Precipitation 162.6 162.6 162.6 162.6 162.6
Total 5067.6 6281.8 5166.0 8504.3 5164.4
TP = Total Phosphorus; kg/yr = kilograms per year; Ck = Creek MFN = Middle Fork Nooksack River

Lake Whatcom Dissolved Oxygen and Total Phosphorus TMDL: WQ Study Finding Page 75
Figure 41 shows total phosphorus loading for each tributary subbasin and land use for two Partial Rollback scenarios. For these scenarios, the loading is only slightly over Full Rollback loading, representing the 0.2 mg/L allowable dissolved oxygen deficit. Figure 42 shows the same data as ratios to Full Rollback loading. For these scenarios, the developed basins may have ratios slightly over 2, but far less than the Base and Full Buildout levels. These figures show that phosphorus loading from pervious developed land uses is greater than loading from impervious developed land uses. Mathematically, this is occurring both because the watershed land use covers have almost three times more pervious developed acreage than impervious developed acreage, and also because the model has pervious developed acreage releasing between 20% and 30% more phosphorus per acre than impervious. However, calibration was at a drainage scale, and the ratio of impervious-to-pervious areas and land-use phosphorus release rates were estimated, not directly measured. The purpose of distinguishing impervious area is to provide for the pollutant pathways that do not have an opportunity for infiltration. What we learn from the figures is that both the pervious and impervious areas are significant contributors. This is consistent with measurements from other sites. The knowledge gained in recalibrating the model and examining the areas of uncertainty that remain indicates that aggressive implementation will be required. The implementation necessary is so aggressive that over the next decade virtually all resources available will be necessary. If the TMDL targets were considerably less stringent or more stringent, the same resources would still be necessary. At the end of the first decade of implementation, we will be in a much better position to refine the models and reevaluate how much more work will be necessary to complete implementation. Delaying implementation of the TMDL exposes Lake Whatcom to the risk of an irreversible downward slide. As noted, a significant source of phosphorus is released from sediments during the period when the hypolimnion is anoxic. This sets up a positive feedback loop. Phosphorus released from the sediments fertilizes the lake making it more productive. This increases the rate at which oxygen is depleted after the lake stratifies. Currently this phenomenon is primarily active in Basin 1 and 2, a relatively small volume of the lake. If the lake were to decline to the point where it was a major factor in Basin 3, the lake may take much longer to recover. Allocation for future growth This study shows that the discharges in the years 2002-2003 exceeded the loading capacity. Reductions from the 2002-03 loading levels are necessary to meet water quality standards. Therefore allocations for future growth will need to be accommodated by additional reductions in existing sources. The Full Buildout scenario was designed to evaluate the reductions necessary to accommodate future growth. The growth that has taken place since 2003 places current conditions in the Lake Whatcom watershed somewhere between the Base and the Full Buildout scenarios. It is up to

Lake Whatcom Dissolved Oxygen and Total Phosphorus TMDL: WQ Study Finding Page 76
the city and the county to determine how much effort should go into reducing existing sources of pollution to accommodate future growth. The answer to the question of how to balance demands for reduction from existing sources with demands to accommodate additional sources can be reached many ways. Following are three examples:
1. Identify how much growth needs to be accommodated and how much impact it will have, and then determine if a plan can be developed that will achieve the reductions from the existing development.
2. Determine the reductions in pollutant discharges from existing development that are desired to accommodate growth, and then any remaining capacity between desired loading levels and the loading capacity can be allocated to growth.
3. Have a tentative identification of the balance between reductions of existing development and future growth, and then use a process similar to water quality trading to alter that balance in the future. In such a scenario, new development not included in a load allocation could be included in the allocation by offsetting their pollution through reductions in existing sources beyond those required in the TMDL. Some reasonable assurance would need to be provided that the reduction in existing sources would more than offset the new source. Working out the rules and allowances involved would be a lengthy process and will not likely be achieved before a TMDL must be submitted. However it does provide some flexibility to adapt to changing priorities in the future.
Margin of safety The federal Clean Water Act requires that TMDLs be established with margins of safety (MOS). The MOS accounts for uncertainty in the available data, or the unknown effectiveness of the water quality controls that are put in place. The MOS can be stated explicitly (e.g., a portion of the load capacity is set aside specifically for the MOS). But implicit expressions of the MOS are also allowed, such as conservative assumptions in the use of data, application of models, and the effectiveness of proposed management practices. This TMDL includes an implicit MOS based on conservative assumptions used in determining pollutant loading targets. This includes focusing on protecting the most sensitive portions of the lake (the critical location in the basin) during the water quality analysis. The deepest areas of Basin 1 show the greatest dissolved oxygen deficits. Protection of this area will protect all other parts of the lake. Deficits in Basin 3 have been evaluated, which confirmed that protection for Basin 1 is more than adequate to protect Basin 3. Due to the complexity of the system analyzed and the models used to develop this TMDL, the focus has been on producing an accurate model, and opportunities for conservative assumption have been limited. An adaptive implementation approach is proposed to address uncertainty and contribute to the margin of safety.

Lake Whatcom Dissolved Oxygen and Total Phosphorus TMDL: WQ Study Finding Page 77
EPA defines adaptive implementation as: an iterative implementation process that makes progress toward achieving water quality goals while using any new data and information to reduce uncertainty and adjust implementation activities (EPA, 2006). The approach was first proposed in a report by the National Research Council (2001), which suggested that adaptive implementation include immediate actions, an array of possible long-term actions, success monitoring, and experimentation for model refinement. This concept describes a process where: 1. Limitations in information about the pollution problem and effectiveness of implementation
are identified. 2. Monitoring and modeling are designed to narrow those data gaps. 3. Implementation is modified in response to improved information. The specific features of adaptive implementation for this TMDL will include the monitoring program discussed below and the Summary Implementation Strategy that will be included in the TMDL submittal report. The best available information about the effectiveness of pollutant-control practices can be used for establishing implementation to meet surrogate measure targets for developed acreage. The information about effectiveness will need to be refined as implementation occurs. This refinement is expected to provide valuable information about the costs and efficiency of implementation activities over time. Reference information about the effectiveness of stormwater pollutant-control practices (sometimes called Best Management Practices, or BMPs) for various pollutants can be found at www.epa.gov/npdes/urbanbmptool. Monitoring An adequate and effective monitoring program is critical to the implementation of the dissolved oxygen TMDL. The issues with Lake Whatcom nutrient loading and dissolved oxygen levels are particularly complex due to the nonpoint nature of the nutrient sources and the complexity of lake hydrodynamics and water quality processes. On-going monitoring of the lake itself is critical, and the continuation of the existing lake monitoring program should be adequate. A long-term record of the water quality parameters collected under the program will help to determine whether dissolved oxygen degradation has been halted and reversed, and will allow for future modeling of the lake. Monitoring of nutrient loading from the watershed is particularly critical for implementation of the TMDL. The monitoring conducted for this study under the Project Plan (Cusimano et al., 2002) was based on the information, protocols, and resources available at that time. Analysis of monitoring conducted to date shows that tributary monitoring can be improved. Monthly sampling of single nutrient grabs falls short of the ideal monitoring program to effectively characterize nutrient loading. Periodic grabs should occur at greater frequency, such as biweekly or weekly. Flow-weighted sampling over storm events should supplement the periodic monitoring.

Lake Whatcom Dissolved Oxygen and Total Phosphorus TMDL: WQ Study Finding Page 78
Some of this work has been started by Whatcom County and the City of Bellingham. Coordination of monitoring and program planning between the county, city, and Ecology will continue. An example of a more intensive tributary monitoring program is the Occoquan Watershed Monitoring Program in Virginia (VDEQ, 2006; OWML, 2003). Similar to Lake Whatcom, a TMDL has been developed for dissolved oxygen impairments in several watersheds using an HSPF watershed model linked to a CE-QUAL-W2 reservoir model. Baseflow samples are collected on the tributaries weekly, and automated flow-weighted composite storm-flow samples are collected during rainfall events. A third area of monitoring is for the effectiveness of pollutant-control practices (best management practices) identified as part of the pollutant-control strategies. Specific practices intended to control nutrient loading should be evaluated at the field-scale for specific land uses, either at the subwatershed or parcel level. The final area of monitoring is focused on implementation. Measurable targets need to be developed on how much of a given activity needs to take place over what period of time for effective implementation. So for instance, if retrofit of public roads is selected as an implementation strategy, the surface area addressed with retrofits meeting the applicable standards may be the identified target, which will need to be monitored on some frequency. Similarly, the amount of developed area added will need to be monitored to ensure that it is not growing faster than the amount of pollution reduction implemented for development. To integrate these monitoring efforts, a comprehensive watershed and lake monitoring plan is recommended to help identify and prioritize the data needs for an adaptive implementation approach. A comprehensive plan can help improve efficiency and focus among the various entities involved in monitoring, and provide a basis for obtaining funding for monitoring.
Bacteria Analytical framework Because the water quality standards for fecal coliform bacteria provide two criteria for compliance, a method is needed to ensure that bacteria reduction targets are set that meet both. The method used for Lake Whatcom tributaries was the statistical rollback method (Ott, 1995). The Ott statistical rollback method simply compares monitoring data to criteria, and the difference is the percent change needed to meet both criteria. This approach has been used in many other TMDLs in Washington, and the methodology is well-documented (e.g., Joy and Swanson, 2005; Ahmed and Rountry, 2007). Note that the Ott statistical rollback method described here for the bacteria analysis is different from the rollback method described elsewhere in this report for the analysis of land uses, phosphorus, and dissolved oxygen. Also, the HSPF and CE-QUAL-W2 models were not used for the bacteria TMDL analysis.

Lake Whatcom Dissolved Oxygen and Total Phosphorus TMDL: WQ Study Finding Page 79
The distribution of fecal coliform concentrations measured at a station over time is assumed to follow a log-normal distribution. Thus, log-normal distribution properties can be used to estimate the geometric mean and 90th percentile bacterial concentrations. (The 90th percentile value of samples is used in TMDL evaluations for the “not more than 10% of all samples” criteria statistic.) The rollback method assumes that the coefficient of variation will remain constant. This means that reductions in the geometric mean will be matched by reductions in the 90th percentile. In large watersheds affected by nonpoint sources, this has been show to be a reasonable assumption. When the estimated geometric mean or 90th percentile value is higher than its criterion, the target reductions are simply estimated by rolling back the estimated geometric mean or 90th percentile concentrations (whichever is most restrictive) to the respective water quality standards. A detailed description of the analytical method is provided in Appendix F. To calculate the annual fecal coliform loads, a Beales ratio estimator formula (Dolan et al., 1981) was used at sites with adequate pollutant and streamflow data (Appendix F). The Beales formula provides a better annual or seasonal estimate of pollutant loads compared to the average instantaneous load obtained from a few sampling events. The average instantaneous load was calculated when continuous discharge data were absent or could not be estimated from nearby gaging data. Fecal coliform data collected in 2002 and 2003 from Lake Whatcom tributaries were analyzed to determine compliance with standards, allowable concentrations and loads, and required load reduction targets. Excel® spreadsheets were used to evaluate the data, including statistical analyses and plots. In this study, the critical seasons for each tributary were (1) the dry season of May through October when direct non-stormwater source to water dominate the system, and (2) the wet season of November through April when stormwater runoff sources may dominate the system. Data for each tributary were evaluated using these two critical seasons, and separate bacteria reduction targets and allocations were established for each season. Nine creeks and two storm drains were evaluated for the TMDL. All tributaries were found to not meet fecal coliform bacteria standards. Only Silver Beach Creek was listed on the 2006 303(d) list, but seven other tributaries are proposed to be included on the 2008 303(d) list. Lake Whatcom itself is not included because bacteria levels are low and comply with standards. The seasonal geometric means and highest tenth percentiles for each tributary are shown in Table 13. The values which are out of compliance with the standards are indicated, as well as the 303(d) listing status.

Lake Whatcom Dissolved Oxygen and Total Phosphorus TMDL: WQ Study Finding Page 80
Table 13. Lake Whatcom Tributaries 2002-03 Fecal Coliform Concentrations.
Tributary
Dry Season (May-Oct) Wet Season (Nov-Apr)
Listing Basis Geometric
Mean (cfu/
100 mL)
Highest Tenth %
(cfu/ 100 mL)
Geometric Mean (cfu/
100 mL)
Highest Tenth % (cfu/100
mL) Criteria 50 100 50 100
Anderson Ck 7 62 54 402 On Candidate 2008 303(d) list Austin Ck 28 204 115 658 On Candidate 2008 303(d) list
Brannian Ck 4 13 50 158 On Candidate 2008 303(d) list Cable St Drain 10 251 28 961 On Candidate 2008 303(d) list Carpenter Ck 15 125 69 224 On Candidate 2008 303(d) list
Euclid Ck 53 433 43 199 On Candidate 2008 303(d) list Mill Wheel Ck 152 390 542 1307 On Candidate 2008 303(d) list
Olsen Creek 6 50 47 214 On Candidate 2008 303(d) list Park Place Drain 312 1247 237 1319 Unlisted, fails to meet standards Silver Beach Ck 139 806 836 2704 On 2004 303(d) list
Smith Creek 4 27 50 165 On Candidate 2008 303(d) list Values exceeding standards in Bold Italic.
Data from the critical seasons were then evaluated to determine the geometric mean, 90th percentile, and percent reduction required to meet standards. Load allocations were then determined using the Beale’s estimator. TMDL bacteria reduction targets do not replace the water quality criteria. The targets are established as a best estimate of what is necessary to meet the most stringent part of the water quality criteria. Any waterbody with fecal coliform TMDL targets is expected to meet both the applicable geometric mean and ‘not more than 10% of the samples’ criteria, and also to meet beneficial uses for the category. Loading capacity EPA regulations define loading capacity as the greatest amount of pollutant loading that a waterbody can receive without violating water quality standards [40CFR§130.2(f)]. The loading must be expressed as mass-per-time, and may also be expressed as concentrations or other appropriate measure. Also, the critical conditions that cause water quality standard violations must be considered when determining the loading capacity. Washington State fecal coliform bacteria TMDLs use a combination of mass-per-time units and statistical concentration targets to define loading capacities. This is necessary since mass-per-time units (loads) do not adequately define periods of fecal coliform criteria violations. Bacteria sources are quite variable, and different sources can cause water quality violations at different times (e.g., poor dilution of contaminated sources during low-streamflow conditions or increased source loading during run-off events). Loads are instructive for identifying changes in bacteria source intensity between sites along a river, or between seasons at a site, and the potential impacts on downstream receiving waters.

Lake Whatcom Dissolved Oxygen and Total Phosphorus TMDL: WQ Study Finding Page 81
The statistical targets are referenced in the Washington State fecal coliform criteria and provide a better measure of the loading capacity during the most critical period. The Lake Whatcom tributary fecal coliform loading capacities are the applicable two statistics in the state fecal coliform criteria (e.g., the geometric mean less than 50 cfu/100 ml and no more than 10% of the samples may exceed 100 cfu/100 ml). Table 14 shows the calculated geometric mean and 90th percentile target for the two critical seasons for each tributary. For all tributaries, the 90th percentile target was the limiting criterion, and therefore the geometric mean targets are all below the criterion in the standards. Therefore the fecal coliform TMDL target loading capacities in the Table 14 are either the criteria or statistics that estimate the reductions necessary to meet the criteria. The fecal coliform percentage reduction targets in Table 14 indicate the relative degree to which the waterbody is out of compliance with criteria (i.e., how far it is over its capacity to receive fecal coliform source loads and still provide the designated beneficial uses). Sites that require aggressive reductions in fecal coliform sources will have a high percentage reduction value, while sites with minor problems will have a low percentage reduction value. The target reductions often result in a geometric mean target that is more stringent than the geometric mean in the water quality criteria. The targets represent the estimated geometric mean when pollution sources are controlled sufficiently so that no more than 10% of the samples exceed 100 cfu/100 ml. As the sources that contribute to the highest concentrations are removed, the average will drop as well. Implementation is a process of source identification and control, followed by monitoring a long- term decline in fecal coliform concentrations. When sources cannot be clearly identified from direct observation, microbial source tracking is a potentially useful tool to confirm which organisms (humans or animal) are the likely sources of bacteria. Table 14 includes loading capacity and statistical values for the two critical seasons, these data will provide water quality managers with a sense of when and what kind of bacteria sources are creating criteria violations. Stormwater is assumed to have a greater potential to increase fecal coliform loads during the wet season. High fecal coliform loads in the dry season suggests sources that are discharging directly to the stream, such as animal access, stormwater system baseflows, or failing septic systems. Dry season violations also indicate greater public health concerns if people are swimming or playing in the creeks at the time of elevated bacteria.

Lake Whatcom Dissolved Oxygen and Total Phosphorus TMDL: WQ Study Finding Page 82
Table 14. Lake Whatcom Tributaries Fecal Coliform Load Allocations.
Tributary Geometric
Mean (cfu/100 mL)
Highest Tenth %
(cfu/100 mL)
Load Allocation (cfu/day)
Reduction (%)
Wet Season Targets (November-April) Anderson Creek 50 100 1.5E+10 0% Austin Creek 14 100 1.2E+10 -51% Brannian Creek 50 100 1.4E+08 0% Cable Street Drain 4 100 --1 -60% Carpenter Creek 12 100 1.3E+09 -20% Euclid Creek 12 100 6.2E+08 -77% Mill Wheel Creek 39 100 1.2E+09 -74% Olsen Creek 50 100 9.3E+09 0% Park Place Drain 25 100 --1 -92% Silver Beach Creek 17 100 1.6E+09 -88% Smith Creek 50 100 4.3E+08 0% Dry Season Targets (May-October) Anderson Creek 13 100 9.0E+09 -75% Austin Creek 17 100 1.3E+10 -85% Brannian Creek 31 100 4.9E+08 -37% Cable Street Drain 3 100 --1 -90% Carpenter Creek 31 100 1.2E+09 -55% Euclid Creek 22 100 7.6E+08 -50% Mill Wheel Creek 42 100 1.1E+09 -92% Olsen Creek 22 100 1.2E+10 -53% Park Place Drain 18 100 --1 -92% Silver Beach Creek 31 100 1.6E+09 -96% Smith Creek 31 100 7.5E+08 -39%
1No flows available for calculating loads.

Lake Whatcom Dissolved Oxygen and Total Phosphorus TMDL: WQ Study Finding Page 83
Load and wasteload allocations This TMDL technical evaluation of the Lake Whatcom tributaries demonstrated that high bacteria levels were impairing extraordinary primary contact recreation in all the tributaries that were investigated, and that fecal coliform load reductions are necessary. Like the loading capacity, Load and wasteload allocations will be presented as mass-per-unit-time, concentrations, and target reductions. Table 14 shows the total allocations recommended for each tributary (equal to the loading capacity) and the target percent reductions needed to meet standards. In TMDLs, wasteload allocations are set for point sources and load allocations are set for nonpoint sources. The study did not separate point sources and nonpoint sources of bacteria. Stormwater runoff is the primary source of contamination in the wet season, and falls into both point source and nonpoint source categories separated only by whether or not NPDES permit coverage is required for the discharge. It is assumed that all sources will control stormwater runoff contamination to meet either wasteload or load allocations. All allocations are equal to the percent reduction to meet the loading capacity. Each separately evaluated discharge is expected to meet the criteria. Therefore it is assumed that the wasteload allocations are dependent on reductions identified in load allocations being met, and reasonable assurance must be provided that the reductions necessary to meet the load allocations will be made. In this case, the point sources will be the City of Bellingham and Whatcom County, as part of their Phase II Municipal Stormwater Permit. The central means of controlling pollution discharged under the permit is the development and implementation of a Stormwater Management Plan. The Municipal Stormwater Permit only regulates discharges from a municipality’s stormwater system. Therefore the controls are required only on areas that discharge stormwater into the municipal stormwater system. However, many of the provisions are equally applicable to reducing pollution discharges from nonpoint sources. Program elements such as public education and outreach have essentially the same impact on all stormwater discharges regardless of whether they enter a municipal stormwater system or are discharged directly to a receiving water. Others, such as responding to complaints of illicit discharges, are relatively simple to extend from municipal stormwater system discharges to all discharges. The City of Bellingham and Whatcom County, by voluntarily extending their program to cover all areas in their jurisdiction within the watersheds of the affected tributaries, will provide reasonable assurance that load allocations are met. All dischargers covered by NPDES permits that fall under the wasteload allocations must meet the required reductions for the drainage in which their stormwater is discharged. The municipal stormwater dischargers (Table 11) will have wasteload allocations based on which drainage

Lake Whatcom Dissolved Oxygen and Total Phosphorus TMDL: WQ Study Finding Page 84
receives the stormwater. For NPDES permits such as those for stormwater associated with construction activity, not all permits that may need a wasteload allocation in the future can be identified. Any NPDES permit that addresses runoff contributing to a load allocation will be allocated a wasteload allocation equivalent to the load allocation it replaced. Both the wasteload and load allocations expressed as percent reductions will be the same for each tributary. The allocations are based on the density of bacteria in stormwater runoff. If an area of land is converted to a use that requires coverage under an NPDES discharge permit, the associated load allocation is retired and an equivalent wasteload allocation is available to the discharger. The geometric mean will be used to measure progress towards attaining the allocated percent reduction. Allocation for future growth Since all tributaries fail to meet standards, no allocation for future growth is provided. Additional sources would only be accommodated through additional reductions in existing sources. Margin of safety As described earlier for dissolved oxygen, a margin of safety (MOS) can be explicit or implicit. Implicit MOS elements were applied to analyses to provide a large MOS for the Lake Whatcom tributaries fecal coliform TMDL evaluation. The fecal coliform database in most areas of the basin was limited, so this increased the level of uncertainty in the fecal coliform loads and receiving water quality. The fecal coliform reductions and allocations are conservatively set to protect human health and beneficial uses to the fullest extent. The following are conservative assumptions that contribute to the MOS:
• The statistical rollback method was applied to fecal coliform data for critical seasons, and the resultant TMDL targets for fecal coliform load reductions are more stringent than would be required under the listed Washington State Extraordinary Primary Contact fecal coliform criteria (i.e., the geometric mean of 50 and no more than 10% of samples to exceed 100 cfu/100 ml.).
• Since the variability in fecal coliform concentrations during low-flow conditions is usually quite high, the TMDL targets and percent reduction estimated by the statistical rollback method are conservative, especially if a 90th percentile is the critical criterion.
Monitoring Two types of monitoring are recommended for the City of Bellingham and Whatcom County to pursue as part of bacterial TMDL implementation:
• Monitoring of the effectiveness of specific pollutant-control practices (sometimes called Best Management Practices) will help assess which control measures are working the best.

Lake Whatcom Dissolved Oxygen and Total Phosphorus TMDL: WQ Study Finding Page 85
• Long-term monitoring of tributaries listed in Table 13 will assess whether the TMDL implementation has been effective at reducing bacteria levels and meeting standards.
• If no additional sources can be identified, microbial source tracking may be necessary. Bacteria monitoring should focus on the critical seasons identified in Table 13.

Lake Whatcom Dissolved Oxygen and Total Phosphorus TMDL: WQ Study Finding Page 86
Public Participation During model development, Ecology received input from the local governments through participation and discussion at the Lake Whatcom Management Data Team meetings. At these monthly meetings, Ecology presented a brief status report and solicited opinions on direction. The tribes were also consulted at major milestones, such as how the model results should be used to assess compliance with water quality standards. In 2005 the CE-QUAL-W2 calibration was reviewed by local governments. Presentations were given to staff and at a Joint Council/Commission meeting of the Lake Whatcom Management Team, briefing them on the results. Based on comments received during that period, the CE-QUAL-W2 model was revised, and the HSPF model was developed. A draft technical study was reviewed by the local governments in April 2008. Minor revisions to the model were made prior to the public review draft. As a result of comments during the public review period (August 18 through September 17, 2008) an additional scenario that examines the effects of decreasing the water withdrawn by the city of Bellingham to supply Georgia Pacific industrial use was added, and language was clarified. Ecology’s responses to public comments are summarized in Appendix H.

Lake Whatcom Dissolved Oxygen and Total Phosphorus TMDL: WQ Study Finding Page 87
Conclusions The following conclusions were drawn as a result of this TMDL study:
Dissolved oxygen and total phosphorus • Lake Whatcom is a highly complex system in which dissolved oxygen levels decrease as
nutrient (phosphorus) loads increase over time.
• Watershed and lake models were developed, calibrated, and reviewed. These models are deemed adequate for the development of a TMDL for dissolved oxygen in Lake Whatcom.
• Modeling of pre-development watershed conditions provides a baseline for watershed phosphorus loading and lake dissolved oxygen. This baseline is used for evaluation of compliance with the Washington State water quality standards.
• Modeling of Lake Whatcom with CE-QUAL-W2, and its watershed with HSPF, shows that land use changes from full development of the watershed without controls on phosphorus loading will cause increased phosphorus loading to the lake, which in turn will degrade oxygen in the lake.
• The lake’s loading capacity for phosphorus was determined and correlated to reductions in developed acreage from the 2003 Base condition and from the Full Buildout condition.
o The loading capacity was found to be 14.15 kg/day (annual average) of phosphorus when reduced from the Base scenario or from the Full Buildout scenario.
o The loading capacity is equivalent to 524 developed acres that generate total phosphorus loading at 2003 levels when reduced from the Base scenario, and 563 developed acres when reduced from the Full Buildout scenario.
o The loading capacity represents an 85.5% reduction of developed acres from Base conditions, and a 94.6% reduction of developed acres from Full Buildout.
Bacteria • Eleven streams and drains that are tributaries to Lake Whatcom were found to not meet
Washington State standards for fecal coliform bacterial contamination during monitoring surveys for this TMDL.
• The statistical rollback method has identified geometric mean bacteria targets that ranged from 4 to 50 cfu/100 mL in the dry season, and from 3 to 42 cfu/100mL in the wet season, corresponding to meeting the 90th percentile exceedance criterion of 100 cfu/100 mL.
• A Beales ratio estimator formula was used to calculate annual fecal coliform loads for allocations based on bacteria loading.
• Bacteria reduction targets from 2003 levels for the 11 tributaries ranged from a 0% to a 92% reduction in the dry season, and from a 37% to a 96% reduction in the wet season.

Lake Whatcom Dissolved Oxygen and Total Phosphorus TMDL: WQ Study Finding Page 88
This page is purposely left blank

Lake Whatcom Dissolved Oxygen and Total Phosphorus TMDL: WQ Study Finding Page 89
Recommendations This report makes the following recommendation on how to develop and implement the TMDLs for Lake Whatcom and the 11 tributaries.
Dissolved oxygen and total phosphorus • Pollutant allocations are recommended for total phosphorus and for developed acres as
shown in Table 12.
• Final allocations and the Summary Implementation Strategy should be developed collaboratively with local governments and citizens.
• Implementation should proceed, focusing on the approaches most readily implemented to reducing phosphorus loading.
• A basin-wide monitoring strategy should be developed to aid in adaptive implementation of the dissolved oxygen TMDL. The strategy should address monitoring of the lake, tributaries, and nutrient delivery from land uses, as well as the effectiveness of pollution-control strategies and practices.
• Types of additional monitoring and research that could potentially improve the watershed and lake models:
o Tributary loading during storm events, including the deposition and resuspension of stream sediments and the impact of channel erosion.
o Phosphorus uptake rates during infiltration of stormwater.
o Local interflow and groundwater phosphorus concentrations.
o Quantification of phosphorus deposition in sediments as groundwater passes though sediments and enters the water column. (Research proposed by Ecology to test procedures for measuring phosphorus attenuation [Pitz, 2008] may provide some information about what may be happening in Lake Whatcom.)
o Instream processes that reduce phosphorus loading in tributaries.
o Lake sediment phosphorus concentrations and exchange rates with the water column.
o Loading from forested areas as a result of management practices and forest succession stages.
o Changes in phosphorus delivery rates from developed lands as a result of different land- use and stormwater management practices.
o Sensitivity analysis of key modeling parameters, such as wind-sheltering coefficient for the lake model, or infiltration rates for the watershed model.

Lake Whatcom Dissolved Oxygen and Total Phosphorus TMDL: WQ Study Finding Page 90
• As implementation progresses, it may be desirable to refine the model by calibrating to smaller, more homogenous subbasins if some basins are not responding to implementation as predicted by the current model.
• Modeling of the watershed and lake models using additional years of data, either as recalibration or for verification, could be helpful to improve and build confidence in the models.
• Improving the watershed and lake models based on new information is an appropriate ongoing task as part of implementation, although it should not be funded at the expense of phosphorus reduction efforts.
Bacteria • Pollutant allocations are recommended for fecal coliform bacteria as shown in Table 14.
• Monitoring results that identify elevated bacteria levels should trigger notification of public health authorities. Consideration of public exposure may help identify high priority locations for ongoing monitoring.
• An Implementation Strategy should be developed collaboratively with local governments and citizens.
• NPDES permittees should agree to voluntarily extend relevant portions of their stormwater management plan to control nonpoint sources of bacteria. This would be to ensure more stringent limits are not needed on the NPDES regulated sources.
• An effectiveness monitoring program should be developed to assess implementation of the bacteria TMDL.

Lake Whatcom Dissolved Oxygen and Total Phosphorus TMDL: WQ Study Finding Page 91
References Ahmed, A. and D. Rountry, 2007. Willapa River Fecal Coliform Bacteria Total Maximum Daily Load. Washington State Department of Ecology, Olympia, WA. Publication No. 07-03-021. www.ecy.wa.gov/biblio/0703021.html Albertson, S.L., K. Erickson, J.A. Newton, G. Pelletier, R.A. Reynolds, and M.L. Roberts, 2002. South Puget Sound Water Quality Study, Phase 1. Washington State Department of Ecology, Olympia, WA. Publication No. 02-03-021. www.ecy.wa.gov/biblio/0203021.html Aubertin, G.M., Bigelow, D.S., Malo, B.A., eds., 1991. Quality Assurance Plan: NADP/NTN Deposition Monitoring. National Atmospheric Deposition Program Office at the Illinois State Water Survey. Champaign, IL. Berger, C.J. and S.A. Wells, 2005. Lake Whatcom Water Quality Model. Technical Report EWR-03-05, Maseeh College of Engineering and Computer Science, Department of Civil and Environmental Engineering, Portland State University, Portland, OR. www.ecy.wa.gov/biblio/0910007.html Berger, C.J. and S.A. Wells, 2007a. Lake Whatcom Model calibration with variable stoichiometry in sediments – REVISED. Memorandum to Paul Pickett and Steve Hood, February 8, 2007. Maseeh College of Engineering and Computer Science, Department of Civil and Environmental Engineering, Portland State University, Portland, OR. www.ecy.wa.gov/biblio/0910008.html Berger, C.J. and S.A. Wells, 2007b. Lake Whatcom Model recalibration. Memorandum to Paul Pickett, Steve Hood, and Karol Erickson, November 16, 2007. Maseeh College of Engineering and Computer Science, Department of Civil and Environmental Engineering, Portland State University, Portland, OR. www.ecy.wa.gov/biblio/0910009.html Berger, C.J., 2008a. Personal communication. Senior Research Associate, Water Quality Research Group, Department of Civil and Environmental Engineering, Portland State University, Portland, OR. Berger, C.J., 2008b. Lake Whatcom Model Calibration. Memorandum to Paul Pickett and Steve Hood, July 25, 2008. Water Quality Research Group, Department of Civil and Environmental Engineering, Portland State University, Portland, OR. www.ecy.wa.gov/biblio/0910006.html Buroker, T., 2007. Personal communications. Water Resources Environmental Specialist, Washington State Department of Ecology, Bellingham, WA. Butcher, J., 2008. Lake Whatcom Models Review. Memorandum to Steve Hood, Paul Pickett, and Dave Ragsdale, April 17, 2008, Tetra Tech, Fairfax, VA. www.ecy.wa.gov/biblio/0910013.html April 2008.

Lake Whatcom Dissolved Oxygen and Total Phosphorus TMDL: WQ Study Finding Page 92
Cadmus and CDM, 2007a. Final Model Report for Lake Whatcom Watershed TMDL Model Project. The Cadmus Group, Inc. and CDM, Bellevue, WA. www.ecy.wa.gov/biblio/0910010.html July 2007. Cadmus and CDM, 2007b. Amendment to Lake Whatcom TMDL Final Model Report - Full Buildout/Rollback Scenarios and Translator. Memorandum from The Cadmus Group, Inc. and CDM, Bellevue, WA, November 30, 2007. www.ecy.wa.gov/biblio/0910011.html November 2007. CDM, 2008. Final Report for Lake Whatcom Watershed TMDL Model Partial Rollback Scenarios. CDM, Bellevue, WA. www.ecy.wa.gov/biblio/0910012.html April 2008. COB, 2007. Personal communication. Geoff Smyth, Operations Supervisor, City of Bellingham, Bellingham, WA. Cohn, T.A., D.L. Caulder, E.J. Gilroy, L.D. Zynjuk, and R.M. Summers, 1992. The validity of a simple statistical model for estimating fluvial constituent loads . An empirical study involving nutrient loads entering Chesapeake Bay. Water Resources Research, v. 28, no. 9, p. 2353-2363. Cook, D., 2005. Personal communication. Dave Cook, LG, Associate, GeoEngineers Inc, Seattle, WA. Cusimano, R.F., S. Hood, and J. Liu, 2002. Quality Assurance Project Plan – Lake Whatcom TMDL Study. Washington State Department of Ecology, Olympia, WA. Publication No. 02-03-074. www.ecy.wa.gov/biblio/0203074.html Delahunt, R., 1990. Lake Whatcom Watershed On-Site Sewage Disposal Survey. Final Report. Whatcom County Health Department, Office of Environmental Health. Bellingham, WA. Dolan, D.M., A.K. Yui, and R.D. Geist, 1981. Evaluation of river load estimation methods for total phosphorus. J. Great Lakes Research, 7(3): 207-214. Erickson, K., 1997. “Comment on 303(d) Listing for Lake Whatcom.” Memorandum to Steve Butkus. October 31, 1997. Washington State Department of Ecology, Olympia, WA. EPA, 1998. Report of the Federal Advisory Committee on the Total Maximum Daily Load (TMDL) Program. Publication EPA 100-R-98-06, U.S. Environmental Protection Agency, Office of the Administrator, Washington, DC. www.epa.gov/owow/tmdl/faca/facaall.pdf EPA, 2001. Overview of Current Total Maximum Daily Load - TMDL - Program and Regulations. U.S. Environmental Protection Agency. www.epa.gov/region1//eco/tmdl/assets/pdfs/NationalTMDLFactSheet.pdf

Lake Whatcom Dissolved Oxygen and Total Phosphorus TMDL: WQ Study Finding Page 93
EPA, 2006. Clarification Regarding "Phased" Total Maximum Daily Loads, Memorandum to Water Division Directors, Regions I – X, from Benita Best-Wong, Director, Assessment and Watershed Protection Division, U.S. Environmental Protection Agency, Washington, D.C., August 2, 2006. www.epa.gov/owow/tmdl/tmdl_clarification_letter.html EPA, 2008. Contract NO. EP-C-05-046, Work Assignment No. 1-52. Region I, U.S. Environmental Protection Agency, Boston, MA, April 2007. Hisch Consulting Services, 1998. Lake Whatcom Watershed-Cooperative Drinking Water Protection/Sampling. Narrative Description and Quality Assurance Plan. Prepared for the Washington State Department of Ecology. Joy, J. and T. Swanson, 2005. Walla Walla River Basin Fecal Coliform Bacteria Total Maximum Daily Load Study. Washington State Department of Ecology, Olympia, WA. Publication No. 05-03-041. www.ecy.wa.gov/biblio/0503041.html Lehmann, Christopher M.B. and Van C. Bowersox, 2003. National Atmospheric Deposition Program Quality Management Plan. National Atmospheric Deposition Program Office at the Illinois State Water Survey. NADP QA Plan 2003-01. Champaign, IL. http://nadp.sws.uiuc.edu/lib/qaplans/NADP-QMP-Dec2003.pdf Lighthart B., G.F. Kraft, and C.J. Charles, 1972. The Limnology of Lake Whatcom, Washington. Morphometry. Institute for Freshwater Studies. Technical Report No. 15. Lombard, S. and C. Kirchmer, 2004. Guidelines for Preparing Quality Assurance Project Plans for Environmental Studies. Washington State Department of Ecology, Olympia, WA. Publication No. 04-03-030. www.ecy.wa.gov/biblio/0403030.html. Matthews, R.A., M. Hilles, and G.B. Matthews, 1997. Lake Whatcom Monitoring Project 1995-1996 Final Report. Final Report Prepared for the City of Bellingham Public Works Department. April, 1997. Bellingham, WA. Matthews, R.A., M. Hilles, and G.B. Matthews, 1998. Lake Whatcom Monitoring Project 1996-1997 Final Report. Final Report Prepared for the City of Bellingham Public Works Department. February, 1999. Bellingham, WA. Matthews, R.A., M. Hilles, and G.B. Matthews, 1999. Lake Whatcom Monitoring Project 1997/98 Final Report. Final Report Prepared for the City of Bellingham Public Works Department. April, 1999. Bellingham, WA. Matthews, R.A., M. Hilles, and G.B. Matthews, 2000. Lake Whatcom Monitoring Project 1998/99 Final Report. Final Report Prepared for the City of Bellingham Public Works Department. April, 2000. Bellingham, WA.

Lake Whatcom Dissolved Oxygen and Total Phosphorus TMDL: WQ Study Finding Page 94
Matthews, R.A., M. Hilles, and G. Pelletier, 2002a. Determining trophic state in Lake Whatcom, Washington (USA), a soft water lake exhibiting seasonal nitrogen limitation. Hydrobiologia 468: 107–121. 2002. Matthews, R.A., M. Hilles, J. Vandersypen, R.J. Mitchell, and G.B. Matthews, 2001. Lake Whatcom Monitoring Project 1999/2000 Final Report. Final Report Prepared for the City of Bellingham Public Works Department. March, 2001. Bellingham, WA. Matthews, R.A., M. Hilles, J. Vandersypen, R.J. Mitchell, and G.B. Matthews, 2002. Lake Whatcom Monitoring Project 2000/2001 Final Report. Final Report Prepared for the City of Bellingham Public Works Department. March, 2002. Bellingham, WA. Matthews, R.A., M. Hilles, J. Vandersypen, R.J. Mitchell, and G.B. Matthews, 2003. Lake Whatcom Monitoring Project 2001/2002 Final Report. Final Report Prepared for the City of Bellingham Public Works Department. April, 2003. Bellingham, WA. Matthews, R.A., M. Hilles, J. Vandersypen, R.J. Mitchell, and G.B. Matthews, 2004. Lake Whatcom Monitoring Project 2002/2003 Final Report. Final Report Prepared for the City of Bellingham Public Works Department. April, 2004. Bellingham, WA. Matthews, R.A., M. Hilles, J. Vandersypen, R.J. Mitchell, and G.B. Matthews, 2005. Lake Whatcom Monitoring Project 2003/2004 Final Report. Final Report Prepared for the City of Bellingham Public Works Department. March, 2005. Bellingham, WA. Matthews, R.A., M. Hilles, J. Vandersypen, R.J. Mitchell, and G.B. Matthews, 2006. Lake Whatcom Monitoring Project 2004/2005 Final Report. Final Report Prepared for the City of Bellingham Public Works Department. March, 2006. Bellingham, WA. Matthews, R.A., M. Hilles, J. Vandersypen, R.J. Mitchell, and G.B. Matthews, 2007. Lake Whatcom Monitoring Project 2005/2006 Final Report. Final Report Prepared for the City of Bellingham Public Works Department. April, 2007. Bellingham, WA. MEL, 2005. Manchester Environmental Laboratory Lab Users Manual, Eight Edition. Manchester Environmental Laboratory, Washington State Department of Ecology, Manchester, WA. MEL, 2000. Manchester Environmental Laboratory Quality Assurance Manual. Manchester Environmental Laboratory, Washington State Department of Ecology, Manchester, WA. NADP, 2005. National Atmospheric Deposition Program (NRSP-3), Champaign, IL. http://nadp.sws.uiuc.edu/. National Research Council, 2001. Assessing the TMDL Approach to Water Quality Management. National Academy Press. Washington, DC. www.nap.edu/catalog.php?record_id=10146
Lake Whatcom Dissolved Oxygen and Total Phosphorus TMDL: WQ Study Finding Page 95
Norton, D., 2004. Mercury in Lake Whatcom Sediments Spatial Distribution, Depositional History, and Tributary Inputs. Washington State Department of Ecology, Olympia, WA. Publication No. 04-03-019. www.ecy.wa.gov/biblio/0403019.html Ott, W., 1995. Environmental Statistics and Data Analysis. Lewis Publishers, New York, NY. OWML, 2003. Occoquan Watershed Monitoring Laboratory website, www.owml.vt.edu/. Department of Civil and Environmental Engineering, Virginia Polytechnic Institute and State University, Manassas, VA. Pelletier, G., 1998. Dissolved Oxygen in Lake Whatcom, Trend in the Depletion of Hypolimnetic Oxygen in Basin 1, 1983-1997. Washington State Department of Ecology, Olympia, WA. Ecology Report #98-313. www.ecy.wa.gov/pubs/98313.pdf Pickett, P.J., 1996. Lower Skagit Total Maximum Daily Load Data Summary. Washington State Department of Ecology, Olympia, WA. Publication No. 96-345. www.ecy.wa.gov/biblio/96345.html Pitz, C., 2005. Lake Whatcom Total Maximum Daily Load Groundwater Study. Washington State Department of Ecology, Olympia, WA. Publication No. 05-03-001. www.ecy.wa.gov/biblio/0503001.html Pitz, C., 2008. Quality Assurance Project Plan: High-resolution Pore-water Sampling at the Groundwater/Surface Water Interface. Draft. Washington State Department of Ecology, Olympia, WA. R, 2008. R: A language and environment for statistical computing. R Foundation for Statistical Computing, Vienna, Austria. ISBN 3-900051-07-0, URL www.R-project.org Rothert, J., 2003. Quality Assurance Report: National Atmospheric Deposition Program, 2001. NADP QA Report 2003-01. Illinois State Water Survey, Champaign, IL http://nadp.sws.uiuc.edu/lib/qa/qa2001.pdf Thomann, R.V., and Mueller, J.A., 1987. Principles of Surface Water Quality Modeling and Control, Harper and Row, New York. URS Corporation, 1985. Draft Lake Whatcom Water Quality Protection Study. Whatcom County, Washington: Volume 1, Technical Report and Volume 2, Management Plan. VDEQ, 2006. Aquatic Life Impairment in the Occoquan Reservoir, Slide presentation for public meeting, www.deq.state.va.us/export/sites/default/tmdl/pptpdf/occop1o1.pdf. Virginia Department of Environmental Quality, Chantilly, VA. Wendling, P., 2002. Scope of Work for 2002 Lake Whatcom Tributary Data Collection Effort. City of Bellingham, Bellingham, WA.
Lake Whatcom Dissolved Oxygen and Total Phosphorus TMDL: WQ Study Finding Page 96
Wendling, P., 2005. Data Quality Summary of Lake Whatcom Tributary Pre-TMDL Monitoring 2002. City of Bellingham, Bellingham, WA. Zar, J.H., 1984. Biostatistical Analysis. Second Edition. Prentice-Hall Publishers, Englewood Cliffs, NJ.

Lake Whatcom Dissolved Oxygen and Total Phosphorus TMDL: WQ Study Finding Page 97
Figures

Lake Whatcom Dissolved Oxygen and Total Phosphorus TMDL: WQ Study Finding Page 98
This page is purposely left blank

Lake Whatcom Dissolved Oxygen and Total Phosphorus TMDL: WQ Study Finding Page 99
Figure 1. Lake Whatcom Study Area (Lake and Subbasins).

Lake Whatcom Dissolved Oxygen and Total Phosphorus TMDL: WQ Study Finding Page 100
Figure 2. Lake Whatcom Basins 1 and 2 with Sampling Locations.

Lake Whatcom Dissolved Oxygen and Total Phosphorus TMDL: WQ Study Finding Page 101
Figure 3. Lake Whatcom Basin 3 with Sampling Locations.
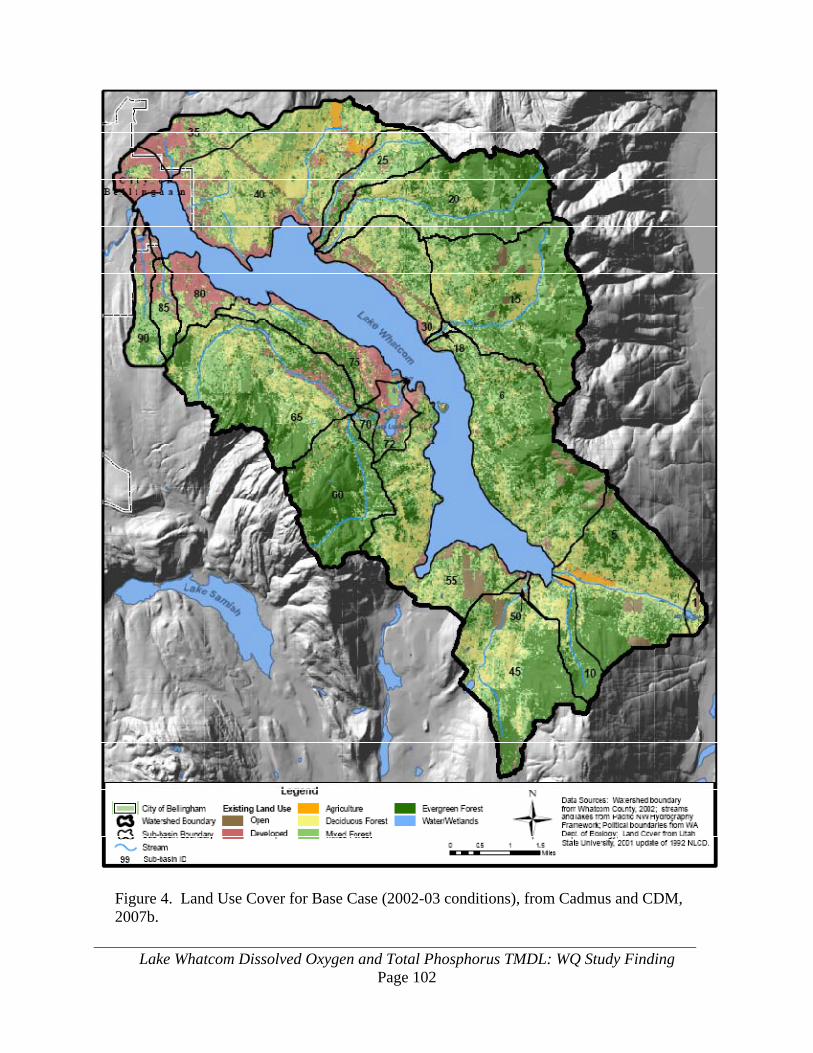
Lake Whatcom Dissolved Oxygen and Total Phosphorus TMDL: WQ Study Finding Page 102
Figure 4. Land Use Cover for Base Case (2002-03 conditions), from Cadmus and CDM, 2007b.
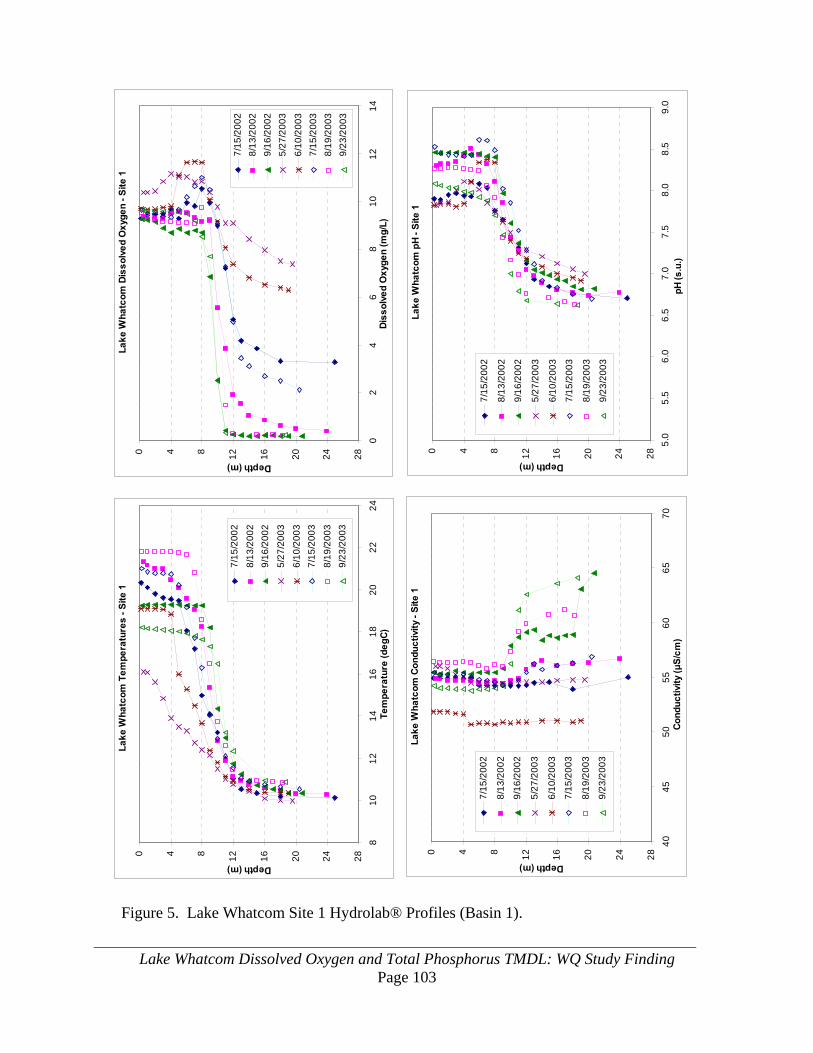
Lake Whatcom Dissolved Oxygen and Total Phosphorus TMDL: WQ Study Finding Page 103
Figure 5. Lake Whatcom Site 1 Hydrolab® Profiles (Basin 1).
Lake
Wha
tcom
Tem
pera
ture
s - S
ite 1
0 4 8 12 16 20 24 288
1012
1416
1820
2224
Tem
pera
ture
(deg
C)
Depth (m)
7/15
/200
28/
13/2
002
9/16
/200
2
5/27
/200
36/
10/2
003
7/15
/200
38/
19/2
003
9/23
/200
3
Lake
Wha
tcom
Dis
solv
ed O
xyge
n - S
ite 1
0 4 8 12 16 20 24 280
24
68
1012
14Di
ssol
ved
Oxy
gen
(mg/
L)
Depth (m)
7/15
/200
28/
13/2
002
9/16
/200
25/
27/2
003
6/10
/200
37/
15/2
003
8/19
/200
39/
23/2
003
Lake
Wha
tcom
Con
duct
ivity
- Si
te 1
0 4 8 12 16 20 24 2840
4550
5560
6570
Cond
uctiv
ity (μ
S/cm
)
Depth (m)
7/15
/200
2
8/13
/200
2
9/16
/200
2
5/27
/200
3
6/10
/200
3
7/15
/200
3
8/19
/200
3
9/23
/200
3
Lake
Wha
tcom
pH
- Site
1
0 4 8 12 16 20 24 285.
05.
56.
06.
57.
07.
58.
08.
59.
0pH
(s.u
.)
Depth (m)
7/15
/200
2
8/13
/200
2
9/16
/200
2
5/27
/200
3
6/10
/200
3
7/15
/200
3
8/19
/200
3
9/23
/200
3

Lake Whatcom Dissolved Oxygen and Total Phosphorus TMDL: WQ Study Finding Page 104
Figure 6. Lake Whatcom Site 2 Hydrolab® Profiles (Basin 2).
Lake
Wha
tcom
Tem
pera
ture
s - S
ite 2
0 3 6 9 12 15 18 21 248
1012
1416
1820
2224
Tem
pera
ture
(deg
C)
Depth (m)
7/15
/200
28/
13/2
002
9/16
/200
25/
27/2
003
6/10
/200
37/
15/2
003
8/19
/200
39/
23/2
003
Lake
Wha
tcom
Dis
solv
ed O
xyge
n - S
ite 2
0 3 6 9 12 15 18 21 240
24
68
1012
Diss
olve
d O
xyge
n (m
g/L)
Depth (m)
7/15
/200
28/
13/2
002
9/16
/200
25/
27/2
003
6/10
/200
37/
15/2
003
8/19
/200
39/
23/2
003
Lake
Wha
tcom
Con
duct
ivity
- Si
te 2
0 3 6 9 12 15 18 21 2440
4550
5560
65Co
nduc
tivity
(μS/
cm)
Depth (m)
7/15
/200
2
8/13
/200
2
9/16
/200
2
5/27
/200
3
6/10
/200
3
7/15
/200
3
8/19
/200
3
9/23
/200
3
Lake
Wha
tcom
pH
- Site
2
0 3 6 9 12 15 18 21 245.
05.
56.
06.
57.
07.
58.
08.
59.
0pH
(s.u
.)
Depth (m)
7/15
/200
2
8/13
/200
2
9/16
/200
2
5/27
/200
3
6/10
/200
3
7/15
/200
3
8/19
/200
3
9/23
/200
3

Lake Whatcom Dissolved Oxygen and Total Phosphorus TMDL: WQ Study Finding Page 105
Figure 7. Lake Whatcom Site 3 Hydrolab® Profile (Basin 3 North).
Lake
Wha
tcom
Tem
pera
ture
s - S
ite 3
0 8 16 24 32 40 48 566
810
1214
1618
2022
Tem
pera
ture
(deg
C)
Depth (m)
8/13
/200
2
9/16
/200
2
5/27
/200
3
6/10
/200
3
7/15
/200
3
8/19
/200
3
9/23
/200
3
Lake
Wha
tcom
Dis
solv
ed O
xyge
n - S
ite 3
0 8 16 24 32 40 48 560
24
68
1012
Diss
olve
d O
xyge
n (m
g/L)
Depth (m)
8/13
/200
2
9/16
/200
2
5/27
/200
3
6/10
/200
3
7/15
/200
3
8/19
/200
3
9/23
/200
3
Lake
Wha
tcom
Con
duct
ivity
- Si
te 3
0 8 16 24 32 40 48 5640
4550
5560
Cond
uctiv
ity (μ
S/cm
)
Depth (m)
8/13
/200
2
9/16
/200
2
5/27
/200
3
6/10
/200
3
7/15
/200
3
8/19
/200
3
9/23
/200
3
Lake
Wha
tcom
pH
- Site
3
0 8 16 24 32 40 48 565.
05.
56.
06.
57.
07.
58.
08.
59.
0pH
(s.u
.)
Depth (m)
8/13
/200
2
9/16
/200
2
5/27
/200
3
6/10
/200
3
7/15
/200
3
8/19
/200
3
9/23
/200
3

Lake Whatcom Dissolved Oxygen and Total Phosphorus TMDL: WQ Study Finding Page 106
Figure 8. Lake Whatcom Site 4 Hydrolab® Profiles (Basin 3 South).
Lake
Wha
tcom
Tem
pera
ture
s - S
ite 4
0 5 10 15 20 25 30 35 40 456
810
1214
1618
2022
Tem
pera
ture
(deg
C)
Depth (m)
7/15
/200
2
8/13
/200
2
9/16
/200
2
Lake
Wha
tcom
Dis
solv
ed O
xyge
n - S
ite 4
0 5 10 15 20 25 30 35 40 450
24
68
1012
Diss
olve
d O
xyge
n (m
g/L)
Depth (m)
7/15
/200
2
8/13
/200
2
9/16
/200
2
Lake
Wha
tcom
Con
duct
ivity
- Si
te 4
0 5 10 15 20 25 30 35 40 4540
4244
4648
5052
5456
Cond
uctiv
ity (μ
S/cm
)
Depth (m)
7/15
/200
2
8/13
/200
2
9/16
/200
2
Lake
Wha
tcom
pH
- Site
4
0 5 10 15 20 25 30 35 40 455.
05.
56.
06.
57.
07.
58.
08.
59.
0pH
(s.u
.)
Depth (m)
7/15
/200
2
8/13
/200
2
9/16
/200
2

Lake Whatcom Dissolved Oxygen and Total Phosphorus TMDL: WQ Study Finding Page 107
Figure 9. Lake Whatcom Geneva Sill Hydrolab® Profiles.
Lake
Wha
tcom
Tem
pera
ture
s - G
enev
a Si
ll
0 1 2 3 4 5 6 7 88
1012
1416
1820
2224
Tem
pera
ture
(deg
C)
Depth (m)
9/16
/200
2
5/27
/200
3
6/10
/200
3
7/15
/200
3
8/19
/200
3
9/23
/200
3
Lake
Wha
tcom
Dis
solv
ed O
xyge
n - G
enev
a Si
ll
0 1 2 3 4 5 6 7 80
24
68
1012
Diss
olve
d O
xyge
n (m
g/L)
Depth (m)
9/16
/200
2
5/27
/200
3
6/10
/200
3
7/15
/200
3
8/19
/200
3
9/23
/200
3
Lake
Wha
tcom
Con
duct
ivity
- Ge
neva
Sill
0 1 2 3 4 5 6 7 840
4550
5560
Cond
uctiv
ity (μ
S/cm
)
Depth (m)
9/16
/200
2
5/27
/200
3
6/10
/200
3
7/15
/200
3
8/19
/200
3
9/23
/200
3
Lake
Wha
tcom
pH
- Gen
eva
Sill
0 1 2 3 4 5 6 7 85.
05.
56.
06.
57.
07.
58.
08.
59.
0pH
(s.u
.)
Depth (m)
9/16
/200
2
5/27
/200
3
6/10
/200
3
7/15
/200
3
8/19
/200
3
9/23
/200
3
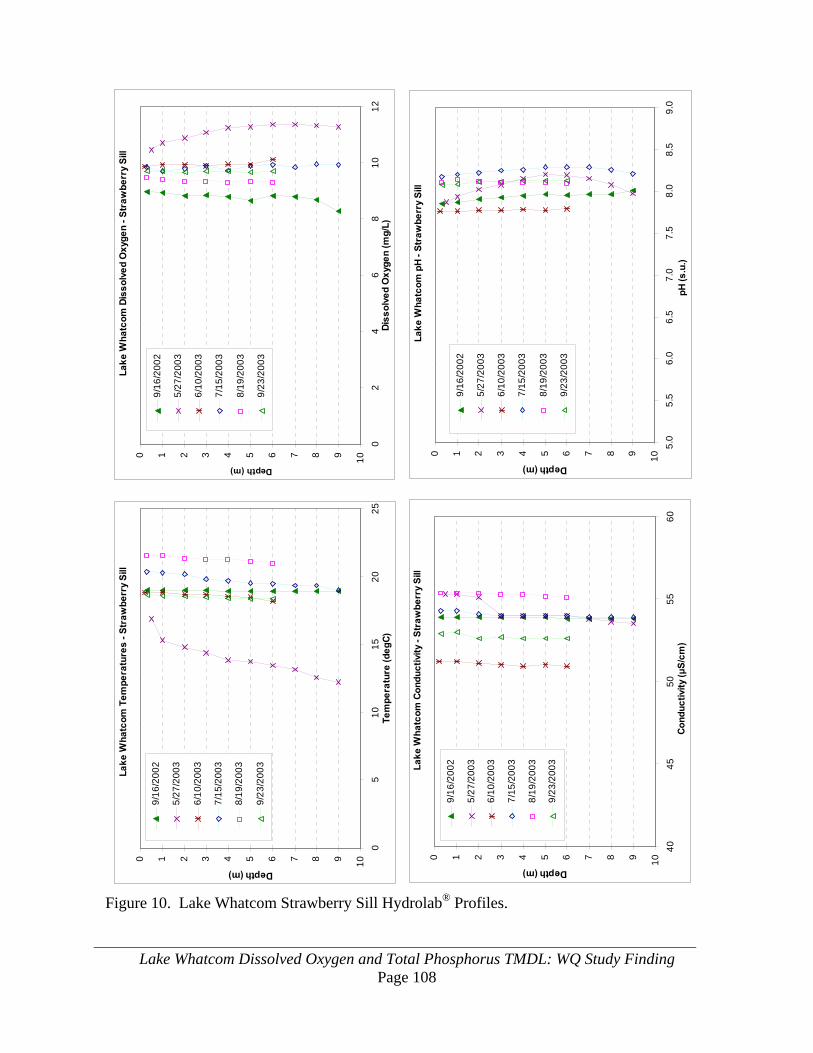
Lake Whatcom Dissolved Oxygen and Total Phosphorus TMDL: WQ Study Finding Page 108
Figure 10. Lake Whatcom Strawberry Sill Hydrolab® Profiles.
Lake
Wha
tcom
Tem
pera
ture
s - S
traw
berr
y Si
ll
0 1 2 3 4 5 6 7 8 9 100
510
1520
25Te
mpe
ratu
re (d
egC)
Depth (m)
9/16
/200
2
5/27
/200
3
6/10
/200
3
7/15
/200
3
8/19
/200
3
9/23
/200
3
Lake
Wha
tcom
Dis
solv
ed O
xyge
n - S
traw
berr
y Si
ll
0 1 2 3 4 5 6 7 8 9 100
24
68
1012
Diss
olve
d O
xyge
n (m
g/L)
Depth (m)
9/16
/200
2
5/27
/200
3
6/10
/200
3
7/15
/200
3
8/19
/200
3
9/23
/200
3
Lake
Wha
tcom
Con
duct
ivity
- St
raw
berr
y Si
ll
0 1 2 3 4 5 6 7 8 9 1040
4550
5560
Cond
uctiv
ity (μ
S/cm
)
Depth (m)
9/16
/200
2
5/27
/200
3
6/10
/200
3
7/15
/200
3
8/19
/200
3
9/23
/200
3
Lake
Wha
tcom
pH
- Str
awbe
rry
Sill
0 1 2 3 4 5 6 7 8 9 105.
05.
56.
06.
57.
07.
58.
08.
59.
0pH
(s.u
.)
Depth (m)
9/16
/200
2
5/27
/200
3
6/10
/200
3
7/15
/200
3
8/19
/200
3
9/23
/200
3
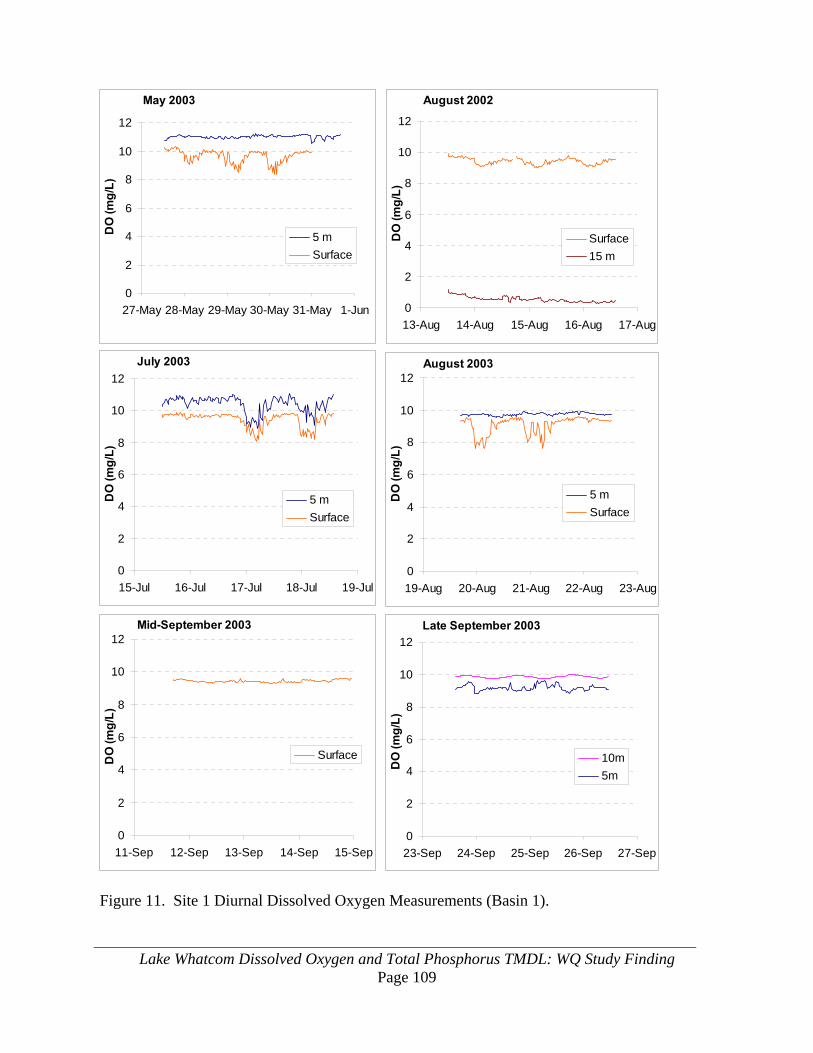
Lake Whatcom Dissolved Oxygen and Total Phosphorus TMDL: WQ Study Finding Page 109
July 2003
0
2
4
6
8
10
12
15-Jul 16-Jul 17-Jul 18-Jul 19-Jul
DO
(mg/
L)
5 mSurface
May 2003
0
2
4
6
8
10
12
27-May 28-May 29-May 30-May 31-May 1-Jun
DO
(mg/
L)
5 mSurface
August 2002
0
2
4
6
8
10
12
13-Aug 14-Aug 15-Aug 16-Aug 17-Aug
DO
(mg/
L)
Surface15 m
August 2003
0
2
4
6
8
10
12
19-Aug 20-Aug 21-Aug 22-Aug 23-Aug
DO
(mg/
L)
5 mSurface
Mid-September 2003
0
2
4
6
8
10
12
11-Sep 12-Sep 13-Sep 14-Sep 15-Sep
DO
(mg/
L)
Surface
Late September 2003
0
2
4
6
8
10
12
23-Sep 24-Sep 25-Sep 26-Sep 27-Sep
DO
(mg/
L)
10m5m
Figure 11. Site 1 Diurnal Dissolved Oxygen Measurements (Basin 1).

Lake Whatcom Dissolved Oxygen and Total Phosphorus TMDL: WQ Study Finding Page 110
July 2003
10
12
14
16
18
20
22
24
15-Jul 16-Jul 17-Jul 18-Jul 19-Jul
Tem
pera
ture
(deg
C)
Surface5 m
May 2003
10
12
14
16
18
20
22
24
27-May 28-May 29-May 30-May 31-May 1-Jun
Tem
pera
ture
(deg
C)
Surface5 m
August 2002
10
12
14
16
18
20
22
24
13-Aug 14-Aug 15-Aug 16-Aug 17-Aug
Tem
pera
ture
(deg
C)
Surface15 m
August 2003
10
12
14
16
18
20
22
24
19-Aug 20-Aug 21-Aug 22-Aug 23-Aug
Tem
pera
ture
(deg
C)
Surface5 m
Mid-September 2003
10
12
14
16
18
20
22
24
11-Sep 12-Sep 13-Sep 14-Sep 15-Sep
Tem
pera
ture
(deg
C)
Surface
Late September 2003
10
12
14
16
18
20
22
24
23-Sep 24-Sep 25-Sep 26-Sep 27-Sep
Tem
pera
ture
(deg
C)
10m5m
Figure 12. Site 1 Diurnal Temperature Measurements (Basin 1).

Lake Whatcom Dissolved Oxygen and Total Phosphorus TMDL: WQ Study Finding Page 111
July 2003
6.0
6.5
7.0
7.5
8.0
8.5
9.0
15-Jul 16-Jul 17-Jul 18-Jul 19-Jul
pH
5 mSurface
May 2003
6.0
6.5
7.0
7.5
8.0
8.5
9.0
27-May
28-May
29-May
30-May
31-May
1-Jun
pH
5 mSurface
August 2002
6.0
6.5
7.0
7.5
8.0
8.5
9.0
13-Aug 14-Aug 15-Aug 16-Aug 17-Aug
pH
Surface15 m
August 2003
6.0
6.5
7.0
7.5
8.0
8.5
9.0
19-Aug 20-Aug 21-Aug 22-Aug 23-Aug
pH
Surface5 m
Mid-September 2003
6.0
6.5
7.0
7.5
8.0
8.5
9.0
11-Sep 12-Sep 13-Sep 14-Sep 15-Sep
pH
Surface
Late September 2003
6.0
6.5
7.0
7.5
8.0
8.5
9.0
23-Sep 24-Sep 25-Sep 26-Sep 27-Sep
pH
10m5m
Figure 13. Basin 1 Diurnal pH Measurements.
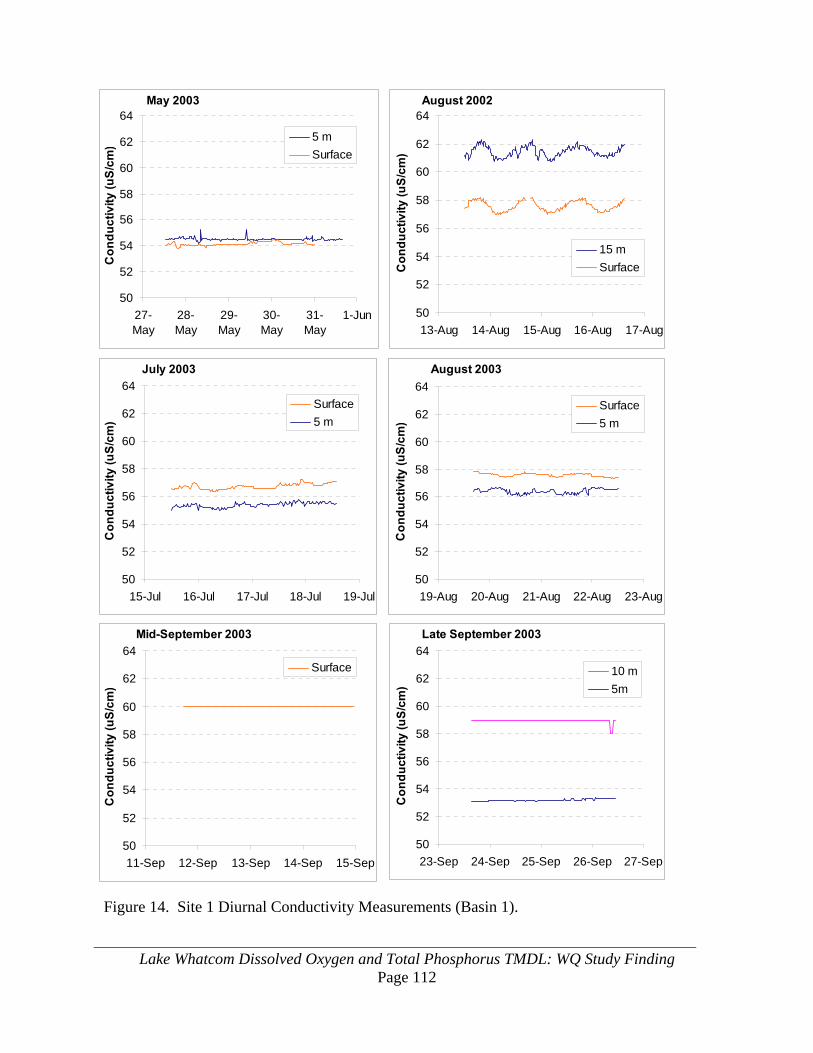
Lake Whatcom Dissolved Oxygen and Total Phosphorus TMDL: WQ Study Finding Page 112
Figure 14. Site 1 Diurnal Conductivity Measurements (Basin 1).
July 2003
50
52
54
56
58
60
62
64
15-Jul 16-Jul 17-Jul 18-Jul 19-Jul
Con
duct
ivity
(uS/
cm)
Surface5 m
May 2003
50
52
54
56
58
60
62
64
27-May
28-May
29-May
30-May
31-May
1-Jun
Con
duct
ivity
(uS/
cm)
5 mSurface
August 2002
50
52
54
56
58
60
62
64
13-Aug 14-Aug 15-Aug 16-Aug 17-Aug
Con
duct
ivity
(uS/
cm)
15 mSurface
August 2003
50
52
54
56
58
60
62
64
19-Aug 20-Aug 21-Aug 22-Aug 23-Aug
Con
duct
ivity
(uS/
cm)
Surface5 m
Mid-September 2003
50
52
54
56
58
60
62
64
11-Sep 12-Sep 13-Sep 14-Sep 15-Sep
Con
duct
ivity
(uS/
cm)
Surface
Late September 2003
50
52
54
56
58
60
62
64
23-Sep 24-Sep 25-Sep 26-Sep 27-Sep
Con
duct
ivity
(uS/
cm)
10 m5m
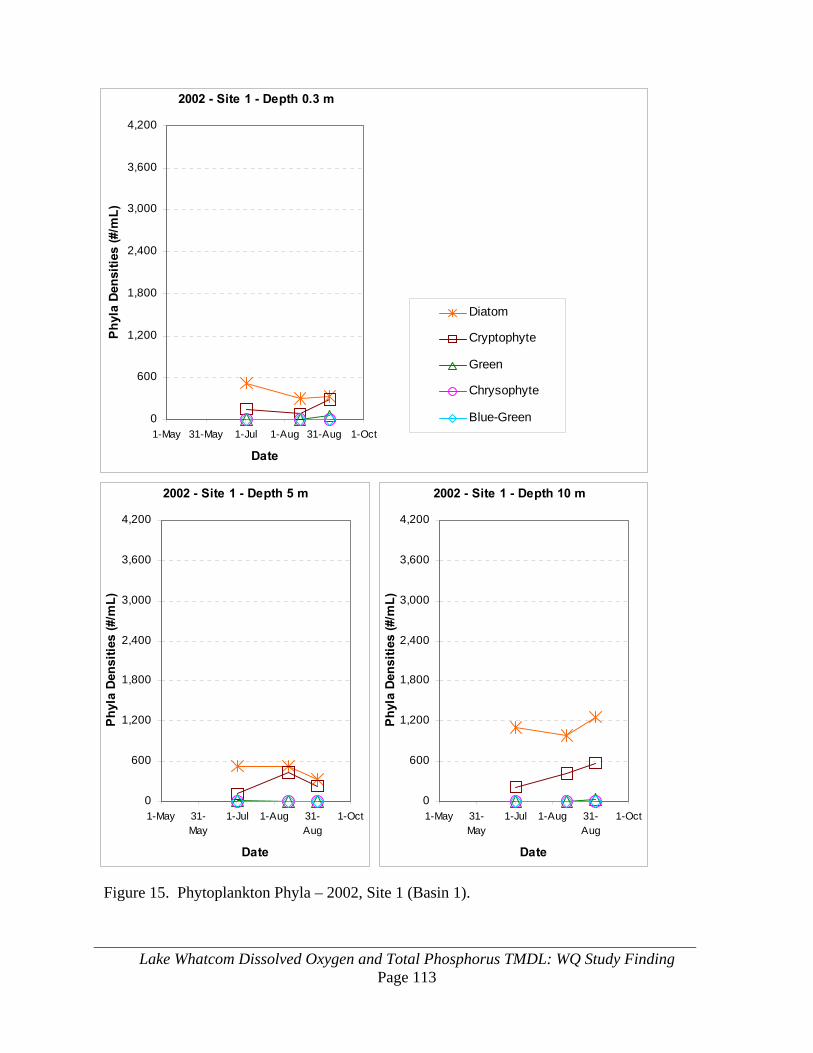
Lake Whatcom Dissolved Oxygen and Total Phosphorus TMDL: WQ Study Finding Page 113
2002 - Site 1 - Depth 0.3 m
0
600
1,200
1,800
2,400
3,000
3,600
4,200
1-May 31-May 1-Jul 1-Aug 31-Aug 1-Oct
Date
Phyl
a De
nsiti
es (#
/mL)
Diatom
Cryptophyte
Green
Chrysophyte
Blue-Green
2002 - Site 1 - Depth 5 m
0
600
1,200
1,800
2,400
3,000
3,600
4,200
1-May 31-May
1-Jul 1-Aug 31-Aug
1-Oct
Date
Phyl
a De
nsiti
es (#
/mL)
2002 - Site 1 - Depth 10 m
0
600
1,200
1,800
2,400
3,000
3,600
4,200
1-May 31-May
1-Jul 1-Aug 31-Aug
1-Oct
Date
Phyl
a De
nsiti
es (#
/mL)
Figure 15. Phytoplankton Phyla – 2002, Site 1 (Basin 1).

Lake Whatcom Dissolved Oxygen and Total Phosphorus TMDL: WQ Study Finding Page 114
2002 - Site 2 - Depth 0.3 m
0
600
1,200
1,800
2,400
3,000
3,600
4,200
1-May 31-May 1-Jul 1-Aug 31-Aug 1-Oct
Date
Phyl
a De
nsiti
es (#
/mL)
Diatom
Cryptophyte
Green
Chrysophyte
Blue-Green
2002 - Site 2 - Depth 5 m
0
600
1,200
1,800
2,400
3,000
3,600
4,200
1-May 31-May
1-Jul 1-Aug 31-Aug
1-Oct
Date
Phyl
a De
nsiti
es (#
/mL)
2002 - Site 2 - Depth 10 m
0
600
1,200
1,800
2,400
3,000
3,600
4,200
1-May 31-May
1-Jul 1-Aug 31-Aug
1-Oct
Date
Phyl
a De
nsiti
es (#
/mL)
Figure 16. Phytoplankton Phyla – 2002, Site 2 (Basin 2).

Lake Whatcom Dissolved Oxygen and Total Phosphorus TMDL: WQ Study Finding Page 115
2002 - Site 3 - Depth 0.3 m
0
600
1,200
1,800
2,400
3,000
3,600
4,200
1-May 31-May 1-Jul 1-Aug 31-Aug 1-Oct
Date
Phyl
a De
nsiti
es (#
/mL)
Diatom
Cryptophyte
Green
Chrysophyte
Blue-Green
2002 - Site 3 - Depth 5 m
0
600
1,200
1,800
2,400
3,000
3,600
4,200
1-May 31-May
1-Jul 1-Aug 31-Aug
1-Oct
Date
Phyl
a De
nsiti
es (#
/mL)
2002 - Site 3 - Depth 10 m
0
600
1,200
1,800
2,400
3,000
3,600
4,200
1-May 31-May
1-Jul 1-Aug 31-Aug
1-Oct
Date
Phyl
a De
nsiti
es (#
/mL)
Figure 17. Phytoplankton Phyla – 2002, Site 3 (Basin 3 North).
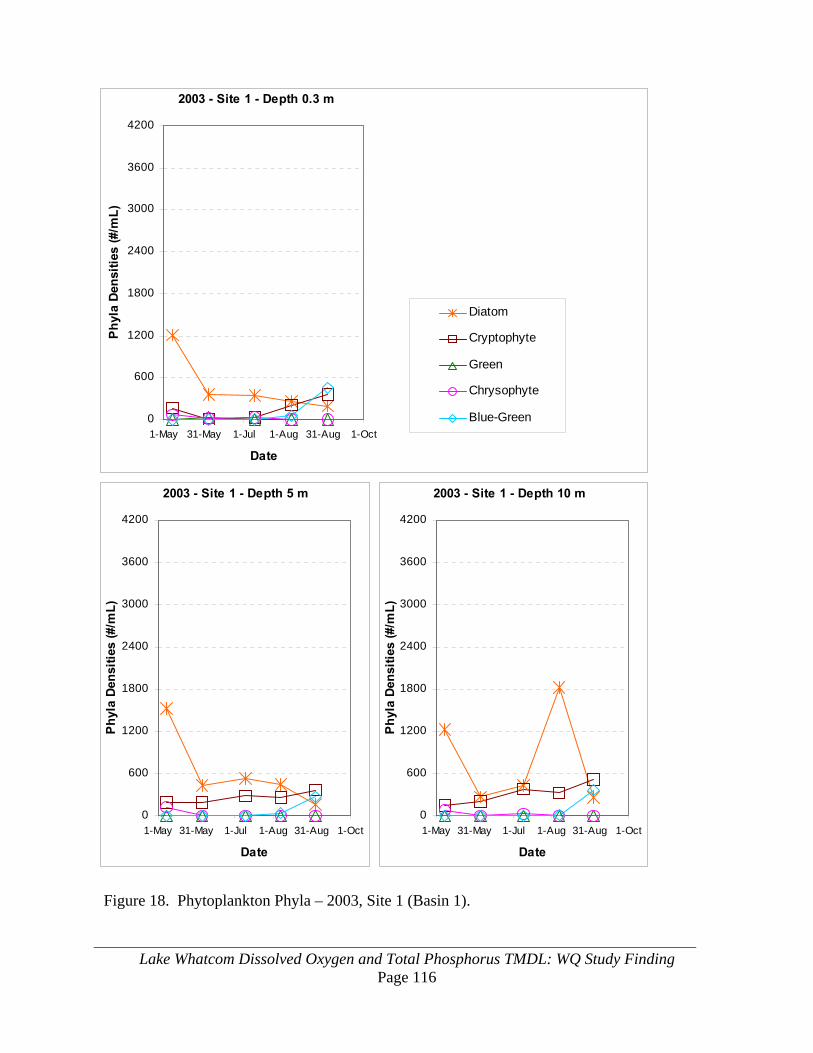
Lake Whatcom Dissolved Oxygen and Total Phosphorus TMDL: WQ Study Finding Page 116
2003 - Site 1 - Depth 0.3 m
0
600
1200
1800
2400
3000
3600
4200
1-May 31-May 1-Jul 1-Aug 31-Aug 1-Oct
Date
Phyl
a De
nsiti
es (#
/mL)
Diatom
Cryptophyte
Green
Chrysophyte
Blue-Green
2003 - Site 1 - Depth 5 m
0
600
1200
1800
2400
3000
3600
4200
1-May 31-May 1-Jul 1-Aug 31-Aug 1-Oct
Date
Phyl
a De
nsiti
es (#
/mL)
2003 - Site 1 - Depth 10 m
0
600
1200
1800
2400
3000
3600
4200
1-May 31-May 1-Jul 1-Aug 31-Aug 1-Oct
Date
Phyl
a De
nsiti
es (#
/mL)
Figure 18. Phytoplankton Phyla – 2003, Site 1 (Basin 1).

Lake Whatcom Dissolved Oxygen and Total Phosphorus TMDL: WQ Study Finding Page 117
2003 - Site 2 - Depth 0.3 m
0
600
1200
1800
2400
3000
3600
4200
19-Apr 20-May 19-Jun 20-Jul 20-Aug 19-Sep
Date
Phy
la D
ensi
ties
(#/m
L)
Diatom
Cryptophyte
Green
Chrysophyte
Blue-Green
2003 - Site 2 - Depth 5 m
0
600
1200
1800
2400
3000
3600
4200
1-May 31-May 1-Jul 1-Aug 31-Aug 1-Oct
Date
Phyl
a De
nsiti
es (#
/mL)
2003 - Site 2 - Depth 10 m
0
600
1200
1800
2400
3000
3600
4200
1-May 31-May 1-Jul 1-Aug 31-Aug 1-Oct
Date
Phyl
a De
nsiti
es (#
/mL)
Figure 19. Phytoplankton Phyla – 2003, Site 2 (Basin 2).

Lake Whatcom Dissolved Oxygen and Total Phosphorus TMDL: WQ Study Finding Page 118
2003 - Site 3 - Depth 0.3 m
0
600
1200
1800
2400
3000
3600
4200
19-Apr 20-May 19-Jun 20-Jul 20-Aug 19-Sep
Date
Phyl
a De
nsiti
es (#
/mL)
Diatom
Cryptophyte
Green
Chrysophyte
Blue-Green
2003 - Site 3 - Depth 5 m
0
600
1200
1800
2400
3000
3600
4200
1-May 31-May 1-Jul 1-Aug 31-Aug 1-Oct
Date
Phyl
a De
nsiti
es (#
/mL)
2003 - Site 3 - Depth 10 m
0
600
1200
1800
2400
3000
3600
4200
1-May 31-May 1-Jul 1-Aug 31-Aug 1-Oct
Date
Phyl
a De
nsiti
es (#
/mL)
Figure 20. Phytoplankton Phyla – 2003, Site 3 (Basin 3 North).

Lake Whatcom Dissolved Oxygen and Total Phosphorus TMDL: WQ Study Finding Page 119
Figure 21. CE_QUAL-W2 Model Layout.
Branch 1Branch 4
Bran
ch 2
Branch 3
Branch 5
Basin #3
Basin #2
Basin #131
28
2930
48
495051
52
555657
59
60
6263
39
40
38
37
3635
34
AndersonFirBrannian
South Bay
Blue Canyon
Austin
Smith
Sudden Valley
North ShoreCarpenter
Agate Bay
Olsen
Strawberry
Eagle Ridge
Academy
CableGeneva
Donovan
Oriental
Hillsdale & Silver Beach
66
Bloedel
67
Middle Fork Nooksack Diversion
Whatcom Creek (Outlet)
Waterbody 2 =Branch 4+5
Waterbody 1 =Branch 1+2+3
Lake Whatcom CE-QUAL-W2 Model Layout

Lake Whatcom Dissolved Oxygen and Total Phosphorus TMDL: WQ Study Finding Page 120
Distance (meters)
Ele
vatio
n(m
)
050001000015000
-20
0
20
40
60
80
100
Lake Whatcom Grid
Figure 22. CE_QUAL-W2 Model Grid.
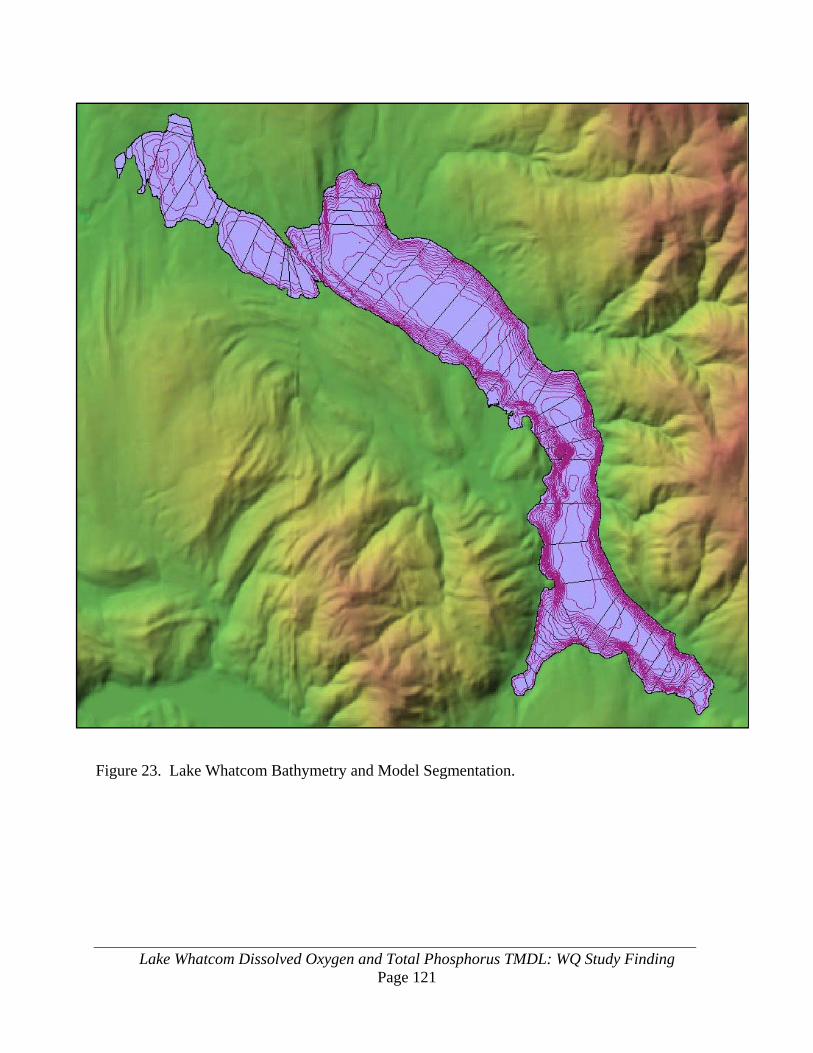
Lake Whatcom Dissolved Oxygen and Total Phosphorus TMDL: WQ Study Finding Page 121
Figure 23. Lake Whatcom Bathymetry and Model Segmentation.
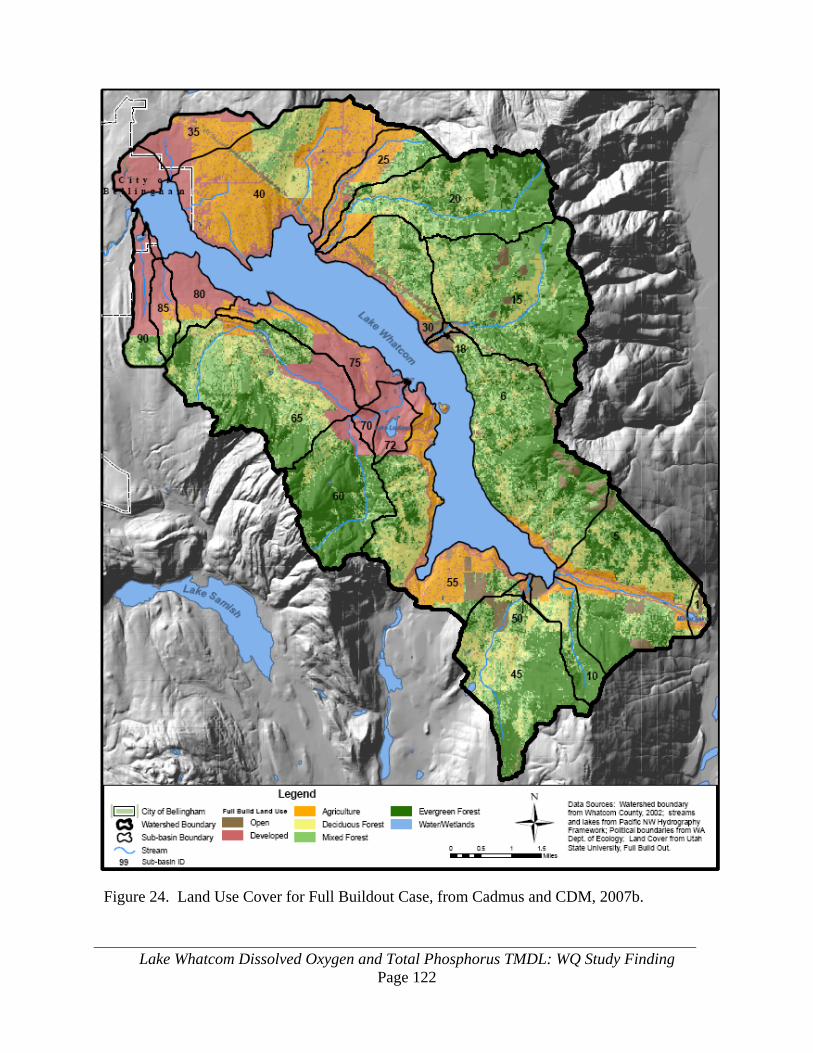
Lake Whatcom Dissolved Oxygen and Total Phosphorus TMDL: WQ Study Finding Page 122
Figure 24. Land Use Cover for Full Buildout Case, from Cadmus and CDM, 2007b.

Lake Whatcom Dissolved Oxygen and Total Phosphorus TMDL: WQ Study Finding Page 123
.
Figure 25. Example of Cumulative Volume Method for Evaluating Dissolved Oxygen Levels.

Lake Whatcom Dissolved Oxygen and Total Phosphorus TMDL: WQ Study Finding Page 124
Figure 26. Comparison of Base Scenario (2002-03) to Full Rollback Scenario, in Terms of Cumulative Volumes of Dissolved Oxygen in Basin 1 (segments 60 and 61), June-October.
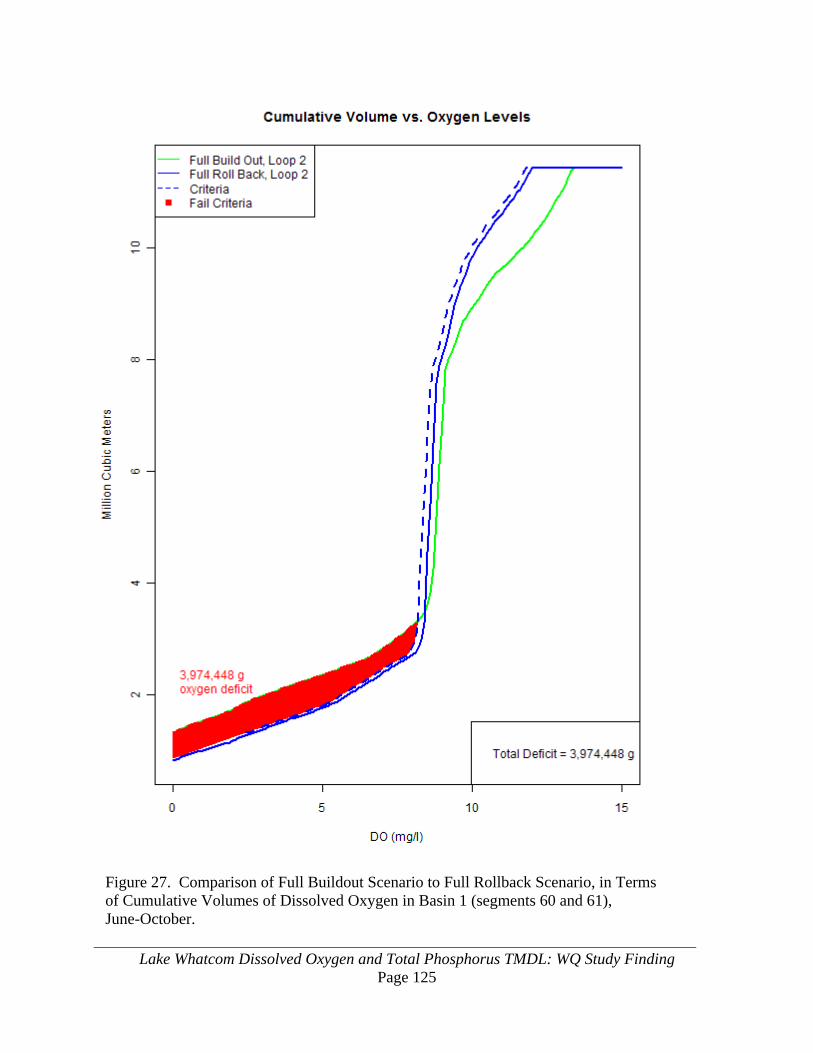
Lake Whatcom Dissolved Oxygen and Total Phosphorus TMDL: WQ Study Finding Page 125
Figure 27. Comparison of Full Buildout Scenario to Full Rollback Scenario, in Terms of Cumulative Volumes of Dissolved Oxygen in Basin 1 (segments 60 and 61), June-October.

Lake Whatcom Watershed Total Phosphorus and Bacteria TMDLs: WQ Study Findings Page 126
Figure 28. Comparison of Full Rollback Scenario to Full Rollback With Natural Hydrology Scenario, in Terms of Cumulative Volumes of Dissolved Oxygen in Basin 1 (segments 60 and 61), June-October.

Lake Whatcom Watershed Total Phosphorus and Bacteria TMDLs: WQ Study Findings Page 127
Figure 29. Comparison of Base Scenario with 85.54% Reduction in Development to Full Rollback Scenario, in Terms of Cumulative Volumes of Dissolved Oxygen in Basin 1 (segments 60 and 61), June-October.
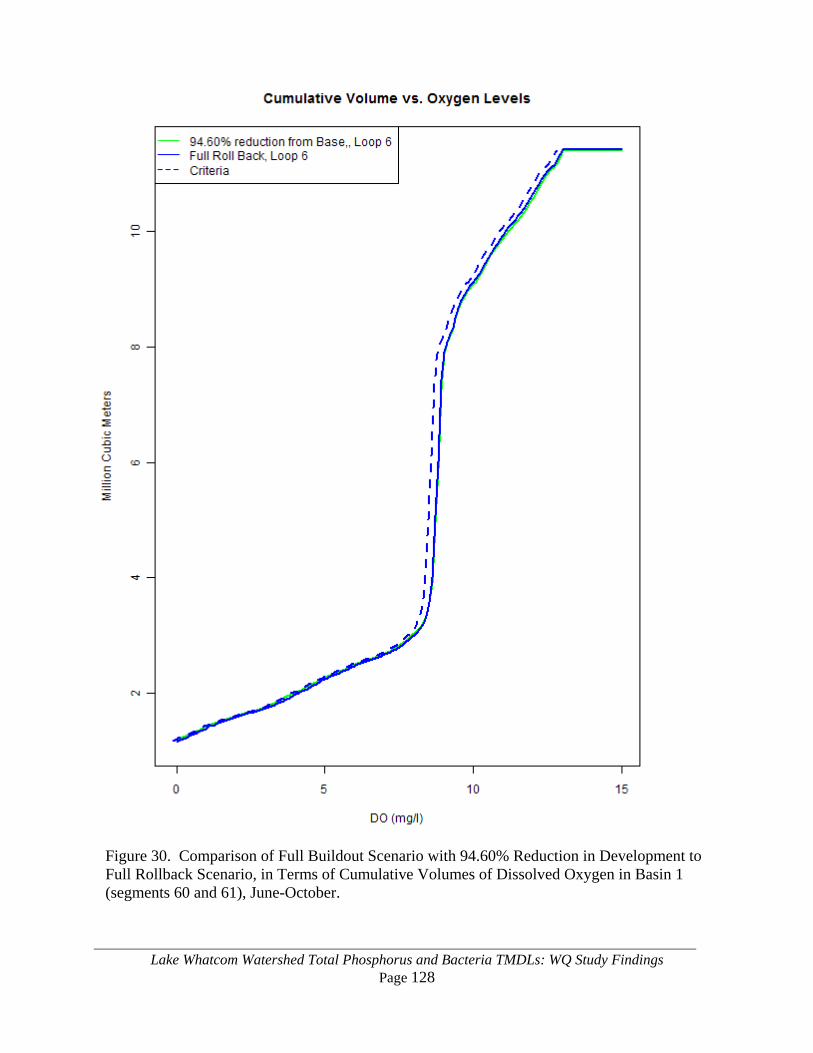
Lake Whatcom Watershed Total Phosphorus and Bacteria TMDLs: WQ Study Findings Page 128
Figure 30. Comparison of Full Buildout Scenario with 94.60% Reduction in Development to Full Rollback Scenario, in Terms of Cumulative Volumes of Dissolved Oxygen in Basin 1 (segments 60 and 61), June-October.

Lake Whatcom Watershed Total Phosphorus and Bacteria TMDLs: WQ Study Findings Page 129
Figure 31. Comparison of Base Scenario with Base Scenario with no Georgia Pacific withdrawal (moved to Whatcom Creek), in Terms of Cumulative Volumes of Dissolved Oxygen in Basin 1 (segments 60 and 61), June-October.

Lake Whatcom Watershed Total Phosphorus and Bacteria TMDLs: WQ Study Findings Page 130
Figure 32. Effectiveness of Stormwater Pollution Control Strategy Based on Design Size (from EPA, 2008)

Lake Whatcom Watershed Total Phosphorus and Bacteria TMDLs: WQ Study Findings Page 131
Lake Whatcom Total Phosphorus 2003 Scenario Loading
0
1000
2000
3000
4000
5000
6000
7000
8000
9000
Base Full Rollback Full Buildout Partial Rollback fromBase
Partial Rollback from FullBuildout
Scenario
Tota
l Pho
spho
rus
(kg/
year
)
Tributaries
MFN Diversion
Precipitation
Groundwater
Figure 33. Total Phosphorus 2003 Loading by Category for TMDL Scenarios.

Lake Whatcom Watershed Total Phosphorus and Bacteria TMDLs: WQ Study Findings Page 132
Lake Whatcom Phosphorus Loading - Base Scenario, 2003
Donovan0.12%
Cable0.3%
Eagle Ridge0.22%
Carpenter2.3%
Sudden Vly2.1%
Strawberry2.2%
Brannian3.7%
Blue Cyn6.5%
Bloedel0.14%
South Bay5.9%
Austin6.5%
Anderson4.1%
Precipitation2.6%
Agate5.1%
Academy1.9%
Groundwater35.1%
MFN diversion4.7%
Smith3.7% Olsen
5.2%Silver Beach
0.8%
Mill Wheel0.9%North Shore
2.6%
Euclid0.3%
Fir1.0%
Hillsdale2.1%
Figure 34. Total Phosphorus 2003 Loading for the Base Scenario.
Total Load = 6,281 kg/year 17.2 kg/day

Lake Whatcom Watershed Total Phosphorus and Bacteria TMDLs: WQ Study Findings Page 133
Lake Whatcom Phosphorus Loading - Full Rollback Scenario, 2003
Euclid0.1%
Fir1.2%
Mill Wheel0.2%
North Shore1.4%
Hillsdale0.3%
Donovan0.02%
Cable0.04%
Eagle Ridge0.1%
Carpenter1.3%
Sudden Vly0.9%
Strawberry0.7%
Brannian4.6%
Blue Cyn7.4%
Bloedel0.02%
South Bay4.6%
Austin5.9%
Anderson5.2%
Precipitation3.2%
Agate2.0%
Academy0.7%
Groundwater43.5%
MFN diversion5.8%
Smith4.5%
Olsen6.2%
Silver Beach0.3%
Figure 35. Total Phosphorus 2003 Loading for the Full Rollback Scenario.
Total Load = 5,067 kg/year 13.9 kg/day

Lake Whatcom Watershed Total Phosphorus and Bacteria TMDLs: WQ Study Findings Page 134
Lake Whatcom Phosphorus Loading - Full Buildout Scenario, 2003
Hillsdale3.0%
Fir1.1%
Euclid0.4%Mill Wheel
1.5%
North Shore2.7%
Silver Beach1.1%
Olsen4.4%
Smith2.8%
MFN diversion3.4%
Groundwater25.9%
Academy2.5% Agate
6.9%Precipitation
1.9%
Anderson4.7%
Austin9.4%
South Bay8.6%
Bloedel0.2%
Blue Cyn5.5% Brannian
3.0%
Strawberry3.0%
Sudden Vly3.5%
Carpenter3.7%
Eagle Ridge0.3%
Cable0.3%
Donovan0.2%
Figure 36. Total Phosphorus 2003 Loading for the Full Buildout Scenario.
Total Load = 8,503 kg/year 23.3 kg/day

Lake Whatcom Watershed Total Phosphorus and Bacteria TMDLs: WQ Study Findings Page 135
Lake Whatcom Phosphorus Loading - Partial Rollback from Base Scenario, 2003
Euclid0.2%Fir
1.1%
Mill Wheel0.3%
North Shore1.7%
Hillsdale0.6%
Donovan0.04%
Cable0.1%
Eagle Ridge0.1%
Carpenter1.4%
Sudden Vly1.1%
Strawberry0.9%
Brannian4.2%
Blue Cyn7.4%
Bloedel0.05%
South Bay4.9%
Austin5.9%
Anderson4.5%
Precipitation3.1%
Agate2.2%
Academy0.8%
Groundwater42.6%
MFN diversion5.7%
Smith4.4%
Olsen6.1%
Silver Beach0.3%
Figure 37. Total Phosphorus 2003 Loading for the Partial Rollback from Base Scenario.
Total Load = 5165 kg/year 14.15 kg/day

Lake Whatcom Watershed Total Phosphorus and Bacteria TMDLs: WQ Study Findings Page 136
Lake Whatcom Phosphorus Loading - Partial Rollback from Full Rollback Scenario, 2003
Euclid0.1%Fir
1.2%
Mill Wheel0.3%
North Shore1.6%
Hillsdale0.5%
Donovan0.03%
Cable0.1%
Eagle Ridge0.1%
Carpenter1.5%
Sudden Vly1.1%
Strawberry0.9%
Brannian4.2%
Blue Cyn7.4%
Bloedel0.04%
South Bay5.1%
Austin6.1%
Anderson4.6%
Precipitation3.1%
Agate2.1%
Academy0.8%
Groundwater42.7%
MFN diversion5.7%
Smith4.4%
Olsen6.1%
Silver Beach0.3%
Figure 38. Total Phosphorus 2003 Loading for the Partial Rollback from Full Rollback Scenario.
Total Load = 5,164 kg/year 14.15 kg/day
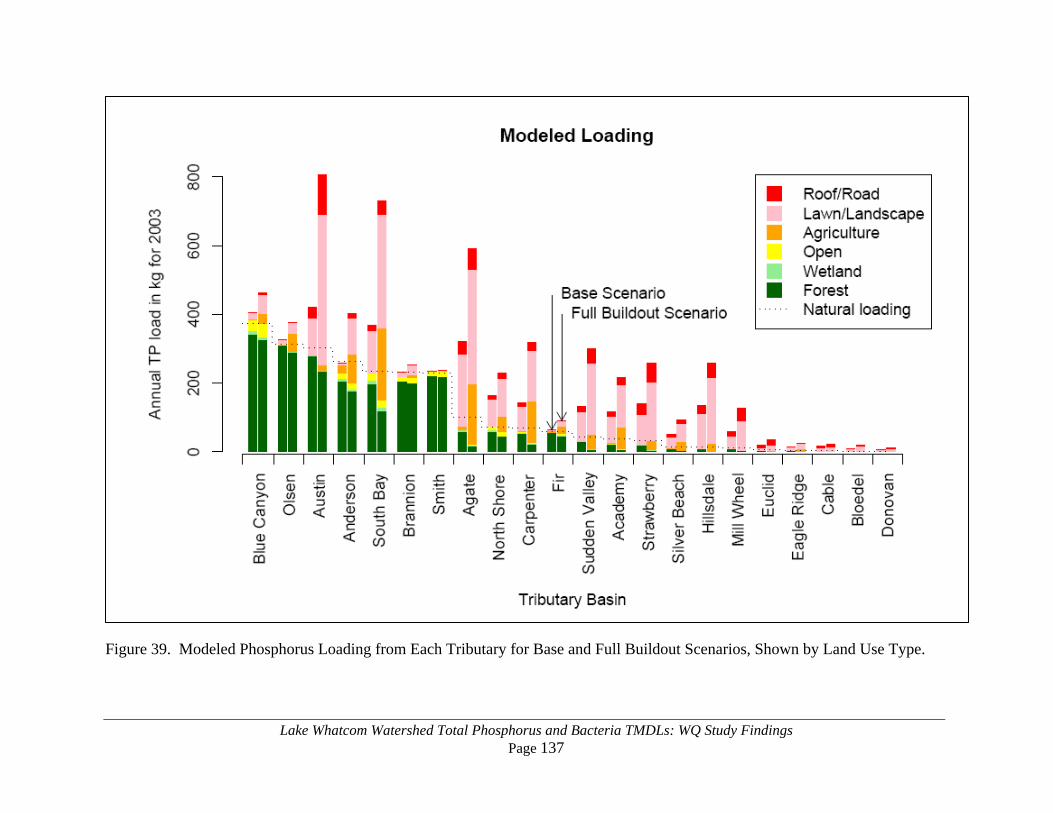
Lake Whatcom Watershed Total Phosphorus and Bacteria TMDLs: WQ Study Findings Page 137
Figure 39. Modeled Phosphorus Loading from Each Tributary for Base and Full Buildout Scenarios, Shown by Land Use Type.
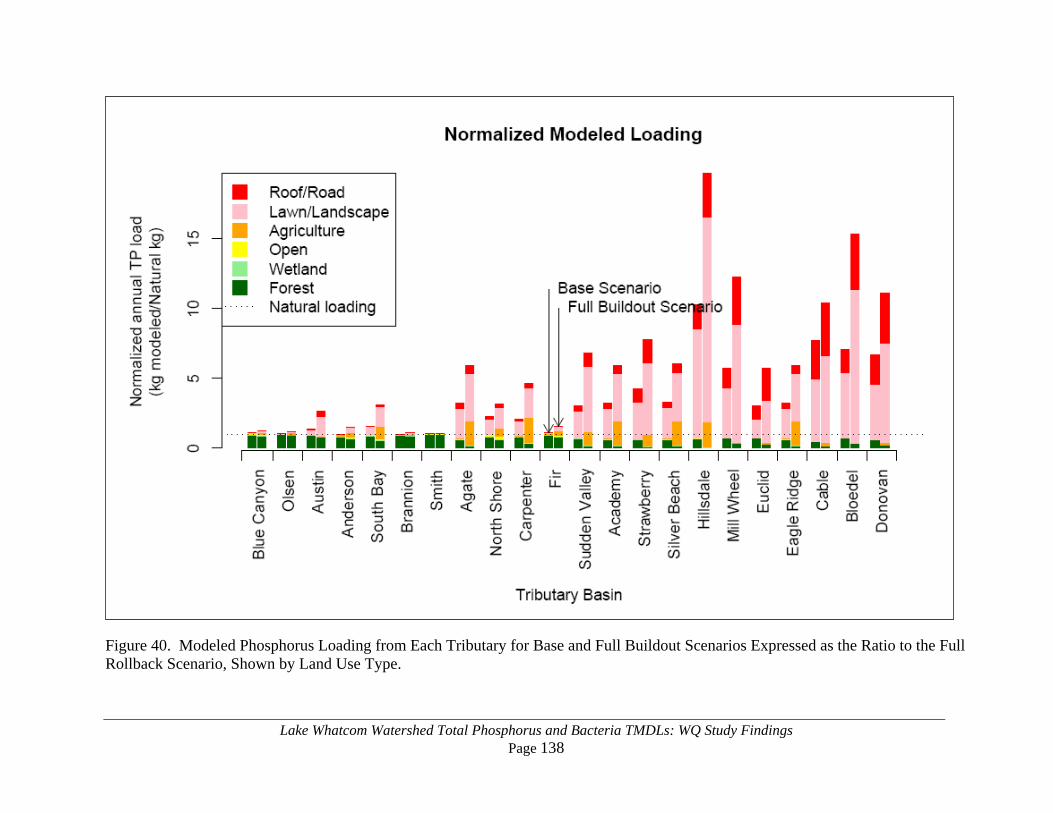
Lake Whatcom Watershed Total Phosphorus and Bacteria TMDLs: WQ Study Findings Page 138
Figure 40. Modeled Phosphorus Loading from Each Tributary for Base and Full Buildout Scenarios Expressed as the Ratio to the Full Rollback Scenario, Shown by Land Use Type.

Lake Whatcom Watershed Total Phosphorus and Bacteria TMDLs: WQ Study Findings Page 139
Figure 41. Allowable Phosphorus Loading from Each Tributary for two Partial Rollback Scenarios, Shown by Land Use Type.

Lake Whatcom Watershed Total Phosphorus and Bacteria TMDLs: WQ Study Findings Page 140
Figure 42. Allowable Phosphorus Loading from Each Tributary for Two Partial Rollback Scenarios Expressed as the Ratio to the Full Rollback Scenario, Shown by Land Use Type.
Lake Whatcom Watershed Total Phosphorus and Bacteria TMDLs: WQ Findings Page 141
Appendix A. Glossary and Acronyms 303(d) list: Section 303(d) of the federal Clean Water Act requires Washington State periodically to prepare a list of all surface waters in the state for which beneficial uses of the water – such as for drinking, recreation, aquatic habitat, and industrial use – are impaired by pollutants. These are water quality limited estuaries, lakes, and streams that fall short of state surface water quality standards, and are not expected to improve within the next two years.
μS/cm: microsiemens per centimeter, a unit of conductivity (see below).
#/mL: number per milliliter, a unit used to describe the density of phytoplankton phyla.
Anoxic: Depleted of oxygen.
Benthic: Associated with the bottom of a waterbody.
Best Management Practices (BMPs): Physical, structural, and/or operational practices that, when used singularly or in combination, prevent or reduce pollutant discharges.
Cadmus: The Cadmus Group, an engineering and environmental consulting firm.
CE-QUAL-W2: A water quality and hydrodynamic model in 2D (longitudinal-vertical) for rivers, estuaries, lakes, reservoirs, and river basin systems (www.ce.pdx.edu/w2/).
CDM: A consulting, engineering, construction, and operations firm (www.cdm.com/).
cfs: cubic feet per second, a unit of flow.
cfu: colony forming units, a unit of bacteria population.
Clean Water Act: Federal act passed in 1972 that contains provisions to restore and maintain the quality of the nation’s waters. Section 303(d) of the CWA establishes the TMDL program.
cms: cubic meters per second, a unit of flow.
Conductivity: A measure of the ability of water to conduct electricity, which is also a measure of the dissolved solids or salinity of the water. Measured in units of microSiemens per centimeter (μS/cm).
Critical conditions: Physical, chemical, and biological characteristics of the water environment that combine to produce the greatest potential adverse impact on aquatic biota and existing or designated water uses.
degC, or oC: degrees centigrade or Celsius, measure of temperature.
Designated Uses: Those uses specified in Chapter 173-201A WAC (Water Quality Standards for Surface Waters of the State of Washington) for each waterbody or segment, regardless of whether or not the uses are currently attained.
Dissolved Oxygen (DO): The concentration of gaseous oxygen dissolved in water, usually in milligrams per liter.

Lake Whatcom Watershed Total Phosphorus and Bacteria TMDLs: WQ Findings Page 142
Diurnal: Relating to or happening in a day or each day.
Environmental Information Management (EIM) system: A database containing data from monitoring of environmental conditions done by, or required by, the Department of Ecology, or recipients of department grants.
Full Buildout (FBO): A projected scenario of future land uses assuming full development to current zoning.
Full Rollback (FRB): A projected scenario of past land uses assuming no development. An estimate of natural conditions.
g: grams, a unit of mass.
HFAM: A hydrologic model developed by the consulting firm Hydrocomp (www.hydrocomp.com/).
HSPF: The Hydrological Simulation Program—Fortran, widely available and supported by the U.S. Geological Survey (http://water.usgs.gov/software/HSPF/).
Hypolimnion: In a thermally stratified lake, the deepest layer of water in the lake where the water is coldest and temperatures change less than 1° C per one meter of depth.
ID: Identification code.
KBLI: The code for the National Weather Service station at the Bellingham International Airport.
kg: kilograms, a unit of mass equal to 1,000 grams.
km: kilometer, a unit of length equal to 1,000 meters.
Load Allocation: The portion of a receiving waters’ loading capacity attributed to one or more of its existing or future sources of nonpoint pollution or to natural background sources.
Loading Capacity: The greatest amount of a pollutant that a waterbody can receive and still meet water quality standards.
LWWSD: Lake Whatcom Water and Sewer District, formerly Water District No. 10. Provides water from Lake Whatcom to customers on the south shore and also sewer service. Sewage is sent to the City of Bellingham for treatment.
m: meter, a unit of length.
Margin of Safety (MOS): Required component of TMDLs that accounts for uncertainty about the relationship between pollutant loads and quality of the receiving waterbody.
mg/L: milligrams per liter.
mL: milliliters, a unit of volume.
Municipal Separate Storm Sewer System (MS4): A conveyance or system of conveyances (including roads with drainage systems, municipal streets, catch basins, curbs, gutters, ditches, man-made channels, or storm drains): (i) owned or operated by a state, city, town, borough,

Lake Whatcom Watershed Total Phosphorus and Bacteria TMDLs: WQ Findings Page 143
county, parish, district, association, or other public body having jurisdiction over disposal of wastes, storm water, or other wastes and (ii) designed or used for collecting or conveying stormwater; (iii) which is not a combined sewer; and (iv) which is not part of a Publicly Owned Treatment Works (POTW) as defined in the Code of Federal Regulations at 40 CFR 122.2.
National Pollutant Discharge Elimination System (NPDES): National program for issuing, modifying, revoking and reissuing, terminating, monitoring and enforcing permits, and imposing and enforcing pretreatment requirements under the Clean Water Act. The NPDES program regulates discharges from wastewater treatment plants, large factories, and other facilities that use, process, and discharge water back into lakes, streams, rivers, bays, and oceans.
Nonpoint Source: Pollution that enters any waters of the state from any dispersed land-based or water-based activities, including but not limited to atmospheric deposition, surface water runoff from agricultural lands, urban areas, or forest lands, subsurface or underground sources, or discharges from boats or marine vessels not otherwise regulated under the National Pollutant Discharge Elimination System Program. Generally, any unconfined and diffuse source of contamination. Legally, any source of water pollution that does not meet the legal definition of “point source” in section 502(14) of the Clean Water Act.
Partial Rollback: A projected scenario of land uses changed from current or future conditions to less-developed conditions.
PCBs: Polychlorinated biphenyls, class of organic compounds used for industrial purposes but banned in the 1970s due to high toxicity, bioaccumulation, and persistence in the environment.
pH: a measure of the acidity or alkalinity of water. Values of pH can range from 0 to 14, where a pH of 7 is neutral, less than 7 is acidic and greater than 7 is alkaline. A pH increase of 1 results in water that is ten times more alkaline.
Phase I Stormwater Permit: The first phase of stormwater regulation required under the federal Clean Water Act. The permit is issued to medium and large municipal separate storm sewer systems (MS4s) and construction sites of five or more acres.
Phase II Stormwater Permit: The second phase of stormwater regulation required under the federal Clean Water Act. The permit is issued to smaller municipal separate storm sewer systems (MS4s) and construction sites over one acre.
Point Source: Sources of pollution that discharge at a specific location from pipes, outfalls, and conveyance channels to a surface water. Examples of point source discharges include municipal wastewater treatment plants, municipal stormwater systems, industrial waste treatment facilities, and construction sites that clear more than 5 acres of land.
Pollution: Such contamination, or other alteration of the physical, chemical, or biological properties, of any waters of the state. This includes change in temperature, taste, color, turbidity, or odor of the waters. It also includes discharge of any liquid, gaseous, solid, radioactive, or other substance into any waters of the state. This definition assumes that these changes will, or is likely to, create a nuisance or render such waters harmful, detrimental, or injurious to (1) public health, safety, or welfare, or (2) domestic, commercial, industrial, agricultural, recreational, or other legitimate beneficial uses, or (3) livestock, wild animals, birds, fish, or other aquatic life.

Lake Whatcom Watershed Total Phosphorus and Bacteria TMDLs: WQ Findings Page 144
PSU: Portland State University, a regional state university in Portland Oregon, home of the Vikings.
rTemp: a spreadsheet-based heat response model of stream water temperatures (www.ecy.wa.gov/programs/eap/models.html).
Stormwater: The portion of precipitation that does not naturally percolate into the ground or evaporate but instead runs off roads, pavement, and roofs during rainfall or snow melt. Stormwater can also come from hard or saturated grass surfaces such as lawns, pastures, playfields, and from gravel roads and parking lots.
s.u.: standard units (see “pH” above).
Synoptic: Data collected over a short period of time.
Total Maximum Daily Load (TMDL): A distribution of a substance in a waterbody designed to protect it from exceeding water quality standards. A TMDL is equal to the sum of all of the following: (1) individual wasteload allocations for point sources, (2) the load allocations for nonpoint sources, (3) the contribution of natural sources, and (4) a Margin of Safety to allow for uncertainty in the wasteload determination. A reserve for future growth is also generally provided.
TP: Total Phosphorus, a measurement of the amount of the phosphorus in water, both dissolved and particulate, usually expressed in milligrams per liter.
USU: Utah State University, a regional state university in Logan Utah, home of the Aggies.
Wasteload Allocation: The portion of a receiving water’s loading capacity allocated to existing or future point sources of pollution. Wasteload allocations constitute one type of water quality-based effluent limitation.
Watershed: A drainage area or basin in which all land and water areas drain or flow toward a central collector such as a stream, river, or lake at a lower elevation.
WWU: Western Washington University, a regional state university in Bellingham Washington, home of the Vikings. Acronyms and Abbreviations Following are frequently used acronyms and abbreviations. Ecology Washington State Department of Ecology EPA U.S. Environmental Protection Agency GIS Geographic Information System software NAF New Approximation Flow NSDZ Near-stream disturbance zones RM River mile TIR Thermal infrared radiation

Lake Whatcom Watershed Total Phosphorus and Bacteria TMDLs: WQ Findings Page 145
USFS United States Forest Service USGS United States Geological Survey WAC Washington Administrative Code WDFW Washington Department of Fish and Wildlife WRIA Water Resources Inventory Area WWTP Wastewater treatment plant