lampiran - core.ac.uk · a. all requested variables entered. b. dependent variable: lompat jauh...
TRANSCRIPT

48
Lampiran
49
Lampiran 1. Surat Ijin Penelitian
50
51
52
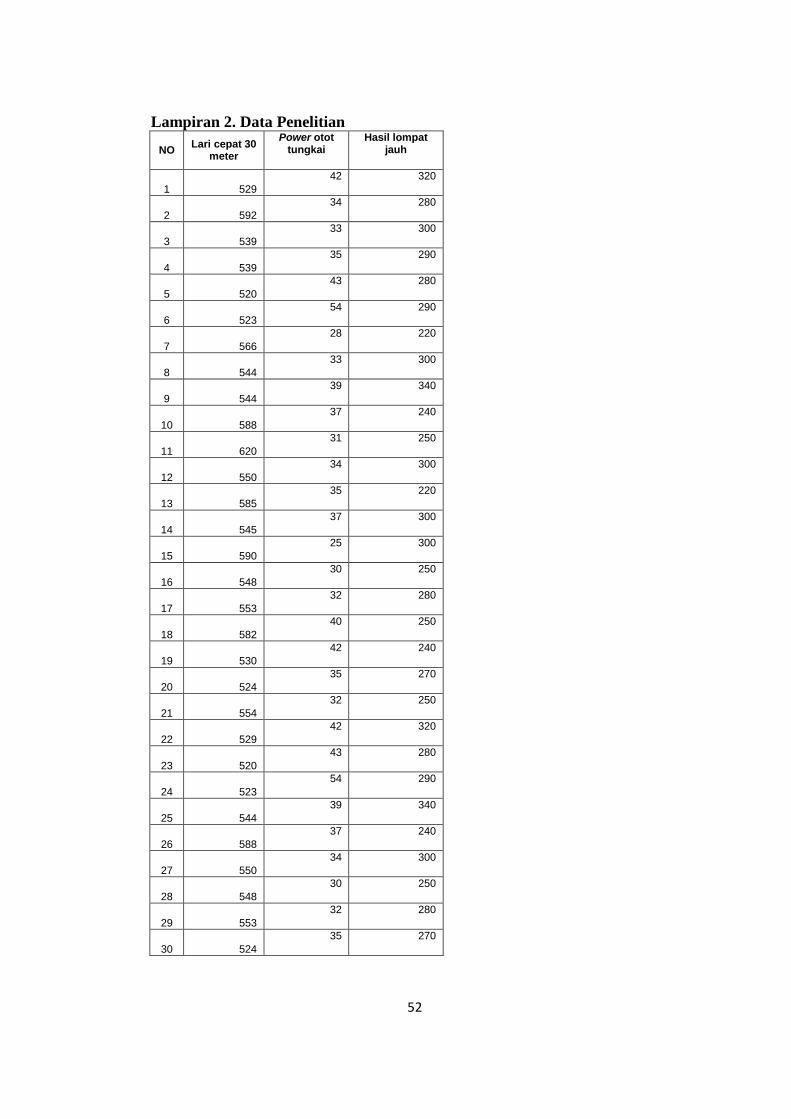
Lampiran 2. Data Penelitian
NO Lari cepat 30
meter
Power otot tungkai
Hasil lompat jauh
1 529
42 320
2 592
34 280
3 539
33 300
4 539
35 290
5 520
43 280
6 523
54 290
7 566
28 220
8 544
33 300
9 544
39 340
10 588
37 240
11 620
31 250
12 550
34 300
13 585
35 220
14 545
37 300
15 590
25 300
16 548
30 250
17 553
32 280
18 582
40 250
19 530
42 240
20 524
35 270
21 554
32 250
22 529
42 320
23 520
43 280
24 523
54 290
25 544
39 340
26 588
37 240
27 550
34 300
28 548
30 250
29 553
32 280
30 524
35 270
53
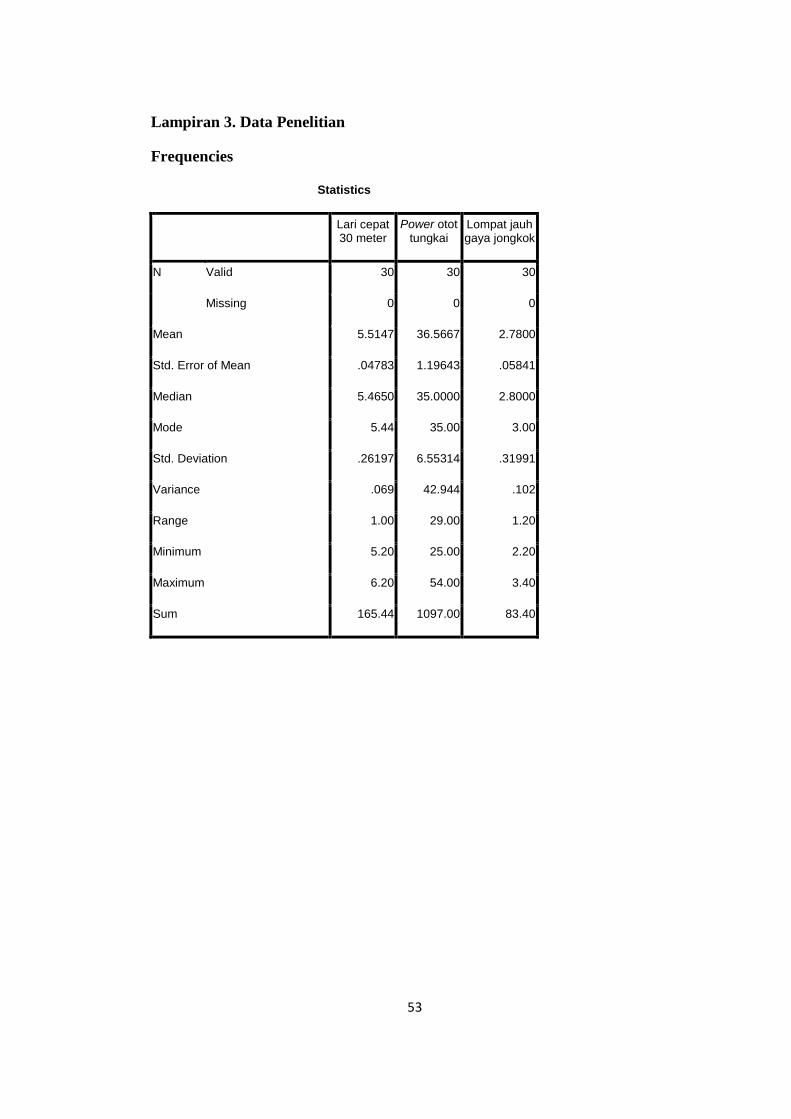
Lampiran 3. Data Penelitian
Frequencies
Statistics
Lari cepat 30 meter
Power otot tungkai
Lompat jauh gaya jongkok
N Valid 30 30 30
Missing 0 0 0
Mean 5.5147 36.5667 2.7800
Std. Error of Mean .04783 1.19643 .05841
Median 5.4650 35.0000 2.8000
Mode 5.44 35.00 3.00
Std. Deviation .26197 6.55314 .31991
Variance .069 42.944 .102
Range 1.00 29.00 1.20
Minimum 5.20 25.00 2.20
Maximum 6.20 54.00 3.40
Sum 165.44 1097.00 83.40
54
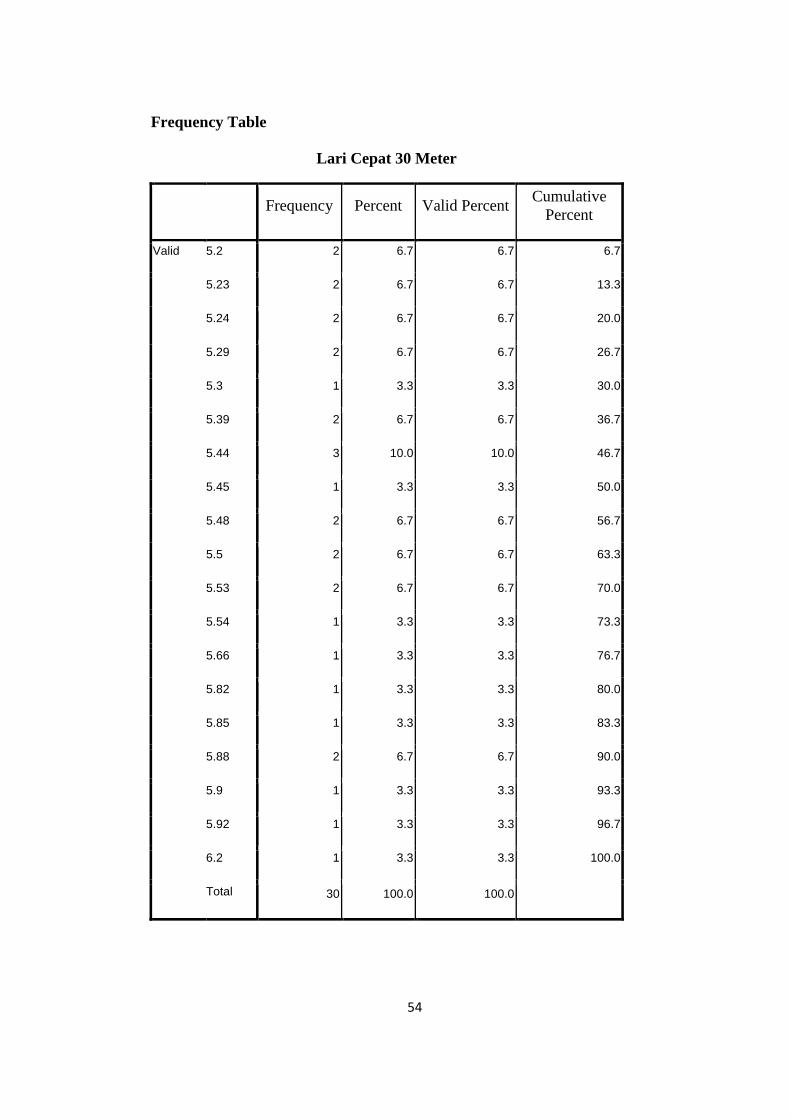
Frequency Table
Lari Cepat 30 Meter
Frequency Percent Valid Percent
Cumulative
Percent
Valid 5.2 2 6.7 6.7 6.7
5.23 2 6.7 6.7 13.3
5.24 2 6.7 6.7 20.0
5.29 2 6.7 6.7 26.7
5.3 1 3.3 3.3 30.0
5.39 2 6.7 6.7 36.7
5.44 3 10.0 10.0 46.7
5.45 1 3.3 3.3 50.0
5.48 2 6.7 6.7 56.7
5.5 2 6.7 6.7 63.3
5.53 2 6.7 6.7 70.0
5.54 1 3.3 3.3 73.3
5.66 1 3.3 3.3 76.7
5.82 1 3.3 3.3 80.0
5.85 1 3.3 3.3 83.3
5.88 2 6.7 6.7 90.0
5.9 1 3.3 3.3 93.3
5.92 1 3.3 3.3 96.7
6.2 1 3.3 3.3 100.0
Total 30 100.0 100.0
55
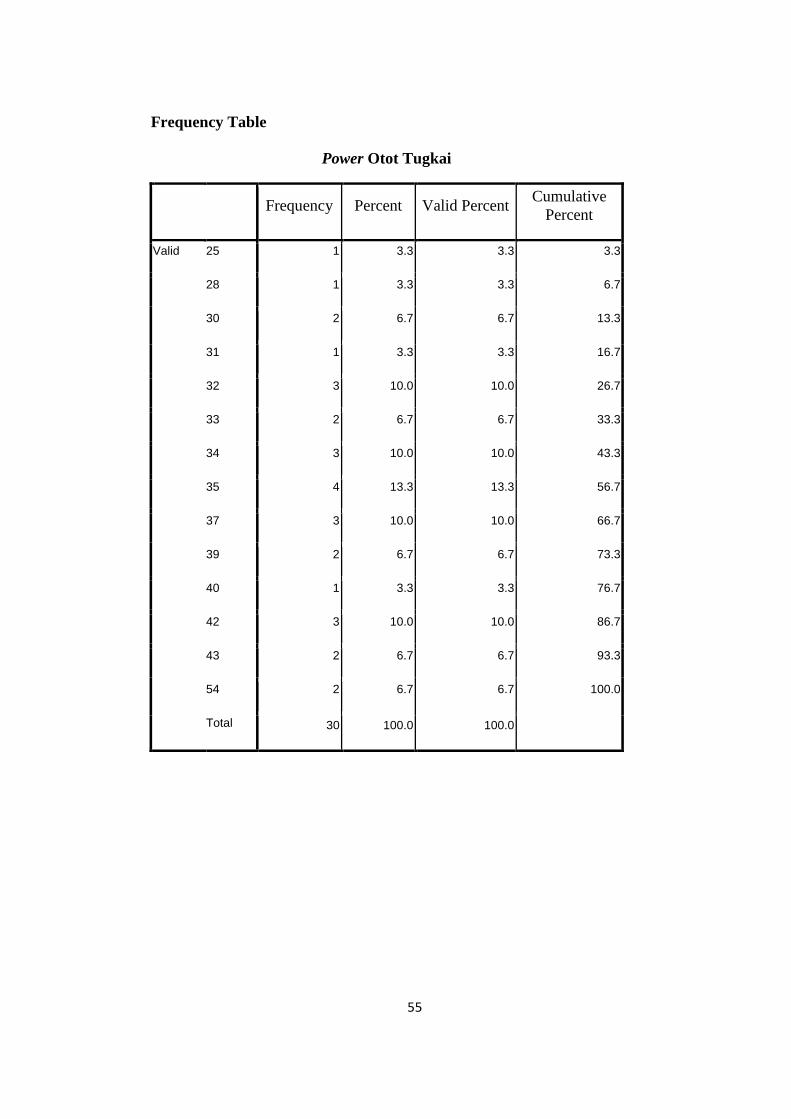
Frequency Table
Power Otot Tugkai
Frequency Percent Valid Percent
Cumulative
Percent
Valid 25 1 3.3 3.3 3.3
28 1 3.3 3.3 6.7
30 2 6.7 6.7 13.3
31 1 3.3 3.3 16.7
32 3 10.0 10.0 26.7
33 2 6.7 6.7 33.3
34 3 10.0 10.0 43.3
35 4 13.3 13.3 56.7
37 3 10.0 10.0 66.7
39 2 6.7 6.7 73.3
40 1 3.3 3.3 76.7
42 3 10.0 10.0 86.7
43 2 6.7 6.7 93.3
54 2 6.7 6.7 100.0
Total 30 100.0 100.0
56
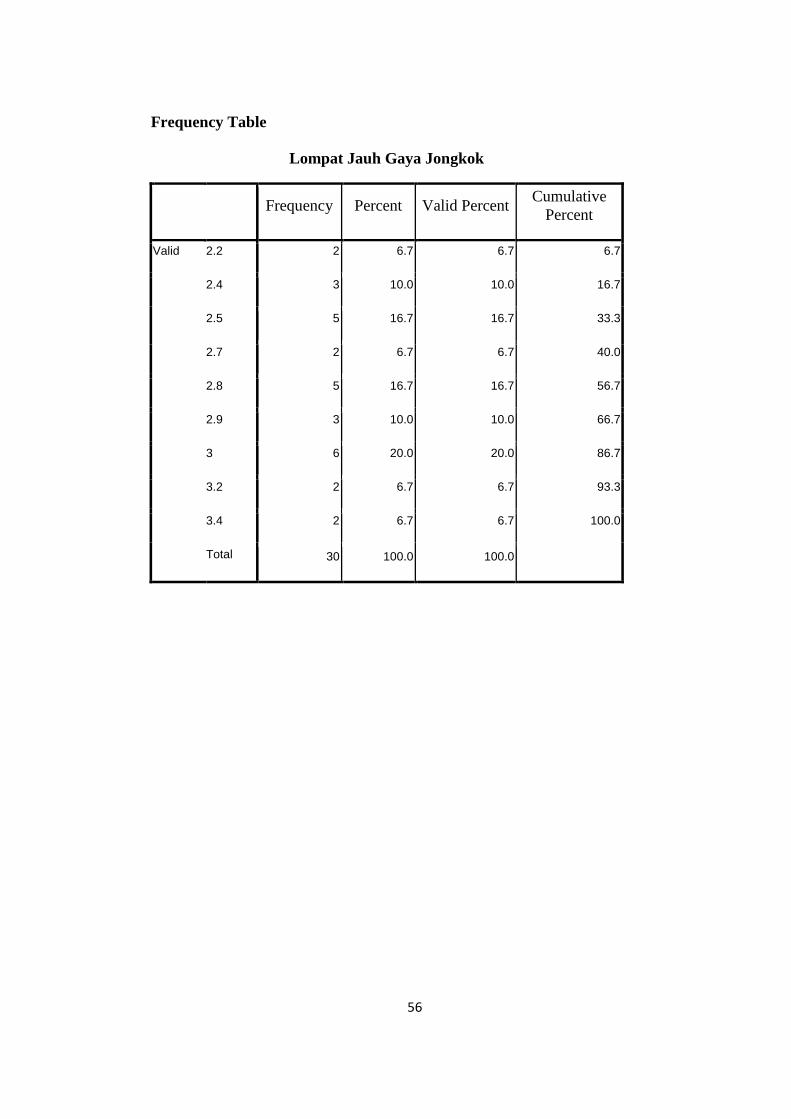
Frequency Table
Lompat Jauh Gaya Jongkok
Frequency Percent Valid Percent
Cumulative
Percent
Valid 2.2 2 6.7 6.7 6.7
2.4 3 10.0 10.0 16.7
2.5 5 16.7 16.7 33.3
2.7 2 6.7 6.7 40.0
2.8 5 16.7 16.7 56.7
2.9 3 10.0 10.0 66.7
3 6 20.0 20.0 86.7
3.2 2 6.7 6.7 93.3
3.4 2 6.7 6.7 100.0
Total 30 100.0 100.0
57
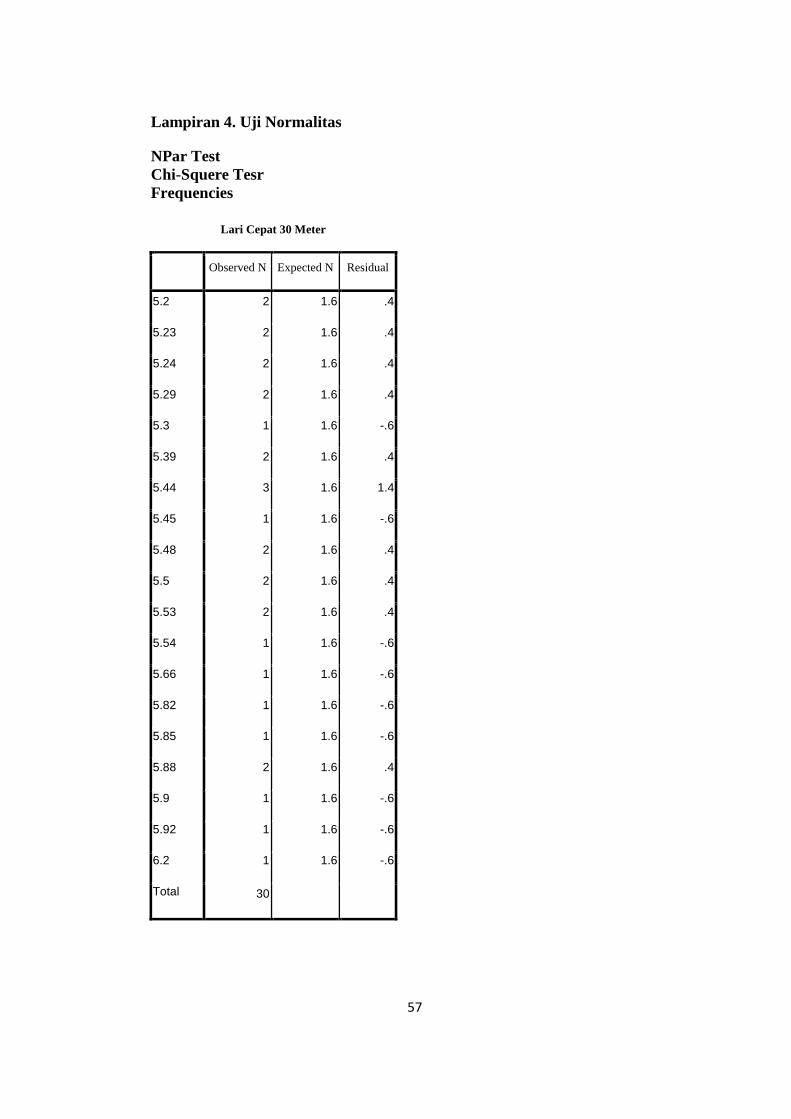
Lampiran 4. Uji Normalitas
NPar Test
Chi-Squere Tesr
Frequencies
Lari Cepat 30 Meter
Observed N Expected N Residual
5.2 2 1.6 .4
5.23 2 1.6 .4
5.24 2 1.6 .4
5.29 2 1.6 .4
5.3 1 1.6 -.6
5.39 2 1.6 .4
5.44 3 1.6 1.4
5.45 1 1.6 -.6
5.48 2 1.6 .4
5.5 2 1.6 .4
5.53 2 1.6 .4
5.54 1 1.6 -.6
5.66 1 1.6 -.6
5.82 1 1.6 -.6
5.85 1 1.6 -.6
5.88 2 1.6 .4
5.9 1 1.6 -.6
5.92 1 1.6 -.6
6.2 1 1.6 -.6
Total 30
58
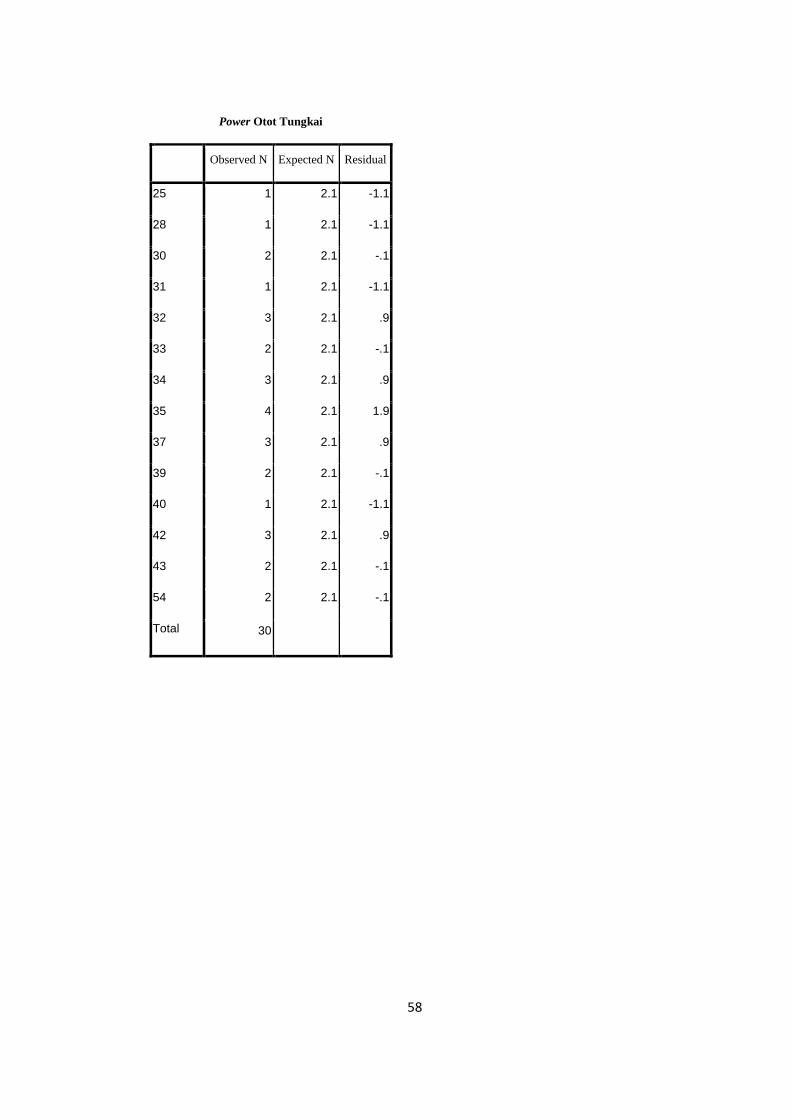
Power Otot Tungkai
Observed N Expected N Residual
25 1 2.1 -1.1
28 1 2.1 -1.1
30 2 2.1 -.1
31 1 2.1 -1.1
32 3 2.1 .9
33 2 2.1 -.1
34 3 2.1 .9
35 4 2.1 1.9
37 3 2.1 .9
39 2 2.1 -.1
40 1 2.1 -1.1
42 3 2.1 .9
43 2 2.1 -.1
54 2 2.1 -.1
Total 30
59
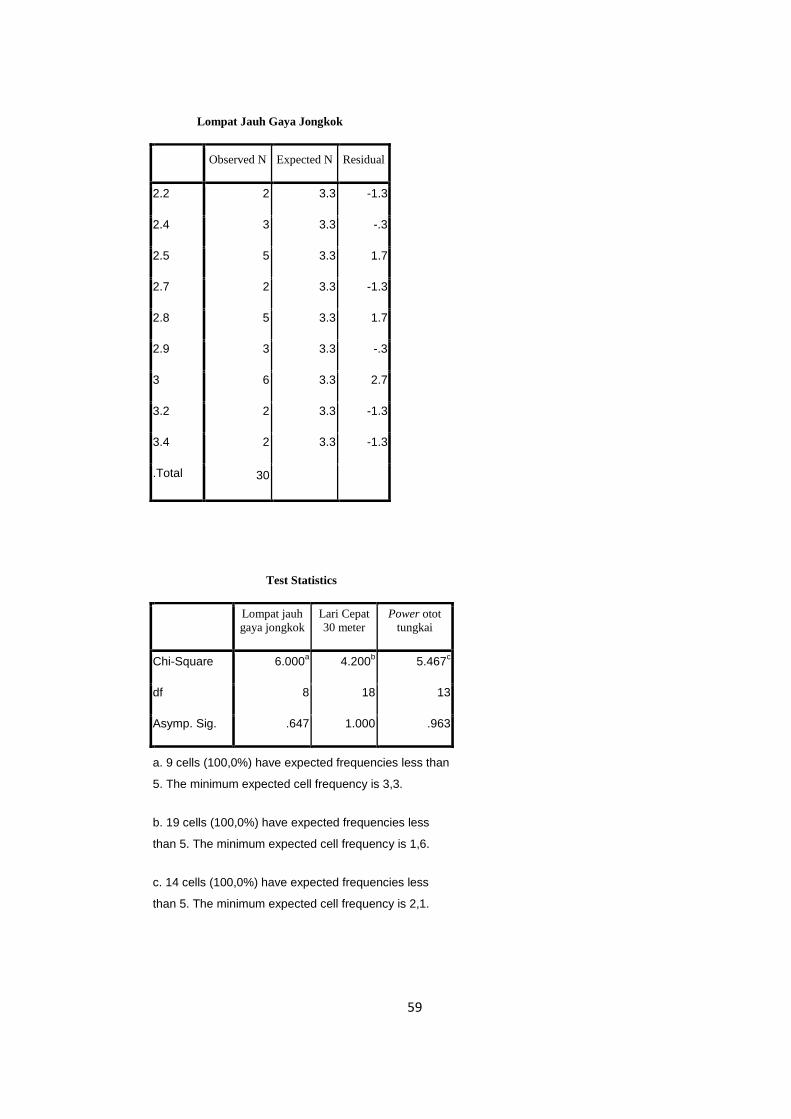
Lompat Jauh Gaya Jongkok
Observed N Expected N Residual
2.2 2 3.3 -1.3
2.4 3 3.3 -.3
2.5 5 3.3 1.7
2.7 2 3.3 -1.3
2.8 5 3.3 1.7
2.9 3 3.3 -.3
3 6 3.3 2.7
3.2 2 3.3 -1.3
3.4 2 3.3 -1.3
.Total 30
Test Statistics
Lompat jauh
gaya jongkok
Lari Cepat
30 meter
Power otot
tungkai
Chi-Square 6.000a 4.200
b 5.467
c
df 8 18 13
Asymp. Sig. .647 1.000 .963
a. 9 cells (100,0%) have expected frequencies less than
5. The minimum expected cell frequency is 3,3.
b. 19 cells (100,0%) have expected frequencies less
than 5. The minimum expected cell frequency is 1,6.
c. 14 cells (100,0%) have expected frequencies less
than 5. The minimum expected cell frequency is 2,1.
60
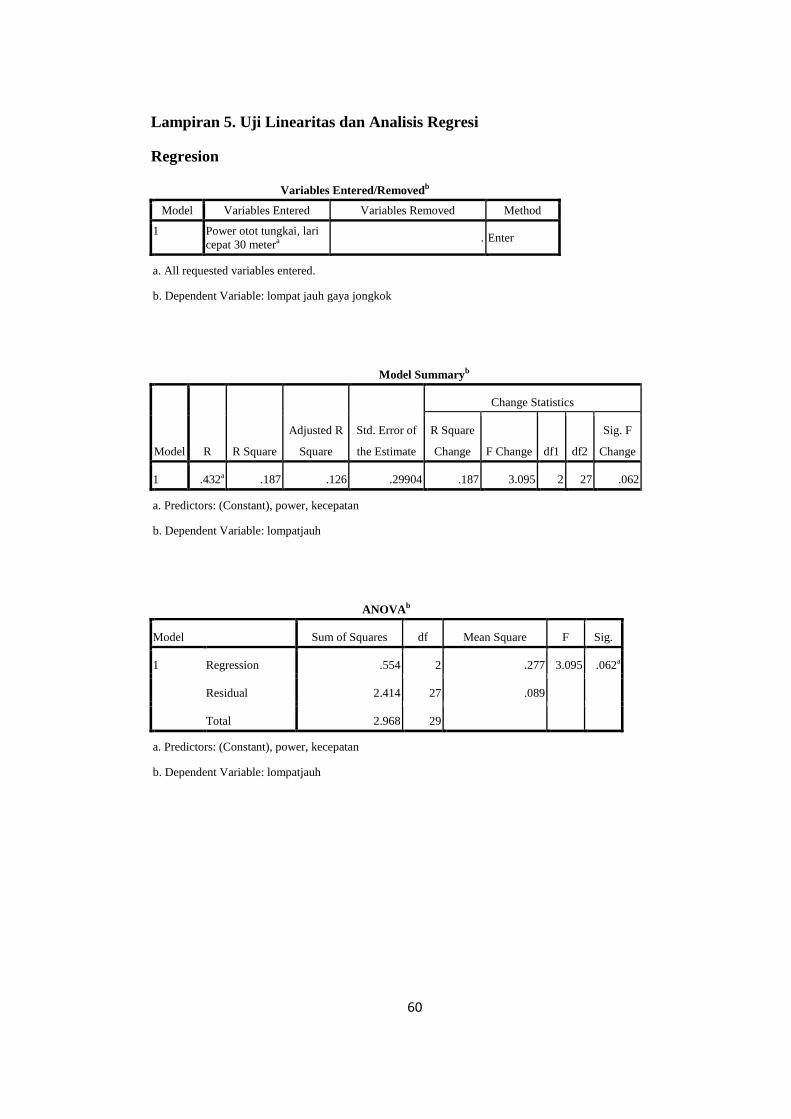
Lampiran 5. Uji Linearitas dan Analisis Regresi
Regresion
Variables Entered/Removedb
Model Variables Entered Variables Removed Method
1 Power otot tungkai, lari
cepat 30 metera . Enter
a. All requested variables entered.
b. Dependent Variable: lompat jauh gaya jongkok
Model Summaryb
Model R R Square
Adjusted R
Square
Std. Error of
the Estimate
Change Statistics
R Square
Change F Change df1 df2
Sig. F
Change
1 .432a .187 .126 .29904 .187 3.095 2 27 .062
a. Predictors: (Constant), power, kecepatan
b. Dependent Variable: lompatjauh
ANOVAb
Model Sum of Squares df Mean Square F Sig.
1 Regression .554 2 .277 3.095 .062a
Residual 2.414 27 .089
Total 2.968 29
a. Predictors: (Constant), power, kecepatan
b. Dependent Variable: lompatjauh
61
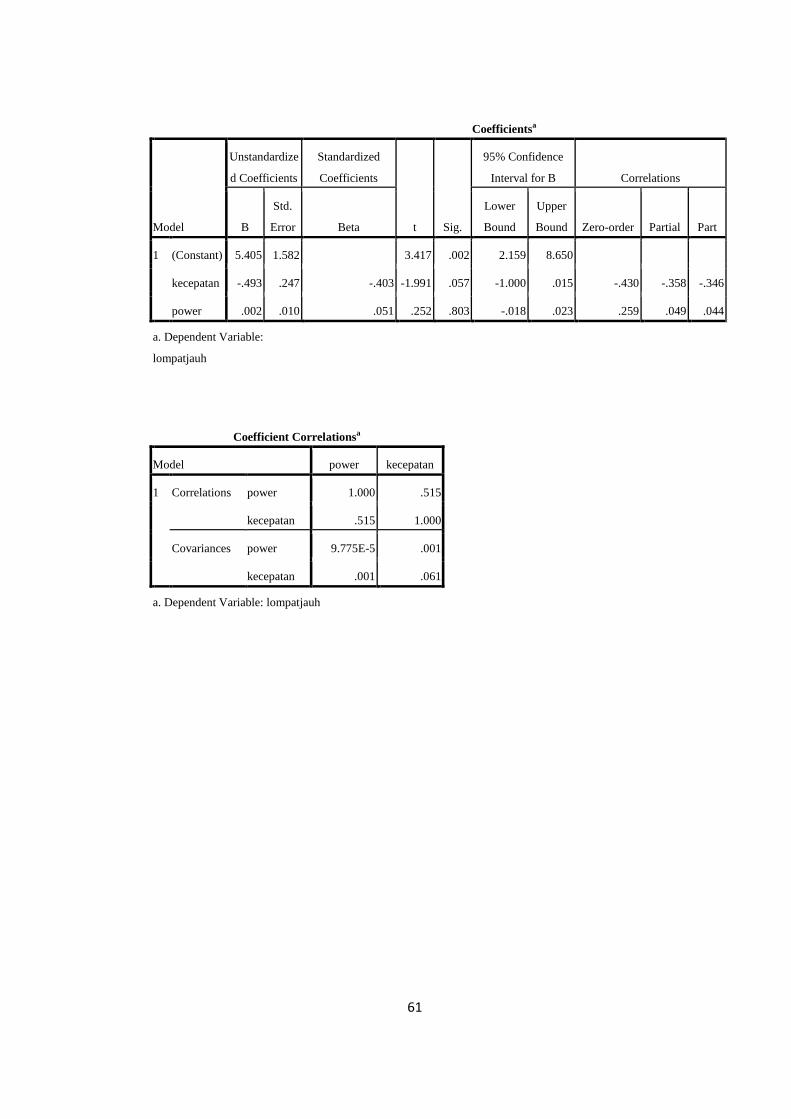
Coefficientsa
Model
Unstandardize
d Coefficients
Standardized
Coefficients
t Sig.
95% Confidence
Interval for B Correlations
B
Std.
Error Beta
Lower
Bound
Upper
Bound Zero-order Partial Part
1 (Constant) 5.405 1.582 3.417 .002 2.159 8.650
kecepatan -.493 .247 -.403 -1.991 .057 -1.000 .015 -.430 -.358 -.346
power .002 .010 .051 .252 .803 -.018 .023 .259 .049 .044
a. Dependent Variable:
lompatjauh
Coefficient Correlationsa
Model power kecepatan
1 Correlations power 1.000 .515
kecepatan .515 1.000
Covariances power 9.775E-5 .001
kecepatan .001 .061
a. Dependent Variable: lompatjauh

62
Lampiran 6. Analisis Korelasi
Correlations
Correlations
lompatjauh power kecepatan
Pearson Correlation lompatjauh 1.000 .259 -.430
power .259 1.000 -.515
kecepatan -.430 -.515 1.000
Sig. (1-tailed) lompatjauh . .084 .009
power .084 . .002
kecepatan .009 .002 .
N lompatjauh 30 30 30
power 30 30 30
kecepatan 30 30 30
63
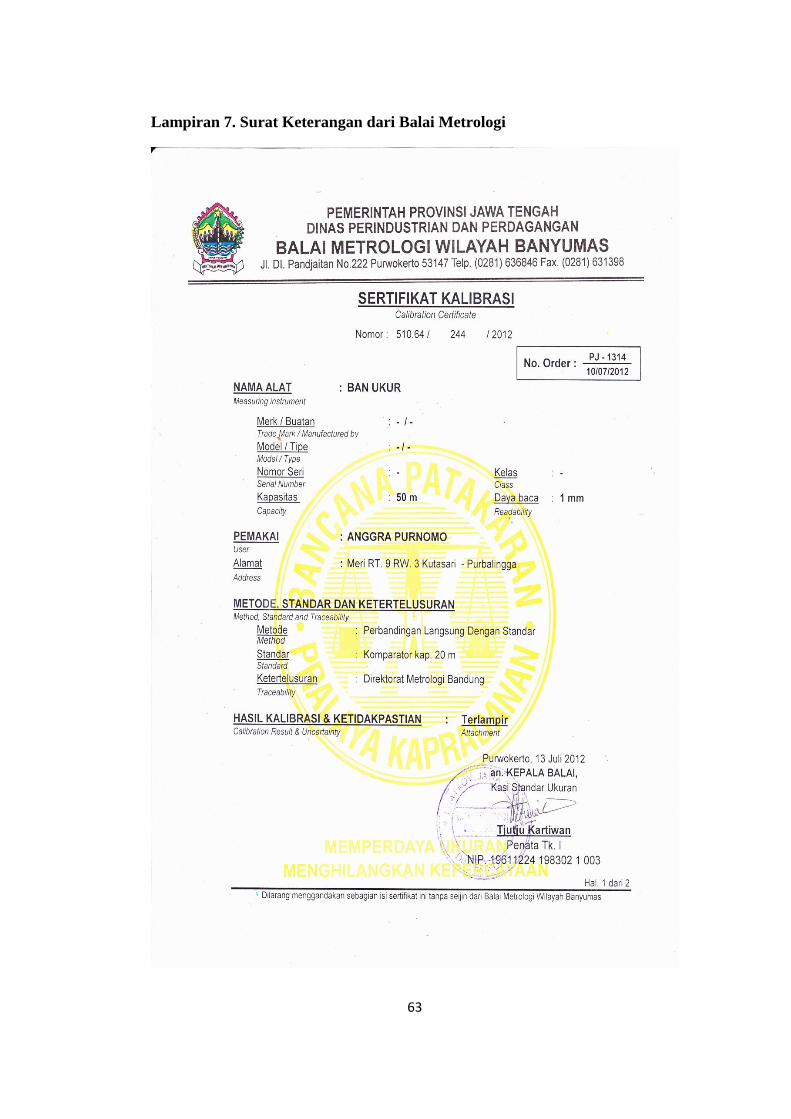
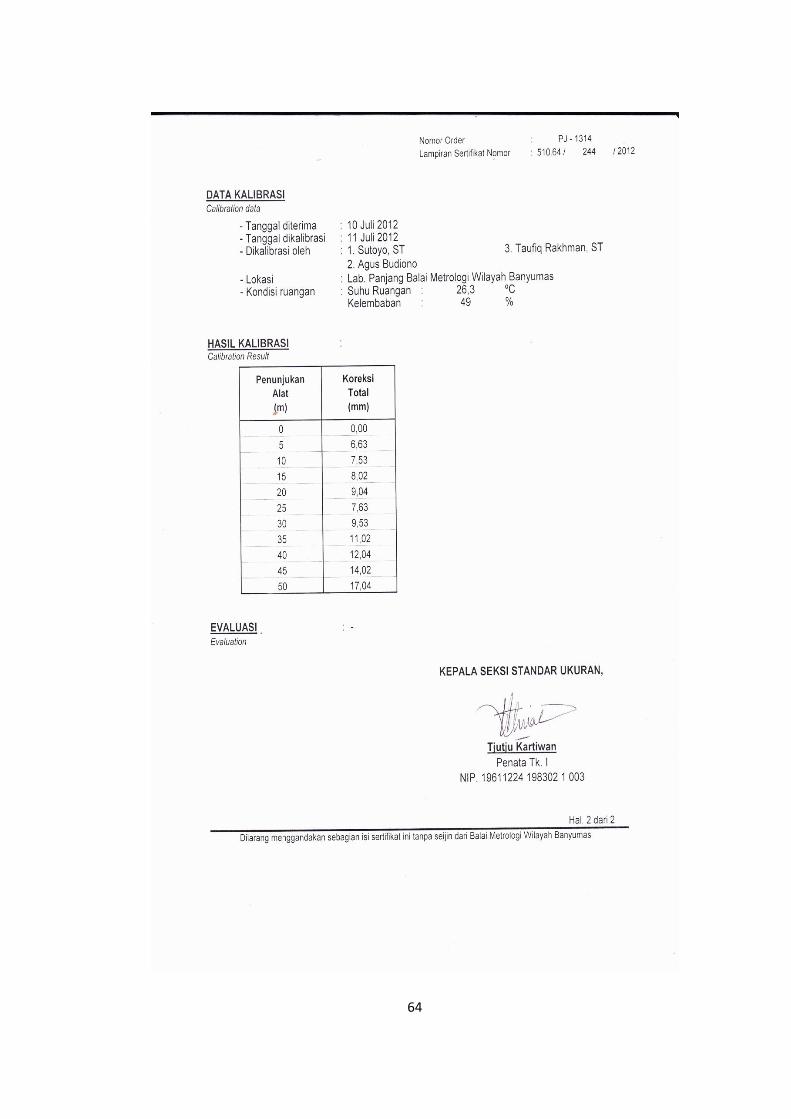
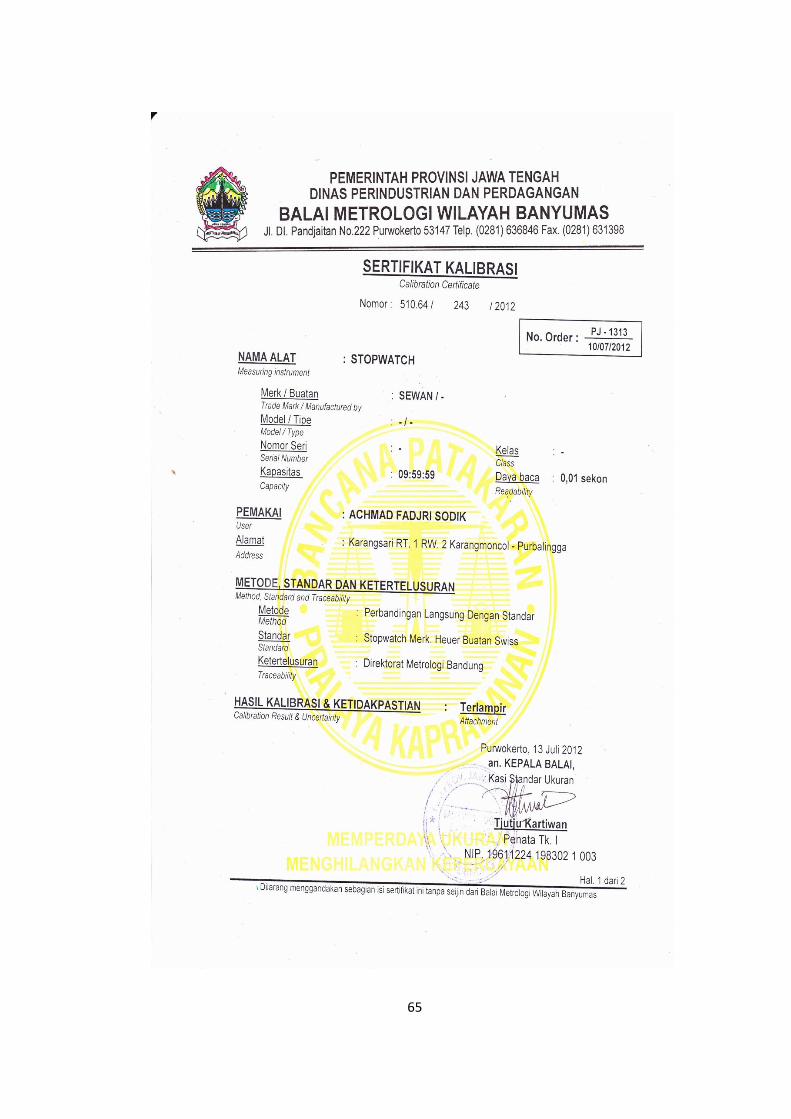
Lampiran 7. Surat Keterangan dari Balai Metrologi
64
65
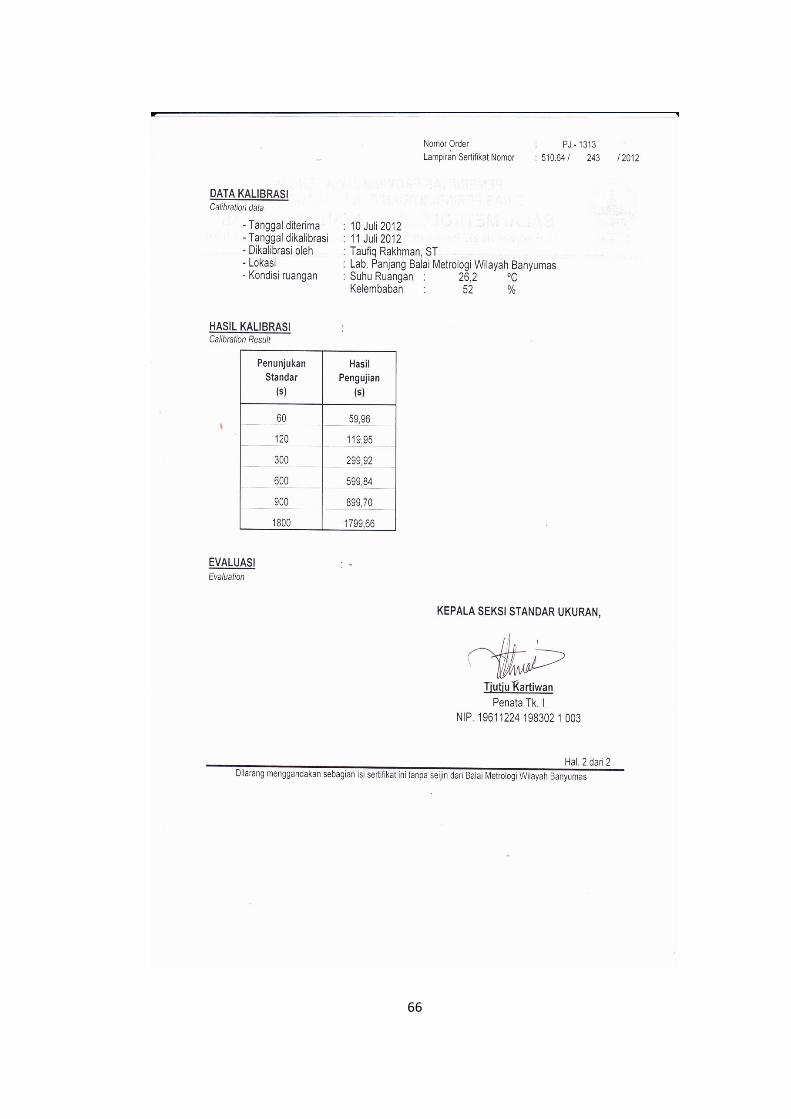
66
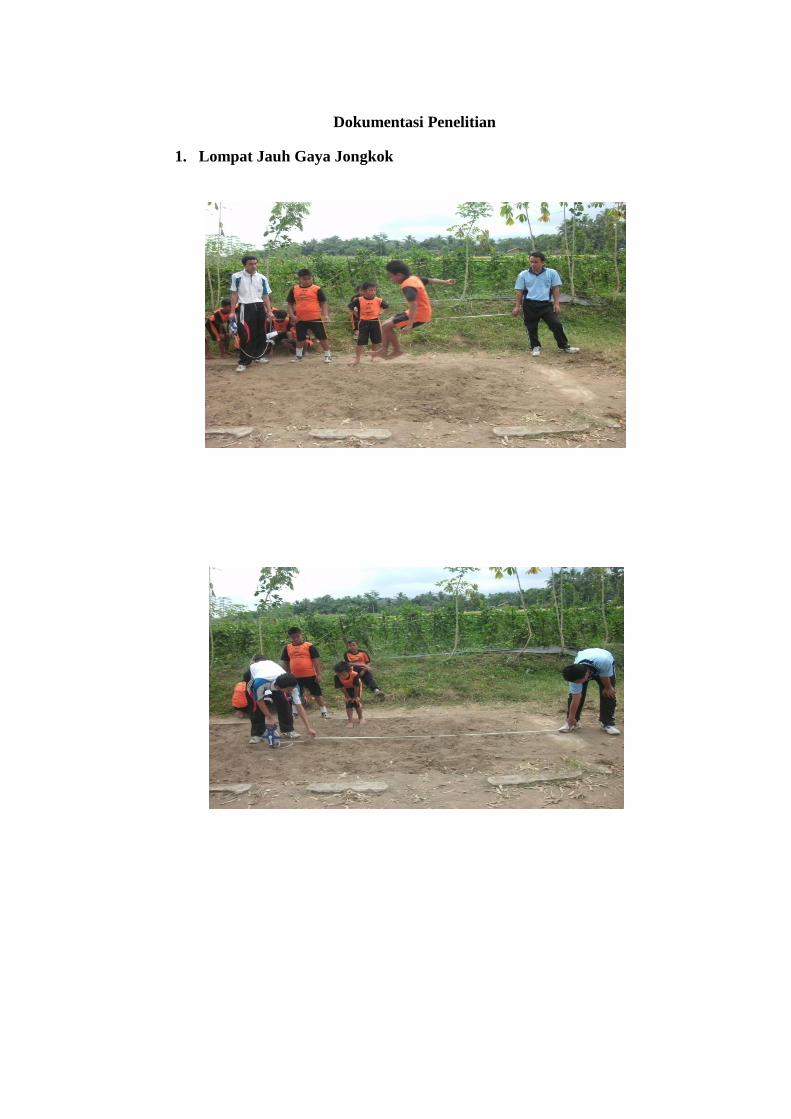
Dokumentasi Penelitian
1. Lompat Jauh Gaya Jongkok
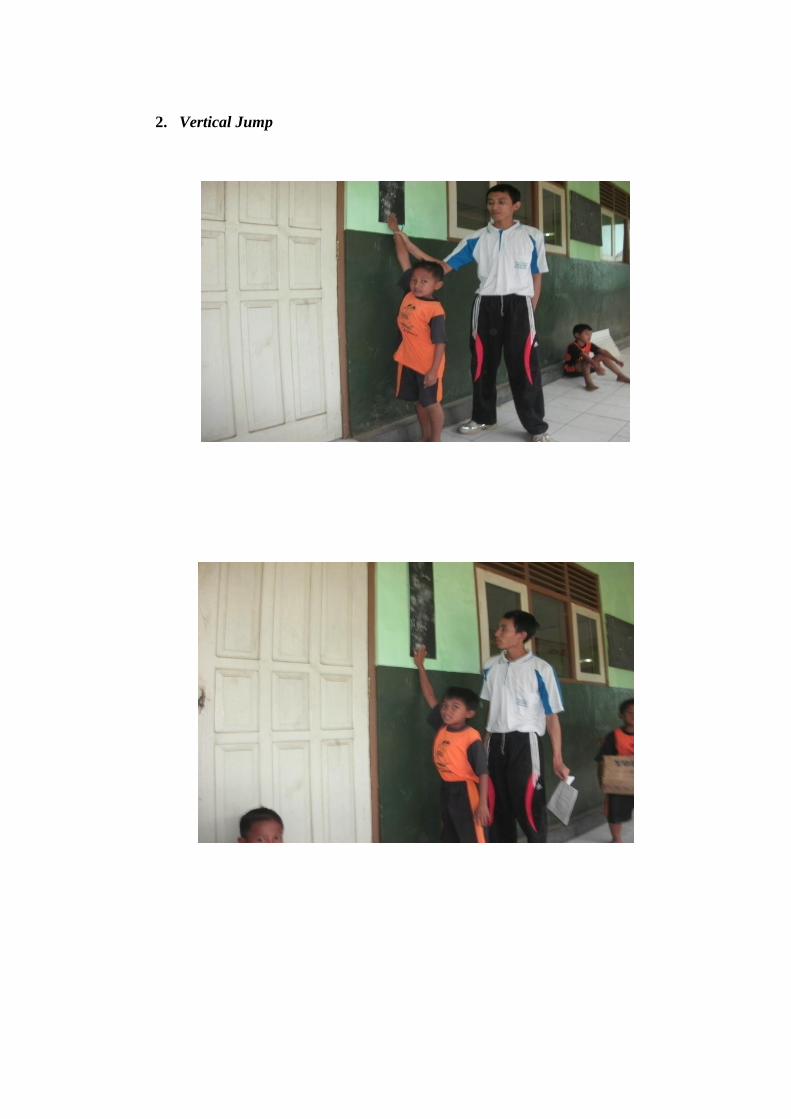
2. Vertical Jump
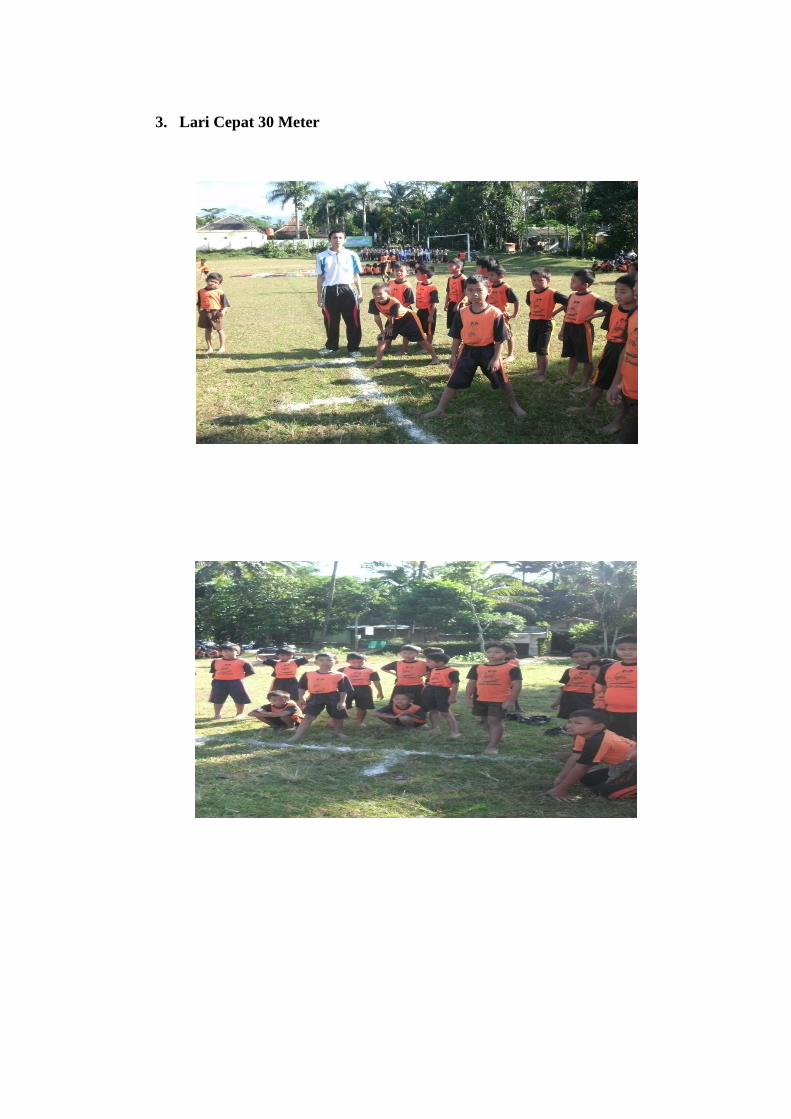
3. Lari Cepat 30 Meter