lancaster colony corporation baird 2017 global...
TRANSCRIPT

Lancaster Colony Corporation
Baird 2017 Global Consumer, Technology & Services Conference
June 7, 2017
Presenters: Jay Gerlach, Chairman and Chief Executive OfficerDave Ciesinski, President and Chief Operating Officer

This presentation was prepared by Lancaster Colony Corporation for information purposes only and is not an offer
or solicitation with respect to the purchase or sale of Company securities. We desire to take advantage of the
“safe harbor” provisions of the Private Securities Litigation Reform Act of 1995 (the “PSLRA”). Any statements
concerning the Company’s future performance included in this presentation or made orally to the recipients of this
presentation are “forward–looking statements” within the meaning of the PSLRA and other applicable securities
laws. Such statements can be identified by the use of the forward-looking words “anticipate,” “estimate,”
“project,” “believe,” “intend,” “plan,” “expect,” “hope” or similar words. These statements discuss future
expectations; contain projections regarding future developments, operations or financial conditions; or state other
forward-looking information. Such statements are based upon assumptions and assessments made by us in light of
our experience and perception of historical trends, current conditions, expected future developments and other
factors we believe to be appropriate. These forward-looking statements involve various important risks,
uncertainties and other factors that could cause our actual results to differ materially from those expressed in the
forward-looking statements. Actual results may differ as a result of factors over which we have no, or limited,
control. Management believes these forward-looking statements to be reasonable; however, you should not place
undue reliance on such statements that are based on current expectations. For example, fluctuations in the market
price of material or freight costs or general economic conditions for domestic consumers, over which we have no
control, may significantly influence our financial results. Forward-looking statements speak only as of the date they
are made, and we undertake no obligation to update such forward-looking statements. More detailed statements
regarding significant events that could affect our financial results are included in our Annual Report on Form 10-K
and Quarterly Reports on Form 10-Q as filed with the Securities and Exchange Commission and available at
www.lancastercolony.com.
Safe Harbor Statement
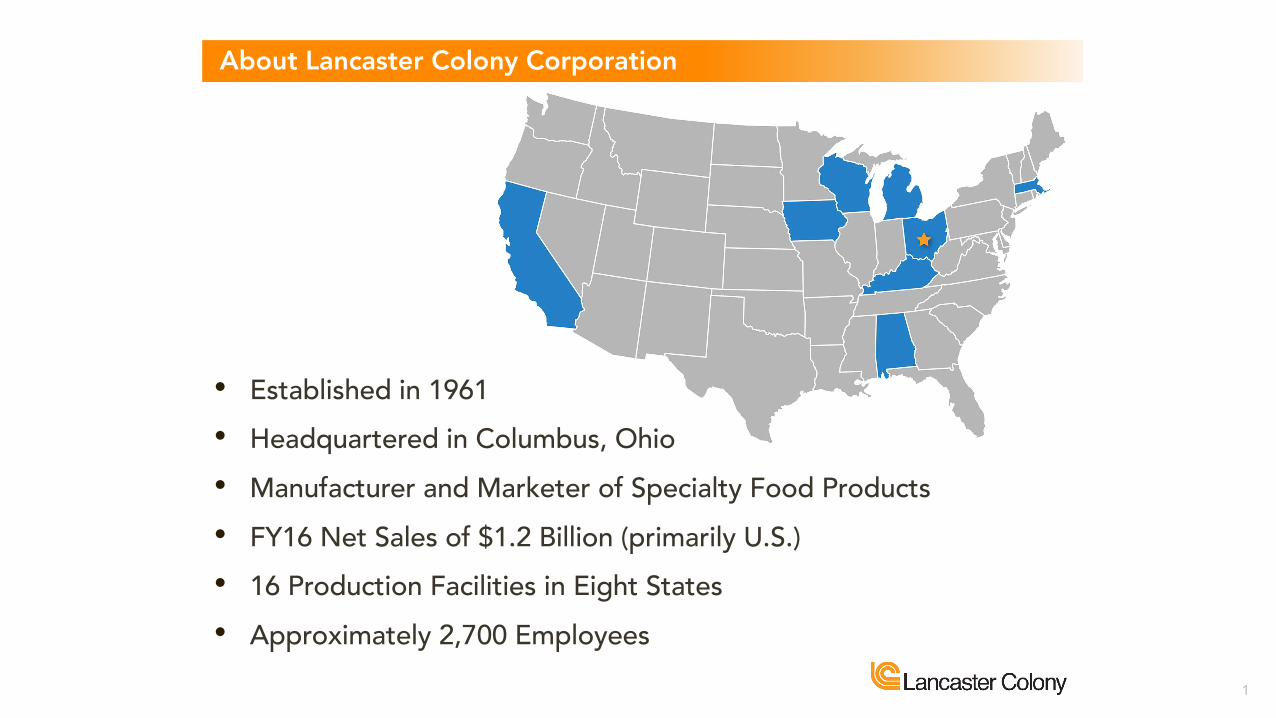
• Established in 1961• Headquartered in Columbus, Ohio• Manufacturer and Marketer of Specialty Food Products• FY16 Net Sales of $1.2 Billion (primarily U.S.)• 16 Production Facilities in Eight States• Approximately 2,700 Employees
About Lancaster Colony Corporation
1

• Leading Market Share Position in Six Retail Food Categories• Supplier to 18 of the Top 25 National Restaurant Chains• Long History of Sustained Organic Sales Growth • Strong Cash Flows• One of 14 U.S. Companies to have Increased Regular Cash
Dividend for 54 Consecutive Years
Company Highlights
2

Foodservice 48%Retail 52%
Based on approximated net sales for the 12 months ending June 30, 2016
Frozen20%
Produce & Deli19%
Grocery13% Industrial
2%
NationalAccounts
36%
Branded10%
Specialty Foods - Product Mix
3

Produce& Deli37%
Frozen39%
Grocery24%
Retail Sales Mix
Based on approximated net sales for the 12 months ending June 30, 2016
Note: Olive Garden SM dressings are produced and sold to retailers under a licensing agreement with Darden Restaurants. 4

Marzetti25.1%
All Others20.2%
Bolthouse12.3%
Litehouse21.0%
Marie’s21.4%
52 weeks ending 7/10/16, Source: IRI, Total U.S. Multi-Outlet
Refrigerated Dressing Market Share
5

Marzetti82.5%
All Others1.1%
Litehouse10.6%
Jimmy’s2.3%
Private Label3.5%
Produce Dip Market Share
52 weeks ending 7/10/16, Source: IRI, Total U.S. Multi-Outlet6

Pepperidge Farm15.3%New York Bakery
40.1%
Cole’s10.7%
Private Label28.6%
All Others5.3%
Frozen Garlic Bread Market Share
52 weeks ending 7/10/16, Source: IRI, Total U.S. Multi-Outlet7

All Others12.5%
Private Label6.3%
Rhodes30.0%
Sister Schubert’s51.2%
52 weeks ending 7/10/16, Source: IRI, Total U.S. Multi-Outlet
Frozen Roll Market Share
8

Mrs. Cubbison’s /Fresh Gourmet
27.7%
All Others6.2%
Private Label19.2%
Marzetti, Cardini’s,New York Bakery,Chatham Village
36.7%
Rothbury Farms10.2%
52 weeks ending 7/10/16, Source: IRI, Total U.S. Multi-Outlet
Crouton Market Share
9

Joseph’s14.2%
All Others38.6%
Toufayan14.1%
Tumaros6.9%
Flatout22.4%
Mission3.8%
52 weeks ending 7/10/16, Source: IRI, Total U.S. Multi-Outlet
Flatbread/Healthy Wraps/Pita Bread Market Share
10

National Accounts75%
Branded21%
Industrial4%
Foodservice Sales
Based on approximated net sales for the 12 months ending June 30, 2016 12

Dressings
Foodservice Products
Pasta
BreadsSauces
11

Lancaster Colony Corporation
Dave CiesinskiPresident and Chief Operating Officer
13

$1,200
$600
20161980 1990 2000
$ in Millions
$1,191.1Compound Annual Growth Rate – 12%
$5.2
1971 2010
Specialty Foods Net Sales
Net sales information is presented as originally reported in Lancaster Colony's Annual Report for the fiscal yearsending June 30. Therefore, certain years may not reflect adjustments for subsequent accounting changes.
*Compound Annual Growth Rate calculated from fiscal year 1972 through fiscal year 2016. 14

Sister Schubert’s®
Marzetti®
Portfolio of Strong Brands
$ Sales: 63.3MMRef. Dressing
$ Share: 16.0%
Marzetti® Simply Dressed® Olive GardenSM
$ Sales: 128.5MMDips
$ Share: 82.5%$ Sales: 36.0MM$ Share: 9.1%
$ Sales: 57.9MM$ Share: 3.3%
New York Brand® Bakery
$ Sales: 209.6MM$ Share: 40.1%
$ Sales: 109.7MM$ Share: 51.2%
Flatout®
$ Sales: 53.7MM$ Share: 22.4%
*Retailer sales and market share data for the 52 weeks ended 7/10/16. Source: IRI, Total U.S. Multi-Outlet
Note: Olive GardenSM dressings are produced and sold to retailers under a licensing agreement with Darden Restaurants.15

Consumers More Diverse
Demographic Changes Impacting the Food Industry
Millennials - Largest Cohort/Slow to Launch
Trends are Shifting
Resulting in a Disruptive Change in Food
16

Demographic Changes Impacting the Food Industry
…Now traffic heavily favors the store perimeter
High Foot Traffic Category
Low Foot Traffic Category
Layout of Typical Grocery Store
Prod
uce Frozen
Food
Bee
r / W
ineDry
Grocery
Meat Dairy+6%
+5% +3%
+5%+1%+1%+4%
*Branded Specialty Bakery Products & Deli Prep
Source: IRI. (Annualized changes for the three-year period ended 4/16/17).
Total Category $ Sales Growth Rate
(Unit sales declining) (Unit sales declining)
17

Large Food Co’s
Demographic Changes Impacting the Food Industry
Retail Food Industry (Yesterday)
Private Label Co’s
18
Organic/Natural Co’s

Large Food Co’s
Demographic Changes Impacting the Food Industry
Retail Food Industry (Today/Tomorrow)
Company1+5+9
Company2+6
Company11+12
Private Label Co’s
19
Organic/Natural Co’s
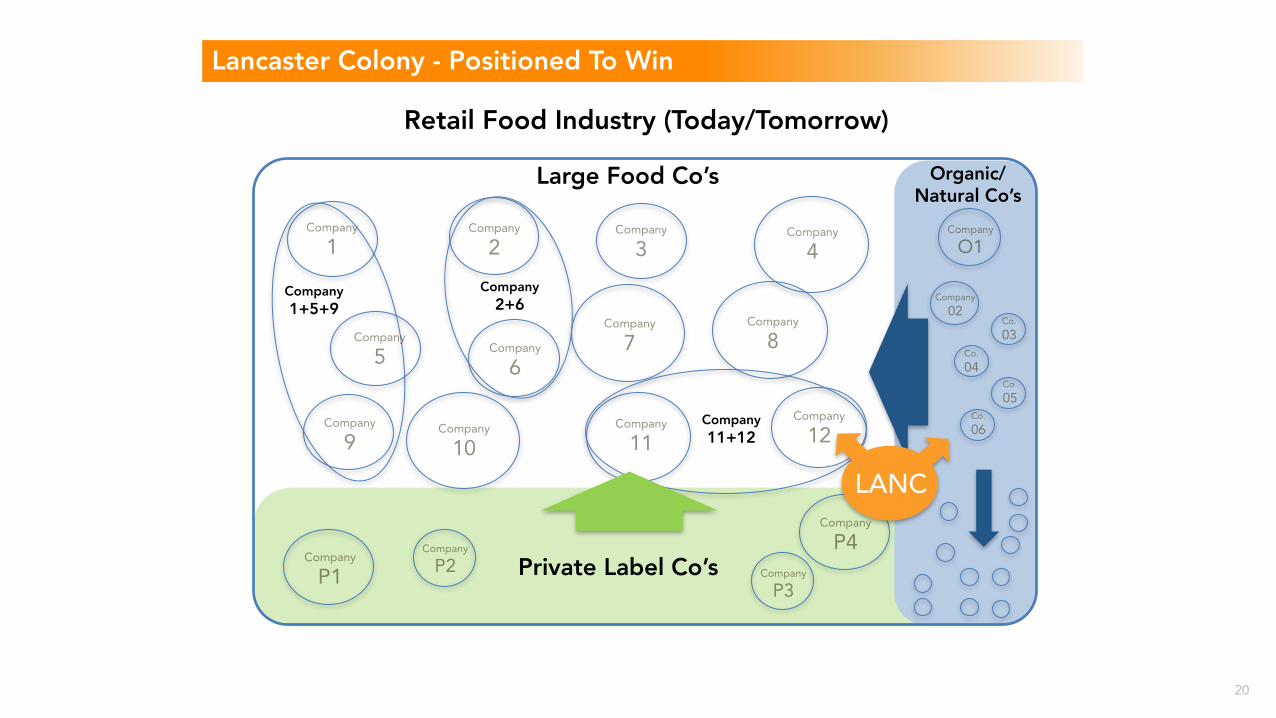
Lancaster Colony - Positioned To Win
Retail Food Industry (Today/Tomorrow)
Private Label Co’s
LANC
Organic/Natural Co’s
Large Food Co’s
Company1+5+9
Company2+6
Company11+12
20

Growth – Portfolio Segmentation
Some Brands/Categories are Well Positioned for Strong Top-Line
Growth
Some Brands/Categories are Well Positioned for Strong OI and
Cash Flow
Growth BusinessesFocus, Invest, Grow
Foundation BusinessesSupport, Invest, Sustain
1st Choice is where we’ll play….Portfolio Segmentation
• Produce Dressings/ Dips• Fresh Dips• Branded Specialty
Bakery
• Frozen Bakery• Dry Grocery• Other Categories
Note: Olive GardenSM dressings are produced and sold to retailers under a licensing agreement with Darden Restaurants. 21

Growth – Three Imperatives
Accelerate Base Business Growth
Simplify OurSupply Chain
Expand Core w/ Focused M&A
Time
Gro
wth
+
+
2016 2021
=
Lancaster Colony
2nd Choice is how we’ll win…Focus on Three Imperatives
22

Growth – Three Imperatives
Accelerate Base Business Growth
Simplify Our Supply Chain
Expand Core w/ Focused M&A
Time
Gro
wth
+
+
2016 2021
=
Lancaster Colony
Accelerate Base Business Growth
2. Renovate Existing Products/Brands
3. Win at the Shelf
Operating Priorities
1. Launch New Innovation Platforms
23

Growth – Three Imperatives
Accelerate Base Business Growth
Simplify OurSupply Chain
Expand Core w/ Focused M&A
Time
Gro
wth
+
+
2016 2021
=
Lancaster Colony
Simplify Our Supply Chain
Operating Priorities
2. Integrated Business Planning
3. Optimize Supply Chain Capabilities
1. Lean Six Sigma/ Operational Excellence
24

Growth – Three Imperatives
Accelerate Base Business Growth
Simplify OurSupply Chain
Expand Core w/ Focused M&A
Time
Gro
wth
+
+
2016 2021
=
Lancaster Colony
Expand Core with Focused M&A
Operating Priorities
2. Focus on Branded Retail
1. Drive Profitable Growth
25

Net sales information is presented as originally reported in Lancaster Colony's Annual Report for the fiscal yearsending June 30. Therefore, certain years may not reflect adjustments for subsequent accounting changes.
*Compound Annual Growth Rate calculated from fiscal year 1972 through fiscal year 2016.
$1,200
$600
20161980 1990 2000
Net Sales $ in Millions
Compound Annual Growth Rate12%*
$5.2
1971 2010
Successful Track Record of Growth through Acquisitions
1969
1997
19781989
2000
2015
2003
26

Lancaster Colony Corporation
“The Better Food Company”“Better People, that Make Better Products, in a Better Corporate Culture,
that Work in Unison to Make the World a Little Bit Better Place”
27

Lancaster Colony Corporation
BAIRDJune 2017 Global Consumer,Technology & Services Conference