lawyer ceos and corporate innovation
TRANSCRIPT
Lawyer CEOs and Corporate Innovation*
Ronald Anderson
Fox School of Business
Temple University
Cheng “Jason” Jiang
Fox School of Business
Temple University
Barbara Su
Fox School of Business
Temple University
*We thank Claudia Custodio, Yi Liang, Kelvin Tan (discussant), and participants at the finance seminar of University
of Melbourne, Australian National University, Florida International University, and Asian Finance Association
Annual Meeting for helpful comments.
Lawyer CEOs and Corporate Innovation
Abstract
We examine whether CEOs with law education backgrounds (i.e., lawyer CEOs) exert a different
influence on firm innovation relative to other CEO types. CEOs with legal backgrounds arguably
enforce better compliance with governance, social and law norms than CEOs from other
backgrounds, leading to a more risk-averse approach to business activities and thereby impeding
corporate innovation. Consistent with this argument, we find that firms with lawyer CEOs are
associated with worse innovation outcomes, measured by patents and citations. This finding is
robust to alternative identification strategies, such as instrumental variable approach and coarsened
exact matching. Using a cross-sectional analysis, we further find that the negative association
between lawyer CEOs and corporate innovation is more pronounced when firm’s litigation risk is
higher. We also document the mechanism that lawyer CEOs spend less on R&D and capital
expenditures and are more likely to underinvest than non-lawyer CEOs. A rich set of robustness
tests are conducted to confirm the findings. To the best of our knowledge, we are the first to
document empirical evidence for the long-standing concern expressed by early studies (e.g., Hayes
and Abernathy 1980) that hiring CEOs with legal backgrounds decreases firms’ commitment to
innovation.
Keywords: lawyer CEO, innovation, risk taking
JEL Classification: G32, G38
3
1. Introduction
Chief executive officers (CEOs) influence and determine many strategic choices of firms,
including product innovation, resource allocation, and research and development budgets
(Bertrand and Schoar, 2003). Upper echelon theory (Hambrick and Mason, 1984) maintain that
strategic decisions partially derive from individuals’ traits and characteristics, suggesting that past
experience such as educational background influence firm investment decisions. Many firms
choose CEOs with legal education backgrounds (i.e., lawyer CEOs) to lead their organizations.
Past literature suggests that lawyer CEOs bring greater expertise to regulatory matters relative to
other CEO types. Jagolinzer et al. (2011), Kwak et al. (2012), Litov et al. (2013), Morse et al.
(2017), and Henderson (2017) find that executives and directors with legal expertise are
significantly less likely to experience corporate litigation than firms led by other CEOs, suggesting
that lawyer CEOs reduce firm risk through strong legal compliance.
Although lawyer CEOs appear to reduce litigation risk, many of the same traits leading to
better compliance potentially influence other aspects of firms’ operating and strategic decisions.
Legal education focuses on applying the principles and practices that society and governments
institute to regulate individuals’ and organizations’ behavior. Training in law focuses on the
downsides of engaging in particular actions. Business training conversely, focuses on activities
that grow and maximize shareholder wealth. Given the same operating or strategic decision, a
manager with legal training and a manager with business training potentially perceive the
associated risk factors in different ways. The manager with law education background arguably
pursues risk management through compliance and regulation. The manager with business
education background potentially sees risk management through the lens of shareholder wealth
4
maximization. These differing perspectives on risk suggest that CEOs with legal education
backgrounds may possess higher levels of risk aversion than CEOs with other backgrounds.
We examine the effect of lawyer CEOs on firm risk-taking. In particular, we investigate
the relationship between CEOs with legal education backgrounds and firm innovation relative to
CEOs without such educational backgrounds. Corporate innovation constitutes long-term, risky,
and unpredictable investments with a high probability of failure (Holmstrom, 1989). Innovation
however, determines a firm’s long-term success and represents an important driver of its economic
growth. Importantly, extant research indicates that CEOs with risk-taking traits (e.g., pilots
licenses, overconfidence, etc.) enhance firm innovation (Daellenback et al., 1999; Galasso and
Simcoe, 2011; Sunder et al., 2017). As previously noted, however, lawyer CEOs arguably exhibit
more risk aversion than other CEO types, suggesting that executives with legal education
backgrounds may detract from firm innovation.
Using a sample of 13,247 firm-years observations (representing 2,345 unique firms) from
year 2000 through 2008, we find that 9% of S&P 1500 firms employ lawyer CEOs. Our measures
of innovation outcomes are the number of patents that each firm files during the fiscal year and
eventually granted, and non-self patent citations, both of which are adjusted for truncation bias
(Hall et al., 2001, 2005; Amore et al., 2013; Fang et al., 2014; Sunder et al., 2017).
The primary analysis indicates that firms with lawyer CEOs experience worse innovation
outcomes than firms with non-lawyer CEOs. Specifically, in the first year after assuming control
of the firm, we find that lawyer-CEO firms report 9.5% fewer patents and 12.3% fewer patent
citations, respectively, relative to non-lawyer CEO firms. The analysis further confirms that in
subsequent years – second and third year after taking the leadership position – that the level of
innovation output in lawyer-CEO firms continues to significantly lag the innovation in non-lawyer
5
CEO firms. Firms with lawyer CEOs file 10.4% (12.1%) fewer patents and receive 13.6% (17.5%)
fewer patent citations in the second (third) year after the lawyer CEOs take the office. Our primary
results suggest that CEOs with legal education backgrounds, relative to non-legal education
backgrounds, impede corporate innovation.
In the empirical analysis, we control for numerous observable, including CEO’s risk-taking
incentives in compensation (vega and delta), CEO’s personal characteristics (e.g., tenure, age,
university choice, and business education) and firm characteristics (e.g., firm size, return on equity,
leverage, market-to-book) that could simultanenously affect firm’s decision to hire a lawyer CEO
and corporate innovation. Further, to ensure our results are not driven by other legal experts within
the firm such as General Counsels or directors with legal expertise, we control for the presence of
General Counsels in top management and the percentage of directors with a legal background. In
addition, we also include industry fixed effects, state fixed effects, and year fixed effects to reduce
the interference across the industries, states, and time.
However, we still cannot unambiguously infer that CEO’s legal training impedes firm
innovation. Firms may choose CEOs with this attribute for other reasons. Lawyer CEOs for
instance, could be chosen for their regulation and compliance acumen, future litigation events,
government relations, etc., indicating that our analysis suffers from a potential endogeneity
problem.
To strengthen the inference that we capture the effect of lawyer CEOs on firm innovation,
we use the following identification strategies. First, by using the coarsened exact matching (CEM)
approach, we match lawyer-CEO firms to non-lawyer CEO firms based on seven observable
characteristics that could affect a firm’s likelihood of hiring a lawyer CEO, which are firm’s prior
litigation experiences, size, market-to-book ratio, leverage, industry, state, and year. The data
6
balance is checked before and after the matching. The matched sample analysis provides results
similar to those from the main results of primary specification, suggesting that CEOs with law
backgrounds impede innovation relative to non-lawyer CEOs and that our results do not reflect
differences in firm characteristics that potentially influence firms to hire lawyer CEOs.
Second, we use an instrumental variable approach to investigate the relation between
lawyer CEOs and firm innovation. We employ two different instruments that drive the
appointment of lawyer CEOs but have no direct effects on firms’ patenting activity. Our first
instrument is adapted from Henderson et al. (2018). Based on the notion that firms having a larger
labor supply pool of potential CEO candidates with legal expertise are more likely to hire lawyer
CEOs, we instrument the presence of a lawyer CEO based on the percent of firms within a 100-
mile radius with a lawyer CEO. Our second instrument measures the lawyer density of the state
where the CEO attended college. The idea is that individuals who went to college in a place with
a higher density of lawyers are more likely to go to law schools and gain legal expertise. The
results of the two-stage least squares (2SLS) analysis from using only the first instrument and those
from using both instruments continue to hold, indicating that firms with lawyer CEOs achieve
fewer patents and receive fewer patent citations relative to non-lawyer CEO firms.
Third, to rule out the possibility of reverse causality that our findings of less innovation for
firms with lawyer CEOs are because less innovative firms are more likely to hire lawyer CEOs
afterwards, we conduct a temporal-based falsification test. We document that there is no sigifnicant
relationship between the past innovation outcome and hiring a lawyer CEO, confirming that lawyer
CEOs impede innovation, not that firms with less innovation tend to hire lawyer CEOs. This
addresses the concern that our results are driven by a certain type of firms’ inherent preference for
lawyer CEOs and reluctance for innovation.
7
We conduct a cross-sectional analysis to investigate if lawyer CEOs’ risk aversion is the
reason driving the negative association between lawyer CEO and corporate innovation. Our
analysis shows that the negative relationship between lawyer CEO and corporate innovation is
more pronounced for firms that face higher litigation risk, confirming that lawyer CEOs’ fear of
litigation risk and its associated costs provides a disincentive for them to promote innovative
activity. The results provide strong evidence of our assertation that lawyer CEOs exhibit more risk
aversion than other CEO types.
To shed light on the mechanisms through which lawyer CEOs impede corporate innovation,
we study the association between lawyer CEOs and firms’ investment policies. Our findings
suggest that lawyer CEOs spend less on R&D investments and capital expenditures and are more
likely to underinvest than non-lawyer CEOs, which leads to worse innovation outcomes.
Further, to rule out the alternative possibility that lawyer CEOs’ pursuit in filing lawsuits
distract them from committing to innovation, we show that lawyer CEOs are not more likely to
initiate lawsuits against other parties than non-lawyer CEOs. We confirm that lawyer CEOs are
associated with less innovation output because they are more risk-averse and choose to invest less
in innovative activities, instead of being distracted from innovative activities.
A rich set of robustness checks are conducted to assess the sensitivity of our main findings.
Given that the patent and citation data have non-negative values and are right-skewed with a large
proportion of the observations of zero, we perform additional tests using different models
including Tobit model and Poisson model, and find the similar results. In our main analysis, we
use truncation-adjusted patent and patent non-self citation counts following prior research (Hall et
al., 2001, 2005; Amore et al., 2013; Fang et al., 2014; Sunder et al., 2017). To additionally assess
8
the robustness of our results, we use alternative measures of innovation outcomes, such as the raw
number of patents and citation. The results continue to remain.
It is possible that legal expertise is highly useful for firms that operate in highly competitive
industries and receiving patent and citations is difficult for these firms. As another robustness
check, we control for product market competition using the measure proposed by Hoberg and
Phillips (2016) and continue to find the same results. Further, we include firm’s R&D and capital
expenditures as additional control variables and the results continue to hold.
To address the possibility that our results are driven by the industries and states with a high
presence of lawyer CEOs, we repeat our analysis after removing the companies in the utilities
industry and in Washington DC. We continue to see that lawyer CEOs impede innovation in the
subsample. We also reconduct our tests when removing the 2007-2009 financial crisis period and
continue to find similar results, suggesting that a firm’s financial streses during this period doesn’t
alter our analysis.
Our study contributes to the literature in at least three ways. First, we contribute to the
growing literature on whether executives or directors’ legal expertise influences firm behavior.
Henderson et al. (2018) find that firms with lawyers CEOs are associated with lower litigation
frequency and less severe litigation. Pham (2020) document higher stock market liquidity for firms
with lawyer CEOs versus for those with non-lawyer CEOs. Chen et al. (2021) show that lawyer
CEOs play an informative role in firms’ litigation loss contingency disclosure by providing
disclosures about a pending litigation case on a timelier basis compared to non-lawyer CEOs. To
the best of our knowledge, this paper is the first study to document empirical evidence for the long-
standing concern expressed by early studies (e.g., Hayes and Abernathy, 1980) that hiring CEOs
with legal backgrounds decreases firms’ commitment to innovation.

9
Second, we add to the existing literature that builds on Hambrick and Mason’s (1984)
“Upper Echelons Theory”, which suggests that individual managerial characteristics affect
corporate decisions and therefore outcomes. Consistent with this theory, Bertrand and Schoar
(2003) document that the personality traits, work experience, and education background of
individual manager explain a significant portion of the heterogeneity of corporate investment
behavior, financing policy, organizational strategy and performance. We add to this literature by
introducing the effect of CEOs’ law education background on corporate innovation.
Third, we contribute to the expanding literature on corporate innovation. Innovation
constitutes an important driver of economic growth, and prior research identifies a variety of
factors that affect corporate innovation such as analyst coverage (He and Tian, 2013), shareholder
type (Brav et al., 2018; Liu et al., 2019), and financial market development (Amore et al., 2013;
Cornaggia et al., 2015). We add to this line of research by documenting another important
determinant of corporate innovation and shedding light on the longstanding concern that lawyer
CEOs deter corporate innovation.
The remainder of this paper is organized as follows. Section 2 describes the research design.
Section 3 presents our empirical findings. Section 4 concludes.
2. Research Design
2.1 Data and Sample
Our sample is constructed from several databases. We obtain personal information about
CEOs and boards of directors from BoradEx, and we obtain executive compensation information
from ExecuComp. For the CEOs and boards of directors whose background information is not
covered by BoardEx or ExecuComp, we hand collect data from firms’ proxy statements and
10
Google. The accounting data of firm characteristics are from Compustat and stock return data are
from CRSP.
Following the innovation literature (e.g., Gu, Mao, and Tian, 2015; Mao and Zhang, 2018),
we collect the patent data from the National Bureau of Economic Research (NBER) U.S. Patent
Citations Data File, which contains patent applications filed prior to 2006. We then use
supplemental data from 2006 to 2010 provided by Kogan et al. (2017), which contains patents
filled till 2009 and granted till 2010.
Our sample period is from 2000 to 2010. Our sample period starts in 2000 because 2000 is
the first year that BoardEx data are available. We end our sample in 2010 because this is the last
year that we have the patent data for. We exclude firm-years with negative book equities and
require the firm-years to have non-missing data for the regressions. After imposing these data
restrictions, our final sample consists of 13,247 firm-year observations, representing 2,382 unique
firms. In Section 3.5, we follow prior studies (e.g., Mao and Zhang, 2018) to conduct robustness
checks using alternative samples. We repeat our analysis after removing the companies in the
utilities industry and financial industry. We also remove the 2007-2009 financial crisis period from
our sample to confirm that our findings are not driven by the financial crisis period.
2.2 Model Specification and Variable Construction
We estimate the following baseline regression model to examine the association between
CEO’s law education background and corporate innovation:
Innovation = 𝛽0 + 𝜷𝟏LawyerCEO + 𝛽2CEOtenure + 𝛽3CEOage + 𝛽4CEOdelta
+ 𝛽5CEOvega + 𝛽6LawyerDirectorPct + 𝛽7Size + 𝛽8ROE + 𝛽9MB
+ 𝛽10Leverage + 𝛽11FirmAge + 𝛽12Ivy + 𝛽13MBA + 𝛽14GC
+ Industry Fixed Effects + Year Fixed Effects + State Fixed Effects + ε
(1)
Following prior research (e.g., Amore et al. 2013), we use patenting activities outcome as

11
the proxies for corporate innovation. Our first measure is innovation quantity, which is measured
by the total number of patent applications filed in a given year and eventually granted. There are
one to three years’ gap between patent application year and patent grant year (Hall et al. 2001,
2005), and the patent application year is closer to the actual timing of innovation activities than
the patent grant year. Therefore, we choose the patent application year instead of patent grant year.
Our second measure is innovation quality, which is the number of citations each patent receives in
subsequent years.
Prior research suggests that the raw number of patents and citations may have truncation
problems in the following ways (Hall et al. 2001, 2005; Fang et al. 2014). First, the patents appear
in the database only after they are granted but there is a lag between a patent’s application year
and grant year. Second, a patent can keep receiving citations over long periods of time, but we
only observe citations until the last year of the available patent data. We follow the existing
literature (Fang et al. 2014) to calculate truncation-adjusted patent counts by dividing raw patent
counts with the sum of application-grant lag distribution, and compute truncation-adjusted citation
counts by dividing raw citation counts with the fraction of predicted lifetime citations actually
observed during the lag interval. We also exclude self-citations to address the potential concern
that the results are driven by firms’ choice to cite their own patents.
The distributions of patent counts and non-self citations counts in our sample are both right-
skewed, with their median at zero. We winsorize these variables at the 1st and 99th percentile and
then use natural logarithm of one plus patent counts and non-self citations counts. Our first measure
of innovation is LogNPatentsAdj, calculated as the log value of the total number of patent
applications filed and eventually granted after adjusting for truncation bias. The second measure
is LogNCitesNonSelfAdj, calculated as the log value of the total number of non-self citations after
12
adjusting for truncation bias. Because innovation output such as patents and citations is the
outcome of a research and development process that take time (Amore et al. 2013), we follow
Cornaggia et al. (2015) to examine the impact of lawyer CEO on LogNPatentsAdj and
LogNCitesNonSelfAdj from year t+1 to t+3. In Section 3.5 of Robustness Check, we also use
several alternative measures of innovation outcomes to confirm the findings, such as the raw
counts of patents and citations that include self-citations.
Our key independent variable of interest is LawyerCEO, an indicator variable constructed
following Henderson et al. (2018). LawyerCEO is equal to one if the CEO holds an undergraduate
degree in law such as an LLB, or a graduate degree such as LLM, J.D., or Ph.D. in Jurisprudence.
β1 captures the estimate for the effects of lawyer CEO and corporate innovation. If lawyer CEOs’
risk aversion impedes firm innovation, we expect β1 to be significantly negative.
We include a variety of control variables. Specifically, we include CEO pay-performance
sensitivity (CEOdetla) and CEO pay-risk sensitivity (CEOvega) to account for the potential impact
of incentives embedded in CEO compensation as suggested by previous research (Coles et al.,
2006; Mao and Zhang, 2018; Chemmanur et al., 2019). We also control for other CEO
characteristics that may affect firm patenting activities including CEO’s tenure length
(CEOtenure), age (CEOage), education backgrounds such as whether the CEO has an MBA degree
(MBA) or has attended an Ivy League School (Ivy). Further, to ensure our results are not driven by
other legal experts within the firm such as GCs or directors with legal expertise, we control for the
presence of General Counsels in top management (GC) and the percentage of directors with a legal
background (LawyerDirectorPct). We also follow prior literature (e.g., Fang et al., 2014) to control
for firm characteristics such as firm size (Size), firm age (FirmAge), return on equity (ROE), market
to book value of total assets (MB) and leverage ratio (Leverage). We include industry fixed effects
13
to control for industry unobserved time-invariant heterogeneities and year fixed effects to control
for macroeconomic shocks that may affect all the sample firms in a given year. Our industry
classification in the regressions is based on the first two digits of the SIC code. We also include
state fixed effects to control for the heterogeneity in the legal environment complexity across states.
Following Pan et al. (2020), we cluster standard errors at the industry level to account for serial
correlation across all firms within an industry over time. All the continuous variables are
winsorized at the 1st and 99th percentiles to mitigate the influence of outliers. The definitions of all
variables can be found in Appendix A.
3. Findings
3.1 Descriptive Statistics
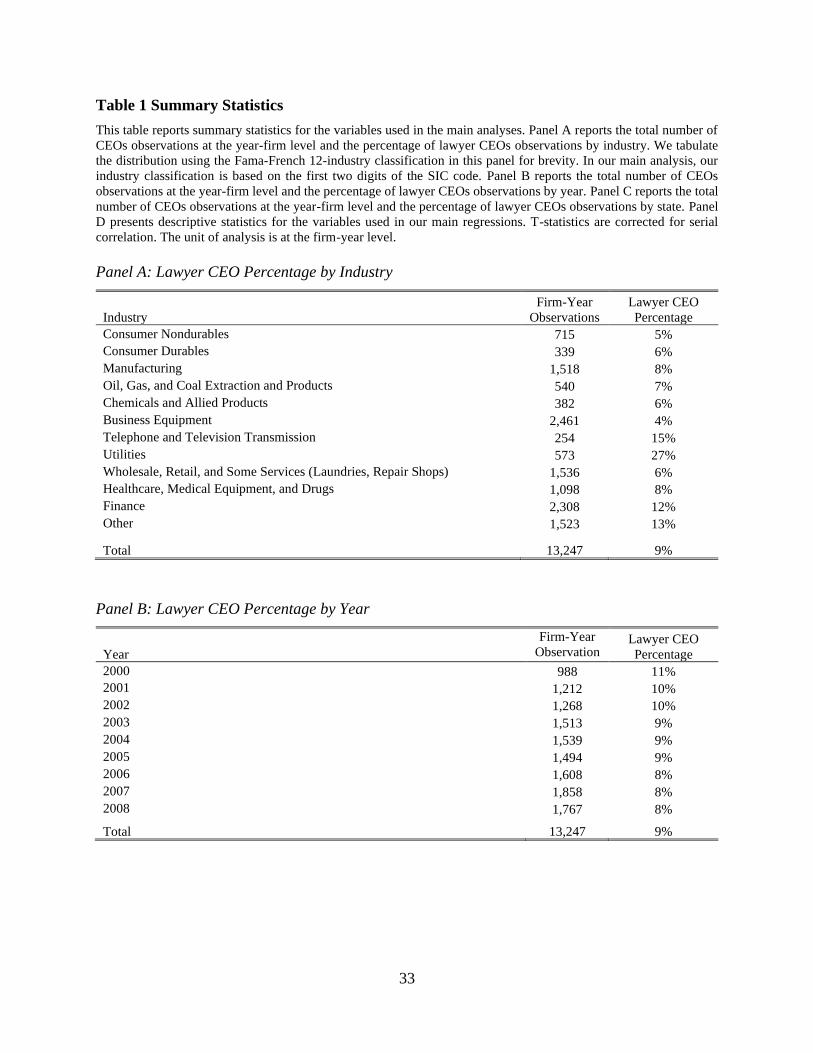
Table 1 reports summary statistics for our sample. To better understand our sample
composition, we present lawyer CEO distribution by industry in Panel A.2 The findings suggest
that, on average, 9% of firms in our sample have a lawyer CEO. This statistic is consistent with
Henderson et al. (2018).
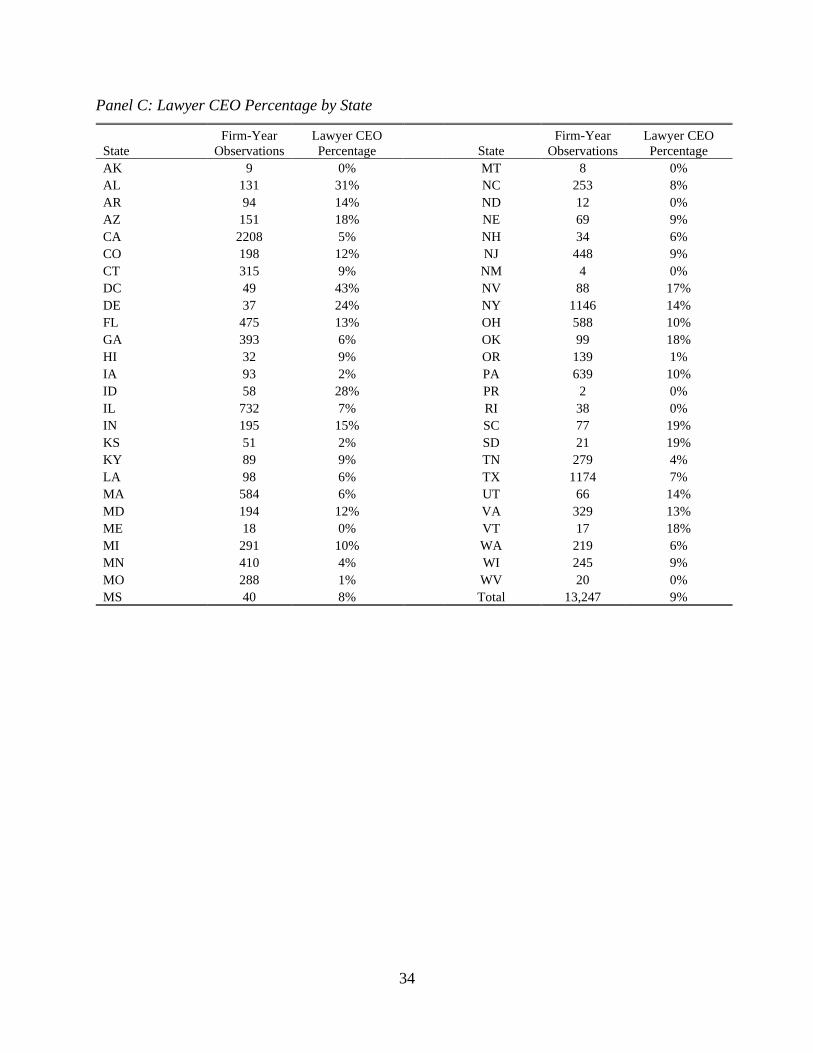
The distribution of firms with lawyer CEOs is uneven across the states, industry, and time.
For example, 43% of firms in DC hire lawyer CEOs, while several states have 0% of firms with
lawyer CEOs. The utilities industry has the highest percentage of lawyer CEOs (26%) and the
business equipment industry has the lowest percentage of lawyer CEOs (4%). There exists a slight
downward trend in hiring lawyer CEOs. The average percentage drops from 11% in year 2000 to
8% in year 2008.
2 We tabulate the distribution using the Fama-French 12-industry classification in this panel for brevity, while our
industry classification is based on the first two digits of the SIC code in the main analysis.
14
Panel C of Table 1 shows the descriptive statistics for the main variables used in our
analysis. Consistent with prior research, the number of patents filed is right-skewed as the average
firm files 9.05 patents in t+1 and the median number of patents filed is zero. Therefore, we use the
natural log of patent counts and citation counts in the regressions. On average, 12% of the directors
have a law education background and 31% of the firms have general counsels in the top
management team. The distributions of the variables are largely consistent with our expectation.
Univariate t-test results show that firms with lawyer CEOs file fewer patents and receive fewer
citations than firms with non-lawyer CEOs one to three years after the lawyer CEOs take the office.
3.2 Main Analysis
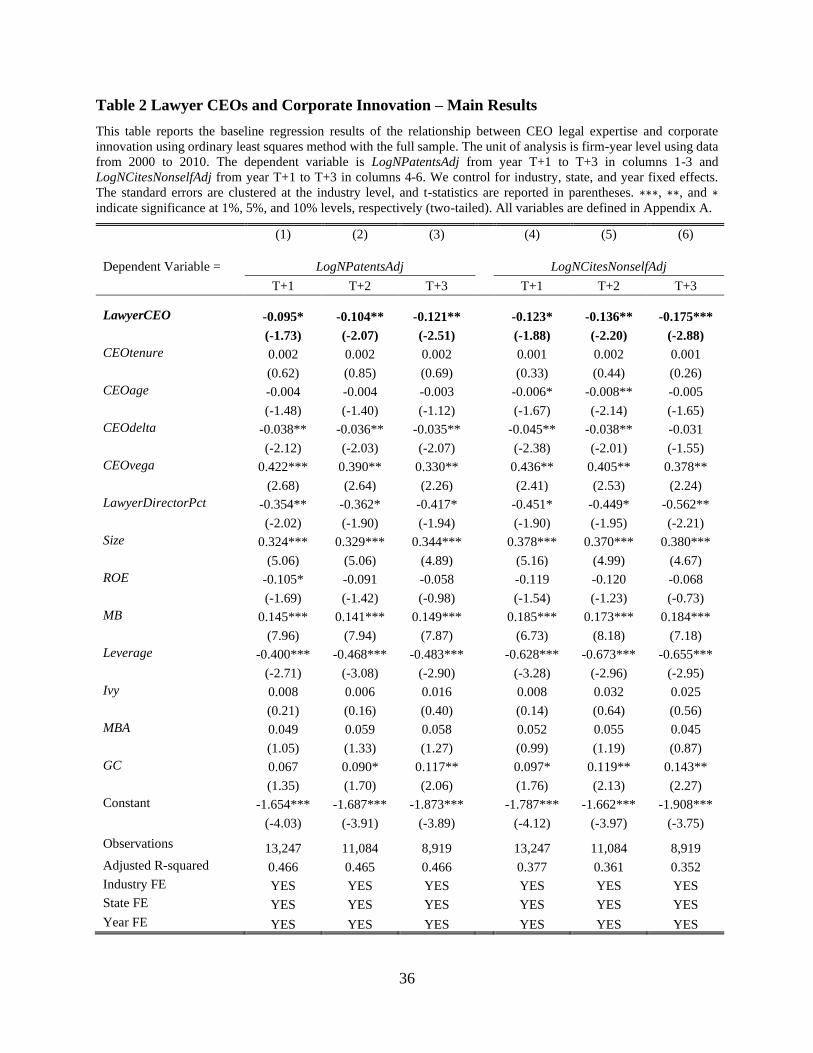
We first study the association between lawyer CEOs and corporate innovation using the
baseline regressions including control variables and fixed effects. Table 2 presents the estimation
results of equation (1) using ordinary least squares regressions. In columns 1 to 3, we regress the
log value of the truncation-adjusted total number of patent applications filed and eventually
granted (LogNPatentsAdj) in year t+1 to t+3 on LawyerCEO, the control variables, and industry
and year fixed effects. We document a negative relationship between patent quantity and lawyer
CEOs. The coefficients on LawyerCEO are negative in columns 1 to 3, and are also economically
significant. For example, the coefficient on LawyerCEO -0.100 in column 1 suggests that firms
with lawyer CEOs file 9.5% fewer patents than firms with non-lawyer CEOs. The coefficients on
LawyerCEO in column 2 and 3 indicate that firms with lawyer CEOs file 10.4% and 12.1% fewer
patents in the second and third year after the lawyer CEOs take the office, compared with firms
with other types of CEOs.

15
The signs of the coefficient estimates for the control variables are largely consistent with
our expectations. For example, firms with a larger size, higher market to book ratio, and lower
leverage file more patents. The coefficient on CEOvega is positive, consistent with prior literature
that vega in CEO compensation encourages risk taking (Coles et al., 2006, Mao and Zhang, 2018).
In columns 4 to 6, the dependent variables are the log value of truncation-adjusted non-self
citations recived from year t+1 to t+3, and the regression coefficients on LawyerCEO are
significantly negative. Using a similar calculation, firms with lawyer CEOs receive 12.3%, 13.6%,
and 17.5% fewer non-self citations than firms with non-lawyer CEOs in year t+1, t+2, and t+3.
Collectively, the results in Table 2 are consistent with our prediction that lawyer CEOs’
risk aversion discourages firms’ innovation. In addition, we also find the coefficients on
LawyerCEO and on MBA are significantly different, supporting our arguments earlier that legal
education and business training have different focuses.

16
3.3 Identification Strategies
Firms and CEOs associate by mutual choice, which raise concerns of potential endogeneity
issues. Lawyer CEOs could be chosen because of their regulation and compliance acumen, future
litigation events, government relations, etc. It is possible that certain firm characteristics are
simultaneously related with lawyer CEO appointment and firm patenting activities, and hence
statistically bias the estimation results. It is also possible that our findings of less innovation for
firms with lawyer CEOs are because less innovative firms are more likely to hire lawyer CEOs,
leading to reverse causality. To strengthen the inference that we capture the effect of lawyer CEOs
on firm innovation, we use a variety of identification strategies, including coarsened exact
matching, instrumental variable, and falsification tests.
3.3.1 Coarsened Exact Matching
To address the possibility that certain firm characteristics are simultaneously associated
with lawyer CEO appointment and corporate innovation, we match firms with lawyer CEOs with
those with non-lawyer CEOs on observable firm characteristics that may affect firms’ decision to
hire lawyer CEOs using the Coarsened Exact Matching (CEM) method. Specifically, we match
these two groups of firms on the following seven dimensions of characteristics: firms’ past
litigation experience (proxied by the number of law cases filed against the firm in the past three
years), firm size, market to book ratio, leverage, industry, state, and year. We coarsen firm’s past
litigation experience, firm size, market to book ratio, and leverage using three equally-spaced strata,
and we perform one-to-one matching on each stratum for each of the variables. We also one-to-
one match on the exact value of year, state, and industry without coarsening.

17
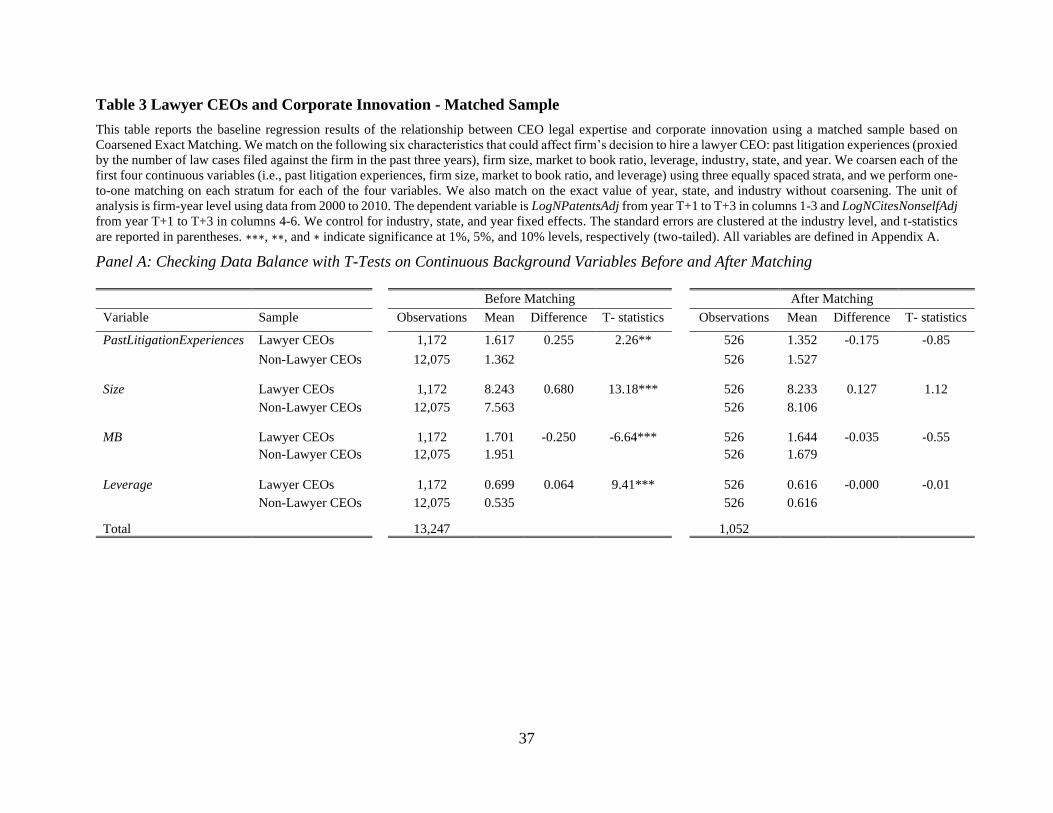
The number of observations in the matched sample is significantly reduced in this analysis
because we use one-on-one matching. The t-tests results for data balance check before and after
matching are listed in the Panel A of Table 3. The results of t-tests show that the means of
background characteristics for firms with a lawyer CEO are significantly different from those with
a nonlawyer CEO before matching. However, the difference in the means of background
characteristics for firms with a lawyer CEO versus those with a nonlawyer CEO become
statistically insignificant after matching. This indicates that the data is balanced between two
groups and our matching is successful.
We present the baseline regression results using this matched sample in the Panel B of
Table 3. The regression coefficient on LawyerCEO continues to be negative and significant. Again,
this finding suggests that our inferences using the full sample are not affected by different firm
characteristics or industry membership between firms with lawyer CEOs and those without.
3.3.2 Instrumental Variable Analysis
It is possible that the CEO selection process is driven by a correlated omitted variable.
Since the coarsened exact matching approach only addresses endogeneity concerns related to CEO
selection on observable characteristics, we use an instrumental variable approach to further address
the potential endogeneity issues caused by unobservables. We use two different instruments that
drive the appointment of lawyer CEOs but have no direct effects on firms’ patenting activity.
Our first instrument, LawyerCEO100miles, is adopted from Henderson et al. (2018).
LawyerCEO100miles is calculated as the percentage of firms located in the 100-mile radius of the
focal firm’s headquarters that have a lawyer CEO.3 This instrumental variable captures the local
3 Following Heider and Ljungqvist (2015), we correct the historical firm headquarter locations provided in Compustat
using headquarter states reported in the SEC filings.

18
supply of prospective lawyer CEOs. The logic behind this instrument is that firms having a larger
labor pool of potential CEO candidates with legal expertise are more likely to hire lawyer CEOs,
indicating the relevance of the instrumental variable. On the other hand, the percentage of local
firms having lawyer CEOs has no direct effect on the focal firm’s innovation, which satisfies the
exclusion condition of an instrumental variable.
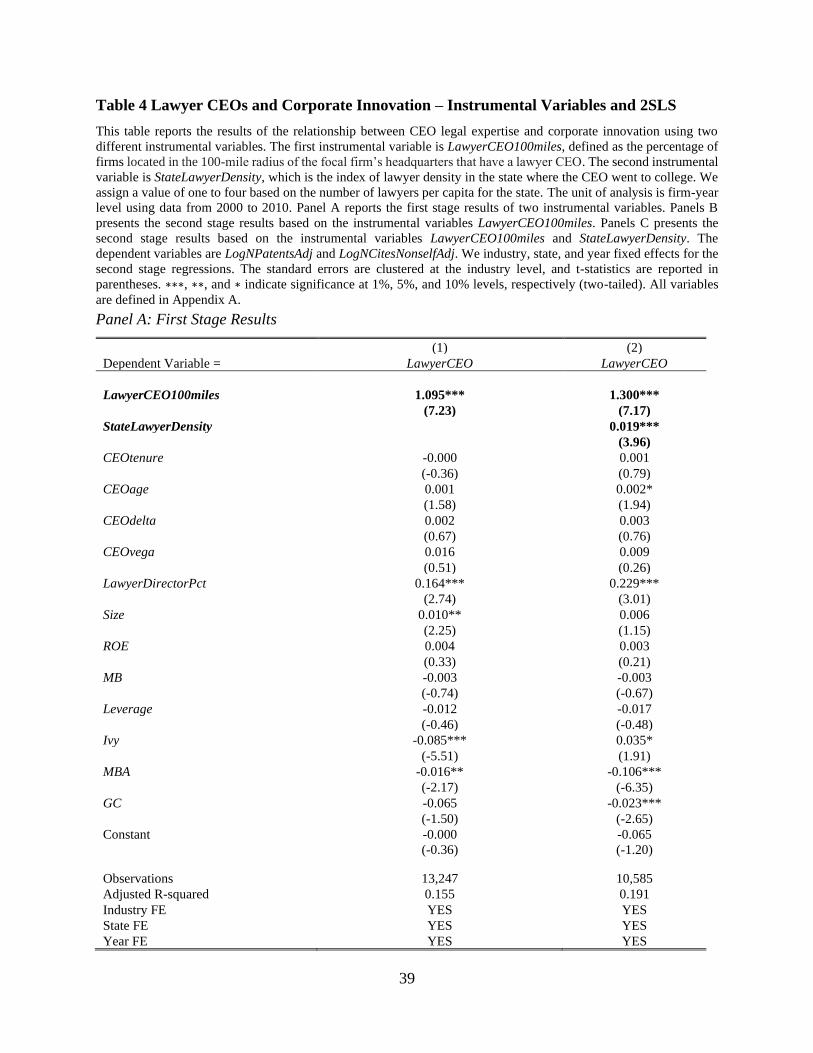
The results of the Two-Stage Least Squares (2SLS) analysis are presented in Table 4. In
column 1of Panel A, we regress LawyerCEO on the instrumental variable, LawyerCEO100miles,
along with other control variables for the first stage. The result shows that LawyerCEO100miles
is positively associated with a probability of hiring lawyer CEOs, which statistically confirms the
satisfaction of the relevance condition of an instrumental variable. This is consistent with our
expectation that a higher local supply of potential lawyer CEO candidates increases the chance of
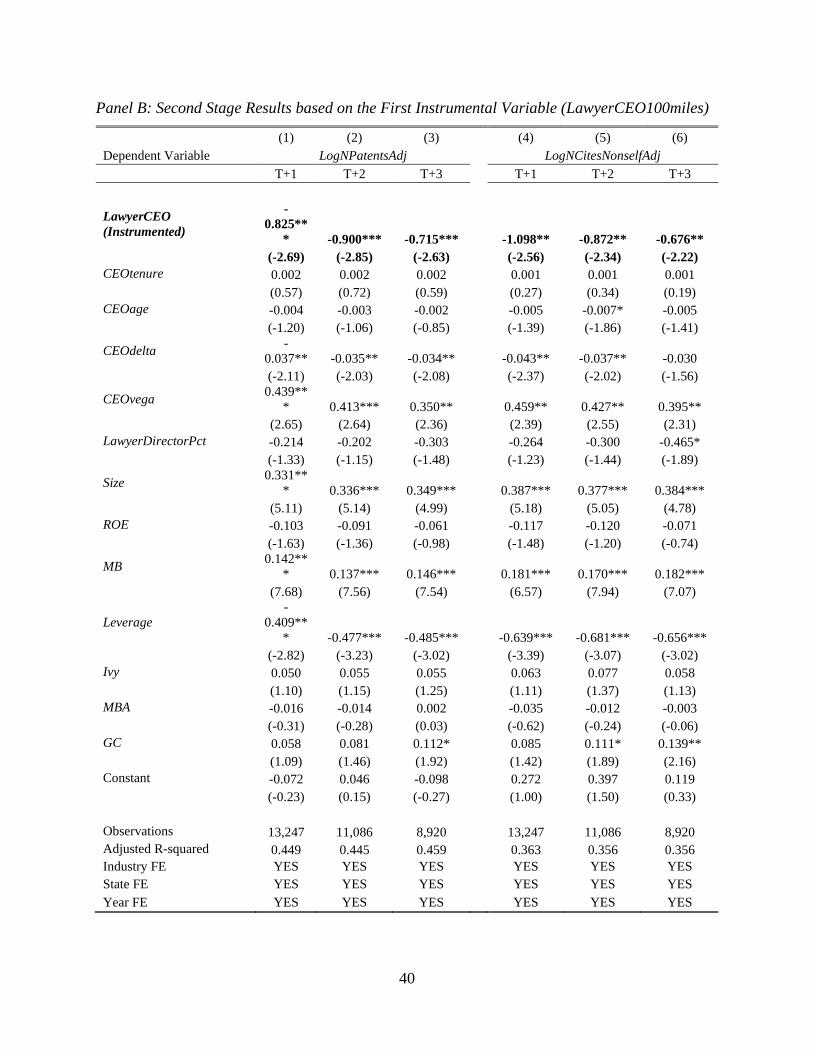
a firm to hire a lawyer CEO. Panels B of Table 4 present the second stage results based on the
instrumental variable, LawyerCEO100miles. The regression coefficients on instrumented
LawyerCEO are significantly negative across all columns, confirming that laywer CEOs impede
corporate innovation.
Our second instrument is StateLawyerDensity, which measures the lawyer density of the
state where the CEO attended college. We assign a value of one to four based on the number of
lawyers per capita for the state. If the CEO went to a non-US institution for college, we assign a
value of zero. This variable captures an individual’s likelihood to go to law school. The idea is that
individuals who went to a college in a state with a higher density of lawyers are more likely to go
to law schools. 4 In column 2 of Panel A in Table 4, the regression coefficient on
4 Lent et al. (2002) document that contextual factorsplay a role in collegue students’ career choice. We otain the data
for the number of lawyers per capita by state from Indiana Bar Association.
https://cdn.ymaws.com/www.inbar.org/resource/resmgr/Conclave/_Rural_Access_Highest_Per_Ca.pdf. This is the
earliest data for the number of lawyers per capita by state we are able to identify.
19
StateLawyerDensity is positively significant, which statistically prove the relevance condition that
those who went to a college located in a place with a higher density of lawyers have a higher
likelihood to pursue law education and gain legal expertise. Besides, the CEOs’ choice of college
had been made well before he or she became CEOs and therefore is unlikely to have a direct impact
on firm innovation, indicating that the exclusion condition of a instrumental variable is satisfied.
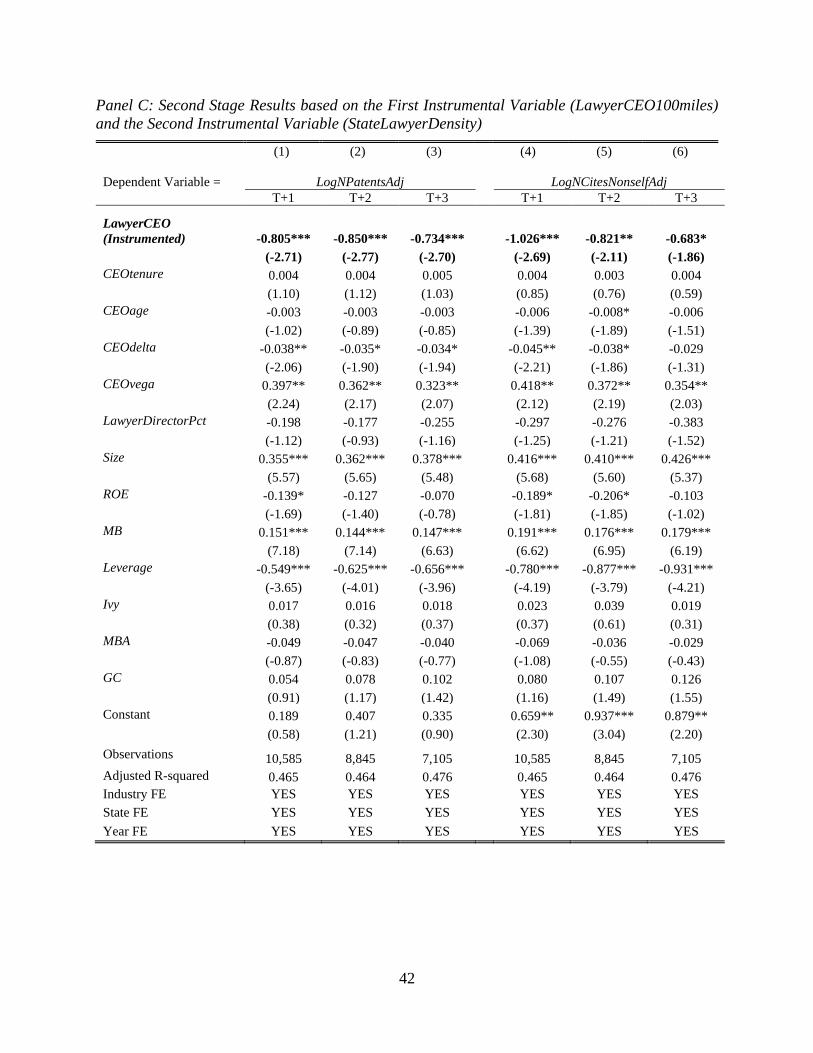
The second stage results of using both instrumental variables, LawyerCEO100miles and
StateLawyerDensity, are listed in the Panels C of Table 4. Again, the instrumented LawyerCEO
has significantly negative regression coefficients across all columns. The findings of both
instrumental variables provide us with more confidence that our results, lawyer CEOs impede
corporate innovation, are not biased by endogeneity.
3.3.3 Falsification Test
To further rule out the reverse causality possibility that our findings of less innovation for
firms with lawyer CEOs are because less innovative firms are more likely to hire lawyer CEOs
afterwards, we conduct a temporal-based falsification test. We study patent outcomes in the past
three years relative to the year when a lawyer CEO takes the office. The results from Table 5 shows
that the findings documented in the previous sections do not hold when we examine the
relationship between lawyer CEO in year t and firm patenting activities in years t-1, t-2, and t-3,
suggesting that there is no significant relationship between the past innovation outcome and hiring
a lawyer CEO. Therefore, it is confirmed that lawyer CEOs impede innovation, not that firms with
less innovation tend to hire lawyer CEOs.
20
3.4 Supplemental Analysis
3.4.1 Cross-sectional Analysis Based on Firm Litigation Risk
After establishing a negative association between CEOs’ law backgrounds and corporate
innovation, we next examine if lawyer CEO’s risk aversion is the reason behind this negative
association. In particular, we investigate how this relationship varies with firm litigation risk.
Kempf and Spalt (2020) show that innovative firms are vulnerable to costly low-quality class
action litigation. Therefore, fear of litigation risk and its associated costs by lawyer CEOs provides
a disincentive for them to promote innovative activity.
We expect that the negative association between lawyer CEO and corporate innovation is
more pronounced for firms that face higher litigation risk. To test this prediction, we follow Kim
and Skinner (2012) to estimate firm litigation risk5 as the likelihood of being sued. The results of
this cross-sectional analysis are presented in Table 6. We document a negative coefficient on the
interaction term LawyerCEO×LitRisk, which suggests that when firm litigation risk is higher,
lawyer CEOs are less likely to engage in innovative activities due to their concerns over litigation
risk and costs. The results further confirm our expectation that lawyer CEOs impede innovation
because of their risk aversion.
5 Firm litigation risk is estimated following Kim and Skinner (2012). Specifically, we use the predicted values
estimated from the model: Suedt = 𝛾0 + 𝛾1FPSt-1 + 𝛾2Sizet-1 + 𝛾3SalesGrowtht-1 + 𝛾4Return t-1 + 𝛾5ReturnSkewness t-1
+ 𝛾6ReturnStd t-1 + 𝛾7Turnover t-1 + 𝜃, where Sued is an indicator variable that equals one if a class action lawsuit is
filed against the firm and zero otherwise. FPS is an indicator variable that equals one if the firm is in the biotech,
computer, electronic, or retail industry and zero otherwise. ReturnSkewness and ReturnStd represent the skewness and
standard deviation of monthly stock returns for a given year. Turnover is the trading volume scaled by the number of
shares outstanding.
21
3.4.2 Corroborating Evidence of Mechanism from Firm Investment Policies
In the sections above, we provide evidence of a negative relation between CEOs’ legal
backgrounds and firm innovation, and we argue that the relation is the result of lawyer CEOs’ risk
aversion. In this section, we study the mechanism for this negative association by studying the
association between CEOs’ legal backgrounds and firm investment policies. Our proxies for
investment policies include research and development expenses scaled by lagged sales (R&D),
capital expenditures scaled by lagged total assets (Capex), and the likelihood of underinvestment
(UnderInvest). We construct the measure of underinvestment (UnderInvest) following Biddle et
al. (2019). Specifically, we regress the total investment in year t on the percentage change in sales
from year t-1 to t by industry-year. The total investment is the sum of capital expenditures, R&D
expenses and acquisitions minus sales of property, plant, and equipment, scaled by lagged total
assets. We then classify firms based on the residuals (i.e., deviations from predicted investments),
and firm-years in the bottom quartile are identified as under-investing and those in the top quartile
are identified as over-investing. The middle two quartiles are identified as the benchmark group.6
The results of the effect of lawyer CEOs on corporate investment policy are reported in
Table 7. Consistent with Henderson et al. (2018), our results in column 1 suggest that lawyer CEOs
spend less on R&D than non-lawyer CEOs. Column 2 shows a negative association between CEOs’
legal backgrounds and firm capital expenditures. Finally, in column 3, our result suggests that
lawyer CEOs are more likely to under-invest than non-lawyer CEOs. Collectively, the results in
this section provide strong evidence of our assertation that lawyer CEOs exhibit more risk aversion
6 The inferences remain unchanged if we include the top quartile as the the benchmark group. The number of
observations is lower than in the main tests because we follow Biddle et al. (2019) in requiring each regression to have
at least 20 observations when estimating deviations from predicted investments at the industry-year level.
22
than other CEO types and therefore are less likely to engage in innovation-related investment,
resulting in worse innovation outcomes.
3.4.3 Addressing Alternative Explanation
It is also possible that lawyer CEOs could be more likely to file lawsuits due to their legal
astuteness and their attention could be distracted away from innovation activities. Prior literature
suggests that attention is generally considered a resource in limited supply (e.g., Kahneman 1973).
If lawyer CEOs, in their zeal for initiating lawsuits against other parties, are distracted from
business operations and innovative activities, we may also observe firms with lawyer CEOs are
associated with less innovation output.
To ensure that our findings are not driven by this possibility, we analyze the impact of
lawyer CEOs on firms’ likelihood of filing lawsuits. We construct a variable, FileLawsuit, which
is an indicator variable that equals one if the firm files a lawsuit in a given year and zero otherwise.
The results are presented in Table 8. We do not find evidence that lawyer CEOs file more lawsuits,
suggesting that our main findings are not driven by this possibility of distraction. Therefore, we
confirm that lawyer CEOs impede innovation because they are more risk averse.
3.5 Robustness Tests
In order to assess the sensitivity of our main findings, we perform a rich set of additional
robustness tests in this section, including the estimation of different models, use of alternative
measures of variables, adding additional control variables, and subsample analysis.

23
3.5.1 Tobit Model and Poisson Model
The patent and citation data have non-negative values. They are right-skewed with median
of zero, as a large proportion of the observations are zero. Alternative estimation methods dealing
with such data include Tobit model and Poisson model. The estimation results of Tobit regressions
are reported in the Panel A of Table 9 and those of Poisson regressions are reported in the Panel B
of Table 9. The coefficient estimates on LawyerCEO all negative and statistically significant for
all the regressions, suggesting that our main results are robust to alternative models.
3.5.2 Alternative Measures of Innovation Outcomes
In addition to using the log value of the number of patents and non-self citations adjusted
for truncation bias as the dependent variable in the main specification, we also use several other
measures of innovation outcomes and present the results in Table 10. The results using the raw
number of patents and citations without truncation bias adjustment in columns 1 to 6 suggest that
our inferences remain the same. The findings in columns 7 to 9 show that our results are robust to
excluding firm’s self-citations. The evidence shows that our findings are robust to alternative
measures of innovation outcome variables.
3.5.3 Including Additional Control Variables
It is possible that legal expertise is highly useful for firms that operate in highly competitive
industries and receiving patent grants and citations may be difficult for these firms.7 As another
robustness check, we control for product market competition using the measure proposed by
7 We study patent applications but only patents that are granted appear in the database.
24
Hoberg and Phillips (2016) and continue to find the same results. Further, we include firm’s R&D
and capital expenditures as additional control variables and the results continue to hold.
3.5.4 Subsample Analysis
Panel A in Table 1 shows that firms in the utilities industry have the highest percentage of
lawyer CEO (i.e., 26%). To address the possibility that our results are driven by the utilities
industry with a high presence of lawyer CEOs, we repeat our analysis after removing the
companies in the utilities industry. We continue to see that lawyer CEOs impede innovation.
Further, if we follow the prior studies (e.g., Mao and Zhang, 2018) and only focus on non-financial
and non-utility firms, our results still hold.
Finally, we examine whether our results are driven by the 2007–08 financial crisis, during
which firms experienced reductions in corporate investments and had a greater likelihood of hiring
lawyer CEOs due to the financial stress. We remove the 2007-2009 financial crisis period from
our sample and continue to find similar results, suggesting that our results are not driven by the
financial crisis period. The robustness check results of Section 3.5.3 and 3.5.4 are not tabulated for
the purpose of brevity, and they are available upon request.
4. Conclusion
This study examines how CEOs’ law education background is associated with innovation
outcomes. We argue that training in law focuses on the downsides of engaging in particular actions
and may make lawyer CEOs prefer operating within the bounds of the law, and thereby exhibiting
a cautionary, conservative, risk-averse approach to business activities. Therefore, CEOs with legal
education backgrounds may possess higher levels of risk aversion than CEOs with other
25
educational backgrounds. On the other side, corporate innovation is a long-term, risky, and
unpredictable process that involves the exploration of new methods with a high probability of
failure (Holmstrom, 1989). Commitment to innovation carries a significant risk for managers, as
there are inherent uncertainties in innovative projects going from concept to realization of actual
profits. The arguments suggest that CEOs with legal backgrounds may detract from firm
innovation.
Using a sample of 13,247 firm-year observations (representing 2,345 unique firms) from
2000 to 2010, we find evidence supporting our prediction that firms with lawyer CEOs are
associated with fewer patents and citations, which measures the innovation quantity and quanlity
respectively.
To enhance our confidence in the references we draw from the tests, we use the several
identification strategies. First, we match firms with lawyer CEOs with those without using the one-
on-one coarsened exact matching based on the following firm characteristics: firms’ past litigation
experience (proxied by the number of law cases filed against the firm in the past three years), firm
size, market to book ratio, leverage, industry, state, and year. The data balance check shows that
the means of the above firm characteristics are statistically indifferent after the matching between
firms with lawyer CEOs and those without, indicating that our matching is successful. With the
matched sample, the number of observations are sharply reduced but our results still hold.
Second, we use two different instrumental variable with two-stage least squares regressions.
The first instrumental variable is the local labor supply of potential CEO candidates with legal
expertise, and the second instrument is the lawyer density of the state where the CEO attended
college. Both instrumental variables drive the appointment of lawyer CEOs but have no direct

26
effects on firms’ innovation outcomes. Our inferences remain unchanged using these alternative
identification strategies.
Third, falsification tests are conducted to rule out the possibility of reverse causality. We
find no association between the past innovation outcomes and the presence of lawyer CEO,
confirming that it is lawyer CEOs that impede innovation, instead of that firms tend to hire lawer
CEOs after they experience poor innovation outcomes.
Next, using cross-sectional analysis, we find that the negative association between CEOs’
law backgrounds and corporate innovation is more pronounced for firms with higher litigation risk.
When firm litigation risk is higher, lawyer CEOs are less likely to engage in innovative activities
due to their concerns over risk. Lawyer CEOs’ risk aversion is the reason that drives the negative
association between their law education backgrounds and corporate innovation.
To shed light on the mechanisms through which lawyer CEOs impede corporate innovation,
we study the association between CEOs’ legal backgrounds and firm’s investment policies. Our
findings suggest that lawyer CEOs spend less on R&D and capital expenditures and are more likely
to under-invest than non-lawyer CEOs. Further, to rule out the possibility that lawyer CEOs’
pursuit in filing lawsuits distract them from committing to innovation, we show that lawyer CEOs
are not more likely to initiate lawsuits against other parties than non-lawyer CEOs.
Our study makes the following contributions. First, we contribute to the growing literature
on whether executives or directors’ legal expertise affect firm policies by documenting the impact
of the legal background of the primary decision maker in the firm (i.e., CEO) on an important
outcome of corporate investment policy, i.e., patenting activity. Second, our study contributes to
the upper echelons theory literature by introducing the effect of CEOs’ law education background

27
on corporate innovation. Third, we add to the large literature on corporate innovation by providing
support for the longstanding concern that lawyer CEOs deter corporate innovation.

28
References
Akcigit, U., Celik, M. A., & Greenwood, J. (2016). Buy, keep, or sell: Economic growth and the
market for ideas. Econometrica, 84(3), 943–984.
Al Mamun, M. D., Balachandran, B., Duong, H. N., & Gul, F. A. (2020). Are corporate general
counsels in top management effective monitors? Evidence from stock price crash risk.
European Accounting Review, 1–33.
Amore, M. D., Schneider, C., & Žaldokas, A. (2013). Credit supply and corporate innovation.
Journal of Financial Economics, 109(3), 835–855.
Ben-David, I., Graham, J. R., & Harvey, C. R. (2013). Managerial miscalibration. The Quarterly
Journal of Economics, 128(4), 1547–1584.
Bertrand, M., & Schoar, A. (2003). Managing with style: The effect of managers on firm policies.
The Quarterly Journal of Economics, 118(4), 1169–1208.
Biddle, G. C., Hilary, G., & Verdi, R. S. (2009). How does financial reporting quality relate to
investment efficiency? Journal of Accounting and Economics, 48(2–3), 112–131.
Brav, A., Jiang, W., Ma, S., & Tian, X. (2018). How does hedge fund activism reshape corporate
innovation? Journal of Financial Economics, 130(2), 237–264.
Chemmanur, T. J., Kong, L., Krishnan, K. & Yu, Q. (2019). Top management human capital,
inventor mobility, and corporate innovation. Journal of Financial and Quantitative
Analysis, 54(6), 2383-2422.
Chen, F., Hou Y., Richardson, G., & Su, B. (2021) Lawyer CEOs and Strategic Disclosures of
Litigation Loss Contingencies. Working Paper.
Coles, J. L., Daniel, N. D., & Naveen, L. (2006). Managerial incentives and risk-taking. Journal
of Financial Economics, 79(2), 431–468.
Cornaggia, J., Mao, Y., Tian, X., & Wolfe, B. (2015). Does banking competition affect innovation?
Journal of Financial Economics, 115(1), 189–209.
Daellenbach, U. S., McCarthy, A. M., & Schoenecker, T. S. (1999). Commitment to innovation:
The impact of top management team characteristics. R&D Management, 29(3), 199–208.
Fang, V. W., Tian, X., & Tice, S. (2014). Does stock liquidity enhance or impede firm innovation?
The Journal of Finance, 69(5), 2085–2125.
Galasso, A., & Simcoe, T. S. (2011). CEO overconfidence and innovation. Management Science,
57(8), 1469–1484.
Hall, B. H., Jaffe, A. B., & Trajtenberg, M. (2001). The NBER patent citation data file: Lessons,
insights and methodological tools. National Bureau of Economic Research.
Hall, B. H., Jaffe, A., & Trajtenberg, M. (2005). Market value and patent citations. RAND Journal
of Economics, 36(1), 16–38.
29
Ham, C., & Koharki, K. (2016). The association between corporate general counsel and firm credit
risk. Journal of Accounting and Economics, 61(2–3), 274–293.
Hayes, R. H., & Abernathy, W. J. (1980). Managing our way to economic decline. Harvard Bus.
Rev.;(United States), 58(4).
He, J. J., & Tian, X. (2013). The dark side of analyst coverage: The case of innovation. Journal of
Financial Economics, 109(3), 856–878.
Heider, F., & Ljungqvist, A. (2015). As certain as debt and taxes: Estimating the tax sensitivity of
leverage from state tax changes. Journal of Financial Economics, 118(3), 684–712.
Henderson, M. T., Hutton, I., Jiang, D., & Pierson, M. (2017). Lawyer CEOs. Working Paper.
Hoberg, G., & Phillips, G. (2016). Text-based network industries and endogenous product
differentiation. Journal of Political Economy, 124(5), 1423–1465.
Holmstrom, B. (1989). Agency costs and innovation. Journal of Economic Behavior &
Organization, 12(3), 305–327.
Jagolinzer, A. D., Larcker, D. F., & Taylor, D. J. (2011). Corporate governance and the information
content of insider trades. Journal of Accounting Research, 49(5), 1249–1274.
Kempf, E., & Spalt, O. (2020). Attracting the Sharks: Corporate Innovation and Securities Class
Action Lawsuits. University of Chicago Working Paper.
Kim, I., & Skinner, D. J. (2012). Measuring securities litigation risk. Journal of Accounting and
Economics, 53(1–2), 290–310.
Kogan, L., Papanikolaou, D., Seru, A., & Stoffman, N. (2017). Technological innovation, resource
allocation, and growth. The Quarterly Journal of Economics, 132(2), 665–712.
Kwak, B., Ro, B. T., & Suk, I. (2012). The composition of top management with general counsel
and voluntary information disclosure. Journal of Accounting and Economics, 54(1), 19–
41.
Lent, R. W., Brown, S. D., Talleyrand, R., McPartland, E. B., Davis, T., Chopra, S. B., Alexander,
M. S., Suthakaran, V., & Chai, C.-M. (2002). Career choice barriers, supports, and coping
strategies: College students’ experiences. Journal of Vocational Behavior, 60(1), 61–72.
Litov, L. P., Sepe, S. M., & Whitehead, C. K. (2013). Lawyers and fools: Lawyer-directors in
public corporations. Geo. LJ, 102, 413.
Liu, Y., Shen, Y., Wang, J., & Wang, Q. (2019). Passive Institutional Investors and Corporate
Innovation. Baruch College Zicklin School of Business Research Paper, 2019–07, 02.
Mao, C. X., & Zhang, C. (2018). Managerial risk-taking incentive and firm innovation: Evidence
from FAS 123R. Journal of Financial and Quantitative Analysis, 53(2), 867 - 898.
Morse, A., Wang, W., & Wu, S. (2016). Executive lawyers: Gatekeepers or strategic officers? The
Journal of Law and Economics, 59(4), 847–888.

30
Pham, M. H. (2020). In law we trust: Lawyer CEOs and stock liquidity. Journal of Financial
Markets, 50, 100548.
Stein, J. C. (1988). Takeover threats and managerial myopia. Journal of Political Economy, 96(1),
61–80.
Sunder, J., Sunder, S. V., & Zhang, J. (2017). Pilot CEOs and corporate innovation. Journal of
Financial Economics, 123(1), 209–224.

31
Appendix A Variable Definitions
Variable Definition
Capex Capital expenditures scaled by lagged total assets (Compustat).
CEOage CEO age (ExecuComp, BoardEx, or hand collected data).
CEOdelta The change in CEO’s wealth associated with a 1% change in the firm’s stock
price (ExecuComp).
CEOtenure CEO tenure defined as the number of years since the appointment year to the
year of measurement (ExecuComp, BoardEx, or hand collected data).
CEOvega The change in CEO stock option portfolio for a 1% change in stock volatility.
This variable includes vega from prior option grants and options granted in the
current year (ExecuComp).
FileLawsuit Indicator variable that equals 1 if the firm files a lawsuit in a given year and zero
otherwise (Audit Analytics Legal File)
FPS Indicator variable that equals one if the firm is in the biotech, computer,
electronic, or retail industry and zero otherwise.
GC Indicator variable that equals 1 if the general counsel is among the top five paid
executives, and 0 otherwise (ExecuComp).
Ivy Indicator variable that equals 1 if the CEO has a degree from an Ivy League
school, and 0 otherwise (BoardEx or hand collected data).
LawyerCEO Indicator variable that equals 1 if at least one of the CEOs possesses legal
expertise, and 0 otherwise. Following Henderson et al. (2018), we consider a
CEO to possess legal expertise if s/he holds an undergraduate degree in law such
as an LLB, or a graduate degree such as LLM, J.D., or Ph.D. in Jurisprudence
(ExecuComp, BoardEx, or hand collected data).
LawyerCEO100miles The percentage of firms located in the 100-mile radius of the focal firm’s
headquarters that have a lawyer CEO (ExecuComp, BoardEx, or hand collected
data).
LawyerDirectorPct The mean percentage of board of directors with legal expertise. We consider a
board member to possess legal expertise if s/he holds an undergraduate degree
in law such as an LLB, or a graduate degree such as LLM, J.D., or Ph.D. in
Jurisprudence (BoardEx or hand collected data).
Leverage Firm leverage (total liabilities scaled by total assets).
LitRisk Firm litigation risk is estimated following Kim and Skinner (2012). Specifically,
we use the predicted values estimated from the model below:
Suedt = 𝛾0 + 𝛾1FPSt-1 + 𝛾2Sizet-1 + 𝛾3SalesGrowtht-1 + 𝛾4Return t-1
+ 𝛾5ReturnSkewness t-1 + 𝛾6ReturnStd t-1 + 𝛾7Turnover t-1 + 𝜃
LogNCites Log value of the number of citations received (NBER and data provided by
Kogan et al., 2017).
LogNCitesNonself Log value of the number of non-self citations received (NBER and data provided
by Kogan et al., 2017).
LogNCitesNonselfAdj Log value of the number of non-self citation received adjusted for truncation
bias following Hall et al.,2001, 2005. (NBER and data provided by Kogan et al.,
2017).
LogNPatents Log value of the number of patents filed and eventually granted (NBER and data
provided by Kogan et al., 2017).
LogNPatentsAdj Log value of the number of patents filed and eventually granted, adjusted for
truncation bias following Hall et al.,2001, 2005 (NBER and data provided by
Kogan et al., 2017).
MB Market to book value of total assets (Compustat).
MBA Indicator variable that equals 1 if the CEO has an MBA degree, and 0 otherwise
(BoardEx or hand dcollected data).
PastLitigationExperiences The number of law cases filed against the firm in the past three years (Audit
Analytics Legal File)
Return Cumulative monthly stock returns for a given year (CRSP).
32
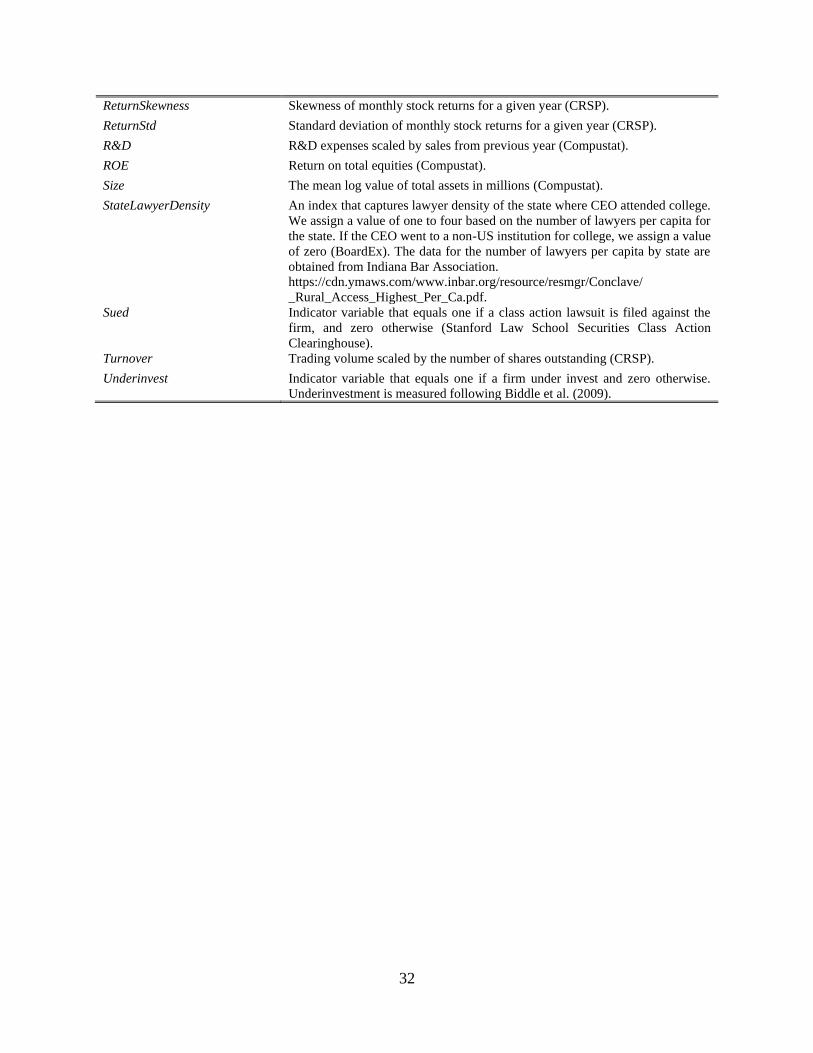
ReturnSkewness Skewness of monthly stock returns for a given year (CRSP).
ReturnStd Standard deviation of monthly stock returns for a given year (CRSP).
R&D R&D expenses scaled by sales from previous year (Compustat).
ROE Return on total equities (Compustat).
Size The mean log value of total assets in millions (Compustat).
StateLawyerDensity An index that captures lawyer density of the state where CEO attended college.
We assign a value of one to four based on the number of lawyers per capita for
the state. If the CEO went to a non-US institution for college, we assign a value
of zero (BoardEx). The data for the number of lawyers per capita by state are
obtained from Indiana Bar Association.
https://cdn.ymaws.com/www.inbar.org/resource/resmgr/Conclave/
_Rural_Access_Highest_Per_Ca.pdf.
Sued Indicator variable that equals one if a class action lawsuit is filed against the
firm, and zero otherwise (Stanford Law School Securities Class Action
Clearinghouse).
Turnover Trading volume scaled by the number of shares outstanding (CRSP).
Underinvest Indicator variable that equals one if a firm under invest and zero otherwise.
Underinvestment is measured following Biddle et al. (2009).
33
Table 1 Summary Statistics
This table reports summary statistics for the variables used in the main analyses. Panel A reports the total number of
CEOs observations at the year-firm level and the percentage of lawyer CEOs observations by industry. We tabulate
the distribution using the Fama-French 12-industry classification in this panel for brevity. In our main analysis, our
industry classification is based on the first two digits of the SIC code. Panel B reports the total number of CEOs
observations at the year-firm level and the percentage of lawyer CEOs observations by year. Panel C reports the total
number of CEOs observations at the year-firm level and the percentage of lawyer CEOs observations by state. Panel
D presents descriptive statistics for the variables used in our main regressions. T-statistics are corrected for serial
correlation. The unit of analysis is at the firm-year level.
Panel A: Lawyer CEO Percentage by Industry
Industry
Firm-Year
Observations
Lawyer CEO
Percentage
Consumer Nondurables 715 5%
Consumer Durables 339 6%
Manufacturing 1,518 8%
Oil, Gas, and Coal Extraction and Products 540 7%
Chemicals and Allied Products 382 6%
Business Equipment 2,461 4%
Telephone and Television Transmission 254 15%
Utilities 573 27%
Wholesale, Retail, and Some Services (Laundries, Repair Shops) 1,536 6%
Healthcare, Medical Equipment, and Drugs 1,098 8%
Finance 2,308 12%
Other 1,523 13%
Total 13,247 9%
Panel B: Lawyer CEO Percentage by Year
Year
Firm-Year
Observation
s
Lawyer CEO
Percentage
2000 988 11%
2001 1,212 10%
2002 1,268 10%
2003 1,513 9%
2004 1,539 9%
2005 1,494 9%
2006 1,608 8%
2007 1,858 8%
2008 1,767 8%
Total 13,247 9%
34
Panel C: Lawyer CEO Percentage by State
State
Firm-Year
Observations
Lawyer CEO
Percentage
State
Firm-Year
Observations
Lawyer CEO
Percentage
AK 9 0% MT 8 0%
AL 131 31% NC 253 8%
AR 94 14% ND 12 0%
AZ 151 18% NE 69 9%
CA 2208 5% NH 34 6%
CO 198 12% NJ 448 9%
CT 315 9% NM 4 0%
DC 49 43% NV 88 17%
DE 37 24% NY 1146 14%
FL 475 13% OH 588 10%
GA 393 6% OK 99 18%
HI 32 9% OR 139 1%
IA 93 2% PA 639 10%
ID 58 28% PR 2 0%
IL 732 7% RI 38 0%
IN 195 15% SC 77 19%
KS 51 2% SD 21 19%
KY 89 9% TN 279 4%
LA 98 6% TX 1174 7%
MA 584 6% UT 66 14%
MD 194 12% VA 329 13%
ME 18 0% VT 17 18%
MI 291 10% WA 219 6%
MN 410 4% WI 245 9%
MO 288 1% WV 20 0%
MS 40 8% Total 13,247 9%

35
Panel D: Descriptive Statistics
Full Sample
(N=13,247)
Lawyer
CEO
Non-Lawyer
CEO
Variable Mean Median
Standard
Deviation Minimum Maximum
Mean Mean Difference T-Statistics
LawyerCEO 0.09 0.00 0.28 0.00 1.00
NPatentsAdjt+1 9.12 0.00 35.80 0.00 269.44 7.50 9.28 -1.78 -1.67
NPatentsAdjt+2 8.60 0.00 32.96 0.00 244.31 6.64 8.79 -2.15 -2.05
NPatentsAdjt+3 8.27 0.00 31.08 0.00 228.56 5.87 8.50 -2.63 -2.51
NCitesNonSelfAdj t+1 49.19 0.00 217.24 0.00 1670.83 35.17 50.55 -15.38 -2.57
NCitesNonSelfAdj t+2 45.00 0.00 199.30 0.00 1518.70 29.22 46.54 -17.32 -2.98
NCitesNonSelfAdj t+3 45.14 0.00 199.67 0.00 1504.97 25.47 47.09 -21.62 -3.55
CEOtenure 4.83 3.00 5.58 0.00 29.00 5.19 4.79 0.40 2.47
CEOage 54.83 55.00 7.21 39.00 75.00 56.09 54.71 1.38 6.35
CEOdelta 0.72 0.19 1.76 0.00 13.13 1.01 0.69 0.32 4.66
CEOvega 0.14 0.05 0.25 0.00 1.52 0.18 0.14 0.04 4.76
LawyerDirectorPct 0.12 0.11 0.11 0.00 0.43 0.17 0.12 0.05 12.91
Size 7.62 7.48 1.70 4.20 12.52 8.24 7.56 0.68 13.08
ROE 0.12 0.13 0.25 -0.90 1.14 0.13 0.12 0.01 1.28
MB 1.93 1.50 1.23 0.79 7.61 1.70 1.95 -0.25 -7.39
Leverage 0.54 0.55 0.22 0.08 0.95 0.60 0.54 0.06 10.16
Ivy 0.15 0.00 0.36 0.00 1.00 0.23 0.14 0.09 7.35
MBA 0.34 0.00 0.47 0.00 1.00 0.14 0.36 -0.22 -20.11
GC 0.31 0.00 0.46 0.00 1.00 0.35 0.31 0.04 2.67
LawyerCEO100miles 0.08 0.08 0.07 0.00 0.33 0.14 0.08 0.06 25.64
StateLawyerDensity 2.45 2.00 1.14 1.00 4.00 2.61 2.43 0.18 4.86
36
Table 2 Lawyer CEOs and Corporate Innovation – Main Results
This table reports the baseline regression results of the relationship between CEO legal expertise and corporate
innovation using ordinary least squares method with the full sample. The unit of analysis is firm-year level using data
from 2000 to 2010. The dependent variable is LogNPatentsAdj from year T+1 to T+3 in columns 1-3 and
LogNCitesNonselfAdj from year T+1 to T+3 in columns 4-6. We control for industry, state, and year fixed effects.
The standard errors are clustered at the industry level, and t-statistics are reported in parentheses. ∗∗∗, ∗∗, and ∗
indicate significance at 1%, 5%, and 10% levels, respectively (two-tailed). All variables are defined in Appendix A.
(1) (2) (3) (4) (5) (6)
Dependent Variable = LogNPatentsAdj LogNCitesNonselfAdj
T+1 T+2 T+3 T+1 T+2 T+3
LawyerCEO -0.095* -0.104** -0.121**
-0.123* -0.136** -0.175***
(-1.73) (-2.07) (-2.51)
(-1.88) (-2.20) (-2.88)
CEOtenure 0.002 0.002 0.002
0.001 0.002 0.001
(0.62) (0.85) (0.69)
(0.33) (0.44) (0.26)
CEOage -0.004 -0.004 -0.003
-0.006* -0.008** -0.005
(-1.48) (-1.40) (-1.12)
(-1.67) (-2.14) (-1.65)
CEOdelta -0.038** -0.036** -0.035**
-0.045** -0.038** -0.031
(-2.12) (-2.03) (-2.07)
(-2.38) (-2.01) (-1.55)
CEOvega 0.422*** 0.390** 0.330**
0.436** 0.405** 0.378**
(2.68) (2.64) (2.26)
(2.41) (2.53) (2.24)
LawyerDirectorPct -0.354** -0.362* -0.417*
-0.451* -0.449* -0.562**
(-2.02) (-1.90) (-1.94)
(-1.90) (-1.95) (-2.21)
Size 0.324*** 0.329*** 0.344***
0.378*** 0.370*** 0.380***
(5.06) (5.06) (4.89)
(5.16) (4.99) (4.67)
ROE -0.105* -0.091 -0.058
-0.119 -0.120 -0.068
(-1.69) (-1.42) (-0.98)
(-1.54) (-1.23) (-0.73)
MB 0.145*** 0.141*** 0.149***
0.185*** 0.173*** 0.184***
(7.96) (7.94) (7.87)
(6.73) (8.18) (7.18)
Leverage -0.400*** -0.468*** -0.483***
-0.628*** -0.673*** -0.655***
(-2.71) (-3.08) (-2.90)
(-3.28) (-2.96) (-2.95)
Ivy 0.008 0.006 0.016
0.008 0.032 0.025
(0.21) (0.16) (0.40)
(0.14) (0.64) (0.56)
MBA 0.049 0.059 0.058
0.052 0.055 0.045
(1.05) (1.33) (1.27)
(0.99) (1.19) (0.87)
GC 0.067 0.090* 0.117**
0.097* 0.119** 0.143**
(1.35) (1.70) (2.06)
(1.76) (2.13) (2.27)
Constant -1.654*** -1.687*** -1.873***
-1.787*** -1.662*** -1.908***
(-4.03) (-3.91) (-3.89)
(-4.12) (-3.97) (-3.75)
Observations 13,247 11,084 8,919
13,247 11,084 8,919
Adjusted R-squared 0.466 0.465 0.466 0.377 0.361 0.352
Industry FE YES YES YES YES YES YES
State FE YES YES YES YES YES YES
Year FE YES YES YES YES YES YES
37
Table 3 Lawyer CEOs and Corporate Innovation - Matched Sample
This table reports the baseline regression results of the relationship between CEO legal expertise and corporate innovation using a matched sample based on
Coarsened Exact Matching. We match on the following six characteristics that could affect firm’s decision to hire a lawyer CEO: past litigation experiences (proxied
by the number of law cases filed against the firm in the past three years), firm size, market to book ratio, leverage, industry, state, and year. We coarsen each of the
first four continuous variables (i.e., past litigation experiences, firm size, market to book ratio, and leverage) using three equally spaced strata, and we perform one-
to-one matching on each stratum for each of the four variables. We also match on the exact value of year, state, and industry without coarsening. The unit of
analysis is firm-year level using data from 2000 to 2010. The dependent variable is LogNPatentsAdj from year T+1 to T+3 in columns 1-3 and LogNCitesNonselfAdj
from year T+1 to T+3 in columns 4-6. We control for industry, state, and year fixed effects. The standard errors are clustered at the industry level, and t-statistics
are reported in parentheses. ∗∗∗, ∗∗, and ∗ indicate significance at 1%, 5%, and 10% levels, respectively (two-tailed). All variables are defined in Appendix A.
Panel A: Checking Data Balance with T-Tests on Continuous Background Variables Before and After Matching
Before Matching After Matching
Variable Sample Observations Mean Difference T- statistics Observations Mean Difference T- statistics
PastLitigationExperiences Lawyer CEOs 1,172 1.617 0.255 2.26** 526 1.352 -0.175 -0.85
Non-Lawyer CEOs 12,075 1.362 526 1.527
Size Lawyer CEOs 1,172 8.243 0.680 13.18*** 526 8.233 0.127 1.12
Non-Lawyer CEOs 12,075 7.563 526 8.106
MB Lawyer CEOs 1,172 1.701 -0.250 -6.64*** 526 1.644 -0.035 -0.55
Non-Lawyer CEOs 12,075 1.951 526 1.679
Leverage Lawyer CEOs 1,172 0.699 0.064 9.41*** 526 0.616 -0.000 -0.01
Non-Lawyer CEOs 12,075 0.535 526 0.616
Total
13,247
1,052

38
Panel B: Baseline Regression Results using Matched Sample
(1) (2) (3) (4) (5) (6)
Dependent Variable = LogNPatentsAdj LogNCitesNonselfAdj
T+1 T+2 T+3 T+1 T+2 T+3
LawyerCEO -0.107** -0.145** -0.175**
-0.164** -0.252** -0.310***
(-2.28) (-2.46) (-2.73)
(-2.28) (-2.60) (-3.09)
CEOtenure 0.016** 0.019*** 0.028***
0.011 0.012 0.039**
(2.26) (2.80) (2.99)
(1.58) (0.96) (2.68)
CEOage -0.003 -0.002 -0.007
-0.002 -0.002 -0.020*
(-0.42) (-0.22) (-0.94)
(-0.22) (-0.27) (-1.76)
CEOdelta -0.049* -0.053** -0.055*
-0.049* -0.068** -0.058*
(-2.03) (-2.06) (-1.88)
(-1.97) (-2.38) (-1.75)
CEOvega 0.413 0.286** 0.376***
0.472 0.162 0.464***
(1.67) (2.07) (2.79)
(1.35) (0.79) (2.98)
LawyerDirectorPct -0.281 -0.153 -0.255
-0.284 0.330 -0.351
(-0.81) (-0.35) (-0.50)
(-0.60) (0.62) (-0.57)
Size 0.210** 0.209** 0.226**
0.288** 0.292** 0.291***
(2.70) (2.76) (2.66)
(2.49) (2.65) (2.80)
ROE 0.043 0.220* 0.139
0.181 0.148 0.304
(0.63) (1.82) (0.56)
(1.41) (0.72) (0.75)
MB 0.058 0.064 0.079*
0.040 0.177** 0.139**
(1.25) (1.12) (1.71)
(0.71) (2.31) (2.41)
Leverage 0.224 0.206 0.048
-0.053 -0.049 -0.055
(0.64) (0.46) (0.09)
(-0.11) (-0.10) (-0.10)
Ivy 0.012 0.064 0.057
-0.071 0.014 0.129
(0.21) (0.83) (0.66)
(-0.78) (0.11) (1.01)
MBA -0.066 0.007 -0.035
-0.113 0.043 -0.076
(-0.60) (0.07) (-0.37)
(-0.77) (0.37) (-0.60)
GC 0.018 -0.024 0.075
0.081 -0.002 0.083
(0.22) (-0.32) (0.76)
(1.05) (-0.03) (0.63)
Constant -1.202 -1.323* -1.155
-1.631* -1.954** -1.062
(-1.69) (-1.89) (-1.69)
(-1.88) (-2.63) (-1.47)
Observations 1,052 867 707
1,052 867 707
Adjusted R-squared 0.653 0.666 0.654 0.545 0.473 0.415
Industry FE YES YES YES YES YES YES
State FE YES YES YES YES YES YES
Year FE YES YES YES YES YES YES
39
Table 4 Lawyer CEOs and Corporate Innovation – Instrumental Variables and 2SLS
This table reports the results of the relationship between CEO legal expertise and corporate innovation using two
different instrumental variables. The first instrumental variable is LawyerCEO100miles, defined as the percentage of
firms located in the 100-mile radius of the focal firm’s headquarters that have a lawyer CEO. The second instrumental
variable is StateLawyerDensity, which is the index of lawyer density in the state where the CEO went to college. We
assign a value of one to four based on the number of lawyers per capita for the state. The unit of analysis is firm-year
level using data from 2000 to 2010. Panel A reports the first stage results of two instrumental variables. Panels B
presents the second stage results based on the instrumental variables LawyerCEO100miles. Panels C presents the
second stage results based on the instrumental variables LawyerCEO100miles and StateLawyerDensity. The
dependent variables are LogNPatentsAdj and LogNCitesNonselfAdj. We industry, state, and year fixed effects for the
second stage regressions. The standard errors are clustered at the industry level, and t-statistics are reported in
parentheses. ∗∗∗, ∗∗, and ∗ indicate significance at 1%, 5%, and 10% levels, respectively (two-tailed). All variables
are defined in Appendix A.
Panel A: First Stage Results
(1) (2)
Dependent Variable = LawyerCEO LawyerCEO
LawyerCEO100miles 1.095*** 1.300***
(7.23) (7.17)
StateLawyerDensity 0.019***
(3.96)
CEOtenure -0.000 0.001
(-0.36) (0.79)
CEOage 0.001 0.002*
(1.58) (1.94)
CEOdelta 0.002 0.003
(0.67) (0.76)
CEOvega 0.016 0.009
(0.51) (0.26)
LawyerDirectorPct 0.164*** 0.229***
(2.74) (3.01)
Size 0.010** 0.006
(2.25) (1.15)
ROE 0.004 0.003
(0.33) (0.21)
MB -0.003 -0.003
(-0.74) (-0.67)
Leverage -0.012 -0.017
(-0.46) (-0.48)
Ivy -0.085*** 0.035*
(-5.51) (1.91)
MBA -0.016** -0.106***
(-2.17) (-6.35)
GC -0.065 -0.023***
(-1.50) (-2.65)
Constant -0.000 -0.065
(-0.36) (-1.20)
Observations 13,247 10,585
Adjusted R-squared 0.155 0.191
Industry FE YES YES
State FE YES YES
Year FE YES YES
40
Panel B: Second Stage Results based on the First Instrumental Variable (LawyerCEO100miles)
(1) (2) (3) (4) (5) (6)
Dependent Variable LogNPatentsAdj LogNCitesNonselfAdj
T+1 T+2 T+3 T+1 T+2 T+3
LawyerCEO
(Instrumented)
-
0.825**
* -0.900*** -0.715***
-1.098** -0.872** -0.676**
(-2.69) (-2.85) (-2.63) (-2.56) (-2.34) (-2.22)
CEOtenure 0.002 0.002 0.002
0.001 0.001 0.001
(0.57) (0.72) (0.59)
(0.27) (0.34) (0.19)
CEOage -0.004 -0.003 -0.002
-0.005 -0.007* -0.005
(-1.20) (-1.06) (-0.85) (-1.39) (-1.86) (-1.41)
CEOdelta -
0.037** -0.035** -0.034**
-0.043** -0.037** -0.030
(-2.11) (-2.03) (-2.08)
(-2.37) (-2.02) (-1.56)
CEOvega 0.439**
* 0.413*** 0.350**
0.459** 0.427** 0.395**
(2.65) (2.64) (2.36) (2.39) (2.55) (2.31)
LawyerDirectorPct -0.214 -0.202 -0.303 -0.264 -0.300 -0.465*
(-1.33) (-1.15) (-1.48) (-1.23) (-1.44) (-1.89)
Size 0.331**
* 0.336*** 0.349***
0.387*** 0.377*** 0.384***
(5.11) (5.14) (4.99)
(5.18) (5.05) (4.78)
ROE -0.103 -0.091 -0.061 -0.117 -0.120 -0.071
(-1.63) (-1.36) (-0.98) (-1.48) (-1.20) (-0.74)
MB 0.142**
* 0.137*** 0.146***
0.181*** 0.170*** 0.182***
(7.68) (7.56) (7.54)
(6.57) (7.94) (7.07)
Leverage
-
0.409**
* -0.477*** -0.485***
-0.639*** -0.681*** -0.656***
(-2.82) (-3.23) (-3.02) (-3.39) (-3.07) (-3.02)
Ivy 0.050 0.055 0.055
0.063 0.077 0.058
(1.10) (1.15) (1.25)
(1.11) (1.37) (1.13)
MBA -0.016 -0.014 0.002 -0.035 -0.012 -0.003
(-0.31) (-0.28) (0.03) (-0.62) (-0.24) (-0.06)
GC 0.058 0.081 0.112* 0.085 0.111* 0.139**
(1.09) (1.46) (1.92) (1.42) (1.89) (2.16)
Constant -0.072 0.046 -0.098
0.272 0.397 0.119
(-0.23) (0.15) (-0.27)
(1.00) (1.50) (0.33)
Observations 13,247 11,086 8,920 13,247 11,086 8,920
Adjusted R-squared 0.449 0.445 0.459 0.363 0.356 0.356
Industry FE YES YES YES YES YES YES
State FE YES YES YES YES YES YES
Year FE YES YES YES YES YES YES

41
42
Panel C: Second Stage Results based on the First Instrumental Variable (LawyerCEO100miles)
and the Second Instrumental Variable (StateLawyerDensity)
(1) (2) (3) (4) (5) (6)
Dependent Variable = LogNPatentsAdj LogNCitesNonselfAdj
T+1 T+2 T+3 T+1 T+2 T+3
LawyerCEO
(Instrumented) -0.805*** -0.850*** -0.734***
-1.026*** -0.821** -0.683*
(-2.71) (-2.77) (-2.70)
(-2.69) (-2.11) (-1.86)
CEOtenure 0.004 0.004 0.005
0.004 0.003 0.004
(1.10) (1.12) (1.03)
(0.85) (0.76) (0.59)
CEOage -0.003 -0.003 -0.003
-0.006 -0.008* -0.006
(-1.02) (-0.89) (-0.85)
(-1.39) (-1.89) (-1.51)
CEOdelta -0.038** -0.035* -0.034*
-0.045** -0.038* -0.029
(-2.06) (-1.90) (-1.94)
(-2.21) (-1.86) (-1.31)
CEOvega 0.397** 0.362** 0.323**
0.418** 0.372** 0.354**
(2.24) (2.17) (2.07)
(2.12) (2.19) (2.03)
LawyerDirectorPct -0.198 -0.177 -0.255
-0.297 -0.276 -0.383
(-1.12) (-0.93) (-1.16)
(-1.25) (-1.21) (-1.52)
Size 0.355*** 0.362*** 0.378***
0.416*** 0.410*** 0.426***
(5.57) (5.65) (5.48)
(5.68) (5.60) (5.37)
ROE -0.139* -0.127 -0.070
-0.189* -0.206* -0.103
(-1.69) (-1.40) (-0.78)
(-1.81) (-1.85) (-1.02)
MB 0.151*** 0.144*** 0.147***
0.191*** 0.176*** 0.179***
(7.18) (7.14) (6.63)
(6.62) (6.95) (6.19)
Leverage -0.549*** -0.625*** -0.656***
-0.780*** -0.877*** -0.931***
(-3.65) (-4.01) (-3.96)
(-4.19) (-3.79) (-4.21)
Ivy 0.017 0.016 0.018
0.023 0.039 0.019
(0.38) (0.32) (0.37)
(0.37) (0.61) (0.31)
MBA -0.049 -0.047 -0.040
-0.069 -0.036 -0.029
(-0.87) (-0.83) (-0.77)
(-1.08) (-0.55) (-0.43)
GC 0.054 0.078 0.102
0.080 0.107 0.126
(0.91) (1.17) (1.42)
(1.16) (1.49) (1.55)
Constant 0.189 0.407 0.335
0.659** 0.937*** 0.879**
(0.58) (1.21) (0.90)
(2.30) (3.04) (2.20)
Observations 10,585 8,845 7,105
10,585 8,845 7,105
Adjusted R-squared 0.465 0.464 0.476
0.465 0.464 0.476
Industry FE YES YES YES YES YES YES
State FE YES YES YES YES YES YES
Year FE YES YES YES YES YES YES
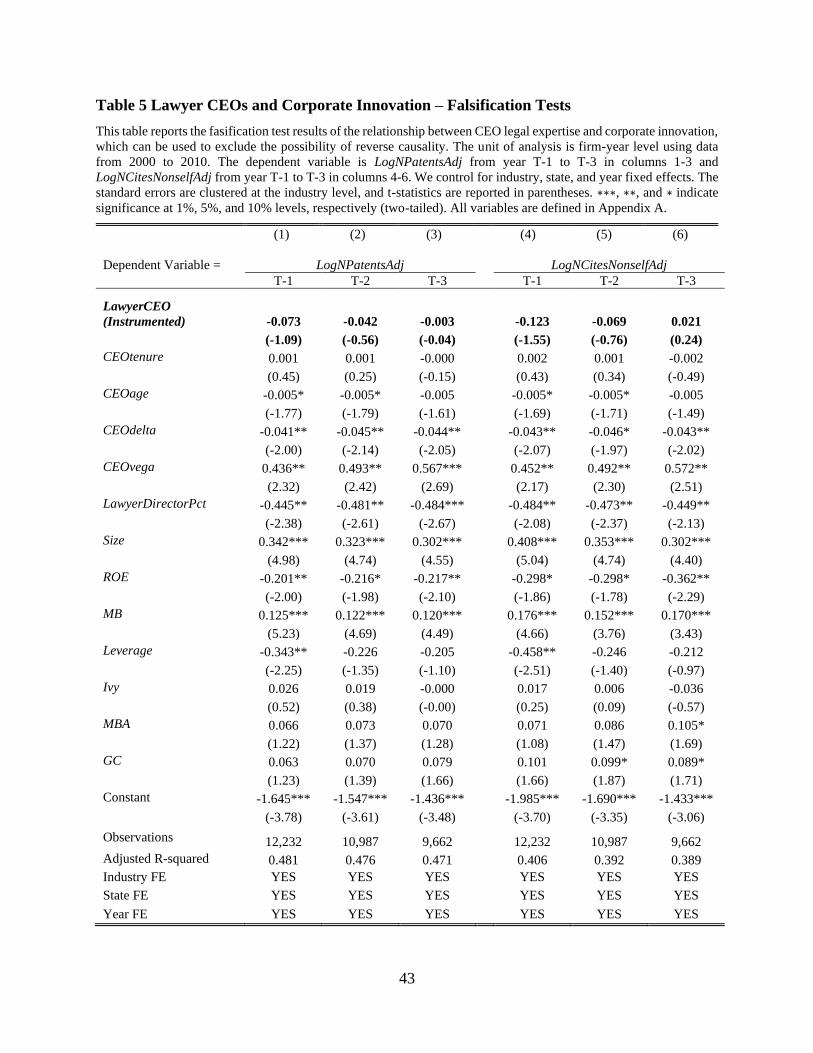
43
Table 5 Lawyer CEOs and Corporate Innovation – Falsification Tests
This table reports the fasification test results of the relationship between CEO legal expertise and corporate innovation,
which can be used to exclude the possibility of reverse causality. The unit of analysis is firm-year level using data
from 2000 to 2010. The dependent variable is LogNPatentsAdj from year T-1 to T-3 in columns 1-3 and
LogNCitesNonselfAdj from year T-1 to T-3 in columns 4-6. We control for industry, state, and year fixed effects. The
standard errors are clustered at the industry level, and t-statistics are reported in parentheses. ∗∗∗, ∗∗, and ∗ indicate
significance at 1%, 5%, and 10% levels, respectively (two-tailed). All variables are defined in Appendix A.
(1) (2) (3) (4) (5) (6)
Dependent Variable = LogNPatentsAdj LogNCitesNonselfAdj
T-1 T-2 T-3 T-1 T-2 T-3
LawyerCEO
(Instrumented) -0.073 -0.042 -0.003
-0.123 -0.069 0.021
(-1.09) (-0.56) (-0.04)
(-1.55) (-0.76) (0.24)
CEOtenure 0.001 0.001 -0.000
0.002 0.001 -0.002
(0.45) (0.25) (-0.15)
(0.43) (0.34) (-0.49)
CEOage -0.005* -0.005* -0.005
-0.005* -0.005* -0.005
(-1.77) (-1.79) (-1.61)
(-1.69) (-1.71) (-1.49)
CEOdelta -0.041** -0.045** -0.044**
-0.043** -0.046* -0.043**
(-2.00) (-2.14) (-2.05)
(-2.07) (-1.97) (-2.02)
CEOvega 0.436** 0.493** 0.567***
0.452** 0.492** 0.572**
(2.32) (2.42) (2.69)
(2.17) (2.30) (2.51)
LawyerDirectorPct -0.445** -0.481** -0.484***
-0.484** -0.473** -0.449**
(-2.38) (-2.61) (-2.67)
(-2.08) (-2.37) (-2.13)
Size 0.342*** 0.323*** 0.302***
0.408*** 0.353*** 0.302***
(4.98) (4.74) (4.55)
(5.04) (4.74) (4.40)
ROE -0.201** -0.216* -0.217**
-0.298* -0.298* -0.362**
(-2.00) (-1.98) (-2.10)
(-1.86) (-1.78) (-2.29)
MB 0.125*** 0.122*** 0.120***
0.176*** 0.152*** 0.170***
(5.23) (4.69) (4.49)
(4.66) (3.76) (3.43)
Leverage -0.343** -0.226 -0.205
-0.458** -0.246 -0.212
(-2.25) (-1.35) (-1.10)
(-2.51) (-1.40) (-0.97)
Ivy 0.026 0.019 -0.000
0.017 0.006 -0.036
(0.52) (0.38) (-0.00)
(0.25) (0.09) (-0.57)
MBA 0.066 0.073 0.070
0.071 0.086 0.105*
(1.22) (1.37) (1.28)
(1.08) (1.47) (1.69)
GC 0.063 0.070 0.079
0.101 0.099* 0.089*
(1.23) (1.39) (1.66)
(1.66) (1.87) (1.71)
Constant -1.645*** -1.547*** -1.436***
-1.985*** -1.690*** -1.433***
(-3.78) (-3.61) (-3.48)
(-3.70) (-3.35) (-3.06)
Observations 12,232 10,987 9,662
12,232 10,987 9,662
Adjusted R-squared 0.481 0.476 0.471
0.406 0.392 0.389
Industry FE YES YES YES YES YES YES
State FE YES YES YES YES YES YES
Year FE YES YES YES YES YES YES
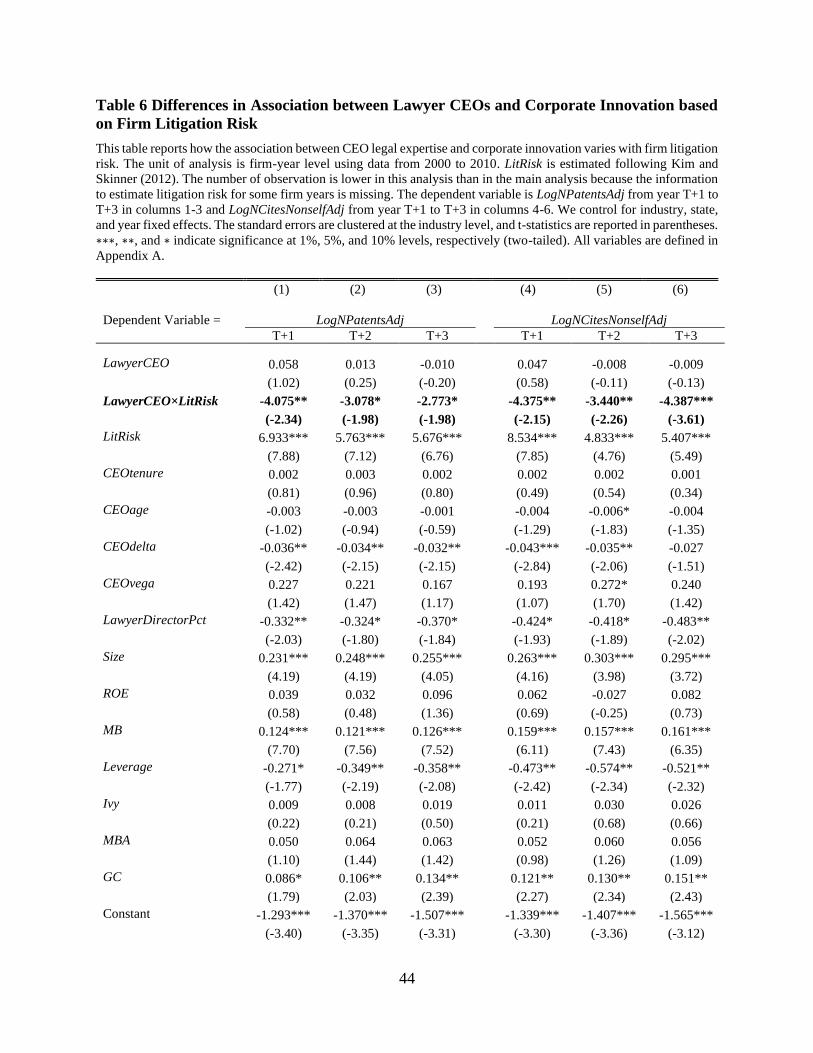
44
Table 6 Differences in Association between Lawyer CEOs and Corporate Innovation based
on Firm Litigation Risk
This table reports how the association between CEO legal expertise and corporate innovation varies with firm litigation
risk. The unit of analysis is firm-year level using data from 2000 to 2010. LitRisk is estimated following Kim and
Skinner (2012). The number of observation is lower in this analysis than in the main analysis because the information
to estimate litigation risk for some firm years is missing. The dependent variable is LogNPatentsAdj from year T+1 to
T+3 in columns 1-3 and LogNCitesNonselfAdj from year T+1 to T+3 in columns 4-6. We control for industry, state,
and year fixed effects. The standard errors are clustered at the industry level, and t-statistics are reported in parentheses.
∗∗∗, ∗∗, and ∗ indicate significance at 1%, 5%, and 10% levels, respectively (two-tailed). All variables are defined in
Appendix A.
(1) (2) (3) (4) (5) (6)
Dependent Variable = LogNPatentsAdj LogNCitesNonselfAdj
T+1 T+2 T+3 T+1 T+2 T+3
LawyerCEO 0.058 0.013 -0.010
0.047 -0.008 -0.009
(1.02) (0.25) (-0.20)
(0.58) (-0.11) (-0.13)
LawyerCEO×LitRisk -4.075** -3.078* -2.773*
-4.375** -3.440** -4.387***
(-2.34) (-1.98) (-1.98)
(-2.15) (-2.26) (-3.61)
LitRisk 6.933*** 5.763*** 5.676***
8.534*** 4.833*** 5.407***
(7.88) (7.12) (6.76)
(7.85) (4.76) (5.49)
CEOtenure 0.002 0.003 0.002
0.002 0.002 0.001
(0.81) (0.96) (0.80)
(0.49) (0.54) (0.34)
CEOage -0.003 -0.003 -0.001
-0.004 -0.006* -0.004
(-1.02) (-0.94) (-0.59)
(-1.29) (-1.83) (-1.35)
CEOdelta -0.036** -0.034** -0.032**
-0.043*** -0.035** -0.027
(-2.42) (-2.15) (-2.15)
(-2.84) (-2.06) (-1.51)
CEOvega 0.227 0.221 0.167
0.193 0.272* 0.240
(1.42) (1.47) (1.17)
(1.07) (1.70) (1.42)
LawyerDirectorPct -0.332** -0.324* -0.370*
-0.424* -0.418* -0.483**
(-2.03) (-1.80) (-1.84)
(-1.93) (-1.89) (-2.02)
Size 0.231*** 0.248*** 0.255***
0.263*** 0.303*** 0.295***
(4.19) (4.19) (4.05)
(4.16) (3.98) (3.72)
ROE 0.039 0.032 0.096
0.062 -0.027 0.082
(0.58) (0.48) (1.36)
(0.69) (-0.25) (0.73)
MB 0.124*** 0.121*** 0.126***
0.159*** 0.157*** 0.161***
(7.70) (7.56) (7.52)
(6.11) (7.43) (6.35)
Leverage -0.271* -0.349** -0.358**
-0.473** -0.574** -0.521**
(-1.77) (-2.19) (-2.08)
(-2.42) (-2.34) (-2.32)
Ivy 0.009 0.008 0.019
0.011 0.030 0.026
(0.22) (0.21) (0.50)
(0.21) (0.68) (0.66)
MBA 0.050 0.064 0.063
0.052 0.060 0.056
(1.10) (1.44) (1.42)
(0.98) (1.26) (1.09)
GC 0.086* 0.106** 0.134**
0.121** 0.130** 0.151**
(1.79) (2.03) (2.39)
(2.27) (2.34) (2.43)
Constant -1.293*** -1.370*** -1.507***
-1.339*** -1.407*** -1.565***
(-3.40) (-3.35) (-3.31)
(-3.30) (-3.36) (-3.12)
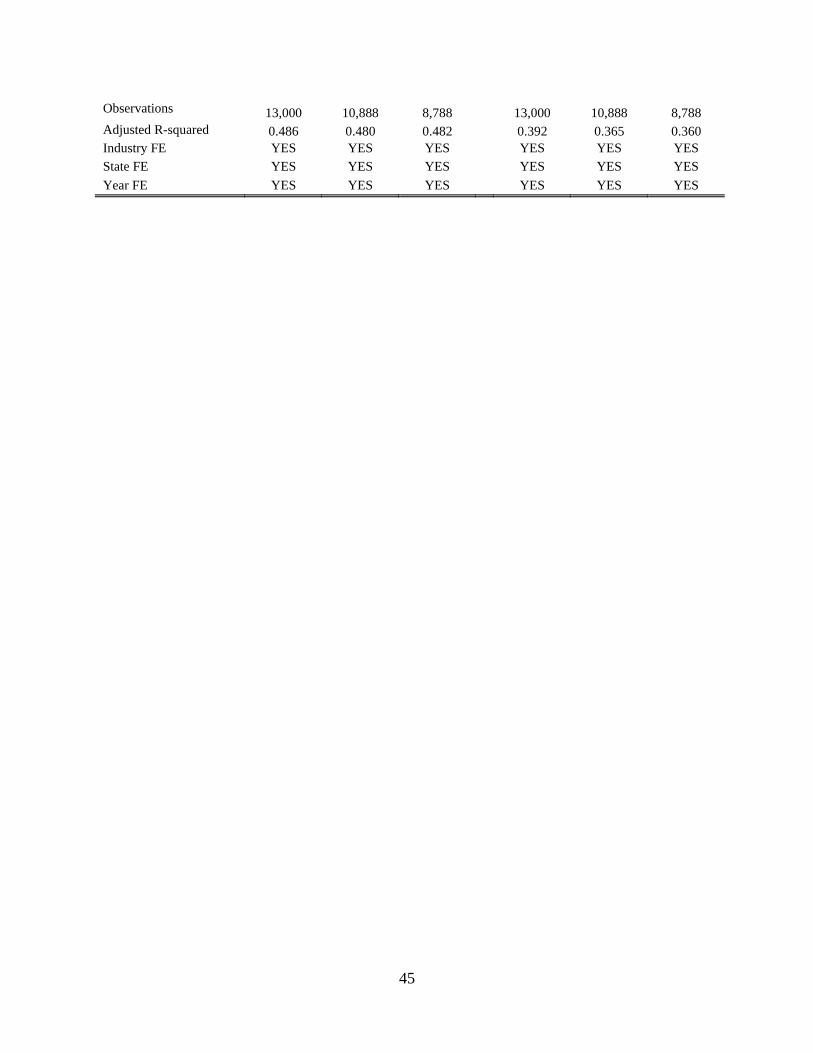
45
Observations 13,000 10,888 8,788
13,000 10,888 8,788
Adjusted R-squared 0.486 0.480 0.482
0.392 0.365 0.360
Industry FE YES YES YES YES YES YES
State FE YES YES YES YES YES YES
Year FE YES YES YES YES YES YES
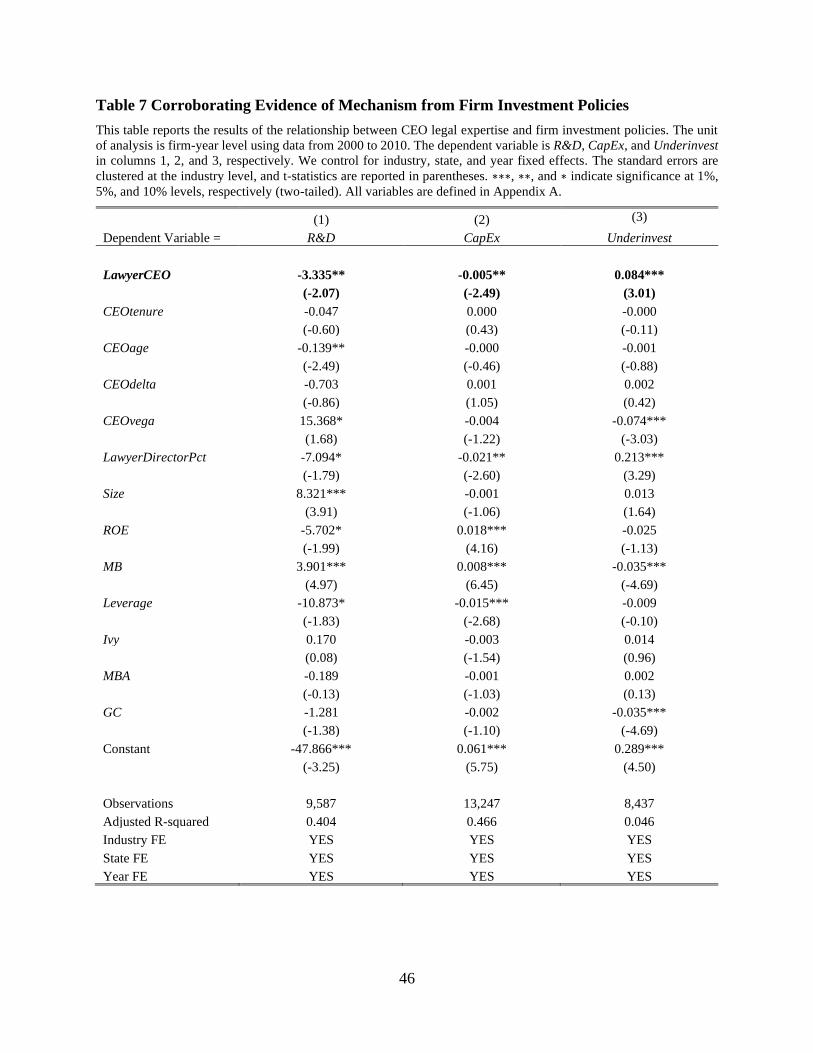
46
Table 7 Corroborating Evidence of Mechanism from Firm Investment Policies
This table reports the results of the relationship between CEO legal expertise and firm investment policies. The unit
of analysis is firm-year level using data from 2000 to 2010. The dependent variable is R&D, CapEx, and Underinvest
in columns 1, 2, and 3, respectively. We control for industry, state, and year fixed effects. The standard errors are
clustered at the industry level, and t-statistics are reported in parentheses. ∗∗∗, ∗∗, and ∗ indicate significance at 1%,
5%, and 10% levels, respectively (two-tailed). All variables are defined in Appendix A.
(1) (2) (3)
Dependent Variable = R&D CapEx Underinvest
LawyerCEO -3.335** -0.005** 0.084***
(-2.07) (-2.49) (3.01)
CEOtenure -0.047 0.000 -0.000
(-0.60) (0.43) (-0.11)
CEOage -0.139** -0.000 -0.001
(-2.49) (-0.46) (-0.88)
CEOdelta -0.703 0.001 0.002
(-0.86) (1.05) (0.42)
CEOvega 15.368* -0.004 -0.074***
(1.68) (-1.22) (-3.03)
LawyerDirectorPct -7.094* -0.021** 0.213***
(-1.79) (-2.60) (3.29)
Size 8.321*** -0.001 0.013
(3.91) (-1.06) (1.64)
ROE -5.702* 0.018*** -0.025
(-1.99) (4.16) (-1.13)
MB 3.901*** 0.008*** -0.035***
(4.97) (6.45) (-4.69)
Leverage -10.873* -0.015*** -0.009
(-1.83) (-2.68) (-0.10)
Ivy 0.170 -0.003 0.014
(0.08) (-1.54) (0.96)
MBA -0.189 -0.001 0.002
(-0.13) (-1.03) (0.13)
GC -1.281 -0.002 -0.035***
(-1.38) (-1.10) (-4.69)
Constant -47.866*** 0.061*** 0.289***
(-3.25) (5.75) (4.50)
Observations 9,587 13,247 8,437
Adjusted R-squared 0.404 0.466 0.046
Industry FE YES YES YES
State FE YES YES YES
Year FE YES YES YES

47
Table 8 Additional Test to Rule Out Alternative Explanation
This table reports the results of the relationship between CEO legal expertise and the company’s likelihood of filing
a lawsuit. The unit of analysis is firm-year level using data from 2000 to 2010. The dependent variable is FileLawsuit,
which is an indicator variable that equals one if the firm files a lawsuit in a given year and zero otherwise. We control
for industry, state, and year fixed effects. The standard errors are clustered at the industry level, and t-statistics are
reported in parentheses. ∗∗∗, ∗∗, and ∗ indicate significance at 1%, 5%, and 10% levels, respectively (two-tailed). All
variables are defined in Appendix A.
(1)
Dependent Variable = FileLawsuit
LawyerCEO -0.004
(-0.41)
CEOtenure 0.000
(0.15)
CEOage -0.001**
(-2.13)
CEOdelta -0.005***
(-2.76)
CEOvega 0.022
(0.81)
LawyerDirectorPct -0.019
(-0.85)
Size 0.031***
(6.60)
ROE -0.021**
(-2.38)
MB 0.015***
(3.81)
Leverage -0.077***
(-4.36)
Ivy 0.001
(0.21)
MBA 0.002
(0.40)
GC -0.115***
(-3.32)
Constant -0.004
(-0.41)
Observations 13,247
Adjusted R-squared 0.066
Industry FE YES
State FE YES
Year FE YES
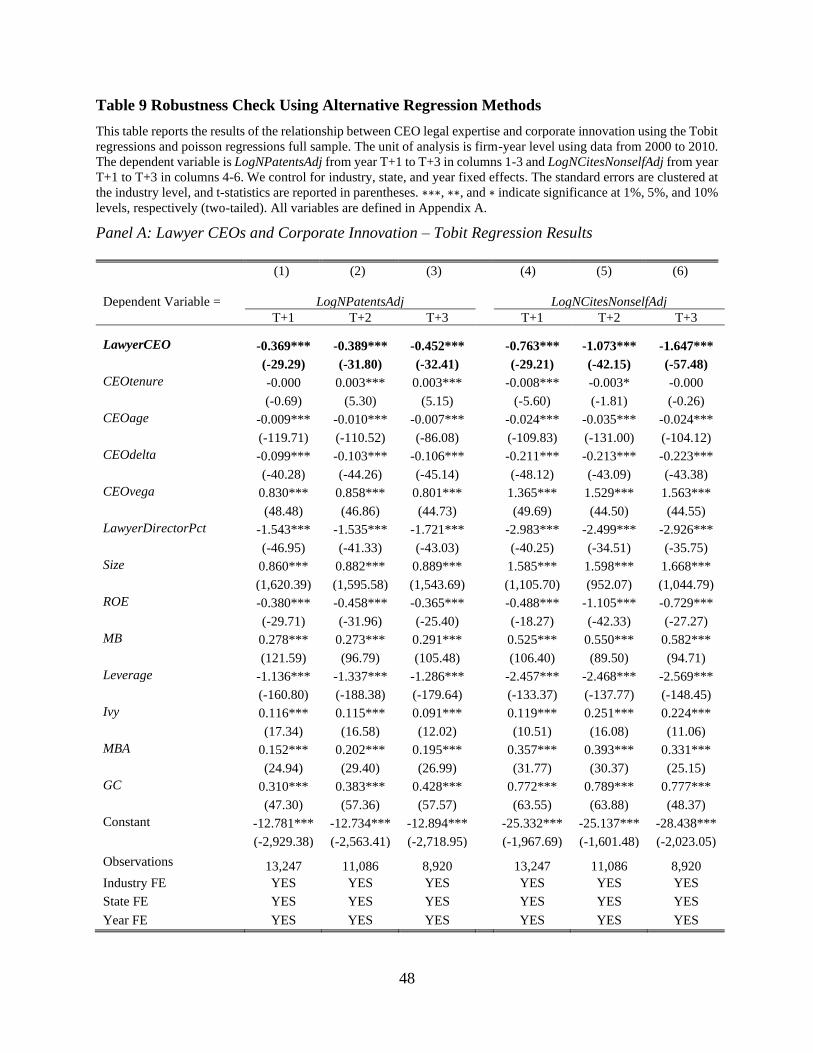
48
Table 9 Robustness Check Using Alternative Regression Methods
This table reports the results of the relationship between CEO legal expertise and corporate innovation using the Tobit
regressions and poisson regressions full sample. The unit of analysis is firm-year level using data from 2000 to 2010.
The dependent variable is LogNPatentsAdj from year T+1 to T+3 in columns 1-3 and LogNCitesNonselfAdj from year
T+1 to T+3 in columns 4-6. We control for industry, state, and year fixed effects. The standard errors are clustered at
the industry level, and t-statistics are reported in parentheses. ∗∗∗, ∗∗, and ∗ indicate significance at 1%, 5%, and 10%
levels, respectively (two-tailed). All variables are defined in Appendix A.
Panel A: Lawyer CEOs and Corporate Innovation – Tobit Regression Results
(1) (2) (3) (4) (5) (6)
Dependent Variable = LogNPatentsAdj LogNCitesNonselfAdj
T+1 T+2 T+3 T+1 T+2 T+3
LawyerCEO -0.369*** -0.389*** -0.452***
-0.763*** -1.073*** -1.647***
(-29.29) (-31.80) (-32.41)
(-29.21) (-42.15) (-57.48)
CEOtenure -0.000 0.003*** 0.003***
-0.008*** -0.003* -0.000
(-0.69) (5.30) (5.15)
(-5.60) (-1.81) (-0.26)
CEOage -0.009*** -0.010*** -0.007***
-0.024*** -0.035*** -0.024***
(-119.71) (-110.52) (-86.08)
(-109.83) (-131.00) (-104.12)
CEOdelta -0.099*** -0.103*** -0.106***
-0.211*** -0.213*** -0.223***
(-40.28) (-44.26) (-45.14)
(-48.12) (-43.09) (-43.38)
CEOvega 0.830*** 0.858*** 0.801***
1.365*** 1.529*** 1.563***
(48.48) (46.86) (44.73)
(49.69) (44.50) (44.55)
LawyerDirectorPct -1.543*** -1.535*** -1.721***
-2.983*** -2.499*** -2.926***
(-46.95) (-41.33) (-43.03)
(-40.25) (-34.51) (-35.75)
Size 0.860*** 0.882*** 0.889***
1.585*** 1.598*** 1.668***
(1,620.39) (1,595.58) (1,543.69)
(1,105.70) (952.07) (1,044.79)
ROE -0.380*** -0.458*** -0.365***
-0.488*** -1.105*** -0.729***
(-29.71) (-31.96) (-25.40)
(-18.27) (-42.33) (-27.27)
MB 0.278*** 0.273*** 0.291***
0.525*** 0.550*** 0.582***
(121.59) (96.79) (105.48)
(106.40) (89.50) (94.71)
Leverage -1.136*** -1.337*** -1.286***
-2.457*** -2.468*** -2.569***
(-160.80) (-188.38) (-179.64)
(-133.37) (-137.77) (-148.45)
Ivy 0.116*** 0.115*** 0.091***
0.119*** 0.251*** 0.224***
(17.34) (16.58) (12.02)
(10.51) (16.08) (11.06)
MBA 0.152*** 0.202*** 0.195***
0.357*** 0.393*** 0.331***
(24.94) (29.40) (26.99)
(31.77) (30.37) (25.15)
GC 0.310*** 0.383*** 0.428***
0.772*** 0.789*** 0.777***
(47.30) (57.36) (57.57)
(63.55) (63.88) (48.37)
Constant -12.781*** -12.734*** -12.894***
-25.332*** -25.137*** -28.438***
(-2,929.38) (-2,563.41) (-2,718.95)
(-1,967.69) (-1,601.48) (-2,023.05)
Observations 13,247 11,086 8,920
13,247 11,086 8,920
Industry FE YES YES YES YES YES YES
State FE YES YES YES YES YES YES
Year FE YES YES YES YES YES YES

49
Panel B: Lawyer CEOs and Corporate Innovation – Poisson Regression Results
(1) (2) (3) (4) (5) (6)
Dependent Variable = LogNPatentsAdj LogNCitesNonselfAdj
T+1 T+2 T+3 T+1 T+2 T+3
LawyerCEO -0.218** -0.257** -0.291**
-0.250** -0.347** -0.471***
(-2.17) (-2.36) (-2.40)
(-2.07) (-2.55) (-3.33)
CEOtenure 0.000 0.002 0.002
-0.001 0.001 0.001
(0.12) (0.45) (0.37)
(-0.19) (0.11) (0.23)
CEOage -0.002 -0.002 -0.001
-0.003 -0.005 -0.004
(-0.64) (-0.63) (-0.36)
(-0.90) (-1.56) (-1.10)
CEOdelta -0.031*** -0.031*** -0.032***
-0.040*** -0.042*** -0.040***
(-2.86) (-2.77) (-2.60)
(-3.95) (-3.47) (-3.08)
CEOvega 0.183** 0.202** 0.186*
0.204** 0.238** 0.239*
(2.41) (2.56) (1.90)
(2.38) (2.50) (1.85)
LawyerDirectorPct -0.848*** -0.854*** -0.926***
-0.872*** -0.840*** -0.943***
(-3.00) (-3.05) (-3.15)
(-3.38) (-3.14) (-2.97)
Size 0.410*** 0.413*** 0.416***
0.403*** 0.406*** 0.410***
(14.98) (14.63) (15.30)
(14.73) (16.45) (17.95)
ROE -0.023 -0.052 -0.025
-0.012 -0.135 -0.120
(-0.31) (-0.74) (-0.31)
(-0.16) (-1.25) (-1.18)
MB 0.089*** 0.089*** 0.094***
0.092*** 0.103*** 0.122***
(3.94) (3.98) (3.63)
(3.73) (3.31) (4.17)
Leverage -0.395** -0.453*** -0.423**
-0.580*** -0.598*** -0.559***
(-2.47) (-2.58) (-2.04)
(-3.48) (-2.78) (-2.65)
Ivy 0.028 0.015 0.014
0.011 0.023 -0.004
(0.38) (0.20) (0.19)
(0.16) (0.34) (-0.07)
MBA 0.045 0.063 0.068
0.058 0.075 0.077
(0.67) (0.91) (1.02)
(0.80) (1.14) (1.12)
GC 0.173*** 0.193*** 0.210***
0.206*** 0.206*** 0.195**
(2.59) (2.60) (2.70)
(2.98) (2.86) (2.38)
Constant -19.720 -18.417 -19.826
-19.173 -19.816 -19.423
(0.00) (0.00) (-0.31)
(-1.10) (-0.24) (-0.55)
Observations 13,247 11,086 8,920
13,247 11,086 8,920
Industry FE YES YES YES YES YES YES
State FE YES YES YES YES YES YES
Year FE YES YES YES YES YES YES
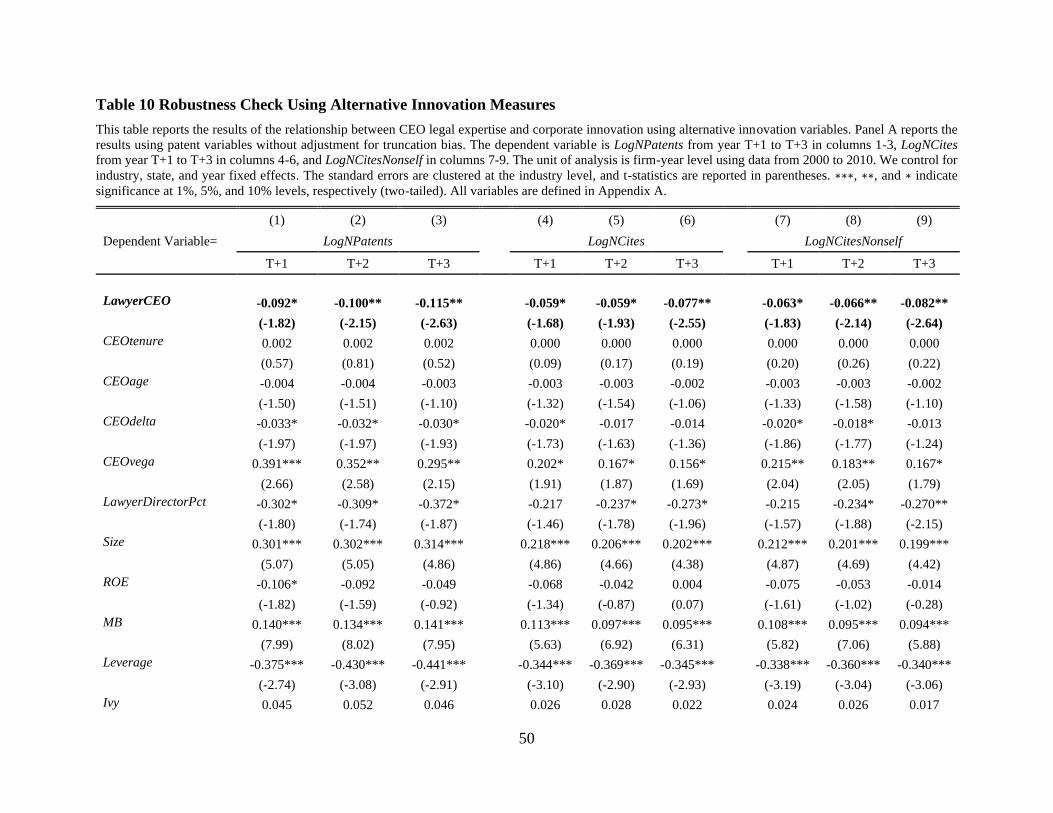
50
Table 10 Robustness Check Using Alternative Innovation Measures
This table reports the results of the relationship between CEO legal expertise and corporate innovation using alternative innovation variables. Panel A reports the
results using patent variables without adjustment for truncation bias. The dependent variable is LogNPatents from year T+1 to T+3 in columns 1-3, LogNCites
from year T+1 to T+3 in columns 4-6, and LogNCitesNonself in columns 7-9. The unit of analysis is firm-year level using data from 2000 to 2010. We control for
industry, state, and year fixed effects. The standard errors are clustered at the industry level, and t-statistics are reported in parentheses. ∗∗∗, ∗∗, and ∗ indicate
significance at 1%, 5%, and 10% levels, respectively (two-tailed). All variables are defined in Appendix A.
(1) (2) (3) (4) (5) (6) (7) (8) (9)
Dependent Variable= LogNPatents LogNCites LogNCitesNonself
T+1 T+2 T+3 T+1 T+2 T+3 T+1 T+2 T+3
LawyerCEO -0.092* -0.100** -0.115**
-0.059* -0.059* -0.077**
-0.063* -0.066** -0.082**
(-1.82) (-2.15) (-2.63)
(-1.68) (-1.93) (-2.55)
(-1.83) (-2.14) (-2.64)
CEOtenure 0.002 0.002 0.002
0.000 0.000 0.000
0.000 0.000 0.000
(0.57) (0.81) (0.52)
(0.09) (0.17) (0.19)
(0.20) (0.26) (0.22)
CEOage -0.004 -0.004 -0.003
-0.003 -0.003 -0.002
-0.003 -0.003 -0.002
(-1.50) (-1.51) (-1.10)
(-1.32) (-1.54) (-1.06)
(-1.33) (-1.58) (-1.10)
CEOdelta -0.033* -0.032* -0.030*
-0.020* -0.017 -0.014
-0.020* -0.018* -0.013
(-1.97) (-1.97) (-1.93)
(-1.73) (-1.63) (-1.36)
(-1.86) (-1.77) (-1.24)
CEOvega 0.391*** 0.352** 0.295**
0.202* 0.167* 0.156*
0.215** 0.183** 0.167*
(2.66) (2.58) (2.15)
(1.91) (1.87) (1.69)
(2.04) (2.05) (1.79)
LawyerDirectorPct -0.302* -0.309* -0.372*
-0.217 -0.237* -0.273*
-0.215 -0.234* -0.270**
(-1.80) (-1.74) (-1.87)
(-1.46) (-1.78) (-1.96)
(-1.57) (-1.88) (-2.15)
Size 0.301*** 0.302*** 0.314***
0.218*** 0.206*** 0.202***
0.212*** 0.201*** 0.199***
(5.07) (5.05) (4.86)
(4.86) (4.66) (4.38)
(4.87) (4.69) (4.42)
ROE -0.106* -0.092 -0.049
-0.068 -0.042 0.004
-0.075 -0.053 -0.014
(-1.82) (-1.59) (-0.92)
(-1.34) (-0.87) (0.07)
(-1.61) (-1.02) (-0.28)
MB 0.140*** 0.134*** 0.141***
0.113*** 0.097*** 0.095***
0.108*** 0.095*** 0.094***
(7.99) (8.02) (7.95)
(5.63) (6.92) (6.31)
(5.82) (7.06) (5.88)
Leverage -0.375*** -0.430*** -0.441***
-0.344*** -0.369*** -0.345***
-0.338*** -0.360*** -0.340***
(-2.74) (-3.08) (-2.91)
(-3.10) (-2.90) (-2.93)
(-3.19) (-3.04) (-3.06)
Ivy 0.045 0.052 0.046
0.026 0.028 0.022
0.024 0.026 0.017
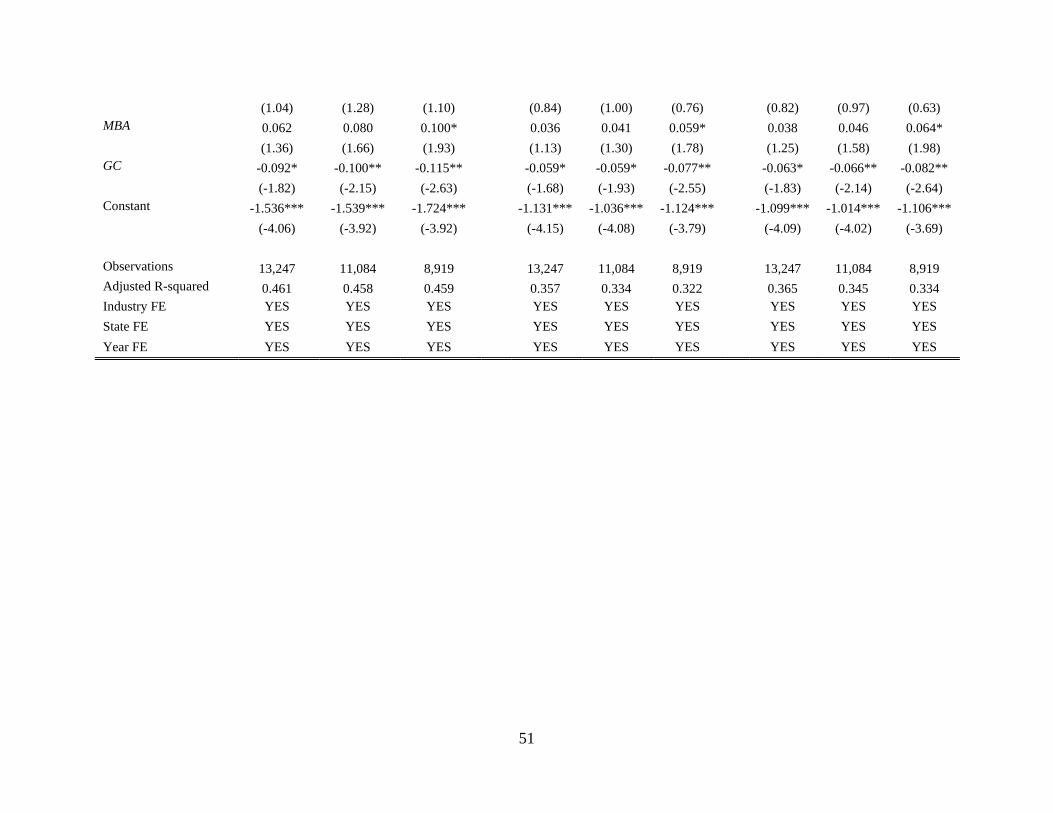
51
(1.04) (1.28) (1.10)
(0.84) (1.00) (0.76)
(0.82) (0.97) (0.63)
MBA 0.062 0.080 0.100*
0.036 0.041 0.059*
0.038 0.046 0.064*
(1.36) (1.66) (1.93)
(1.13) (1.30) (1.78)
(1.25) (1.58) (1.98)
GC -0.092* -0.100** -0.115**
-0.059* -0.059* -0.077**
-0.063* -0.066** -0.082**
(-1.82) (-2.15) (-2.63)
(-1.68) (-1.93) (-2.55)
(-1.83) (-2.14) (-2.64)
Constant -1.536*** -1.539*** -1.724***
-1.131*** -1.036*** -1.124***
-1.099*** -1.014*** -1.106***
(-4.06) (-3.92) (-3.92)
(-4.15) (-4.08) (-3.79)
(-4.09) (-4.02) (-3.69)
Observations 13,247 11,084 8,919
13,247 11,084 8,919
13,247 11,084 8,919
Adjusted R-squared 0.461 0.458 0.459
0.357 0.334 0.322
0.365 0.345 0.334
Industry FE YES YES YES YES YES YES YES YES YES
State FE YES YES YES YES YES YES YES YES YES
Year FE YES YES YES YES YES YES YES YES YES