lean principles implementation in the program preparation ... · pdf filelean principles...
TRANSCRIPT
Lean Principles Implementation in the Program Preparation Phase
by
Freddie Douglas, III
Master of Science in Engineering University of Alabama in Huntsville, 1989
Bachelor of Science in Mechanical Engineering Southern University and A&M College, 1983
SUBMITTED TO THE SYSTEM DESIGN AND MANAGEMENT PROGRAM IN PARTIAL
FULFILLMENT OF THE REQUIREMENTS FOR THE DEGREE OF
MASTER OF SCIENCE IN ENGINEERING AND BUSINESS MANAGEMENT
AT THE MASSACHUSETTS INSTITUTE OF TECHNOLOGY
FEBRUARY 2002
© 2002 Freddie Douglas, III. All Rights Reserved
The author hereby grants to MIT permission to reproduce and to distribute publicly paper and electronic copies of this thesis document in whole or in part.
Signature of Author
Freddie Douglas, III System Design and Management Program
Certified by
Dr. Deborah J. Nightingale
Thesis Supervisor Professor of the Practice Aeronautics and Astronautics and Engineering Systems
Accepted by
Steven D. Eppinger Co-Director, LFM/SDM
GM LFM Professor of Management Science and Engineering Systems Accepted by
Paul A. Lagace Co-Director, LFM/SDM
Professor of Aeronautics & Astronautics and Engineering Systems
Massachusetts Institute of Technology - System Design and Management
ii
Lean Principles Implementation in the Program Preparation Phase
by
Freddie Douglas, III
Master of Science in Engineering, University of Alabama in Huntsville (1989) Bachelor of Science in Mechanical Engineering, Southern University and A&M College (1983)
Submitted to the System Design and Management Program
in Partial Fulfillment of the Requirements
for the Degree of
Master of Science in Engineering and Business Management
ABSTRACT
The space launch system framework brings to the forefront the implications of multiple stakeholders, market conditions, the convoluted manner in which public sector programs are conceived and implemented, and the perceived smoother and focused manner for private sector efforts. In the public sector case this process is drawn out and typically, the financing structure does not support obtaining the overall best costs. The inter-relationship of demands, brought by various stakeholders serviced by the Public Sector, result in reinforcing behavioral loops that make it virtually impossible to satisfy the needs of the Public Sector enough to ensure global competitiveness for the private sector. The public sector has taken steps to ensure that regulatory and infrastructure capabilities are competitive enablers. In addition, the Public Sector also focuses on reducing the cost-per-pound-to-orbit as a measure of competitive effectiveness or advantage. However, the appropriateness of this measure changes as the customer/supplier relationship changes from Public Sector, to launch service provider, to satellite developer, to the General Public. Measures for these relationships move from cost-per-pound-to-orbit, to providing assurances of affordability, profitability, reliability, capability, and availability to maximizing benefit from a multi-billion dollar revenue stream.
In the program/project Preparation Phase, these measures manifest themselves in terms of implementation strategies based on market conditions and timing. Lean focuses on value from the customer’s perspective; for this work, its definition is hypothesized to be service oriented and embodies service management features of tangible and intangible elements. Leveraging this definition, service embodies the act, perceived quality and cost to the customer: the same attributes that epitomize the amorphous and dynamic formulation environment associated with the Preparation Phase. This hypothesized expression of value is verified through case study of cancelled launch vehicle programs, analysis of system performance parameters that drive launch system costs, congressional records, interviews with industry participants, surveys and other artifacts from other industries that develop complex systems (i.e., shipbuilding, offshore exploration and cargo aircraft).
Major hindrances to successful integration of public and private goals and objectives in complex systems, like launch vehicle development, is the high cost of the technology involved and return on investment considerations. In both cases, methods of funding and the recovery of expenses are important.
Massachusetts Institute of Technology - System Design and Management
iii
Yet, the methods used are not necessarily compatible. The year-to-year cash flow basis of funding and related uncertainty resulting from the political process, does not support gains from economies of scale and the heightening of the possibility of reneging on agreements. These issues are extremely important in today’s environment where Private Sector participation in Public Sector-sponsored activities include shared risk and costs. Other considerations that cause inefficiencies in the development process that are carryovers from the preparation stage, are market dynamics, size and the organizational structure used during the development (this is of particular importance when the customer/supplier relationship is public-to-private). Interviews with Private Sector developers indicate that payload-to-orbit-costs and reductions in facility operations costs, are important and should be monitored. However, they are dwarfed by opportunity costs associated with market timeliness and revenue streams for the payload owner.
In the Preparation Phase of Programs/Projects, Lean Principles can be applied to a variety of assurances and process methodologies. These principles are used in conjunction with service management principles that help to identify task and process importance to the overall customer value. An example of customer value would be early recognition of the potential incompatibility of the goals and objectives of the parties involved and subsequently work to minimize the long-term implications of this condition. This scenario is an example of Muda in the formulation process. Without incentives for both parties to participate, the program would not be executed. Compromises are necessary on the part of both parties to see the program executed (this is a form of necessary waste or Muda). Another would be recognizing that platform architecture issues are important and should drive timing between derivative products and the infusion/leveraging of technology. Since public and private investment strategies have not supported continuity in launch system technologies, significant gaps in the knowledge spectrum exist and require sizeable relearning of technologies and systems performance behaviors. Other areas where this exists includes continuity of leadership and a heightened potential of reneging, which are interface issues at the point-of-service delivery. These are perceived to be highly important. The Servuction framework highlights these measures of effectiveness, held important by one party, which are not necessarily important by the ultimate end customer providing the end service. This is manifested by the Public Sector’s continued focus on reducing launch service costs. However, when considering the total system cost and performance, launch services are a small part of the costs. Degree of importance from the end customer perspective is the reliability and availability of such systems and associated facilities and qualified personnel. This is also an unrecognized goal of the Public Sector in its efforts to support economic competitiveness for US industries in the commercialization of space. This is also an example where waste in the development process exists due to misalignment of performance measure structure and importance. This form of waste has to be eliminated and the proper alignment achieved.
Thesis Supervisor: Deborah Nightingale
Title: Professor of the Practice of Aeronautics and Astronautics and Engineering Systems

Massachusetts Institute of Technology - System Design and Management
iv
ACKNOWLEDGEMENTS
To NASA, for affording me the opportunity to study at the seat of modern engineering thought—MIT.
To my parents: without your love, encouragement, and sacrifice, none of this experience would have been
possible, thank you so much for the gift of a lifetime.
To my children, Candace, Morgan, and Lacey: I thank each of you for your love and encouragement, but
especially for the unique opportunity to sit around the table and do home work together. It is said that
children learn by example. It is my hope and prayer that each of you learns from my example and knows
that all things are possible when Christ is in your life. [Philippians 4:13]
To my wife Anita: thank you for your untiring love and support, which made this experience possible,
and our relationship stronger.
To my Lord and Savior: I give thanks for this gift and it is my prayer that it is used for your glory and the
edification of your children. [1 Corinthians 12:1-11]

Massachusetts Institute of Technology - System Design and Management
v
----Intentionally Left Blank----
Massachusetts Institute of Technology - System Design and Management
vi
Table of Contents Table of Contents...................................................................................................................................................................vi List of Figures ......................................................................................................................................................................viii List of Tables ...........................................................................................................................................................................ix List of Equations.....................................................................................................................................................................ix
Chapter 1 - Introduction .............................................................................................................................................................. 1 1.1. Thesis Goal................................................................................................................................................................... 1 1.2. Motivation: Access-to-Space.................................................................................................................................. 1 1.3. Problem Statement...................................................................................................................................................... 4 1.4. Applicable Models ...................................................................................................................................................... 6
1.4.1. Program/Project Management....................................................................................................................... 7 1.4.2. Management Issues........................................................................................................................................... 9 1.4.3. Service Management Models......................................................................................................................... 9
1.4.3.1. Servuction Model....................................................................................................................................... 10 1.4.3.2. Servqual Model .......................................................................................................................................... 12 1.4.3.3. Customer Value .......................................................................................................................................... 14
1.5. Thesis Outline ............................................................................................................................................................ 14 Chapter 2 – Heuristic Development and Methodology..................................................................................................... 16
2.1. Lean Thinking and Principles............................................................................................................................... 16 2.2. Heuristic Development ........................................................................................................................................... 17 2.3. Premise and Feature Statement............................................................................................................................ 19 2.4. Thesis Methodology................................................................................................................................................. 19
2.4.1. Architectural Approach.................................................................................................................................. 20 2.4.1.1. Principles ..................................................................................................................................................... 21 2.4.1.2. Process ......................................................................................................................................................... 21 2.4.1.3. Tools ............................................................................................................................................................. 22
Chapter 3 – Lean in Product Development .......................................................................................................................... 23 3.2. Lean Application in the Product Development Process............................................................................... 23
3.2.1. Value and Multiple Stakeholders ............................................................................................................... 25 3.2.1.1. Value ........................................................................................................................................................... 25 3.2.1.2. Multiple Stakeholders............................................................................................................................ 25
3.2.2. Product Goal Setting ....................................................................................................................................... 26 3.2.3. Measures of Effectiveness............................................................................................................................ 26
Chapter 4 - Access-to-space Case Study ................................................................................................................................ 28 4.1. Needs of Beneficiary & Regulations – Social/Political/Technical Issues............................................. 28 4.2. Stakeholder Implications ........................................................................................................................................ 29
4.2.1. Strategies (Public & Private) - Corporate strategy.............................................................................. 30 4.2.1.1. Technology................................................................................................................................................ 31 4.2.1.2. Strategy Selection ................................................................................................................................... 33
4.3. Competitive Issues.................................................................................................................................................... 36 4.4. Organization ............................................................................................................................................................... 38 4.5. Architectural Innovation Issues............................................................................................................................ 42
Chapter 5 – Analyses .................................................................................................................................................................. 46 5.1. Executive Interviews................................................................................................................................................ 46 5.2. Congressional Records Review............................................................................................................................ 48 5.3. Access-to-space Case Study.................................................................................................................................. 50 5.4. Survey........................................................................................................................................................................... 53 5.5. Affinity Diagramming ............................................................................................................................................. 58 5.6. Quality Function Deployment Analysis ............................................................................................................ 62
Chapter 6 - Proposed Framework .......................................................................................................................................... 66 6.1. Premise and Feature................................................................................................................................................. 68
Massachusetts Institute of Technology - System Design and Management
vii
6.1.1. Feature 1.............................................................................................................................................................. 69 6.1.2. Feature 2.............................................................................................................................................................. 70 6.1.3. Feature 3.............................................................................................................................................................. 71
6.2. Gap Correlation ......................................................................................................................................................... 73 6.2.1. Gap – 1, Customer Expectations................................................................................................................. 74 6.2.2. Gap - 2, Service Quality Standards ............................................................................................................ 75 6.2.3. Gap – 3, Service Performance ..................................................................................................................... 76 6.2.4. Gap – 4, Promise and Delivery Mismatch............................................................................................... 78 6.2.5. Gap – 5, Sum of Gaps 1 thru 4.................................................................................................................... 79
6.3. Summary...................................................................................................................................................................... 81 Chapter 7 - Follow-on Activities .............................................................................................................................................. 84 Bibliography.................................................................................................................................................................................. 86 References ...................................................................................................................................................................................... 90 Appendix A - Affinity Diagramming Prioritization ........................................................................................................... 92 Appendix B – Survey Data ........................................................................................................................................................ 98
Survey (2)............................................................................................................................................................................... 98 Survey (3)............................................................................................................................................................................. 106
Appendix C – Quality Function Deployment Analysis.................................................................................................... 112 Appendix D - Framework Mapping ..................................................................................................................................... 114
Massachusetts Institute of Technology - System Design and Management
viii
List of Figures Figure 1 - Access-to-space Launch System Development Efforts .......................................................................................... 3 Figure 2 - Strategy Integration and Development Causal Loop Diagram.............................................................................. 5 Figure 3 - Value Creation Framework ......................................................................................................................................... 7 Figure 4 - Program/Project Development Lifecycle .................................................................................................................. 8 Figure 5 - Servuction Model ....................................................................................................................................................... 11 Figure 6 - Blue Printing Analysis Framework.......................................................................................................................... 12 Figure 7 - Servqual Model .......................................................................................................................................................... 13 Figure 8 - Servqual Model Dimensions..................................................................................................................................... 13 Figure 9 - BLV Framework From A Service Perspective ...................................................................................................... 17 Figure 10 - Distributive Law of Multiplication over Addition Behavior............................................................................. 18 Figure 11 - Lowest Level of Decomposition ............................................................................................................................ 19 Figure 12 - Dimensions of Value ................................................................................................................................................ 24 Figure 13 - Goal Mapping to Upstream Product Influences .................................................................................................. 28 Figure 14 - Technology "S" Curve ............................................................................................................................................. 32 Figure 15 - "S" Curve for Rocket Propulsion Systems ........................................................................................................... 33 Figure 16 - Government Policy Effect on Access-to-space Value Capture......................................................................... 37 Figure 17 - Product/Process Innovation Dynamics.................................................................................................................. 38 Figure 18 - P/P Management Characteristics of Government Managers............................................................................. 39 Figure 19 - Typical Balanced Score Card.................................................................................................................................. 40 Figure 20 - Government/Contractor Relationship Rating....................................................................................................... 41 Figure 21 - Repeated Games Framework .................................................................................................................................. 42 Figure 22 - Architectural Innovation Mapping......................................................................................................................... 43 Figure 23 - Architectural Innovation Mapping......................................................................................................................... 44 Figure 24 - Access-to-space Technology Development Mapping ........................................................................................ 45 Figure 25 - Analysis Approach.................................................................................................................................................... 46 Figure 26 - Product Development Issues, Ordered Relative to Importance ........................................................................ 54 Figure 27 - CPP Correlation of Development Environment and P/P Success or Failure .................................................. 55 Figure 28 - Perceived CPP Risk Comparison-Douglas & Anderson.................................................................................... 56 Figure 29 - Experience with Commercial Procurement Practices......................................................................................... 57 Figure 30 - Mapping of Servqual Model Dimension vs. BLV Attributes............................................................................ 58 Figure 31 - Analysis Affinity Diagram...................................................................................................................................... 59 Figure 32 - Executive Interviews Affinity Diagram Categorization..................................................................................... 60 Figure 33 - Congressional Records Review Affinity Diagram.............................................................................................. 61 Figure 34 - Survey/Case Study Affinity Diagram.................................................................................................................... 62 Figure 35 - Access-to-space House of Quality ......................................................................................................................... 63 Figure 36 - Architectural Principle-Value at the Interface ..................................................................................................... 67 Figure 37 - Decomposition of BLV From Service Perspective to a Single Phase Application ....................................... 68 Figure 38 - Relationship Traits for Success in the P/P Preparation Phase........................................................................... 69 Figure 39 - Program/Project Phase Importance........................................................................................................................ 70 Figure 40 - Customer Value Relationship ................................................................................................................................. 72 Figure 41 - P/P Phase Product Correlation................................................................................................................................ 73 Figure 42 - Gap-1 Customer Expectation.................................................................................................................................. 75 Figure 43 - Gap-2 Quality Standards.......................................................................................................................................... 76 Figure 44 - Gap-3 Service Performance .................................................................................................................................... 78 Figure 45 - Gap 4 Promises and Delivery Mismatch............................................................................................................... 79 Figure 46 - Gap-5 with BLV Mapping ...................................................................................................................................... 80 Figure 47 - LAI Application of the Value Creation Framework........................................................................................... 85 Figure 48 - Access-to-space QFD ............................................................................................................................................. 112 Figure 49 - Access-to-space How vs How Conflict Matrix ................................................................................................. 113
Massachusetts Institute of Technology - System Design and Management
ix
List of Tables Table 1 - Program/Project Development Lifecycle ................................................................................................................... 8 Table 2 - Product Development Process Value Modes........................................................................................................... 23 Table 3 - Nine Technology Strategies........................................................................................................................................ 34 Table 4 - Summary of Rationale for Launch System Cancellation or Performance Failure ............................................ 52 Table 5 - Servqual Model Dimension & Phase Trait Mapping ............................................................................................. 83 Table 6 - Affinity Diagram Category Prioritization................................................................................................................. 92 Table 7 - Weighting Factors for Executive Interviews ........................................................................................................... 92 Table 8 - Weighting Factors for Congressional Records Review ......................................................................................... 93 Table 9 - Weighting Factors for Survey/Case Study............................................................................................................... 94 Table 10 - Correlation of How's to PD Value Categories....................................................................................................... 94 Table 11 - How vs. PD Frequency Distribution ....................................................................................................................... 95 Table 12 - Correlation of PD Value Attributes to Data Goals ............................................................................................... 95 Table 13 - Launch Service Provider by Regions as Percent of Total ................................................................................... 96 Table 14 - Competitive Pressure Calculation by Region........................................................................................................ 97 Table 15 – Gap - 1 Customer Expectations............................................................................................................................. 114 Table 16 - Gap - 2 Service Standards....................................................................................................................................... 115 Table 17 - Gap - 3 Service Performance.................................................................................................................................. 116 Table 18 - Gap - 4 Promises Do No Match Delivery ............................................................................................................ 118
List of Equations Equation 1 - Customer Value Equation From the Service Profit Chain….......................................................................... 14 Equation 2 - Customer Value Expressed in terms of Service and Strategy......................................................................... 71

Massachusetts Institute of Technology - System Design and Management
x
------Intentionally Left Blank----
Massachusetts Institute of Technology - System Design and Management
1
Chapter 1 - Introduction
1.1. Thesis Goal
The development of complex systems is achieved through the execution of a Lifecycle which
consist of Program/Project (P/P) 1 phases: 1) preparation, 2) planning, 3) execution, 4) adaptation and 5)
disposal. [1] These phases provide a framework for managing and conducting the development effort
associated with these systems. The goal of this thesis is to demonstrate the customer/supplier relationship
during the Preparation Phase more closely follows that defined by the field of Management of Services.2
This methodology and heuristic is believed to be consistent with the application of Lean Thinking and
Principles.
The Preparation Phase is critical to the long-term success of any P/P undertaken. It is during this
phase that goals, objectives, and the manner in which the P/P will be executed are established. This is
especially true when the systems are sizable, complex and proceed over long periods that include the
influences of political and market dynamic effects. This thesis uses the United States’ (U.S.) efforts to
develop cost effective access-to-space systems, as a case study to test this heuristic.
1.2. Motivation: Access-to-Space
Man has dreamed of space exploration, traveling to the outer reaches of the universe, in search of
other life forms. Post World War II, the imagination turned to low earth orbits and the impact rocketry
could have as a military weapon, but equally as a means of improving life here on earth. As we all know,
the space race of the 50’s and 60’s led to the U.S. embarking on the awesome task of sending and
returning a man to the moon. As the Saturn program matured, plans were developed that included the
development of a reusable launch vehic le and space station, both of which would be manned. The end of
the Saturn program saw the launch system offered to the Private Sector as an opportunity for profit. [2]
1 Program development or project development are terms used within complex system development circles and are similar in nature. However, the major difference is the magnitude and scope of the effort. 2 Services is defined as the act, performance, process, and benefit that does not result in the customer owning anything. [9]
Massachusetts Institute of Technology - System Design and Management
2
Following the Saturn program, the U.S. embarked on the National Space Transportation System
(NSTS), e.g., the Space Shuttle, in an effort to consolidate and focus space policy with respect to
development and operational costs, through the use of a partially Reusable Launch Vehicle (RLV). This
also included Expendable Launch Vehicle (ELV) systems, which were defense focused. At this time, the
U.S. had a dominant position in the world market for ELV services. These services included robotic
science and exploration missions, as well as those focused on unmanned national security.
However, policy consolidation and the development of the NSTS resulted in a reduction in
Research and Development (R&D) expenditures for expendable launch systems development. [3] The
manifestation of the policy directs the use of the NSTS as the primary launch system for Civil and
Department of Defense (DoD) missions. Coupling this with the 1986 loss of Shuttle flight 51-L3, the U.S.
saw its dominance in the ELV market significantly eroded. To recover, the U.S. re-invested in ELV
systems and began pursing RLV’s that could achieve performance targets not reached by the development
of the NSTS.
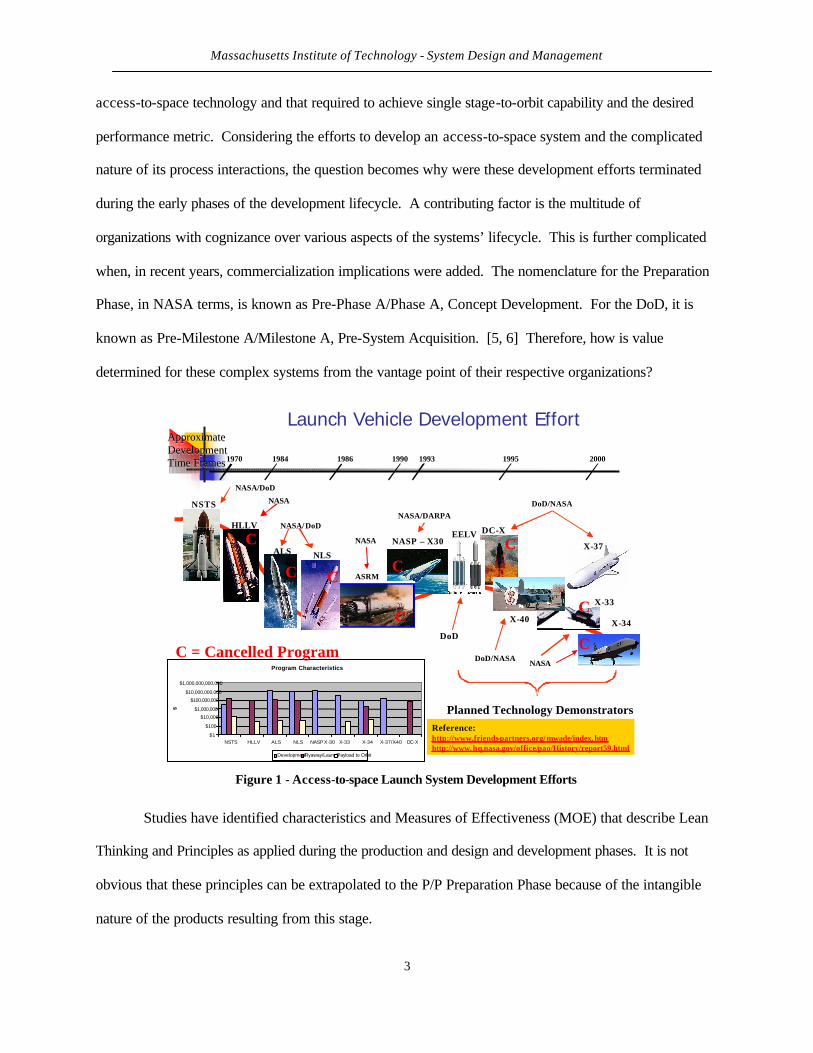
The pursuit of these performance parameters has seen the initiation and cancellation of
approximately eight (8) of twelve (12) Launch Vehicle efforts. Figure 1 is a pictorial representation of
the systems and their relative time of initiation and cancellation. The systems considered are the NSTS,
National and Advanced Launch Systems, National Aerospace Plane (NASP), Advanced Solid Rocket
Motor (ASRM), Evolved Expendable Launch Vehicle (EELV), DC-X, X-33, X-34, X-40, and X-37.
Each of these systems has some portion of its take-off mass that is not recoverable once the launch
mission profile is completed. Of the systems considered, all but NSTS, EELV, X-40, and X-37 have been
cancelled for a variety of reasons. [4]
Some say affordable and reliable access-to-space can only be achieved through the development
and operational deployment of a single stage to orbit vehicle. The current fleet of vehicles is either
completely or partially expendable vehicles. A significant technological gap exists between the current
3 51-L is the flight designation of the Space Shuttle Challenger flight that exploded during ascent on a January 1986 launch.
Massachusetts Institute of Technology - System Design and Management
3
access-to-space technology and that required to achieve single stage-to-orbit capability and the desired
performance metric. Considering the efforts to develop an access-to-space system and the complicated
nature of its process interactions, the question becomes why were these development efforts terminated
during the early phases of the development lifecycle. A contributing factor is the multitude of
organizations with cognizance over various aspects of the systems’ lifecycle. This is further complicated
when, in recent years, commercialization implications were added. The nomenclature for the Preparation
Phase, in NASA terms, is known as Pre-Phase A/Phase A, Concept Development. For the DoD, it is
known as Pre-Milestone A/Milestone A, Pre-System Acquisition. [5, 6] Therefore, how is value
determined for these complex systems from the vantage point of their respective organizations?
NSTS
HLLV
ALS NLS
NASP – X30DC-X
X-33
1970 1984 1986 1990 1993 1995 2000
NASA/DoD
NASA
NASA/DoD
DoD/NASANASA
NASA/DARPA
ApproximateApproximateDevelopmentDevelopmentTime FramesTime Frames
X-34
X-37
X-40
DoD/NASA
Planned Technology Demonstrators
C
CC
C
C
C
C
Program Characteristics
$1
$100
$10,000
$1,000,000
$100,000,000
$10,000,000,000
$1,000,000,000,000
NSTS HLLV ALS NLS NASP X -30 X-33 X-34 X-37/X-40 DC-X
$
DevelopmentFlyaway/LaunchPayload to Orbit
C = Cancelled Program
Reference:http://www.friends-partners.org/ mwade/index. htmhttp://www.hq.nasa.gov/office/pao/History/report59.html
Launch Vehicle Development Effort
C
ASRM
NASA
C
EELV
DoD
Figure 1 - Access-to-space Launch System Development Efforts
Studies have identified characteristics and Measures of Effectiveness (MOE) that describe Lean
Thinking and Principles as applied during the production and design and development phases. It is not
obvious that these principles can be extrapolated to the P/P Preparation Phase because of the intangible
nature of the products resulting from this stage.
Massachusetts Institute of Technology - System Design and Management
4
The commercial launch services market contains decisions surrounding value to multiple
stakeholders across the entire development lifecycle. An example would be the decision to
commercialize the Space Shuttle. The system was not developed with this goal in mind and its
development included trade-offs where long-term operational cost reducing efforts were eliminated in
order to reduce near term annual capital outlay. When conditions changed and commercialization is the
“buzz,” wonderment sets in when the commercialization effort does not generate the desired results. In
addition, licensing overhead, facility operations, and global competition all led to mismatches in market
timing, technology, “ilities” (availability, reliability, capability, affordability), decision-making, and
public support. This results in increased opportunity for discontinuity in goals/objectives and MOE for
determining success.
1.3. Problem Statement
Developing complex systems, especially when the Public Sector is the end user, has a number of
influences that all contribute to the difficulty and uncertainty that is typically attributable to this situation.
The cancelled access-to-space programs are an example of the casualties associated with the system
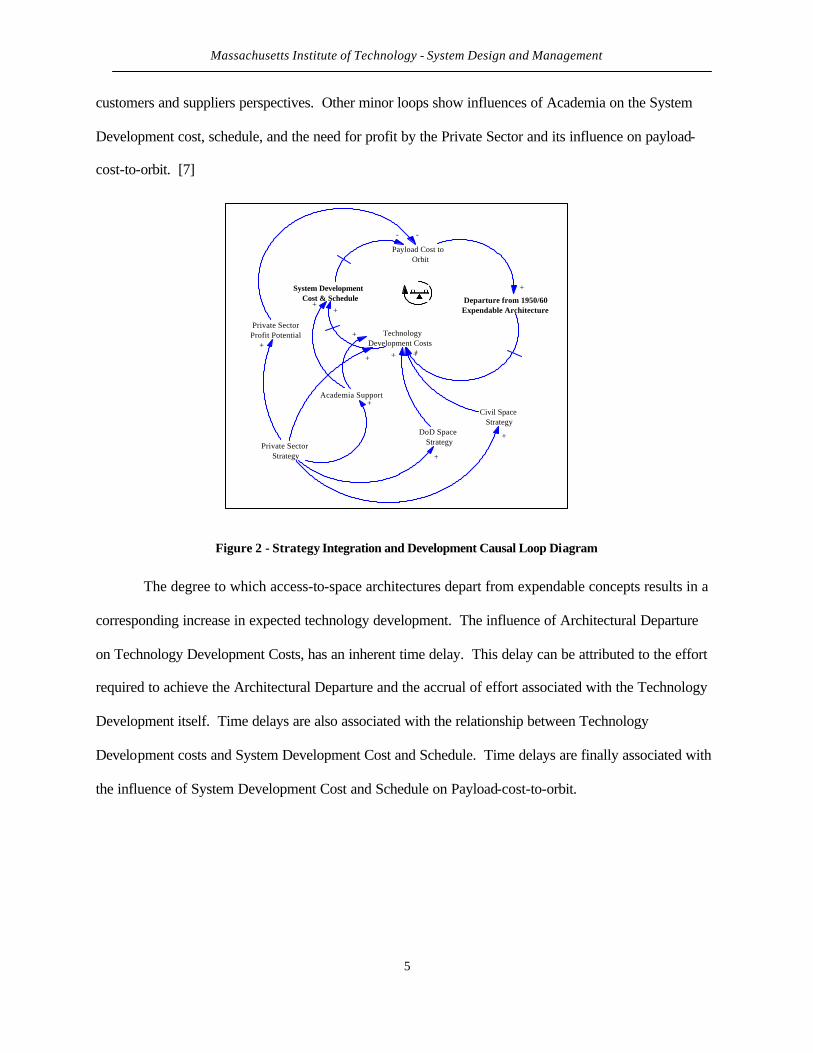
dynamics in developing complex systems for Public Sector benefit. The causal loop diagram (Figure 2)
depicts the relationships between the influencing factors, all of which contribute to the goals of
minimizing System Development Cost & Schedule, the desired goal to reduce payload-cost-to-orbit and
the technology needed to depart from the1950/1960 expendable vehicle architecture.
Figure 2 has a combination of positive reinforcing loops and negative balancing loops. These
loops are the mechanisms through which the push and pull of the influence factors are imparted on system
elements. The “+” sign at the end of a loop indicates a continuing increasing effect from one system
element to the next. A “ – ” sign indicates an inverse relationship, as one system element increases the
following decreases. The inner main loop addresses the influences of architectural change upon the cost
of technology development, of technology development costs on overall system development cost and
schedule and finally on payload-cost-to-orbit. Outer loops include the influences of strategies from the
Massachusetts Institute of Technology - System Design and Management
5
customers and suppliers perspectives. Other minor loops show influences of Academia on the System
Development cost, schedule, and the need for profit by the Private Sector and its influence on payload-
cost-to-orbit. [7]
Payload Cost toOrbit
Departure from 1950/60Expendable Architecture
TechnologyDevelopment Costs
System DevelopmentCost & Schedule
Civil SpaceStrategy
DoD SpaceStrategy
Private SectorProfit Potential
Private SectorStrategy
Academia Support
+
+
-
++ +
+
+
-
+
+
+
++
Figure 2 - Strategy Integration and Development Causal Loop Diagram
The degree to which access-to-space architectures depart from expendable concepts results in a
corresponding increase in expected technology development. The influence of Architectural Departure
on Technology Development Costs, has an inherent time delay. This delay can be attributed to the effort
required to achieve the Architectural Departure and the accrual of effort associated with the Technology
Development itself. Time delays are also associated with the relationship between Technology
Development costs and System Development Cost and Schedule. Time delays are finally associated with
the influence of System Development Cost and Schedule on Payload-cost-to-orbit.
Massachusetts Institute of Technology - System Design and Management
6
1.4. Applicable Models
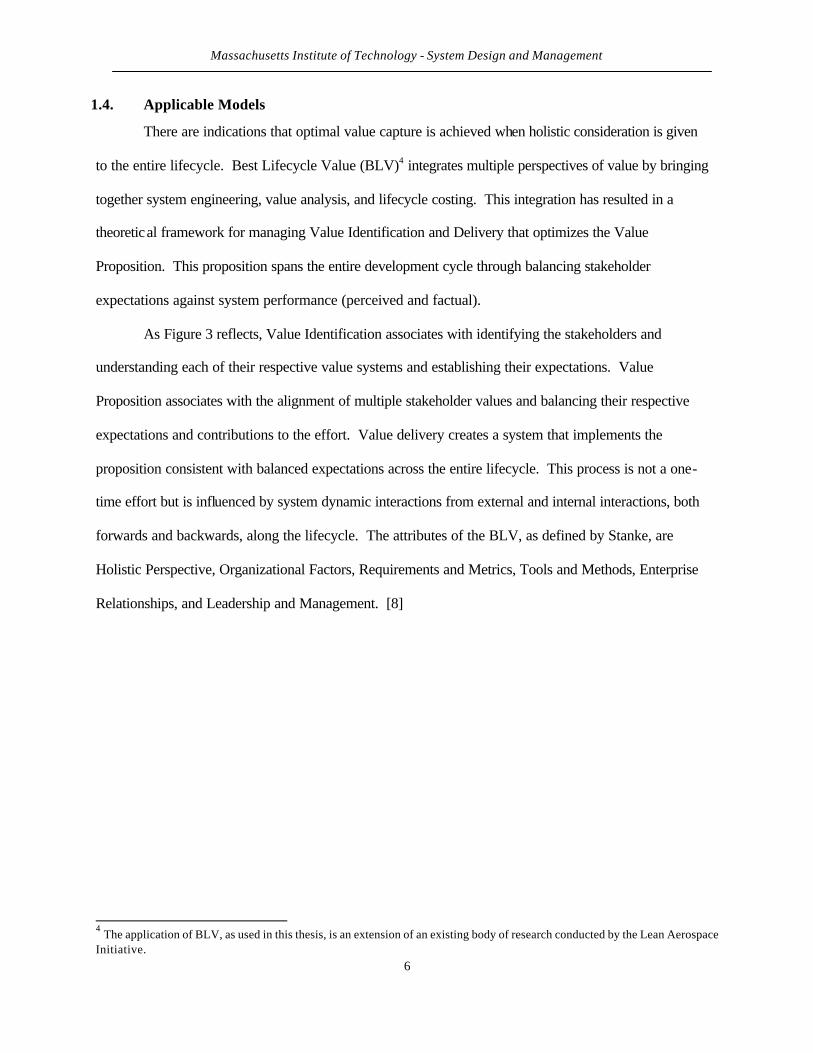
There are indications that optimal value capture is achieved when holistic consideration is given
to the entire lifecycle. Best Lifecycle Value (BLV)4 integrates multiple perspectives of value by bringing
together system engineering, value analysis, and lifecycle costing. This integration has resulted in a
theoretical framework for managing Value Identification and Delivery that optimizes the Value
Proposition. This proposition spans the entire development cycle through balancing stakeholder
expectations against system performance (perceived and factual).
As Figure 3 reflects, Value Identification associates with identifying the stakeholders and
understanding each of their respective value systems and establishing their expectations. Value
Proposition associates with the alignment of multiple stakeholder values and balancing their respective
expectations and contributions to the effort. Value delivery creates a system that implements the
proposition consistent with balanced expectations across the entire lifecycle. This process is not a one-
time effort but is influenced by system dynamic interactions from external and internal interactions, both
forwards and backwards, along the lifecycle. The attributes of the BLV, as defined by Stanke, are
Holistic Perspective, Organizational Factors, Requirements and Metrics, Tools and Methods, Enterprise
Relationships, and Leadership and Management. [8]
4 The application of BLV, as used in this thesis, is an extension of an existing body of research conducted by the Lean Aerospace Initiative.
Massachusetts Institute of Technology - System Design and Management
7
Value Proposition
Value Proposition
Value Identification
Value Identification
Value Delivery
Value Delivery
Determine common stakeholder value
perception
Develop and agree to an approach
Execute on the promise
Adaptation
Dynamic and iterative
Value Creation Framework
Figure 3 - Value Creation Framework (adopted from [8])
1.4.1. Program/Project Management
The development of complex systems is not an over night proposition. Great care and
consideration is required not only for the complex technical systems, but also for the corresponding
organizational and interpersonal issues. The P/P lifecycle is the collection of related steps that
systemically offer a means of capturing value by developing a product or process. The phases of
development will vary slightly by implementing organization. Examples of such are the versions
presented by the National Aeronautics and Space Administration (NASA) Policy Guide 7120.5A,
Program and Project Management Process and Requirements. This is also covered in the NASA System
Engineering Handbook and the DoD Project Managers Toolkit. For the purposes of this thesis,
simplification of these processes is necessary. The associated detail is typically organizational specific.
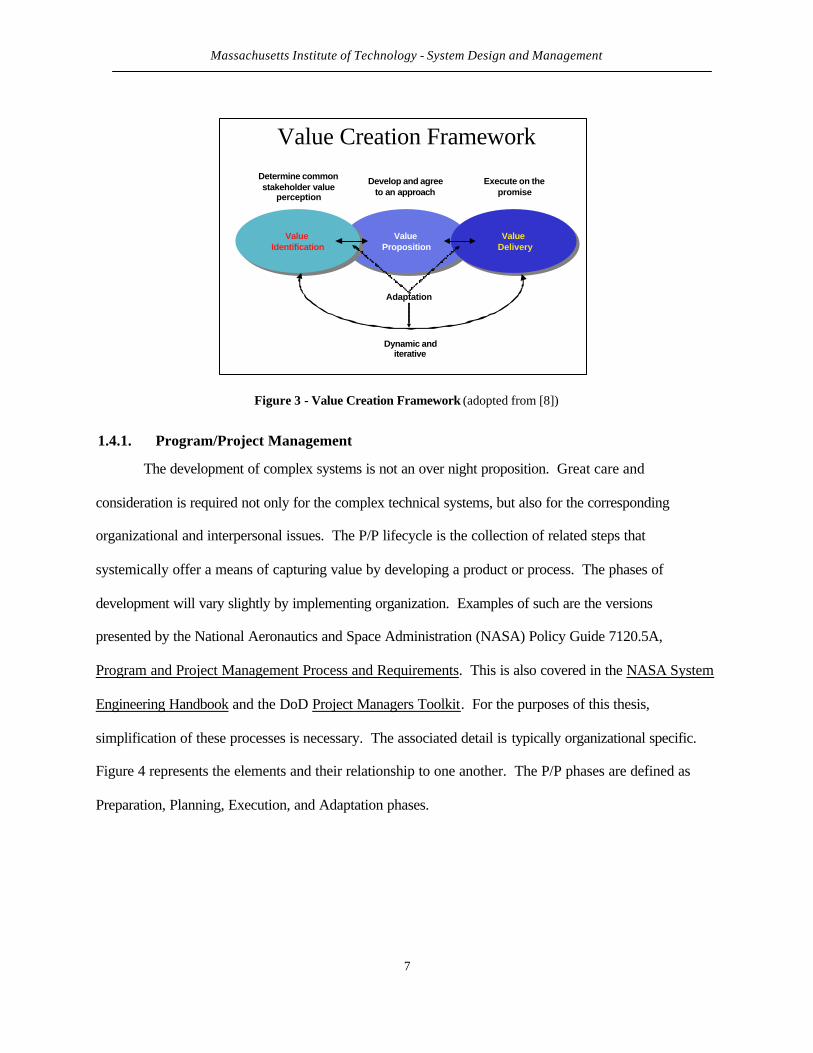
Figure 4 represents the elements and their relationship to one another. The P/P phases are defined as
Preparation, Planning, Execution, and Adaptation phases.
Massachusetts Institute of Technology - System Design and Management
8
Preparation Planning Execution
Adaptation
Figure 4 - Program/Project Deve lopment Lifecycle (adopted from [1])
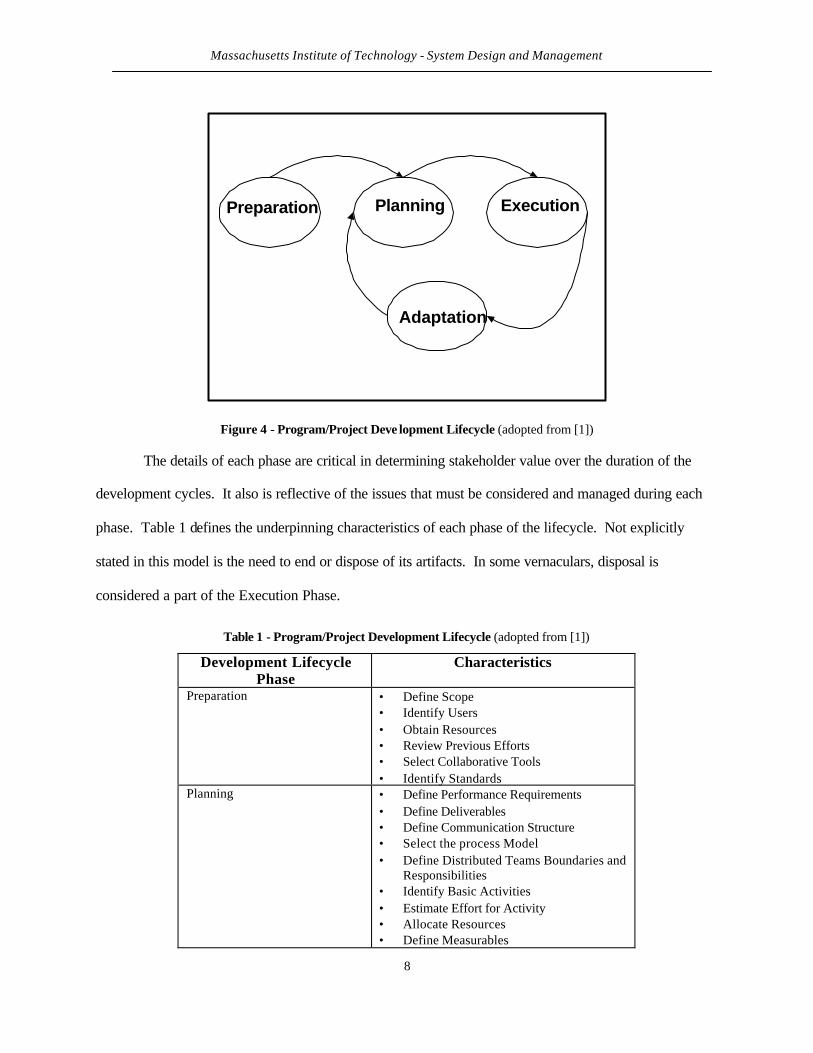
The details of each phase are critical in determining stakeholder value over the duration of the
development cycles. It also is reflective of the issues that must be considered and managed during each
phase. Table 1 defines the underpinning characteristics of each phase of the lifecycle. Not explicitly
stated in this model is the need to end or dispose of its artifacts. In some vernaculars, disposal is
considered a part of the Execution Phase.
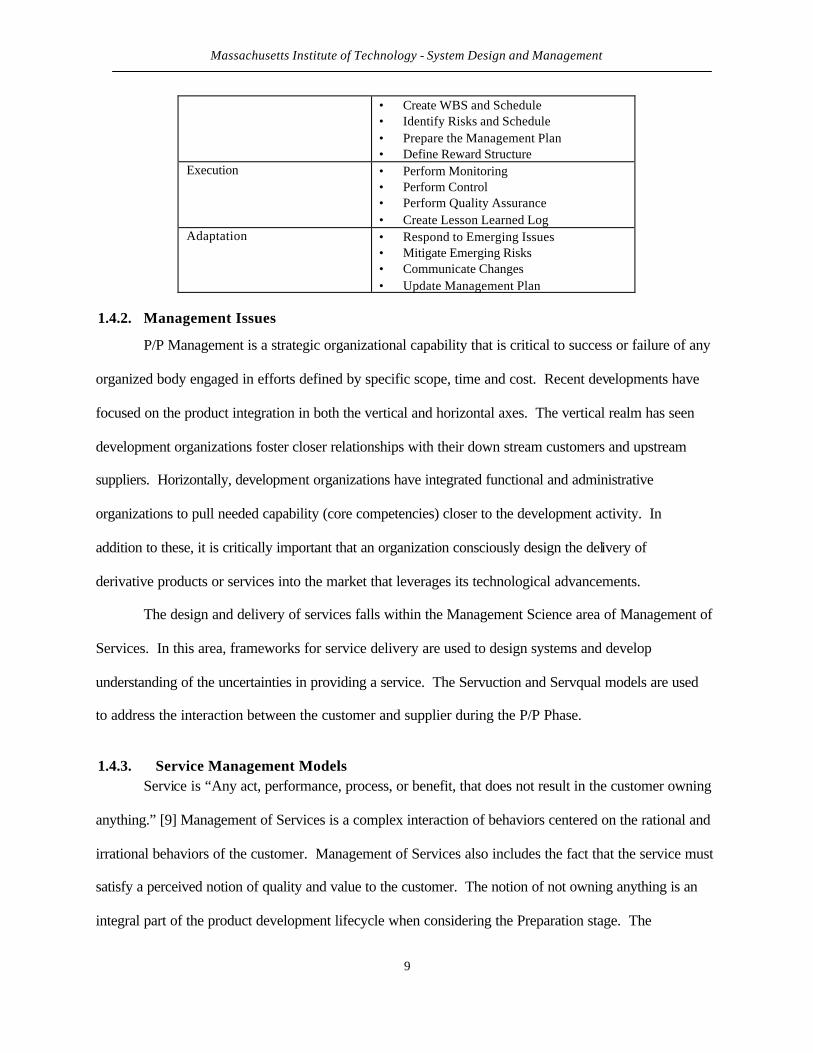
Table 1 - Program/Project Development Lifecycle (adopted from [1])
Development Lifecycle Phase
Characteristics
Preparation • Define Scope • Identify Users • Obtain Resources • Review Previous Efforts • Select Collaborative Tools • Identify Standards
Planning • Define Performance Requirements • Define Deliverables • Define Communication Structure • Select the process Model • Define Distributed Teams Boundaries and
Responsibilities • Identify Basic Activities • Estimate Effort for Activity • Allocate Resources • Define Measurables
Massachusetts Institute of Technology - System Design and Management
9
• Create WBS and Schedule • Identify Risks and Schedule • Prepare the Management Plan • Define Reward Structure
Execution • Perform Monitoring • Perform Control • Perform Quality Assurance • Create Lesson Learned Log
Adaptation • Respond to Emerging Issues • Mitigate Emerging Risks • Communicate Changes • Update Management Plan
1.4.2. Management Issues
P/P Management is a strategic organizational capability that is critical to success or failure of any
organized body engaged in efforts defined by specific scope, time and cost. Recent developments have
focused on the product integration in both the vertical and horizontal axes. The vertical realm has seen
development organizations foster closer relationships with their down stream customers and upstream
suppliers. Horizontally, development organizations have integrated functional and administrative
organizations to pull needed capability (core competencies) closer to the development activity. In
addition to these, it is critically important that an organization consciously design the delivery of
derivative products or services into the market that leverages its technological advancements.
The design and delivery of services falls within the Management Science area of Management of
Services. In this area, frameworks for service delivery are used to design systems and develop
understanding of the uncertainties in providing a service. The Servuction and Servqual models are used
to address the interaction between the customer and supplier during the P/P Phase.
1.4.3. Service Management Models Service is “Any act, performance, process, or benefit, that does not result in the customer owning
anything.” [9] Management of Services is a complex interaction of behaviors centered on the rational and
irrational behaviors of the customer. Management of Services also includes the fact that the service must
satisfy a perceived notion of quality and value to the customer. The notion of not owning anything is an
integral part of the product development lifecycle when considering the Preparation stage. The
Massachusetts Institute of Technology - System Design and Management
10
Management of Services takes on four characteristics that result in value, from the customer’s perspective
that is subjective and is the result of interpretation, judgment, and perception: Intangibility, Inseparability,
Heterogeneity/Variability, and Perishability.
Intangibility addresses the notion that the interaction between the customer and supplier results in
the customer receiving a product that is not sensible to human beings, but is an experience. Intangibility
is difficult to manage because it is significantly based on perceptions. However, throughout the
experience, efforts are made to “tangibilize” the experience such that the abstract nature is reduced.
Inseparability describes the customer/supplier interaction where perceptions of quality and value are
produced and consumed by the participants. The quality of the interaction determines the degree of
satisfaction derived by both parties. Success in executing this interaction comes as a result of experience
and investments in employee development. Heterogeneity/Variability describes how the delivery of
service, by the supplier, is unique to the individuals involved. Subsequently, the consistency and
perception of quality and value will vary with the individual. Perishabililty attempts to account for the
fact that the interaction cannot be recreated exactly. Therefore, the supplier must manage any variability
in the conditions under which the interaction takes place that is different from the previous experience. [9]
The models used in the area of Management of Services are the Servuction and Servqual Models.
The Servuction Model provides a framework for understanding the proposed service and how it will
interface with the customer. The Servqual Model provides another framework for understanding the
relationship between the customer and the supplier and how the quality of the interaction can be managed
by understanding where discontinuities might exist in expectations and perceptions.
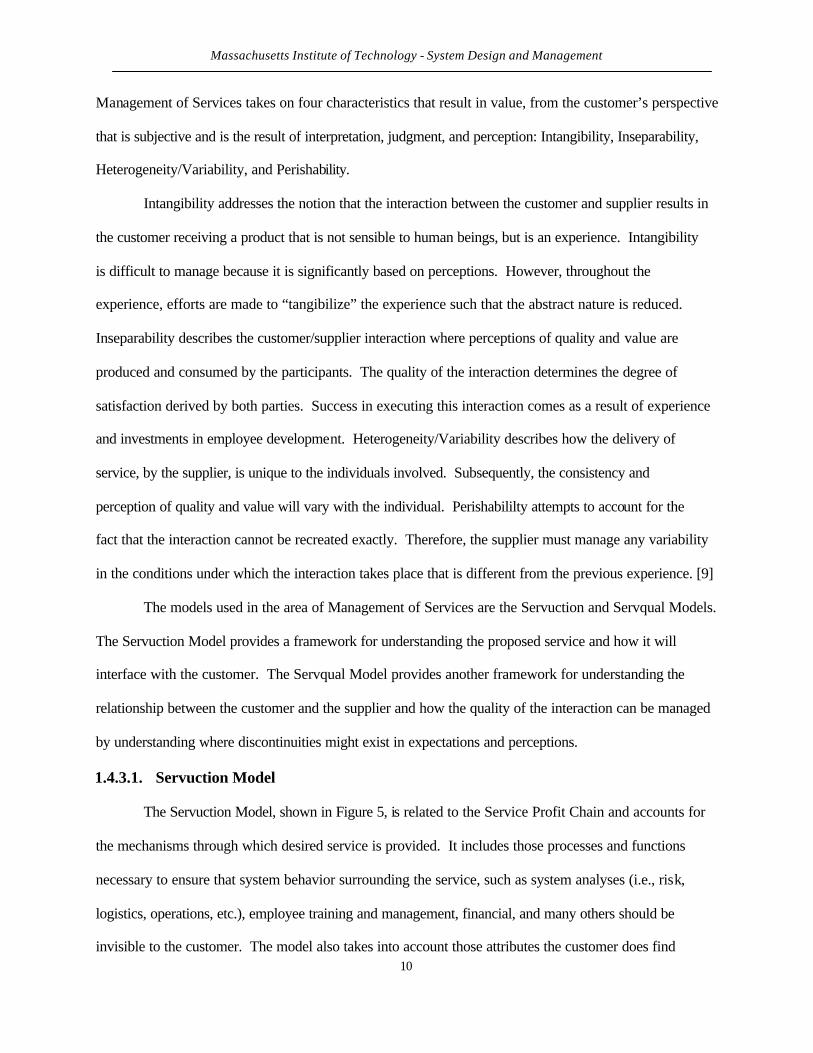
1.4.3.1. Servuction Model
The Servuction Model, shown in Figure 5, is related to the Service Profit Chain and accounts for
the mechanisms through which desired service is provided. It includes those processes and functions
necessary to ensure that system behavior surrounding the service, such as system analyses (i.e., risk,
logistics, operations, etc.), employee training and management, financial, and many others should be
invisible to the customer. The model also takes into account those attributes the customer does find
Massachusetts Institute of Technology - System Design and Management
11
valuable when conducting a transaction (e.g., knowledge of the individuals conducting transactions and
the conditions under which the transactions occur). [9]
Invisible to Customer
Back Of f ice
Organ iza t iona l
S y s t e m s
Phys i ca l
Env i ronment
Contac t
Pe r sonne l
V is ib le to Cus tomer
The Servuction Model
Figure 5 - Servuction Model (adopted from [9])
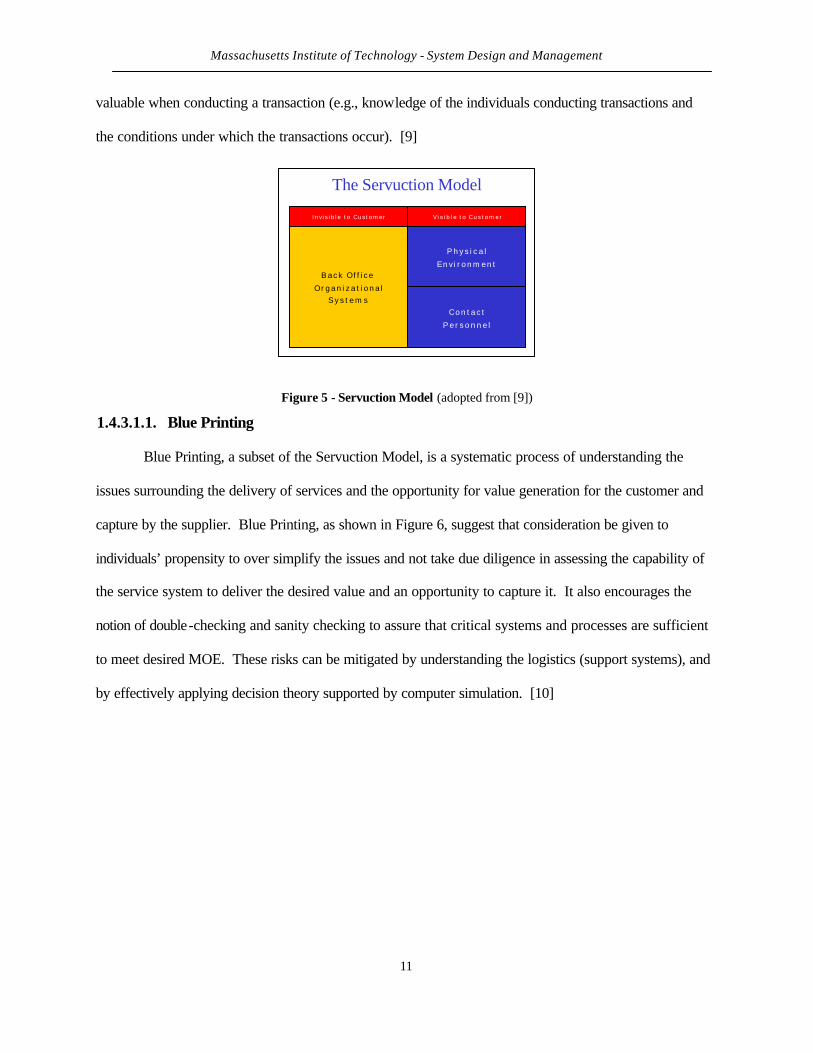
1.4.3.1.1. Blue Printing
Blue Printing, a subset of the Servuction Model, is a systematic process of understanding the
issues surrounding the delivery of services and the opportunity for value generation for the customer and
capture by the supplier. Blue Printing, as shown in Figure 6, suggest that consideration be given to
individuals’ propensity to over simplify the issues and not take due diligence in assessing the capability of
the service system to deliver the desired value and an opportunity to capture it. It also encourages the
notion of double-checking and sanity checking to assure that critical systems and processes are sufficient
to meet desired MOE. These risks can be mitigated by understanding the logistics (support systems), and
by effectively applying decision theory supported by computer simulation. [10]
Massachusetts Institute of Technology - System Design and Management
12
Ove r Simpli f icat ion
Incomple teness
Subjectivity
Interpretation
Logis t ics Dec is ion Theory C o m p u t e r S y s t e mAnalysis
Risk
R i s k M i t i g a t i o n M e c h a n i s m s
Figure 6 - Blue Printing Analysis Framework [10]
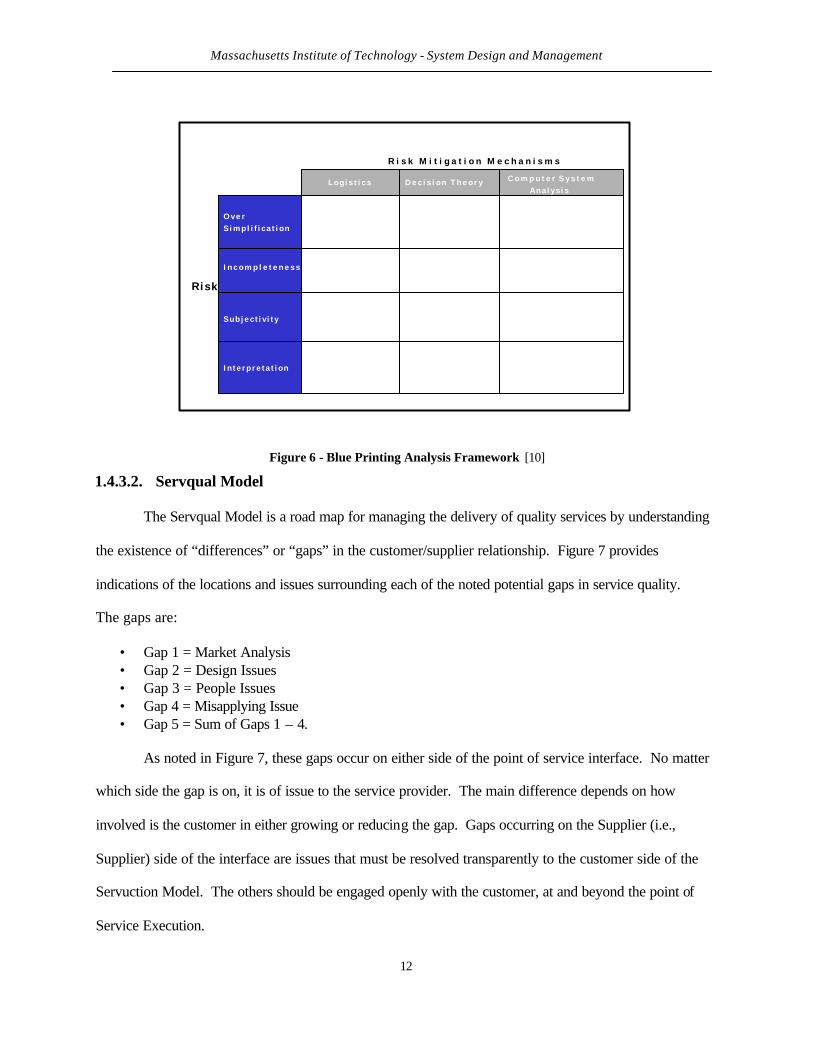
1.4.3.2. Servqual Model
The Servqual Model is a road map for managing the delivery of quality services by understanding
the existence of “differences” or “gaps” in the customer/supplier relationship. Figure 7 provides
indications of the locations and issues surrounding each of the noted potential gaps in service quality.
The gaps are:
• Gap 1 = Market Analysis • Gap 2 = Design Issues • Gap 3 = People Issues • Gap 4 = Misapplying Issue • Gap 5 = Sum of Gaps 1 – 4.
As noted in Figure 7, these gaps occur on either side of the point of service interface. No matter
which side the gap is on, it is of issue to the service provider. The main difference depends on how
involved is the customer in either growing or reducing the gap. Gaps occurring on the Supplier (i.e.,
Supplier) side of the interface are issues that must be resolved transparently to the customer side of the
Servuction Model. The others should be engaged openly with the customer, at and beyond the point of
Service Execution.
Massachusetts Institute of Technology - System Design and Management
13
Gaps of importance are those where the discontinuity crosses to the visible from the invisible
regions. Figure 7 depicts this as Gap 1 and reflects differences in the perceived quality of the service
provided, and the quality and value of the service received as determined by the customer. [11]
Word of MouthCommunicationsWord of Mouth
Communications Personal NeedsPersonal Needs Past ExperiencePast Experience
Expected ServiceExpected Service
Perceived ServicePerceived Service
GAP 5
Customer
Provider ExternalCommunications
to Customers
ExternalCommunications
to Customers
Service DeliveryService Delivery
Service QualitySpecifications
Service QualitySpecifications
ManagementPerceptions of
Customer Expectations
ManagementPerceptions of
Customer Expectations
GAP 1
GAP 3
GAP 2
GAP 4
The Servqual Model
Figure 7 - Servqual Model (adopted from [11])
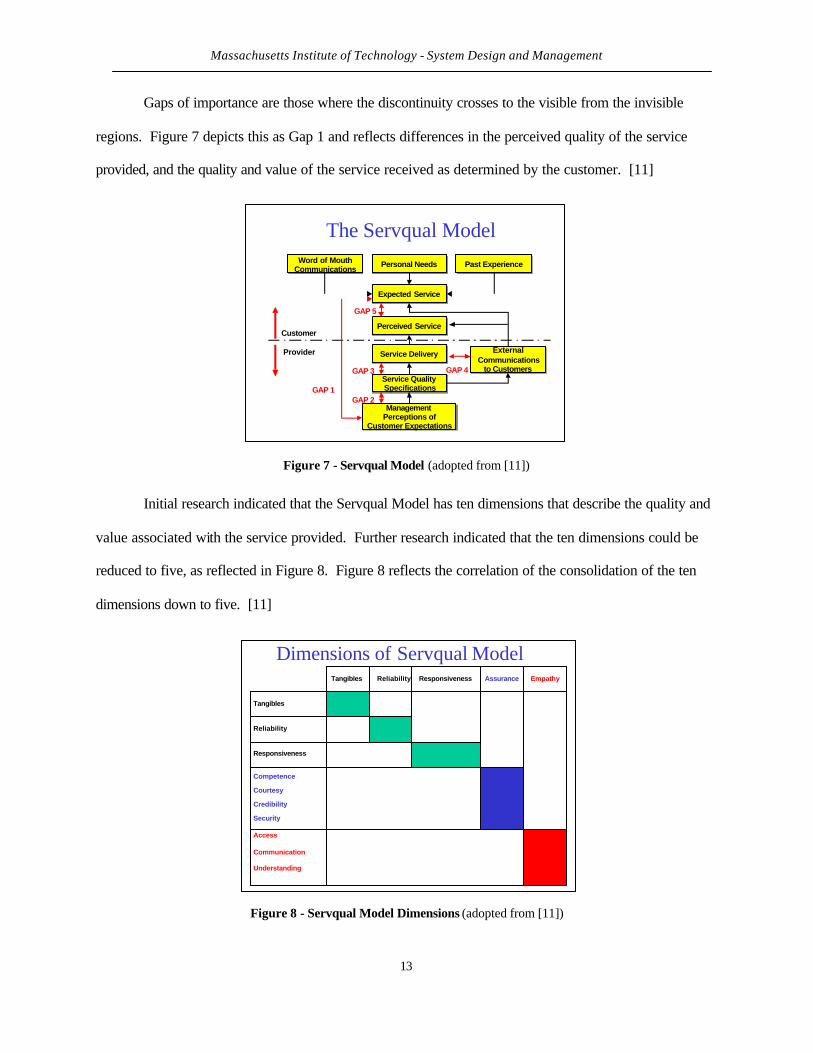
Initial research indicated that the Servqual Model has ten dimensions that describe the quality and
value associated with the service provided. Further research indicated that the ten dimensions could be
reduced to five, as reflected in Figure 8. Figure 8 reflects the correlation of the consolidation of the ten
dimensions down to five. [11]
Tangibles
Tangibles
Reliability Responsiveness
Responsiveness
Reliability
Competence
Courtesy
Credibility
Security
Assurance Empathy
Access
Communication
Understanding
Dimensions of Servqual Model
Figure 8 - Servqual Model Dimensions (adopted from [11])
Massachusetts Institute of Technology - System Design and Management
14
1.4.3.3. Customer Value
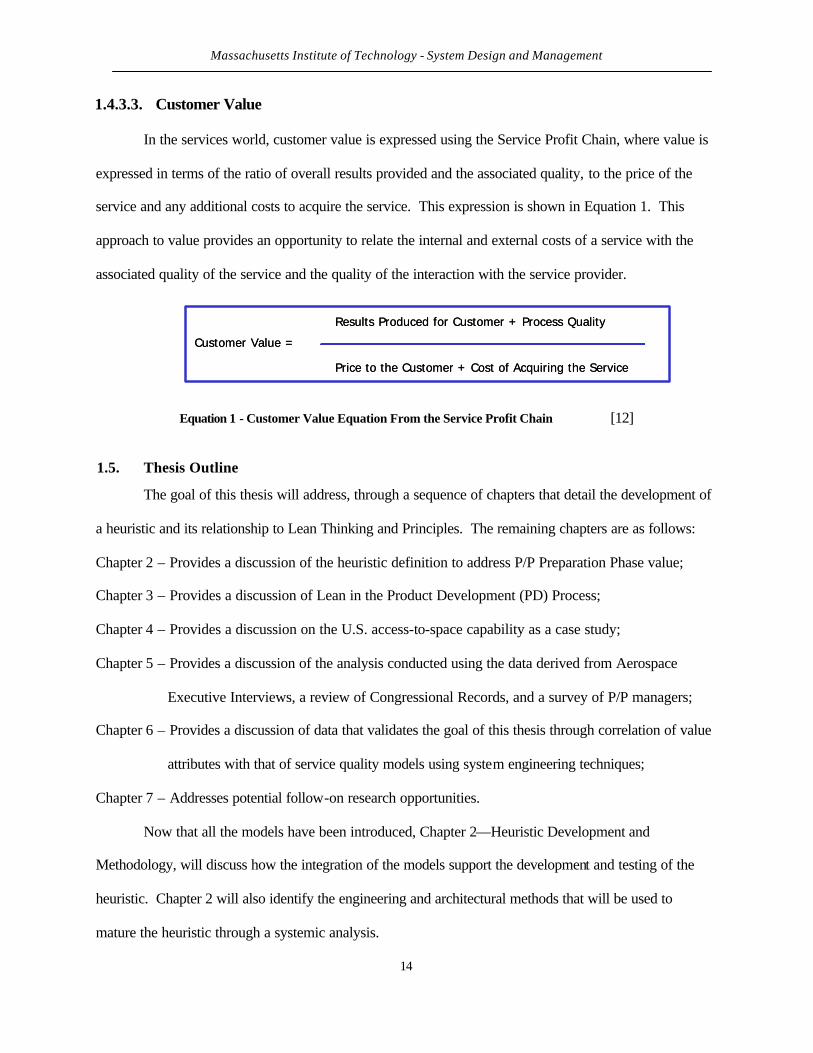
In the services world, customer value is expressed using the Service Profit Chain, where value is
expressed in terms of the ratio of overall results provided and the associated quality, to the price of the
service and any additional costs to acquire the service. This expression is shown in Equation 1. This
approach to value provides an opportunity to relate the internal and external costs of a service with the
associated quality of the service and the quality of the interaction with the service provider.
Equation 1 - Customer Value Equation From the Service Profit Chain [12]
1.5. Thesis Outline
The goal of this thesis will address, through a sequence of chapters that detail the development of
a heuristic and its relationship to Lean Thinking and Principles. The remaining chapters are as follows:
Chapter 2 – Provides a discussion of the heuristic definition to address P/P Preparation Phase value;
Chapter 3 – Provides a discussion of Lean in the Product Development (PD) Process;
Chapter 4 – Provides a discussion on the U.S. access-to-space capability as a case study;
Chapter 5 – Provides a discussion of the analysis conducted using the data derived from Aerospace
Executive Interviews, a review of Congressional Records, and a survey of P/P managers;
Chapter 6 – Provides a discussion of data that validates the goal of this thesis through correlation of value
attributes with that of service quality models using system engineering techniques;
Chapter 7 – Addresses potential follow-on research opportunities.
Now that all the models have been introduced, Chapter 2—Heuristic Development and
Methodology, will discuss how the integration of the models support the development and testing of the
heuristic. Chapter 2 will also identify the engineering and architectural methods that will be used to
mature the heuristic through a systemic analysis.
Customer Value =
Results Produced for Customer + Process Quality
Price to the Customer + Cost of Acquiring the Service
Customer Value =
Results Produced for Customer + Process Quality
Price to the Customer + Cost of Acquiring the Service

Massachusetts Institute of Technology - System Design and Management
15

Massachusetts Institute of Technology - System Design and Management
16
Chapter 2 – Heuristic Development and Methodology
This chapter will develop the concept that the interaction between customer and supplier, during
the P/P Preparation Phase of the lifecycle, more closely resembles that associated with the management of
services. The concept is further developed to include the notion that the Best Life Cycle Value (BLV)
framework for value can represent value, in Lean Thinking and Principles terms, for this phase. The
integration comes as a result of the application of the Service Management Models in bridging the “gap”
between the BLV value framework and the P/P lifecycle.
2.1. Lean Thinking and Principles
Lean Thinking and Principles provide a guide for the constant pursuit of value for the customer.
Lean has its origin in the Toyota Production Process and was brought to the U.S. via a study of the U.S.
automotive industry that culminated in a book call the Machine that Changed the World. [13] Womack
and Jones congealed the concepts and principles from this book into a book called Lean Thinking. [14]
From this book and practice, Lean organizations work to “precisely define value in terms of specific
products with specific capabilities offered at specific prices through a dialogue with specific customers.”
[15] The all-encompassing effort of Lean practitioners is to understand the customer’s needs and to
optimize a system that provides for those needs in a way that the customer perceives value to exist. Thus,
five principles summarize Lean Thinking and Principles:
• Precisely Specify Value • Identify the Value Stream • Make Value Flow • Let the Customer Pull Value • Pursue Perfection.
Considering global competitiveness, a dynamic environment exist where it is imperative that an
organization maintain a clear understanding of how it creates value and what opportunities exist that
allow it to capture that value. [14]
Massachusetts Institute of Technology - System Design and Management
17
2.2. Heuristic Development
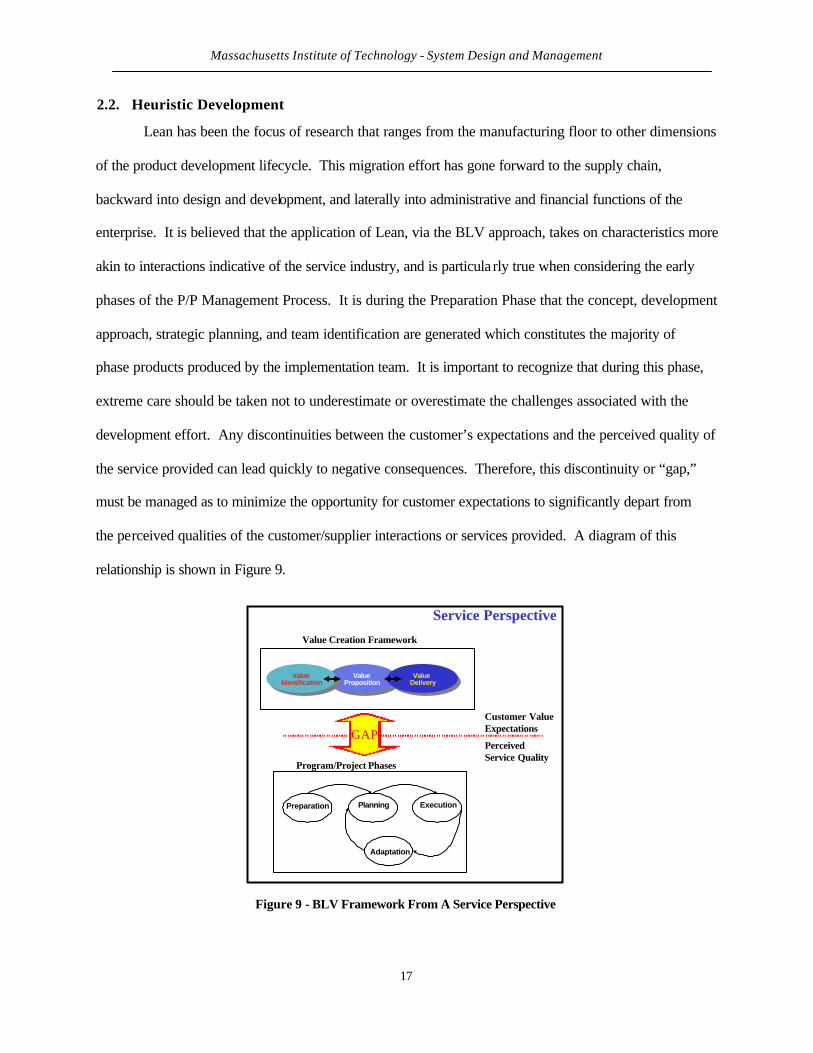
Lean has been the focus of research that ranges from the manufacturing floor to other dimensions
of the product development lifecycle. This migration effort has gone forward to the supply chain,
backward into design and development, and laterally into administrative and financial functions of the
enterprise. It is believed that the application of Lean, via the BLV approach, takes on characteristics more
akin to interactions indicative of the service industry, and is particula rly true when considering the early
phases of the P/P Management Process. It is during the Preparation Phase that the concept, development
approach, strategic planning, and team identification are generated which constitutes the majority of
phase products produced by the implementation team. It is important to recognize that during this phase,
extreme care should be taken not to underestimate or overestimate the challenges associated with the
development effort. Any discontinuities between the customer’s expectations and the perceived quality of
the service provided can lead quickly to negative consequences. Therefore, this discontinuity or “gap,”
must be managed as to minimize the opportunity for customer expectations to significantly depart from
the perceived qualities of the customer/supplier interactions or services provided. A diagram of this
relationship is shown in Figure 9.
Value Proposition
Value Proposition
Value Identification
Value Identification
Value Delivery
Value Delivery
Value Creation Framework
Preparation Planning Execution
Adaptation
Program/Project Phases
GAP
Service Perspective
Customer ValueExpectations
PerceivedService Quality
Figure 9 - BLV Framework From A Service Perspective
Massachusetts Institute of Technology - System Design and Management
18
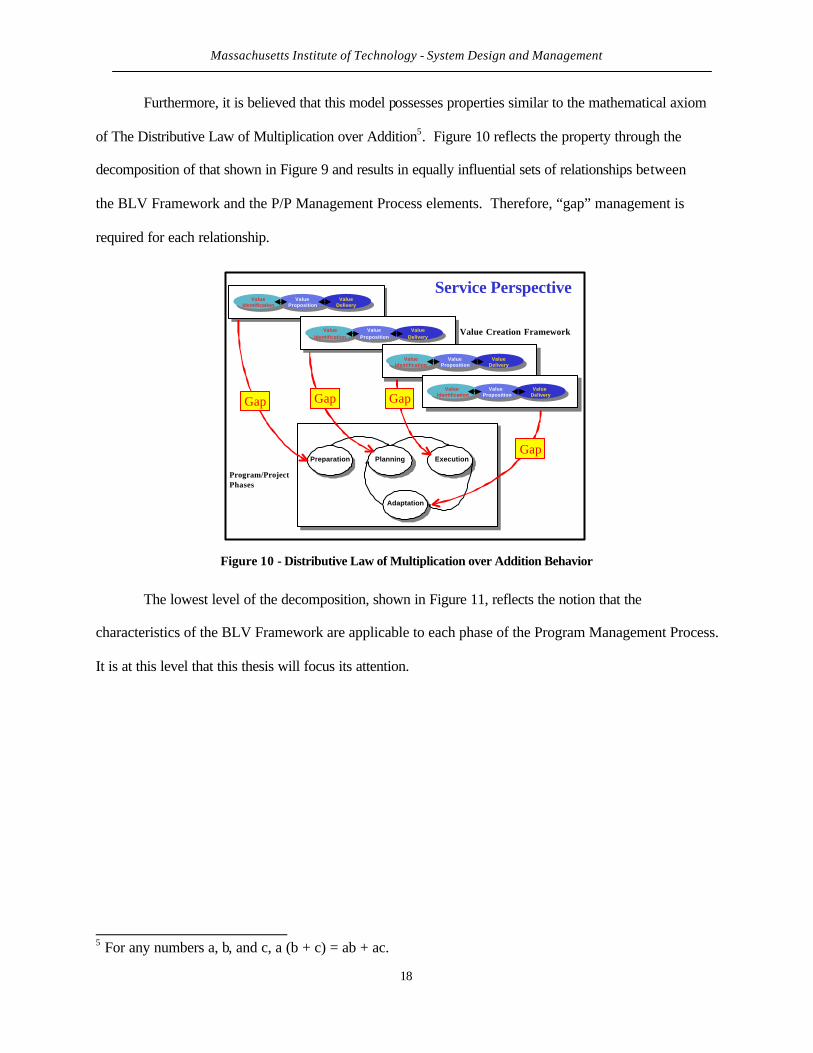
Furthermore, it is believed that this model possesses properties similar to the mathematical axiom
of The Distributive Law of Multiplication over Addition5. Figure 10 reflects the property through the
decomposition of that shown in Figure 9 and results in equally influential sets of relationships between
the BLV Framework and the P/P Management Process elements. Therefore, “gap” management is
required for each relationship.
Preparation Planning Execution
Adaptation
Program/Project Phases
Service Perspective
Value Creation Framework
Value Proposition
Value Proposition
Value Identification
Value Identification
Value Delivery
Value Delivery
Value
Proposition
Value
PropositionValue
Identification
Value
IdentificationValue
Delivery
Value
Delivery
Value Proposition
Value Proposition
Value Identification
Value Identification
Value Delivery
Value Delivery
Value Proposition
Value Proposition
Value Identification
Value Identification
Value Delivery
Value Delivery
Gap Gap Gap
Gap
Figure 10 - Distributive Law of Multiplication over Addition Behavior
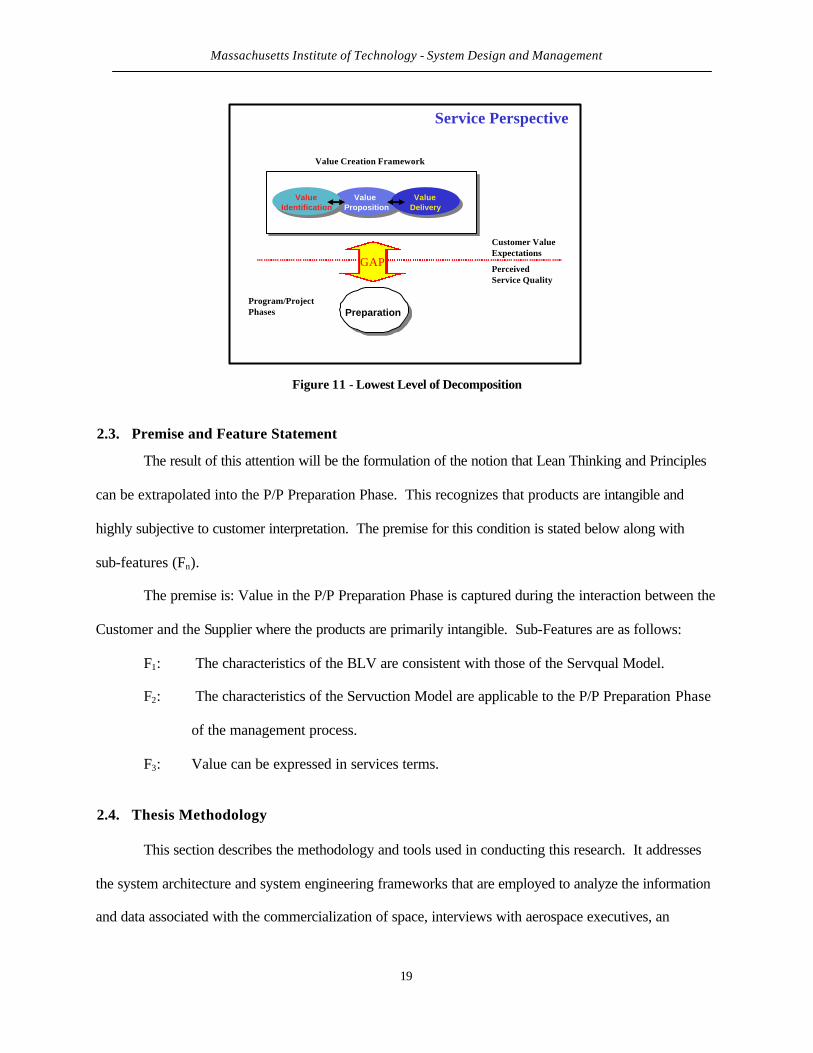
The lowest level of the decomposition, shown in Figure 11, reflects the notion that the
characteristics of the BLV Framework are applicable to each phase of the Program Management Process.
It is at this level that this thesis will focus its attention.
5 For any numbers a, b, and c, a (b + c) = ab + ac.
Massachusetts Institute of Technology - System Design and Management
19
Service Perspective
Customer ValueExpectations
PerceivedService Quality
Value Proposition
Value Proposition
Value Identification
Value Identification
Value Delivery
Value Delivery
Preparation
GAP
Program/Project Phases
Value Creation Framework
Figure 11 - Lowest Level of Decomposition
2.3. Premise and Feature Statement
The result of this attention will be the formulation of the notion that Lean Thinking and Principles
can be extrapolated into the P/P Preparation Phase. This recognizes that products are intangible and
highly subjective to customer interpretation. The premise for this condition is stated below along with
sub-features (Fn).
The premise is: Value in the P/P Preparation Phase is captured during the interaction between the
Customer and the Supplier where the products are primarily intangible. Sub-Features are as follows:
F1: The characteristics of the BLV are consistent with those of the Servqual Model.
F2: The characteristics of the Servuction Model are applicable to the P/P Preparation Phase
of the management process.
F3: Value can be expressed in services terms.
2.4. Thesis Methodology
This section describes the methodology and tools used in conducting this research. It addresses
the system architecture and system engineering frameworks that are employed to analyze the information
and data associated with the commercialization of space, interviews with aerospace executives, an
Massachusetts Institute of Technology - System Design and Management
20
industry survey and a review of congressional records. Architecting complex systems can be achieved by
using a collection of methods and approaches. They are the Normative (Pronouncement) Method, the
Rational (Procedural) Method, the Argumentative Approach, and the Heuristic Development Approach.
[16] Development of this proposed framework, for understanding value in the P/P Preparation Phase,
requires systemic rigor and analysis to demonstrate appropriateness and completeness. The systemic
rigor includes the context and judgments of a principle, along with a process, and supporting tools.
2.4.1. Architectural Approach
Architecting systems is a complex effort that requires different approaches for a given situation.
Scholars tend to categorize them as listed above. This thesis uses the Heuristic Approach to define the
appropriate context and judgments to be applied. Then system architecture and system engineering
processes and tool frameworks are used to perform the analysis. Heuristics usually result from
experience, insight, lessons learned and are commonly categorized as rules of thumb. They differ from
scientific law in that they are qualitative in nature and are more difficult to replicate. The key being that
the opposite of a heuristic will not make sense or will lead to failure.
The vantage points of using a heuristic can be shown in a few broad categories. Definitions (or
scenarios) of these vantage points are shown below:
Theoretical: Specified problem-structuring devices, ranging from decision rules to a variety of
analogies, analogs, and models used to guide the search for solutions.
General Pragmatists: Widely accepted qualitative statements that, as judged from examples, add
structure to ill-defined situations.
Managers: Commonly accepted insights, gained from experience that brings order out of
apparent chaos.
Engineers: Statements of common, or contextual sense, that aid in concept development,
problem solving, decision making, or judgments. [16]
Massachusetts Institute of Technology - System Design and Management
21
In this case, the Engineers vantage point is used to apply heuristics to the interface between the
customer and the supplier of services during the P/P phase. The Engineers vantage is used because it
provides a context for the application of data and tools and generates a condition conducive to problem
solving. In the case of this thesis, the context is cancelled access-to-space systems. The problem exists in
understanding the cause of the cancellations during the early stages of the lifecycles. To apply this
heuristic, a principle and process must be selected. The remaining portion of this Chapter addresses these
issues.
2.4.1.1. Principles
A variety of principles that address the activities of early product development were considered
that take the perspective that Value occurs at the interface. Rechtin defines the Principle selected for this
thesis in his text, Systems Architecting, Creating, and Building Complex Systems. It states
“Relationships among the elements are what give systems their added value.” [16]
2.4.1.2. Process
The process employed is a systematic manner of applying the principle to a given situation in
order to analyze it. In other words, the process is an organized approach to applying a set of tools in
search of a solution that satisfies a certain set of goals. The process analysis also includes recognizing
that the customer/supplier roles will evolve and change as the perspective on value changes. It is also
important to note that a market analysis should be integral to understanding the commercialization
decisions. The data to support this analysis process would include demonstrated needs derived from
Congressional Records, interviews with aerospace industry executives in the Public and Private Sectors,
survey information from experienced product development persons and a case study of failed space
launch systems.
Massachusetts Institute of Technology - System Design and Management
22
2.4.1.3. Tools
Tools are frameworks, approaches, analytical methods, and techniques that support the inferential
extraction of information and its conversion to knowledge. The tools utilized for this thesis are
categorized as Architectural, System Engineering, Strategic, and Mathematical. They are as follows:
(1) Technology Strategy and Managing Innovation - is a set of frameworks for understanding the
implications of R&D Investments and product development approaches;
(2) Architectural Influence Mapping – is a framework for understanding the influences on architectural
decisions;
(3) Quality Function Deployment (QFD) – is a methodology to relate goals parameters or attributes to a
product or process implementation “How”;
(4) Affinity Diagramming – a methodology for structuring random relevant pieces of information that
facilitate hierarchical ranking and supports development of a QFD;
(5) Strategic Forces – Technology and competitive strategies are applied to segment the issues
surrounding technology and market decisions; and
(6) Descriptive Statistics – Mathematical techniques to describe system behavior.
Now that the heuristic, context for analysis, and the tools are identified, the next step investigates
where value resides in the PD process and determines its attributes. The Lean Aerospace Initiative (LAI)
at the Massachusetts Institute of Technology (a consortium of Public and Private Sector organizations
who are advancing the body of knowledge on Lean Principles and Thinking) have identified several
models of value in the PD process. These will be discussed in Chapter 3.
Massachusetts Institute of Technology - System Design and Management
23
Chapter 3 – Lean in Product Development
This chapter addresses the background information used to support development of the heuristic
and its associated features. Lean Principles and Thinking are addressed along with information from the
field of study associa ted with the Management of Services and frameworks for the strategic and
competitive assessment of new products and market conditions.
3.2. Lean Application in the Product Development Process
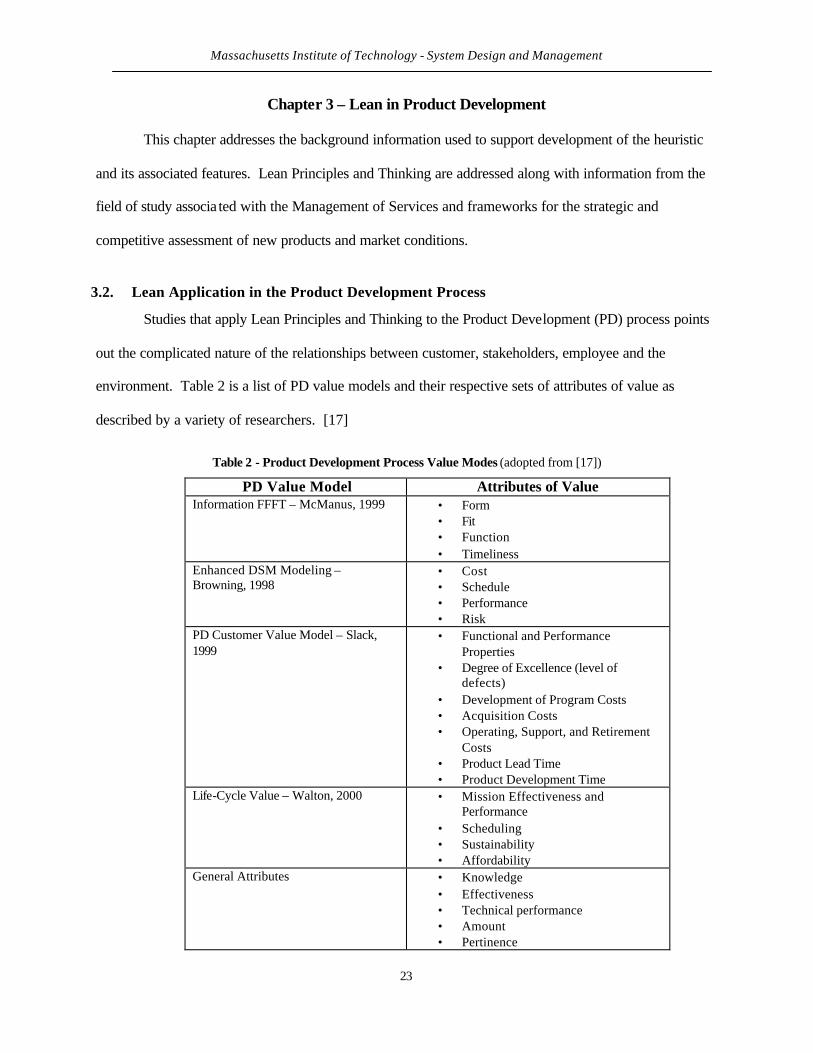
Studies that apply Lean Principles and Thinking to the Product Development (PD) process points
out the complicated nature of the relationships between customer, stakeholders, employee and the
environment. Table 2 is a list of PD value models and their respective sets of attributes of value as
described by a variety of researchers. [17]
Table 2 - Product Development Process Value Modes (adopted from [17])
PD Value Model Attributes of Value Information FFFT – McManus, 1999 • Form
• Fit • Function • Timeliness
Enhanced DSM Modeling – Browning, 1998
• Cost • Schedule • Performance • Risk
PD Customer Value Model – Slack, 1999
• Functional and Performance Properties
• Degree of Excellence (level of defects)
• Development of Program Costs • Acquisition Costs • Operating, Support, and Retirement
Costs • Product Lead Time • Product Development Time
Life-Cycle Value – Walton, 2000 • Mission Effectiveness and Performance
• Scheduling • Sustainability • Affordability
General Attributes • Knowledge • Effectiveness • Technical performance • Amount • Pertinence
Massachusetts Institute of Technology - System Design and Management
24
• Price • Life-cycle Cost • Delivery Timing • Reliability • Accessibility • Maintainability • Suitability • Functionality • Manufacturability • Operability
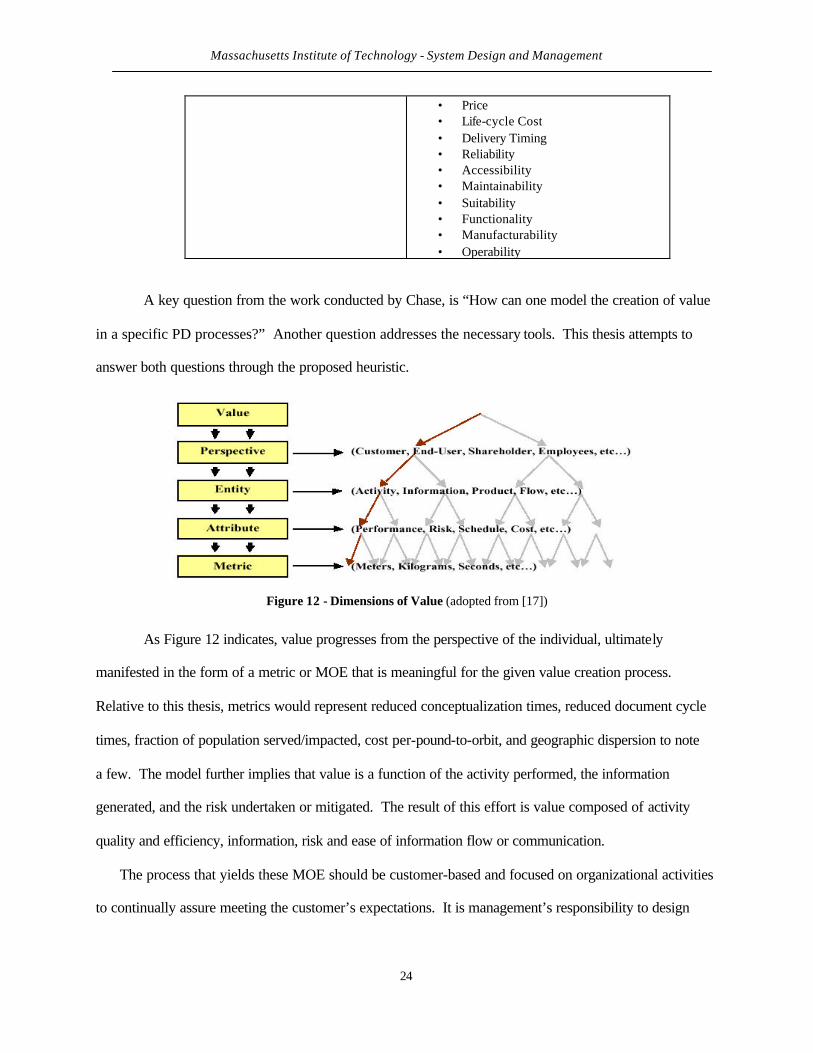
A key question from the work conducted by Chase, is “How can one model the creation of value
in a specific PD processes?” Another question addresses the necessary tools. This thesis attempts to
answer both questions through the proposed heuristic.
Figure 12 - Dimensions of Value (adopted from [17])
As Figure 12 indicates, value progresses from the perspective of the individual, ultimately
manifested in the form of a metric or MOE that is meaningful for the given value creation process.
Relative to this thesis, metrics would represent reduced conceptualization times, reduced document cycle
times, fraction of population served/impacted, cost per-pound-to-orbit, and geographic dispersion to note
a few. The model further implies that value is a function of the activity performed, the information
generated, and the risk undertaken or mitigated. The result of this effort is value composed of activity
quality and efficiency, information, risk and ease of information flow or communication.
The process that yields these MOE should be customer-based and focused on organizational activities
to continually assure meeting the customer’s expectations. It is management’s responsibility to design
Massachusetts Institute of Technology - System Design and Management
25
and implement internal operations that enable the satisfaction of customer expectations. They should be
monitored relative to overall cycle time, quality, product, and cost. [18]
3.2.1. Value and Multiple Stakeholders
Customer value is the core of Lean Thinking and Management of Services. They both consider
the perspective of the customer (Public and Private Sectors as well as the General Public) and use criteria
and models to bound their application. The P/P Preparation Phase integrates value and the issues of
multiple stakeholders with other goals and objectives, while maintaining value for all parties.
3.2.1.1. Value
“Value measures the worth of a product or service to a customer. It is a function of the product’s
usefulness to the customer, its relative importance to the customer’s need, its availability relative to when
it is needed, and how much the customer has to pay for it.” [19] When considering the entire lifecycle,
Stanke and LAI have similar definitions. The LAI definition is “A product introduced at the right time
and for the right price which delivers best value in mission effectiveness, performance, affordability, and
sustainability, and comparatively retains these advantages over the useful life of the product.” [20] While
considerably complete definitions, Stanke takes it a step further and specifies it in terms of “Balanced
stakeholder expectations…and associated risks to deliver best value through the lifecycle…” [8]
3.2.1.2. Multiple Stakeholders
Complex system development will have multiple persons or organizations (stakeholders) with an
interest in the successful completion of the PD process. However, stakeholder priorities will not be
consistent, and thus, will result in tensions vying for compliance. It is during the P/P Preparation Phase
that these tensions are sorted and prioritized relative to the objective(s) of the PD lifecycle. From a
stakeholders’ perspective, a Lean P/P ultimately results in satisfied customers and stakeholders along the
entire Lifecycle and the accomplishment of strategic outcomes. [20]

Massachusetts Institute of Technology - System Design and Management
26
3.2.2. Product Goal Setting
Goal and objective setting is critical to successfully completing the preparation stage of the
lifecycle. Goals and objectives help solidify the expectations of the customer and the recognition of
obligatory responsibilities on the part of the supplier. Goals and objective agreement is the basis from
which technical and management measures are derived. The goodness of a goal is demonstrated via four
characteristics: Completeness, Consistency, Representative and Humanly Solvable and Attainable.
Completeness addresses the degree to which the goal captures and allows responses to the upstream and
downstream influencing factors. Consistency addresses the degree to which the goal encompasses the
strategies and compelling need for the effort. The degree to which the goal is representative of the
situation is defined in terms of how well it captures the desired strategies, needs, competition, and
governing regulations. Humanly solvable addresses how clear and concise, solution neutral and well
aligned the goal is with the problem solving strategies. The goal also is reflective of the systems of
systems concept and its upstream and downstream influences, which can be decomposed to address those
that are enterprise-oriented and those that are related to implementation. [21]
Effective goals also include an association between metrics and desired value, resulting from
obtaining the goal. The value portion is increased as the level of quantification is increased. This
provides clarification of intent and assurance of understanding, which leads to successful implementation.
Value can also be expressed in many forms such as continuous, discrete/logical, and qualitative. In
parallel, metrics must be decomposable to the lowest level possible, and subsequently expressed as a
single characteristic to focus upon.
3.2.3. Measures of Effectiveness
Measures of Effectiveness, used interchangeably with the term metrics, is the means by which
Programs/Projects quality and value are measured. Commercially, Programs/Projects are measured in
terms of benefit to the customer and benefit to the developing organization. These are manifested through
measures such as return on investment, return on equity, reduced price, increased quality, network
Massachusetts Institute of Technology - System Design and Management
27
externalities, and appropriability. When considering Public P/Ps, additional measures address national
issues such as wealth distribution, security, people served, and quality of life improvement. The “ideal”
MOE would be traceable to an over arching goal and be decomposable such that the product delivery
process and design results are also decomposable into appropriate and meaningful MOE.
In the typical P/P management process, MOE’s are heavily dependent on data, and in some cases,
highly subjective in interpretation. An example would be the measure of Earned Value. Earned Value
develops a historical picture of P/P performance relative to actual and budgeted schedule and cost. This
measure is a standard and works quite well when sufficient resources have been consumed. However, in
the case of the Preparation Phase, little or no resources have been expended and it is difficult to infer
meaning from the application of such an MOE. When considering risk and technology readiness, MOE
are again highly dependent on data and are highly subjective in terms of development and interpretation.
Now that the background information, which defines the heuristic, premise and features,
applicable models and context for analysis, have been presented, they will be applied to a case study of
the access-to-space market. Chapter 4 addresses key elements surrounding the market and competitive
conditions. This case study will look at the strategies employed, technology development, and
competitiveness to highlight opportunities for value capture and bring it to bear on the heuristic of this
thesis.

Massachusetts Institute of Technology - System Design and Management
28
Chapter 4 - Access-to-space Case Study
To understand the architecture of complex systems, like launch vehicles, it is necessary to
understand the components and their influences on the process that extrudes the final product’s form, fit,
and function. These are shown in Figure 13. These components and influences are the foci of fields of
study on their own and add complexities to the product development process that are manifested in terms
of innovation processes, the social, political and technical issues and the technology and strategies sought
and employed. The following sections provide a basis for understanding these concepts. [21]
Map Goals to Upstream Influences
üüüü
üüüüüü
üü
üüüü üü
üüüüüüüüüü
üüüü
üüüü
üü
Functional
Aesthetic/Spiritual
Quality
Interfaces
Development Schedule
Development Resources
Development Risk
Strategic
Financial Return
Ne
ed
s o
f
Be
ne
fic
iary
Re
gu
lati
on
s
Co
rpo
rate
Str
ate
gy
Co
mp
eti
tio
n/
Ma
rke
t S
tra
teg
y
Housing Development of Quality
Figure 13 - Goal Mapping to Upstream Product Influences (adopted from [21])
4.1. Needs of Beneficiary & Regulations – Social/Political/Technical Issues
Acquisition Reform within the Federal Government has led to further complication of the
customer/supplier relationship within the Public and Private Sectors. The cost of implementing complex
systems using Government specifications has been costly and has succumb to pressure and given way to
increased use of Commercial Procurement Practices (CPP). Also, the Government has taken the view
that those participating in the acquisition process are customers as well, and that the cost of participation
should be the lowest possible. Anderson in the thesis, A Study of the Federal Government’s Experiences
with Commercial Procurement Practices in Major Defense Acquisitions, highlighted these commercial
Massachusetts Institute of Technology - System Design and Management
29
practices as options and compared their effectiveness in meeting the intention of the Acquisition Reform
Act. [22] The basis of the study was twenty-three DoD programs and their use of the CPP options shown
below.
• Commercial Specifications & Standards • Performance Specifications • Streamlined Contract Administration • Government/Contractor Cooperation & Relationship • Commercial-off-the-shelf/Non-Developmental Item • Commercial Warranty • Best Value • Past Performance
4.2. Stakeholder Implications
The development of complex systems for the greater good of the public is the more complicated
of the customer/supplier relationship combinations. This relationship is complicated by the fact that the
end user is not an integral part of the process. As one of the interviewees stated, [it is] “…the battle of
stakeholders that never gets sorted out and leads to a cloud of aspirants.” [23] The result becomes an
inefficient utilization of resources, a lack of focus and direction and questionable development of
competitive advantage. “The reasoning behind this is that, in many cases, the value to the end user is not
necessarily related to the cost of providing the product or service.” [24]
In order to shed light upon this convoluted process and generate any hope of understanding the
customer/supplier relationship, one must ask four questions.
• Who benefits from the effort? • Who pays for the effort? • Who provides the effort? • Who loses because the effort is undertaken?
These questions are further complicated by the fact that solutions, derived under purely market driven or
technical terms do not necessarily correlate with that derived under political conditions. It is the notion of
fact versus perceptions that complicate the process. Rechtin and Maier developed a heuristic for
architecting in this environment. It states that “It’s not the facts, it’s the perceptions that count” and is
Massachusetts Institute of Technology - System Design and Management
30
followed by the statement that critical issues must be transparent to the political elite in order to convince
the masses.
When considering who pays and who provides and determining who loses, the U.S. Congress
becomes the ultimate customer in the sense they become the customer and stakeholder. The success of a
P/P is directly related to its ability to maneuver and negotiate in order to secure funding. Funding has a
direct effect on the P/P structure and organization as well as geographic dispersion. In addition to these
effects, funding typically will have conditions attached that will determine the required communication
between Congress and the P/P.
Traditionally, the Public Sector role (i.e., Government) has been to engage and pursue R&D
activities in areas that are too risky for the Private Sector. For many years, these roles have been quite
clear. Maintaining a close relationship with various segments of the Public Sector R&D was not
necessarily the most profitable activities to undertake, but was considered a wise competitive strategy
because of the opportunity to leverage technologies and improve the organization’s knowledge base. In
today’s environment, it can be said that the roles have been reversed. The Public Sector is being
downsized, spending significantly reduced and is now attempting to partner and share development costs,
operations costs and risk with the Private Sector. This is in exchange for the opportunity to
commercialize the end system. As a result, some believe that Private Sector R&D investment and
effectiveness has surpassed the Public Sector in terms of breakthrough technologies generated. [25]
Therefore, it could be said that the R&D investment strategy is governed by a commercial set of rules
versus a public driven set of priorities.
4.2.1. Strategies (Public & Private) - Corporate strategy
The civil space program has set lofty goals of improving access-to-space. The Honorable, Mr.
Daniel Goldin, former NASA Administrator, announced that NASA has set goals to reduce the cost of
accessing space by an order of magnitude of 10, and safety and reliability by an order of 100. [26] These
goals are the driving force to expand the bounds of technological advancement in support of improving
Massachusetts Institute of Technology - System Design and Management
31
mankind’s way of life; at the same time, affording opportunities for value capture by its participants. The
result has been the structuring of technology development approaches that support the development of
such lofty performance parameters and the identification of a strategy that satisfies both Public and
Private Sector goals, including international competitiveness.
4.2.1.1. Technology
A descriptive indicator of the technological maturity is the use of “S”- Curve for a given
technology. This framework plots a performance parameter against a measure of effort. The usefulness
of “S”- Curves comes from providing indications of changes in technological progress and to hopefully
provide an opportunity to recognize when switching to a new “S”- Curve is necessary. “S”- Curves can
be viewed as having three phases: fermentation, take-off, and plateau, as shown in Figure 14. Each of
these phases reflect relative technological gains for a given amount of expended effort to mature and
focus a given technology. [27] “S”- Curves also reflect when a dominant design starts to take hold and
drive the investment strategy associated with a given technology. Dominant designs are reflective of a
communal agreement on a developmental direction and characteristics for a given technology or system.
It starts to take hold following the “fermentation” stage and prior to the “take off” stage. “S”- Curves for
Launch Systems and Vehicles can be developed according to the development of propulsion systems and
payload capacity to orbit. [27]

Massachusetts Institute of Technology - System Design and Management
32
Fermentation
Take-off
Plateau
Effort
Pe
rf
or
ma
nc
e
Technology “S”-Curve Regions
Figure 14 - Technology "S" Curve
Market conditions for satellite delivery to earth orbit has encouraged a reshaping of the current
“S”- Curve. Competitors have modified this “S”- Curve by “reaching back” to existing technologies to
exploit market conditions as shown in Figure 15. [27] They “reaching back” leverage knowledge,
experience, and technologies, which included ballistic missile development, multiple stage system
architectures, and hydrocarbon-based fuels to capitalize on new market opportunities. These technologies
are now integrated with updated engineering and manufacturing techniques to foster greater competitive
advantage. [28] The advantage comes from reductions in manufacturing costs, increased reliability in
system components, and overall reductions in system weight.
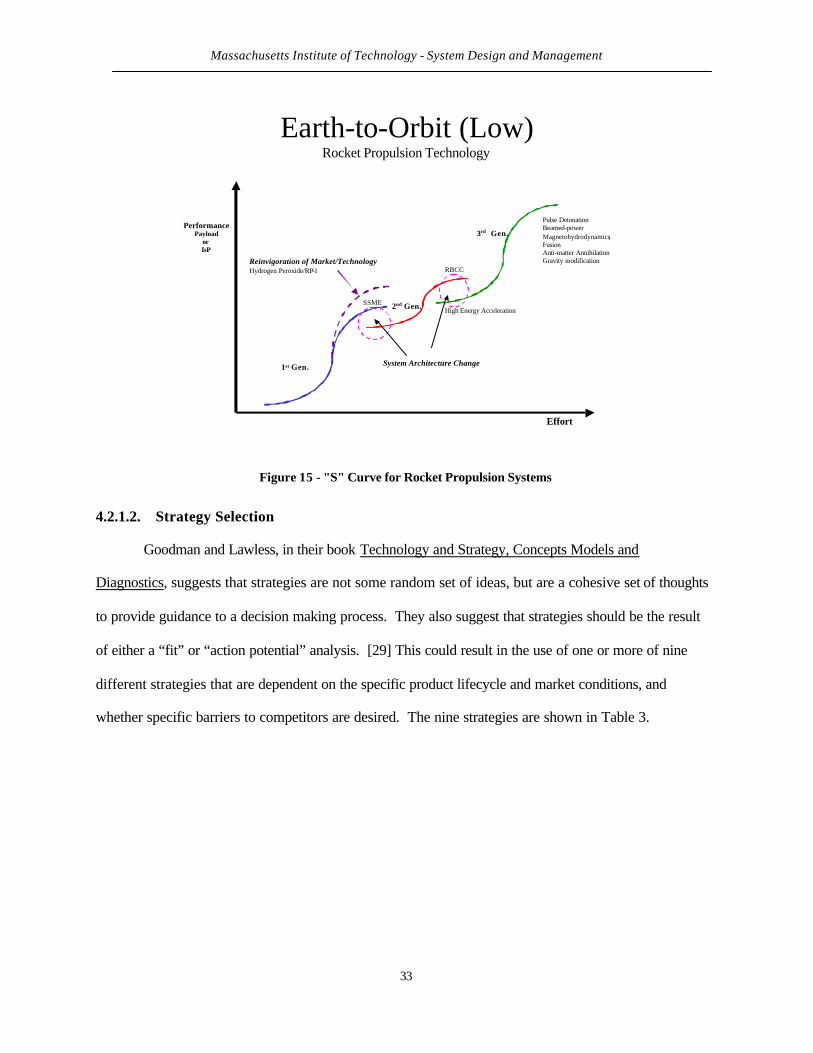
Massachusetts Institute of Technology - System Design and Management
33
Earth-to-Orbit (Low)Rocket Propulsion Technology
PerformancePayload
or IsP
Effort
SSMEHigh Energy Acceleration
Reinvigoration of Market/TechnologyHydrogen Peroxide/RP-1 RBCC
Pulse DetonationBeamed-powerMagnetohydrodynamics,FusionAnti-matter AnnihilationGravity modification
System Architecture Change1st Gen.
2nd Gen.
3rd Gen.
Figure 15 - "S" Curve for Rocket Propulsion Systems
4.2.1.2. Strategy Selection
Goodman and Lawless, in their book Technology and Strategy, Concepts Models and
Diagnostics, suggests that strategies are not some random set of ideas, but are a cohesive set of thoughts
to provide guidance to a decision making process. They also suggest that strategies should be the result
of either a “fit” or “action potential” analysis. [29] This could result in the use of one or more of nine
different strategies that are dependent on the specific product lifecycle and market conditions, and
whether specific barriers to competitors are desired. The nine strategies are shown in Table 3.

Massachusetts Institute of Technology - System Design and Management
34
Table 3 - Nine Technology Strategies (adopted from [29])
Strategy Market/Product Situation Actions/Defensibility Technological Commodity Search
Stable or declining/well known or standard
Invest in productivity/low-cost firms exhibits uncertain imitability/market size-to-investment cost ratio favorable/potential for reputational differentiation
Preemption Industrial/easily copied Invest in mega-capacity plant/competitor investment too high given market size
Productive Efficiency Mature mass market/stable and well-understood product
Investing in manufacturing process/competitor faces information delays regarding manufacturing technique-experience curve effect
Producer Preference Early stage/complex product Invest in product research/early steep learning curve provides information delay and early uncertain imitability
Production Flexibility-Seasonal/E’-Customer Design
Seasonal or low volume/custom design
Develop flexible manufacturing approaches planning and CAD/CAM/takes advantage of normal product information delays to the competition
Customer Preference Mature-moderate to high volume/standard
Develop ability to manufacture with limited flexibility
Product Pioneer/G’ Product Leader/G” Product Follower
Latent/new and technologically complex Growing/technologically complex Mature/multipurpose products
Invest in product development/experience curve advantages competitor delays due to product complexity and market uncertainty Heavy investment in product and market development/better solution to large portion of market needs Invest in special-purpose design/niche benefit of market size not worth competitor’s investment
Vertical Integration: Forward/Backward
Large or growing/technologically complex
Enter into cooperative agreement/contractual regulatory
Complimentary Technology Large market for complex product (computer/car)
Design product to be compatible
The market/product situation of the U.S. Launch Services capability reflects several of the
strategies identified by Goodman and Lawless. The U.S. capability was declining in dominance, but can
be considered stable, given recent growth in the communications market. The growth in the
communications market has led to the re-use of well-understood technologies to provide access-to-space
Massachusetts Institute of Technology - System Design and Management
35
services. However, over the years, many countries have also developed similar capabilities and have
eroded some of the U.S. dominance. As a result, portions of the following strategies can represent the
U.S. Launch Service sector: Technological Commodity Search, Preemption, and Productive Efficiency.
[28]
The Technological Commodity Search strategy suggests investments in productivity to maintain
competitive position and market share given the competition is on a purely price basis. The U.S. is
investing in launch systems like the EELV that leverage existing architectures, and applying state-of-the-
art design and manufacturing to further reduce costs. Aspects of Preemption strategy address the fact that
launch services can be imitated. This comes because of national policy influences on international
diplomacy, and not necessarily affording the greatest protection of the capability. The suggested action
from this strategy would be to invest in additional capacity to point where competing nations cannot
afford the cost of additional capacity to compete on low prices. Lastly, the Productive Efficiency strategy
suggests investing in manufacturing processes to provide distance and differentiation between service
providers.
The steps taken by the U.S. in recent years have led to segmenting the U.S. access-to-space
capability such that immediate launch services are covered by the DoD and ELV’s, and the future to be
addressed by NASA and reusable type vehicles. The ELV effort is focused on improving competitiveness
through investments in productivity and manufacturing, which is consistent with the Technology
Commodity Search and Preemption strategies. [29] Furthermore, plans to open more spaceports align
well with the strategy for capacity increases, which make it difficult for competitors to imitate. This
defensive posture is reflected in the EELV commercialization effort, where Lean Thinking and Principles
have been employed to manage systemic cost. However, the commoditization of launch services is a sub-
optimization of the value chain when considering the perspective of satellite developers and ground base
users. Launch services make up such a small portion of the revenue stream (9%), that efforts to
emphasize cost reductions are inconsequential in the grander scheme. [28]
Massachusetts Institute of Technology - System Design and Management
36
The RLV strategy seems to align with that of Product Pioneer and Vertical Integration strategies.
These strategies highlights the fact that new technologies are required to make RLV a feasible means of
accessing space. The market conditions must be properly defined to develop sufficient return on
investment. Current thoughts suggest that space tourism; on-orbit recovery and maintenance of satellites
are mechanisms to generate sufficient flight rates. [30] These concepts are not necessarily in agreement
with the thoughts of some industry executives who feel the space tourism model is not well defined and
the current cost of satellite development does not support on orbit maintenance of satellites. This
situation is further complicated by the failure of the X-33 CPP effort.
4.3. Competitive Issues
In defining and establishing Public Sector programs, strategic implications must be addressed in a
broader sense than purely for the Public good. Competitiveness objectives require the incorporation of a
strategy that the Private Sector finds reasonable and can be leveraged for economic gain. Efforts to date
are implementing strategies to commoditize launch service prices. Figure 16 shows the migration toward
commoditization of launch services costs. This strategy requires competition on price. However, market
volatility is flexing the size of the market. Therefore, launch capacity and flexibility are becoming more
important. [28] With investments in associated R&D shrinking, it is difficult to maintain a competitive
edge on price. This is because information surrounding system development and increasing reliability
have been shared with global competitors via a variety of alliances. These alliances tended to focus on
improving quality of life and became a part of international diplomatic policy. Therefore, any
appropriability derived from competitive barriers and strategies have been eroded. The necessary
complimentary assets, in terms of infrastructure and vehicles, were subsequently developed internally
with competitive quality. [31] This act alone reduced the competitive advantage of the U.S. and brought
to bear a new threat on the national security front. It also improved the knowledge base of its Alliance
Partners with respect to developing a credible launch system capability.

Massachusetts Institute of Technology - System Design and Management
37
Freely AvailableFreely Available Tightly HeldTightly HeldComplimentary Assets
Ap
pro
pri
abil
ity
LooselyLooselyHeldHeld
TightlyTightlyHeldHeld
ImitatorsCA Holder Build Product
High Growth OpportunityNegotiateBuild
CommodityConsumer Drive(low cost)
InnovatorSpeed-Time to MarketLicensing
1940’s-
1980’s
1940’s-
1980’s
1980’s-2000’s
1980’s-2000’s
ELV’s
ELV’s
1990’s-
2000’s
1990’s-
2000’s
RLV’s
Figure 16 - Government Policy Effect on Access-to-space Value Capture [31]
Commoditization of the launch service market is a classic situation where the innovation process,
for a given technology, has matured in terms of value extraction opportunity. According to Utterback,
any remaining value can be extracted through process improvement versus additional emphasis on the
product itself. [32] Figure 17 reflects the relationship between product and process innovation where
opportunities exist to innovate and extract value. Launch services and systems are obviously in the latter
phase, where hardware innovation is extremely limited and process improvement offers the greater
opportunity. This is demonstrated in the fact that current systems architectures, used worldwide, are
multi-stage systems, and still use the ground infrastructure of the early 1950’s vintage. Furthermore,
current development efforts have focused on improvements in the design/development and manufacturing
technologies employed, in order to reduce vehicle and launch operations costs.
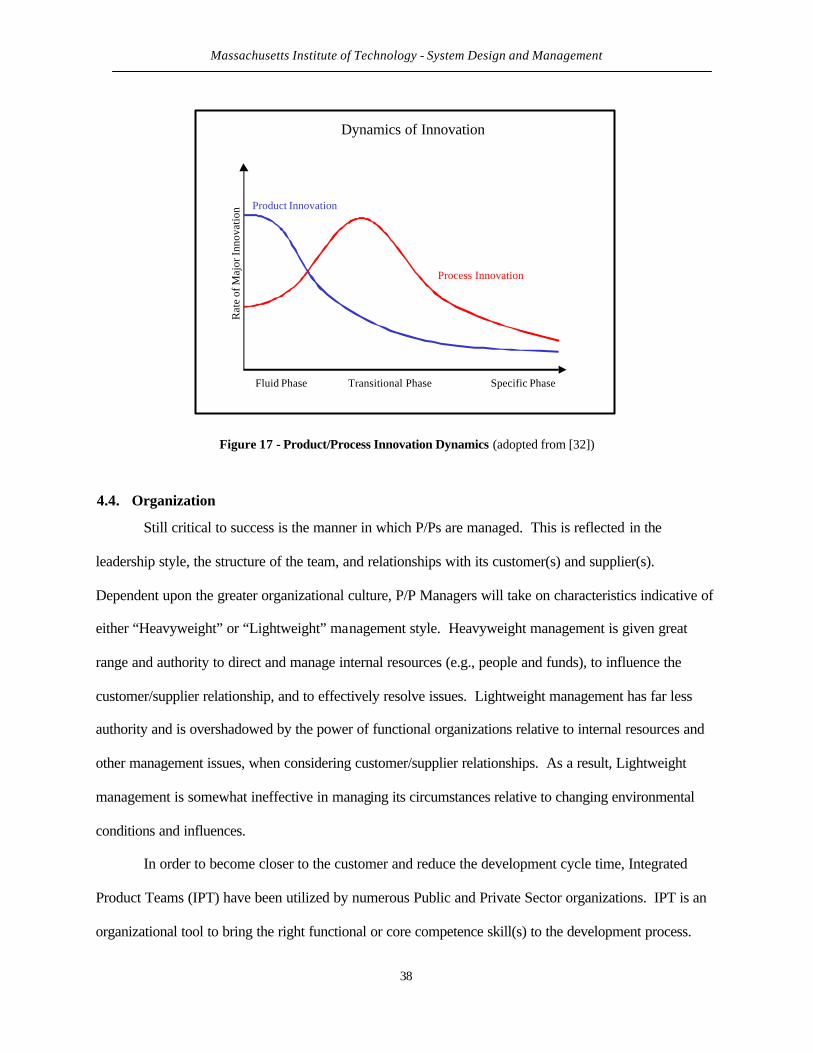
Massachusetts Institute of Technology - System Design and Management
38
Dynamics of Innovation
Process Innovation
Product Innovation
Rat
e of
Maj
or In
nova
tion
Fluid Phase Transitional Phase Specific Phase
Figure 17 - Product/Process Innovation Dynamics (adopted from [32])
4.4. Organization
Still critical to success is the manner in which P/Ps are managed. This is reflected in the
leadership style, the structure of the team, and relationships with its customer(s) and supplier(s).
Dependent upon the greater organizational culture, P/P Managers will take on characteristics indicative of
either “Heavyweight” or “Lightweight” management style. Heavyweight management is given great
range and authority to direct and manage internal resources (e.g., people and funds), to influence the
customer/supplier relationship, and to effectively resolve issues. Lightweight management has far less
authority and is overshadowed by the power of functional organizations relative to internal resources and
other management issues, when considering customer/supplier relationships. As a result, Lightweight
management is somewhat ineffective in managing its circumstances relative to changing environmental
conditions and influences.
In order to become closer to the customer and reduce the development cycle time, Integrated
Product Teams (IPT) have been utilized by numerous Public and Private Sector organizations. IPT is an
organizational tool to bring the right functional or core competence skill(s) to the development process.
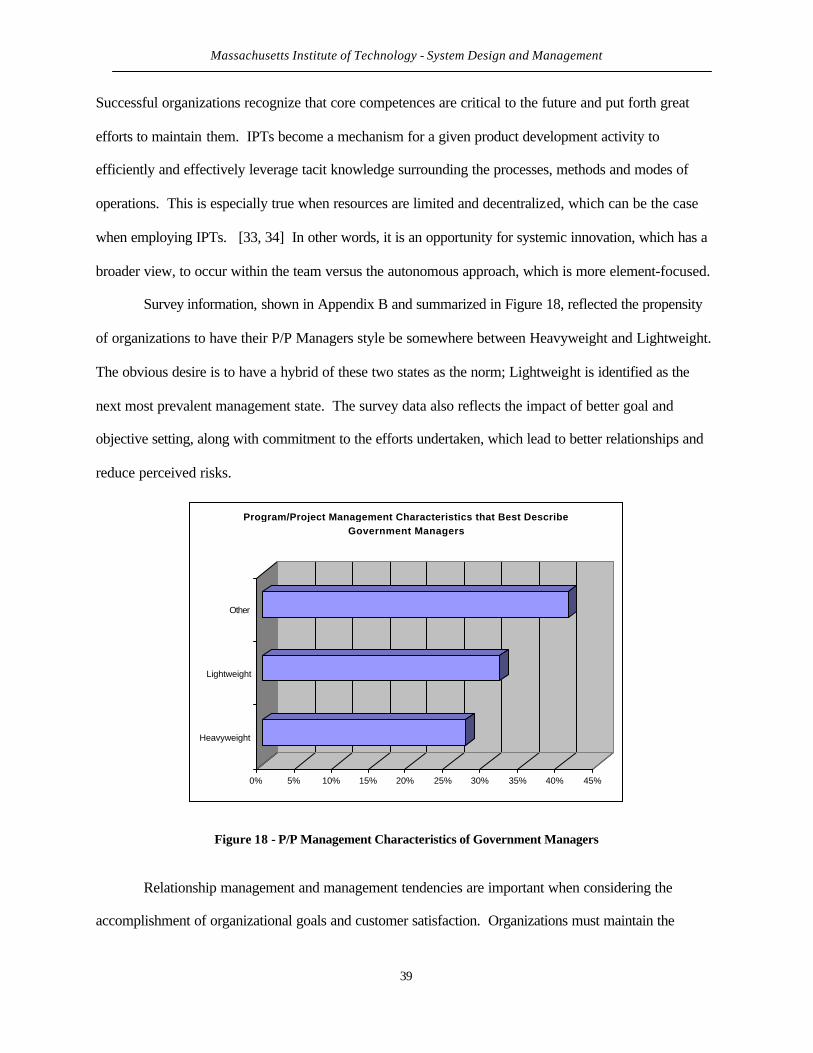
Massachusetts Institute of Technology - System Design and Management
39
Successful organizations recognize that core competences are critical to the future and put forth great
efforts to maintain them. IPTs become a mechanism for a given product development activity to
efficiently and effectively leverage tacit knowledge surrounding the processes, methods and modes of
operations. This is especially true when resources are limited and decentralized, which can be the case
when employing IPTs. [33, 34] In other words, it is an opportunity for systemic innovation, which has a
broader view, to occur within the team versus the autonomous approach, which is more element-focused.
Survey information, shown in Appendix B and summarized in Figure 18, reflected the propensity
of organizations to have their P/P Managers style be somewhere between Heavyweight and Lightweight.
The obvious desire is to have a hybrid of these two states as the norm; Lightweight is identified as the
next most prevalent management state. The survey data also reflects the impact of better goal and
objective setting, along with commitment to the efforts undertaken, which lead to better relationships and
reduce perceived risks.
0% 5% 10% 15% 20% 25% 30% 35% 40% 45%
Heavyweight
Lightweight
Other
Program/Project Management Characteristics that Best Describe
Government Managers
Figure 18 - P/P Management Characteristics of Government Managers
Relationship management and management tendencies are important when considering the
accomplishment of organizational goals and customer satisfaction. Organizations must maintain the
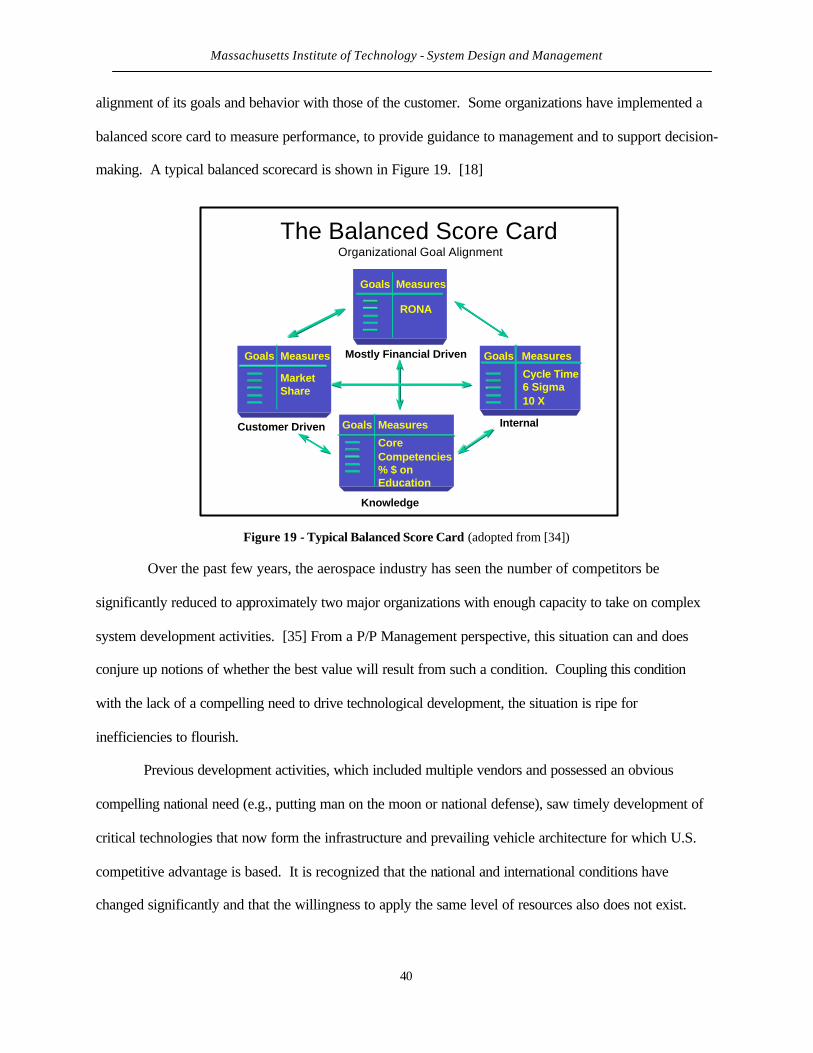
Massachusetts Institute of Technology - System Design and Management
40
alignment of its goals and behavior with those of the customer. Some organizations have implemented a
balanced score card to measure performance, to provide guidance to management and to support decision-
making. A typical balanced scorecard is shown in Figure 19. [18]
Goals Measures
Goals Measures
Goals Measures
Goals Measures
Customer Driven
Knowledge
Mostly Financial Driven
MarketShare
RONA
Cycle Time6 Sigma10 X
Core Competencies% $ on Education
Internal
The Balanced Score CardOrganizational Goal Alignment
Figure 19 - Typical Balanced Score Card (adopted from [34])
Over the past few years, the aerospace industry has seen the number of competitors be
significantly reduced to approximately two major organizations with enough capacity to take on complex
system development activities. [35] From a P/P Management perspective, this situation can and does
conjure up notions of whether the best value will result from such a condition. Coupling this condition
with the lack of a compelling need to drive technological development, the situation is ripe for
inefficiencies to flourish.
Previous development activities, which included multiple vendors and possessed an obvious
compelling national need (e.g., putting man on the moon or national defense), saw timely development of
critical technologies that now form the infrastructure and prevailing vehicle architecture for which U.S.
competitive advantage is based. It is recognized that the national and international conditions have
changed significantly and that the willingness to apply the same level of resources also does not exist.

Massachusetts Institute of Technology - System Design and Management
41
The current conditions point directly to the possibility that the system cannot effectively meet such lofty
goals and objectives as described by Mr. Goldin. [36, 23]
This customer/supplier condition is a potential breeding ground for lack of trust to grow. This
condition is said to have the propensity for “hold-up” to occur on the part of either participating party. In
this environment, the risk versus reward situation is questioned as to its sufficiency in enabling trust for
both parties to grow in a positive manner. [37]
Survey information reflects a perception that, in spite of the history of program cancellations and the
development of systems that do not satisfy expectations, the relationship between the Government and its
support contractors is still good. However, when combining the descriptors of Fair and Poor, they equate
to fifty-five (55%) of the respondents, and reflect significant deterioration of the relationship as shown in
Figure 20.
0% 5% 10% 15% 20% 25% 30% 35% 40%
Participant Responses
Poor
Fair
Good
Excellent
Government/Contractor Relationship Rating Given Cancellation of Programs
Figure 20 - Government/Contractor Relationship Rating
The Government has incorporated CPP to increase the value of the process undertaken during the
procurement process, that makes it attractive to the private sector. This attractiveness used to be access to
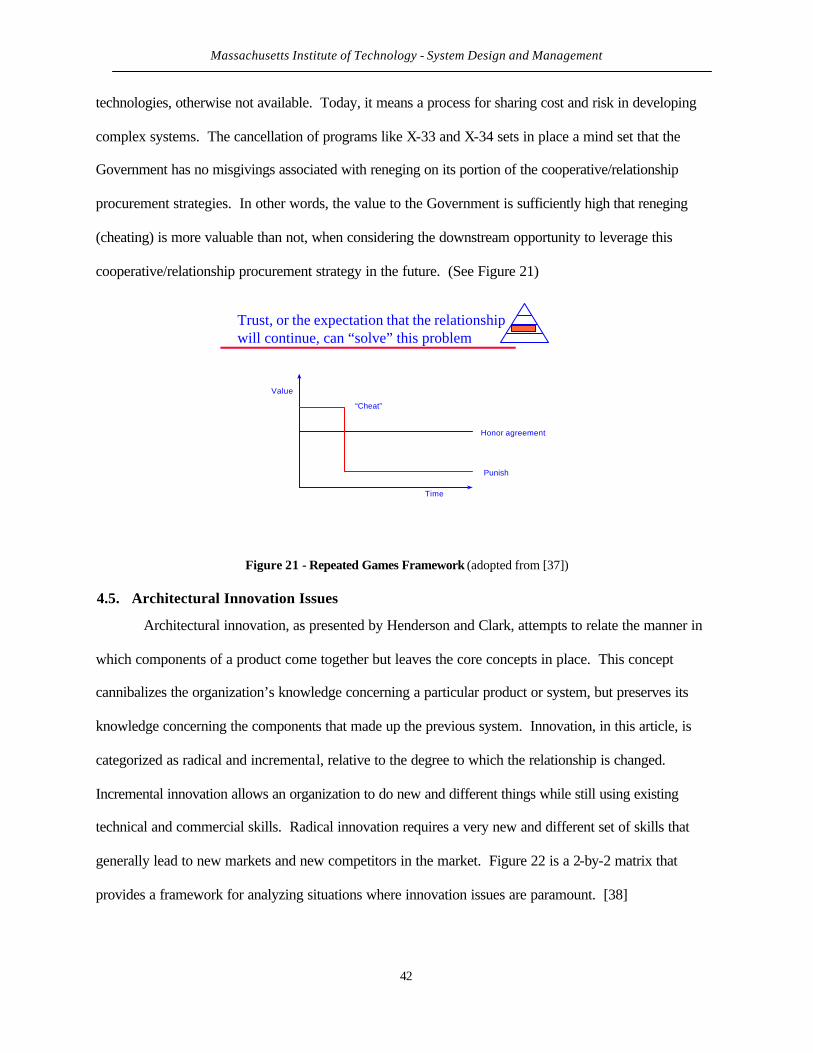
Massachusetts Institute of Technology - System Design and Management
42
technologies, otherwise not available. Today, it means a process for sharing cost and risk in developing
complex systems. The cancellation of programs like X-33 and X-34 sets in place a mind set that the
Government has no misgivings associated with reneging on its portion of the cooperative/relationship
procurement strategies. In other words, the value to the Government is sufficiently high that reneging
(cheating) is more valuable than not, when considering the downstream opportunity to leverage this
cooperative/relationship procurement strategy in the future. (See Figure 21)
Figure 21 - Repeated Games Framework (adopted from [37])
4.5. Architectural Innovation Issues
Architectural innovation, as presented by Henderson and Clark, attempts to relate the manner in
which components of a product come together but leaves the core concepts in place. This concept
cannibalizes the organization’s knowledge concerning a particular product or system, but preserves its
knowledge concerning the components that made up the previous system. Innovation, in this article, is
categorized as radical and incremental, relative to the degree to which the relationship is changed.
Incremental innovation allows an organization to do new and different things while still using existing
technical and commercial skills. Radical innovation requires a very new and different set of skills that
generally lead to new markets and new competitors in the market. Figure 22 is a 2-by-2 matrix that
provides a framework for analyzing situations where innovation issues are paramount. [38]
Trust, or the expectation that the relationship will continue, can “solve” this problem
“Cheat”
Honor agreement
Punish
Value
Time
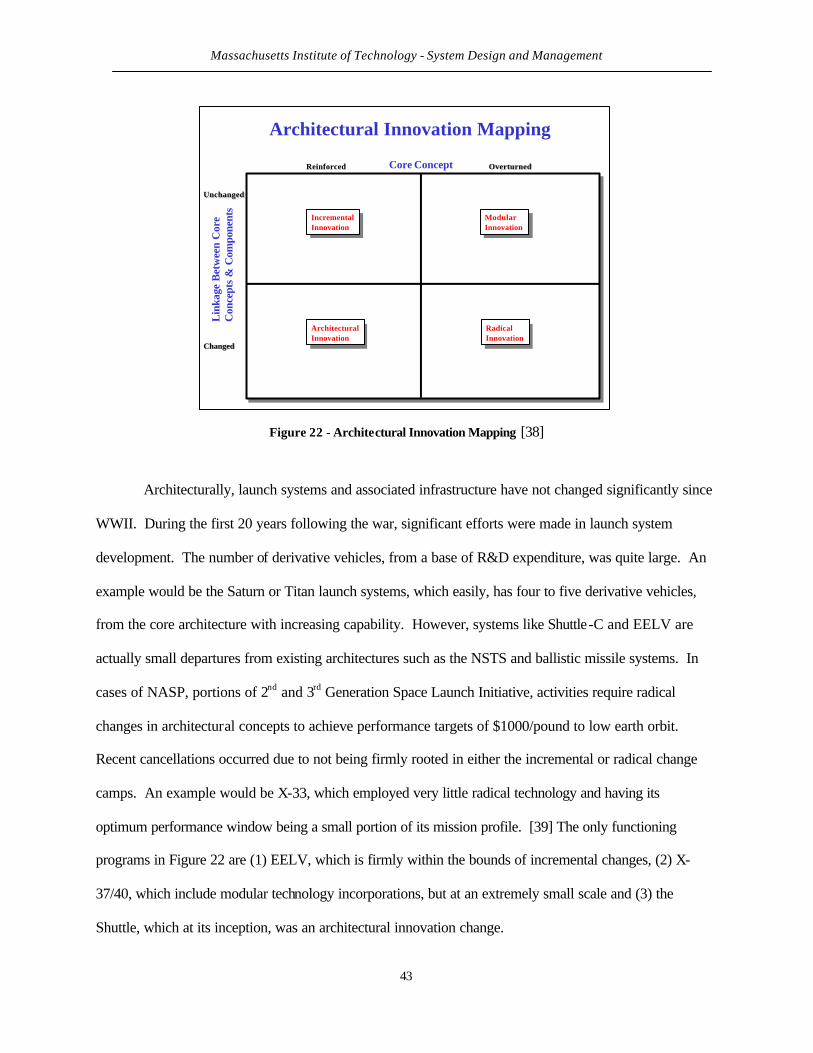
Massachusetts Institute of Technology - System Design and Management
43
Architectural Innovation Mapping
ReinforcedReinforced
UnchangedUnchanged
ChangedChanged
OverturnedOverturnedCore Concept
Lin
kag
e B
etw
een
Cor
eC
once
pts
& C
ompo
nent
sIncrementalInnovation
IncrementalInnovation
ArchitecturalInnovation
ArchitecturalInnovation
RadicalInnovation
RadicalInnovation
ModularInnovation
ModularInnovation
Figure 22 - Architectural Innovation Mapping [38]
Architecturally, launch systems and associated infrastructure have not changed significantly since
WWII. During the first 20 years following the war, significant efforts were made in launch system
development. The number of derivative vehicles, from a base of R&D expenditure, was quite large. An
example would be the Saturn or Titan launch systems, which easily, has four to five derivative vehicles,
from the core architecture with increasing capability. However, systems like Shuttle-C and EELV are
actually small departures from existing architectures such as the NSTS and ballistic missile systems. In
cases of NASP, portions of 2nd and 3rd Generation Space Launch Initiative, activities require radical
changes in architectural concepts to achieve performance targets of $1000/pound to low earth orbit.
Recent cancellations occurred due to not being firmly rooted in either the incremental or radical change
camps. An example would be X-33, which employed very little radical technology and having its
optimum performance window being a small portion of its mission profile. [39] The only functioning
programs in Figure 22 are (1) EELV, which is firmly within the bounds of incremental changes, (2) X-
37/40, which include modular technology incorporations, but at an extremely small scale and (3) the
Shuttle, which at its inception, was an architectural innovation change.
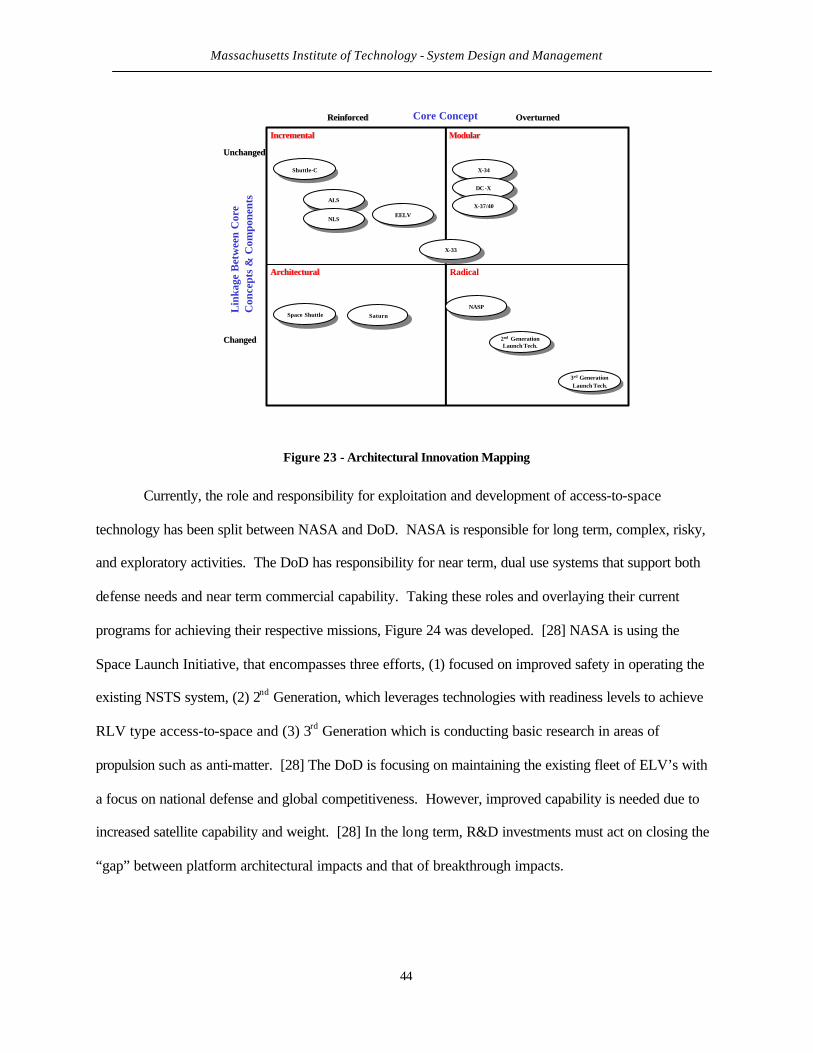
Massachusetts Institute of Technology - System Design and Management
44
EELVEELV
ReinforcedReinforced
UnchangedUnchanged
ChangedChanged
OverturnedOverturnedCore Concept
Lin
kag
e B
etw
een
Cor
eC
once
pts
& C
omp
onen
ts
IncrementalIncremental
ArchitecturalArchitectural RadicalRadical
ModularModular
Space ShuttleSpace Shuttle
2nd GenerationLaunch Tech.
2nd GenerationLaunch Tech.
NASPNASP
X-33X-33
3rd GenerationLaunch Tech.
3rd GenerationLaunch Tech.
ALSALS
NLSNLS
Shuttle-CShuttle-CX-34
X-34
DC-XDC-X
X-37/40X-37/40
SaturnSaturn
Figure 23 - Architectural Innovation Mapping
Currently, the role and responsibility for exploitation and development of access-to-space
technology has been split between NASA and DoD. NASA is responsible for long term, complex, risky,
and exploratory activities. The DoD has responsibility for near term, dual use systems that support both
defense needs and near term commercial capability. Taking these roles and overlaying their current
programs for achieving their respective missions, Figure 24 was developed. [28] NASA is using the
Space Launch Initiative, that encompasses three efforts, (1) focused on improved safety in operating the
existing NSTS system, (2) 2nd Generation, which leverages technologies with readiness levels to achieve
RLV type access-to-space and (3) 3rd Generation which is conducting basic research in areas of
propulsion such as anti-matter. [28] The DoD is focusing on maintaining the existing fleet of ELV’s with
a focus on national defense and global competitiveness. However, improved capability is needed due to
increased satellite capability and weight. [28] In the long term, R&D investments must act on closing the
“gap” between platform architectural impacts and that of breakthrough impacts.

Massachusetts Institute of Technology - System Design and Management
45
Entirely New BenefitEntirely New Benefit Incremental ImprovementIncremental Improvement
RadicalRadical
Off theOff theShelfShelf
2nd Generation SLI2nd Generation SLI
Existing RLV & ELVExisting RLV & ELV
3rd Generation SLITesting Requirements
3rd Generation SLITesting Requirements
No ChangeNo Change
Service Impact
TechnologyImpact
•$10K/lb-orbit•Process Improvement•Licensing & Indemnity•Spaceports•Launch Rate
•$1K/lb-orbit•Technology Dev.•Product Improvement•Vehicle Risk Reduction
•$100/lb-orbit•High Energy Systems•Anti-Matter
“Gap”
Breakthrough
Platform
Derivative
Figure 24 - Access-to-space Technology Development Mapping
In the next chapter, the results of this case study will be brought together with other data derived
from interviews with industry executives, additional survey information, and a review of congressional
records. This information will be analyzed and inferences derived to support a proposed framework
based on the heuristic of this thesis.
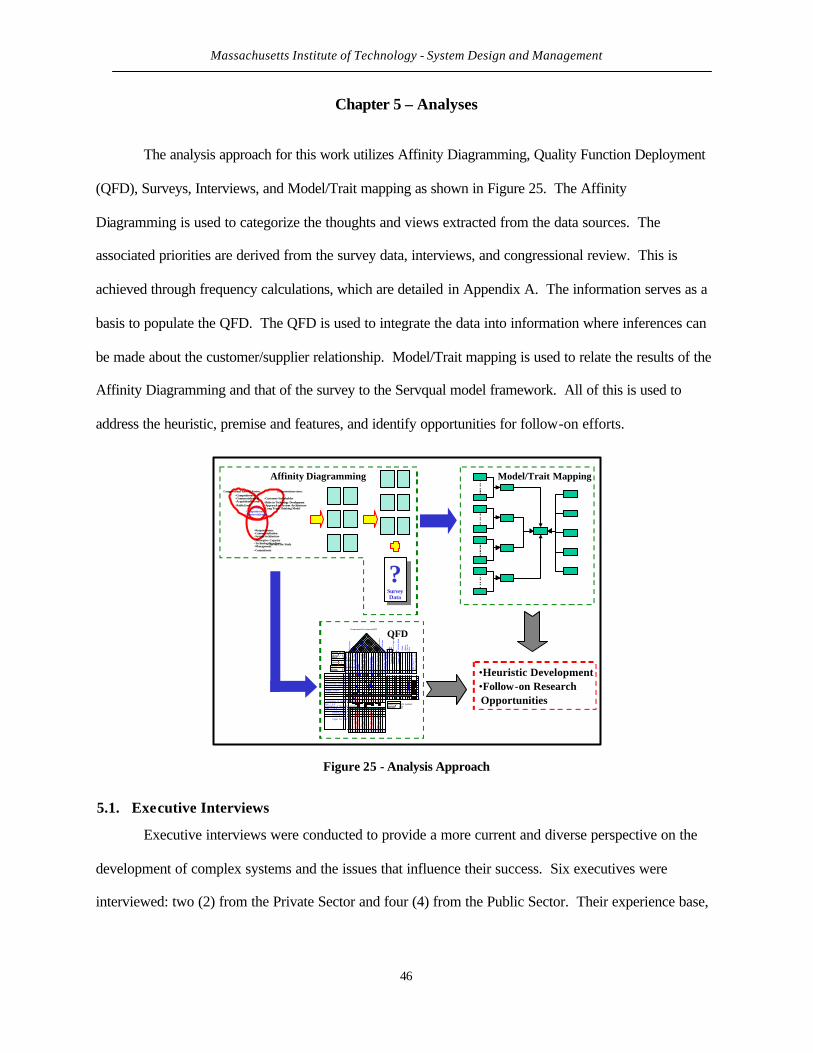
Massachusetts Institute of Technology - System Design and Management
46
Chapter 5 – Analyses
The analysis approach for this work utilizes Affinity Diagramming, Quality Function Deployment
(QFD), Surveys, Interviews, and Model/Trait mapping as shown in Figure 25. The Affinity
Diagramming is used to categorize the thoughts and views extracted from the data sources. The
associated priorities are derived from the survey data, interviews, and congressional review. This is
achieved through frequency calculations, which are detailed in Appendix A. The information serves as a
basis to populate the QFD. The QFD is used to integrate the data into information where inferences can
be made about the customer/supplier relationship. Model/Trait mapping is used to relate the results of the
Affinity Diagramming and that of the survey to the Servqual model framework. All of this is used to
address the heuristic, premise and features, and identify opportunities for follow-on efforts.
•Heuristic Development•Follow-on ResearchOpportunities
StrategicCompetitiveness
Commercialization
•Competitiveness•Commercialization•Acquisition Reform•Public Good
•Responsiveness•Commercialization•System Architecture•Absorptive Capacity•Technology Readiness•Management•Commitment
•Customer/Stakeholder•Roles in Technology Development•Approach to System Architecture•Long Term Thinking Model
Survey/Case Study
Executive InterviewsCongressional Record Review
?SurveyData
?SurveyData
Affinity Diagramming Model/Trait Mapping
Per
cent
Im
port
ance
1
14.9112.6813.4211.9313.5716.78
16.70
0.000.00
0.00
Fed
eral
Spa
ce P
orts
Ope
ratio
ns
T
echn
olog
y U
tiliza
tion
T
urn
Aro
und
Tim
e
Ran
ge M
anag
emen
t
Reli
ability
R
isk
man
agem
ent
L
icens
e C
ivil
Spac
e Po
rts
Stre
amlin
ed P
roce
sses
M
arke
t S
hare
I
ndem
inifi
catio
n
Veh
icle
Sys
tem
s
Fac
ility
Sys
tem
s
Sys
tem
Ope
ratio
ns
Gov
ernm
ent/
Indu
stry
Coo
pera
tion
F
acilit
atio
n C
apita
lizat
ion
of A
ctiv
ities
D
ual
Use
Tec
hnol
ogy
1 2 3 4 5 6 7 8 9 10
11
12
13
14
15
16 C
usto
mer
Im
port
ance
1
D
oD a
nd C
ivil
Laun
ch
20.
60
434433
4
C
omm
erci
al L
anuc
h
30.
40
443223
1
A
vera
ge C
usto
mer
Im
port
ance
4
4.003.403.603.202.603.00
2.80
0.000.00
0.00
Com
petit
ive
Pre
ssur
es
5
Cur
rent
Lau
nch
Veh
icle
Fle
et
6
323323
1
E
SA
7
222433
1
R
ussi
a, U
krai
n, C
hina
8
332343
2
J
apan
, In
dia,
oth
ers
9
333444
4
I
mp
rove
me
nt
Fa
cto
r
10
1 . 2
1 . 21 . 41 . 2
1 . 6
1 . 0
1 . 0
0 . 00 . 0
0 . 0
Mar
ket
Leve
rage
Fac
tor
1
1 Ove
rall
Impo
rtan
ce
12
4 . 84 . 14 . 33 . 84 . 45 . 4
5 . 4
0 . 00 . 0
0 . 0
Min
= 0
.0P
erce
nt I
mpo
rtan
ceM
ax
= 1
6.8
1 2 3 4 5 6 7 8 9 10
Direction of Improvement 1 Federal Facility Operations Value Added Processes Technology Investment Economic Incentives Payload to Orbit Costs Export Control DoD Payloads Public Payloads
1 2 3 4 5 6 7 8 9 10
Importance of Design Parameters 1 0.00
5.10
10.5
015
.88
5.63
0.88
15.0
59.
659.
3410
.96
6.04
10.9
6
Min = 0.0Importance of Design ParametersMax = 20.0 Results of Competitive Benchmarking 3 Current Product 4 3 3 2 1 2 3 3 3 2 3 3 4
Competitor A 5 4 4 3 1 3 3 2 2 3 2 2 3
Competitor B 6 4 3 4 2 3 2 4 4 3 2 3 3
Target For 1998 Product 7
30,0
00 B
TU5
% M
axim
umLe
ss t
han
15 m
inut
es3.
Con
tem
p, C
olon
ial,
Rus
tic5
Maj
or p
arts
Less
tha
n 5
min
utes
25 M
axim
um3.
2 M
inim
umN
ew f
reon
rep
lace
men
t10
Yea
rs M
inim
um
Sam
e as
cur
rent
Less
tha
n $3
00
1 2 3 4 5 6 7 8 9 10
11
12
13
14
15
16
HOWs vs. HOWs SymbolsStrong + 9 . 0Weak + 3 . 0Weak - - 3 . 0Strong - - 9 . 0
WHATs vs. WHYs SymbolsAdvertise 1 . 5Mention 1 . 2No Action 1 . 0
WHATs vs. HOWs SymbolsStrong 9 . 0Medium 3 . 0Weak 1 . 0
Direction of ImprovementMaximize 1 . 0Target 0 . 0Minimize - 1 . 0
Government/Commercial QFD
QFD
Figure 25 - Analysis Approach
5.1. Executive Interviews
Executive interviews were conducted to provide a more current and diverse perspective on the
development of complex systems and the issues that influence their success. Six executives were
interviewed: two (2) from the Private Sector and four (4) from the Public Sector. Their experience base,
Massachusetts Institute of Technology - System Design and Management
47
on average, exceeds twenty years and covers aircraft, space transportation, satellite systems, space ground
support systems, and military ship development and operations.
The common threads from the interviews were strategies, goals and objectives, understanding
roles and responsibilities, and compelling need. Strategy encompassed a variety of ideals: acquisition
approach, the desire to commercialize, and technology development. Private Sector participants
expressed great concern for the relationship/cooperation acquisition strategy employed by the
Government as being too risky when balanced against stockholder values. Public Sector participants
voiced a similar concern when relationship/cooperation takes the form of IPTs and combines Public
Sector and Contractor personnel in common workspaces. In both cases, the acquisition strategy did not
result in the gains, savings or risk reductions desired by either parties.
Goals and objectives are of equal concern from both sectors in terms of clarity: what the U.S.’s
policy is relative to space? Programs are initiated without solid connectivity to overarching requirements,
and are not properly resourced. In addition, it is agreed that the U.S. involvement in space should be for
greater reasons other than commercialization of low earth orbit (a greater compelling need). As it
happens, the establishment of a compelling need, that is palatable to the general public, as well as its
representative (Congress), is constantly overshadowed by the means of transportation. This is a
fundamental violation of architecting a system in that a solution is identified too early. It was also
pointed out that large efforts tend to loose sight of their goals too quickly.
Relative to technology development, the need for Private Sector participation in Government
sponsored R&D is small, because in many cases, the return on investment or technological gain is not
large enough. Given the notion that the U.S. industria l base is migrating towards fewer and fewer prime
contractor organizations, the entire budgets of some Federal Agencies are not attractive enough to
outweigh the risk associated with a developmental relationship. [35] This is especially true when
considering the recent DoD Joint Strike Fighter $200 Billion dollar, multi-year award. Other areas are not
completely ignored, but the question exists of who is going to pay for the necessary R&D that supports
incremental innovations? Opinions are polarized where one party pays while the other leverages.
Massachusetts Institute of Technology - System Design and Management
48
In general, commercialization was not very high on the list of importance and current efforts were
not looked upon as having an opportunity to be successful. An example would be the NSTS effort, where
the United Space Alliance organization is used in an attempt at commercialization. This is reflected also
in the notion that the economics don’t support the recovery or on-orbit maintenance of vehicles or
systems. Until the technologies are developed, which will require significantly greater R&D investment,
RLV’s are not an economical choice for access-to-space. Also, it is believed that it is cheaper to build
new satellites rather than attempt to repair on-orbit, which conflicts with proposed modifications to the
Space Launch Act. However, R&D investments, from some of the cancelled programs resulted in
improvements in performance and safety of existing systems. This is especially true in the area of
propulsion systems. The elements from these interviews are detailed in Appendix A and drawn from
References [2], [23], [43], [44], [45].
5.2. Congressional Records Review
The Congressional records review consisted of database searches for committee hearings
associated with access-to-space, commercialization of space and reusable launch vehicles. In addition,
other sources that monitored congressional reports, such as, Space Future®, NASA Watch® and Aviation
Daily®, were reviewed. Congressional records pointed out the issues sited by Rechtin and Mair in that it
is difficult to execute complex system development activities over long periods of time in a political
environment. The opportunity exists for stakeholder priorities and values to change, and setup events that
could lead to difficult or unsuccessful development efforts. It is not the fact that value or priorities have
changed; it is the perception that nothing has changed that is real. Therefore, inconsistent and unrealized
goals, objectives, and MOE must be explained.
The most significant result from this review is the role of Government in complex system
development efforts sponsored by the Government. The X-33 program was set up as a
relationship/cooperation, where both parties shared cost and risk. It was also believed that the Private
Sector could provide the best value with minimal Government interaction. Now that the program has
Massachusetts Institute of Technology - System Design and Management
49
been cancelled, the Inspector General testimony points to NASA for not providing enough oversight to
adequately manage the effort. This is contrary to initial intentions. The review also indicated questions
as to whether Congress itself should be a greater participating role in future complex system development
efforts. The customer/supplier relationship becomes more like stakeholder/developing
Agency/Contractor, where the stakeholder has a greater participative role than in the past.
The Congressional records review identified the desire to shore up the competitive edge of the
U.S. launch services market while maintaining the public safety. This competitiveness was also fueled by
the desire to shift the ownership of some U.S. Government installations to Local Government and Private
Sector ownership to convert them to Spaceports. In many cases, this could be obtained by leveraging the
existing infrastructure of down-moded U.S. Government facilities. Relative to public safety, the
Government would provide indemnification for these Private Sector organizations for amounts above
what commercially available insurance would cover. In addition, the Government would provide means
for assuring safety through a licensing process with minimal impact to launch window opportunities.
However, this licensing only addresses launching payloads to orbit. Some testimony indicated a desire
for the Space Launch Act to be modified to include the recovery of vehicles from space. The belief is that
the modification would open the market and improves the value of RLV’s.
Current efforts, reflective of market pull, have resulted in partnerships between U.S.
organizations and those of other nations, in order to satisfy the demand for launch services. These
partnerships exist because of increased cost (in terms of risk) associated with launching within U.S.
boundaries. To launch from a U.S. spaceport requires a license and interaction with as many as four
different Federal Agencies. The Federal Aviation Administration, who is responsible for issuing the
license, has agreed to keep the approval cycle time to less than 180 days. Other Federal Agencies are
required depending on the launch site of choice. The elements from this review are detailed in Appendix
A.
Massachusetts Institute of Technology - System Design and Management
50
5.3. Access-to-space Case Study
The Access-to-space case study highlighted the notion that launch services are responsive to
market conditions. This was reflected in the U.S. Department of Commerce projections of satellites to be
launched into Low Earth Orbit (LEO) from 1995 through 2000. These projections showed a peak of
almost 60 launches occurring in 2002. However, with the demise of the Iridium business model, market
projections were sizably reduced where the 1999 projection was slightly over 20 launches occurring in
2010. [28]
Another major point derived from the study is the notion of commercialization. The U.S. has for
many years leveraged its investments in post WWII ballistic system to nurture and lead a commercial
space launch market. However, policies employed during the development of the NSTS consolidated
investments in R&D and infrastructure into a single program, the NSTS. During the years to follow, the
U.S. expendable launch vehicle dominance was significantly eroded to where it was on par with the rest
of the worldwide launch competitors. Only after the Challenger explosion, was this policy reversed and
dominance regained. [28]
To compensate and respond to the market pull, mature technologies are being integrated with
state-of-the-art design and manufacturing technologies, to make for a better competitive position when
considering the dollar per pound to orbit MOE. In order to reach the desired MOE of $100/lb, or even
$1000/lb to LEO, significant R&D investments are required to encourage “Breakthrough” type gains in
enabling technology.
In order to reduce access-to-space costs, reusability through reductions in the number of
disposable parts are paramount. This also includes improved vehicle and payload process management
associated with ground and support systems. For the most part, the system architecture employed has not
changed since the end of WWII. Propulsion systems are chemical-based, dominated by hydrocarbon-
based refined kerosene, oxidizers, monopropellants such as hydrazine and other volatile chemicals (e.g.,
hydrogen, hydrogen peroxide, and fluorine). Later emphasis was placed on efficiency and maximizing
specific impulse (Isp) to achieve payload to orbit goals. This emphasis resulted in a highly efficient, yet
Massachusetts Institute of Technology - System Design and Management
51
technically complicated and costly to operate class of engines, like the Space Shuttle Main Engine
(SSME).
Architecturally, ELV and current partial RLV systems utilize multiple expendable stages,
reflective of the early launch system efforts. The associated design and development processes still result
in complex vehicles, ground systems, and payload integration efforts. Each one of the launch vehicles is
unique in that accepted deviations from the prescribed specifications are peculiar to that system only.
These deviations are the result of variations in the manufacturing and acquisition processes.
Ground systems are not much different in their maturation when compared to ELV’s and RLV’s.
These operations are still labor intensive, complex, of questionable reliability, and consequently, take
notable amounts of time and funding to perform. These conditions are the result of using volatile
chemical propellants and critical processes that are inherently dangerous operations. Because of the high
dollar value of equipment and safety of personnel, great care is given to processing such that the highest
opportunity for on-orbit success is afforded. [28]
Failure of the access-to-space systems shown in Figure 1 can be attributed to the “gap” between
the expectation of the system developer, the Public Sector, and Public/Private Sector partnerships, and the
perception of actual characteristics of the associated management and physical system performances.
Table 4 summarizes the issues surrounding each of the vehicles, probable causes, and lessons learned.

Massachusetts Institute of Technology - System Design and Management
52
Table 4 - Summary of Rationale for Launch System Cancellation or Performance Failure [4]
Product Status Failure or Performance Problem
Cause(s) Lessons Learned
NSTS Operational • Launch rate: Promised 60/yr, Actual 6/yr
• Payload-cost-to-orbit: Promised $100/lb, Actual-$10,000/lb
• Vehicle Dominated Architecture
• High Fixed Costs • Complex Payload
Integration • High Touch Labor
Content • Disposal Rocket
Architecture of the 50’s & 60’s
• Avoid Flight-to-Flight Certifications
• Decision Making only at highest levels
• Avoid Dependence on Complex systems and operations
• Reusable system necessary to reduce costs
HLLV Shuttle-C
Cancelled • Payload-cost-to-orbit: $1000/lb
• Increased number of disposable elements
• Reuse of NSTS Architecture & Infrastructure
• Qualification of flight Software
• Cost of disposable components (SSME)
• Flight qualification of software is costly and critical
• Use of SSME is too costly for disposable architecture
ALS Cancelled • Payload-cost-to-orbit: $1000/lb
• System Development cost to high
• Satisfy DoD and Civilian Requirements
• Launch rate not expected to payback on investment
• Propulsion system technology development
• Cost of reliability for disposable propulsion
• Incorporate propulsion system technologies in SSME
NLS Cancelled • Payload-cost-to-orbit: $1000/lb
• System Development cost to high
• Satisfy DoD and Civilian Requirements
• Launch rate does not support payback on investment
• Propulsion system technology development
• Cost of reliability for disposable propulsion
• Incorporate propulsion system technologies in SSME
NASP Cancelled • Owner of Mission • Operational Costs • Satisfy DoD and Civilian
Requirements
• High Technology Development Costs
• No Commitment to Full Scale
• Technology investment critical
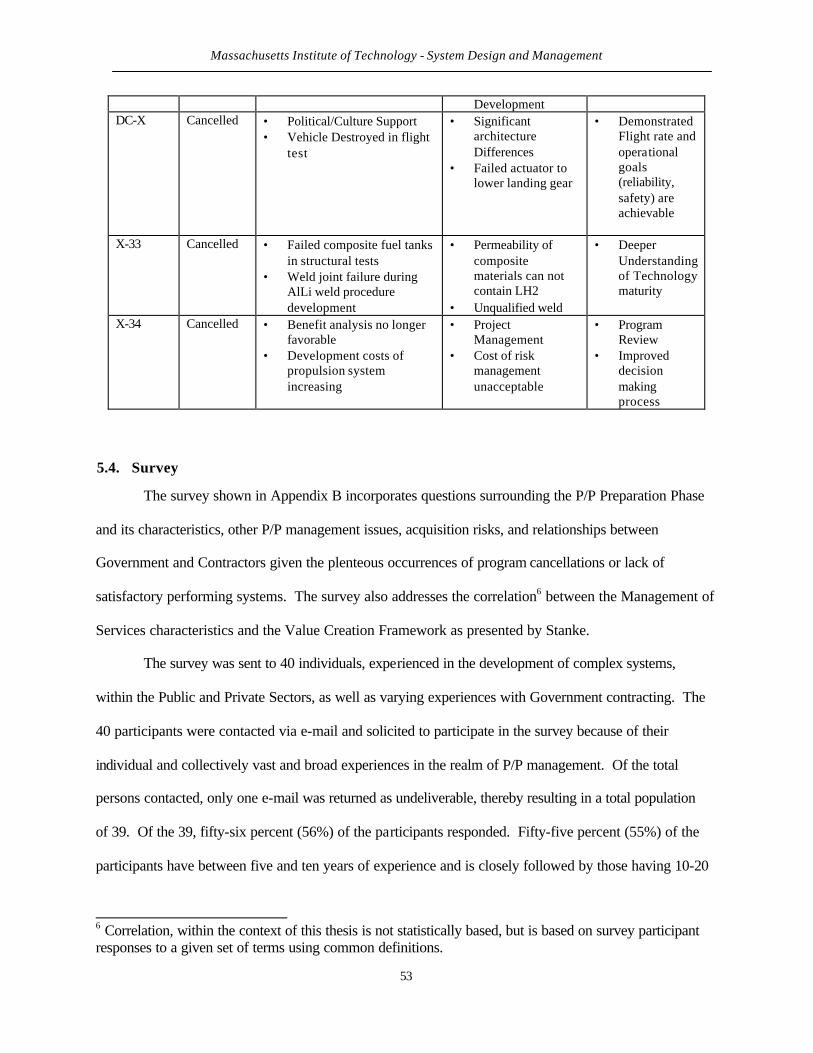
Massachusetts Institute of Technology - System Design and Management
53
Development DC-X Cancelled • Political/Culture Support
• Vehicle Destroyed in flight test
• Significant architecture Differences
• Failed actuator to lower landing gear
• Demonstrated Flight rate and operational goals (reliability, safety) are achievable
X-33 Cancelled • Failed composite fuel tanks
in structural tests • Weld joint failure during
AlLi weld procedure development
• Permeability of composite materials can not contain LH2
• Unqualified weld
• Deeper Understanding of Technology maturity
X-34 Cancelled • Benefit analysis no longer
favorable • Development costs of
propulsion system increasing
• Project Management
• Cost of risk management unacceptable
• Program Review
• Improved decision making process
5.4. Survey
The survey shown in Appendix B incorporates questions surrounding the P/P Preparation Phase
and its characteristics, other P/P management issues, acquisition risks, and relationships between
Government and Contractors given the plenteous occurrences of program cancellations or lack of
satisfactory performing systems. The survey also addresses the correlation6 between the Management of
Services characteristics and the Value Creation Framework as presented by Stanke.
The survey was sent to 40 individuals, experienced in the development of complex systems,
within the Public and Private Sectors, as well as varying experiences with Government contracting. The
40 participants were contacted via e-mail and solicited to participate in the survey because of their
individual and collectively vast and broad experiences in the realm of P/P management. Of the total
persons contacted, only one e-mail was returned as undeliverable, thereby resulting in a total population
of 39. Of the 39, fifty-six percent (56%) of the participants responded. Fifty-five percent (55%) of the
participants have between five and ten years of experience and is closely followed by those having 10-20
6 Correlation, within the context of this thesis is not statistically based, but is based on survey participant responses to a given set of terms using common definitions.
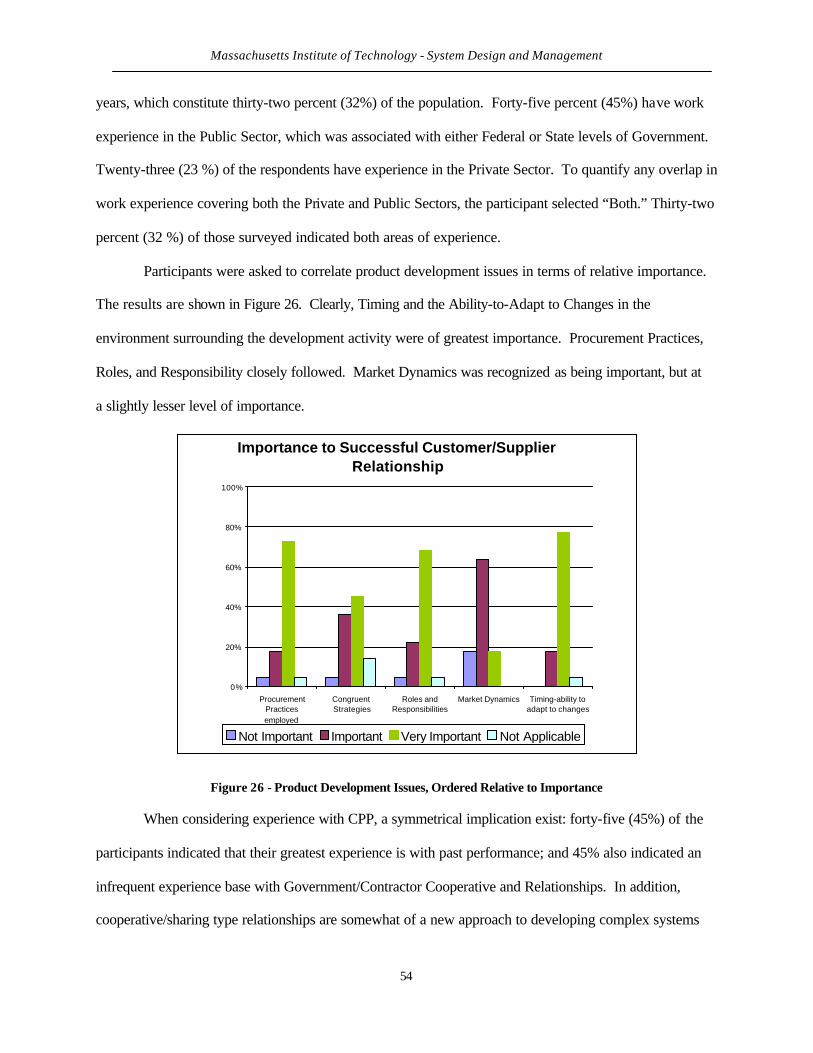
Massachusetts Institute of Technology - System Design and Management
54
years, which constitute thirty-two percent (32%) of the population. Forty-five percent (45%) have work
experience in the Public Sector, which was associated with either Federal or State levels of Government.
Twenty-three (23 %) of the respondents have experience in the Private Sector. To quantify any overlap in
work experience covering both the Private and Public Sectors, the participant selected “Both.” Thirty-two
percent (32 %) of those surveyed indicated both areas of experience.
Participants were asked to correlate product development issues in terms of relative importance.
The results are shown in Figure 26. Clearly, Timing and the Ability-to-Adapt to Changes in the
environment surrounding the development activity were of greatest importance. Procurement Practices,
Roles, and Responsibility closely followed. Market Dynamics was recognized as being important, but at
a slightly lesser level of importance.
Importance to Successful Customer/Supplier Relationship
0%
20%
40%
60%
80%
100%
ProcurementPracticesemployed
CongruentStrategies
Roles andResponsibilities
Market Dynamics Timing-ability toadapt to changes
Not Important Important Very Important Not Applicable
Figure 26 - Product Development Issues, Ordered Relative to Importance
When considering experience with CPP, a symmetrical implication exist: forty-five (45%) of the
participants indicated that their greatest experience is with past performance; and 45% also indicated an
infrequent experience base with Government/Contractor Cooperative and Relationships. In addition,
cooperative/sharing type relationships are somewhat of a new approach to developing complex systems
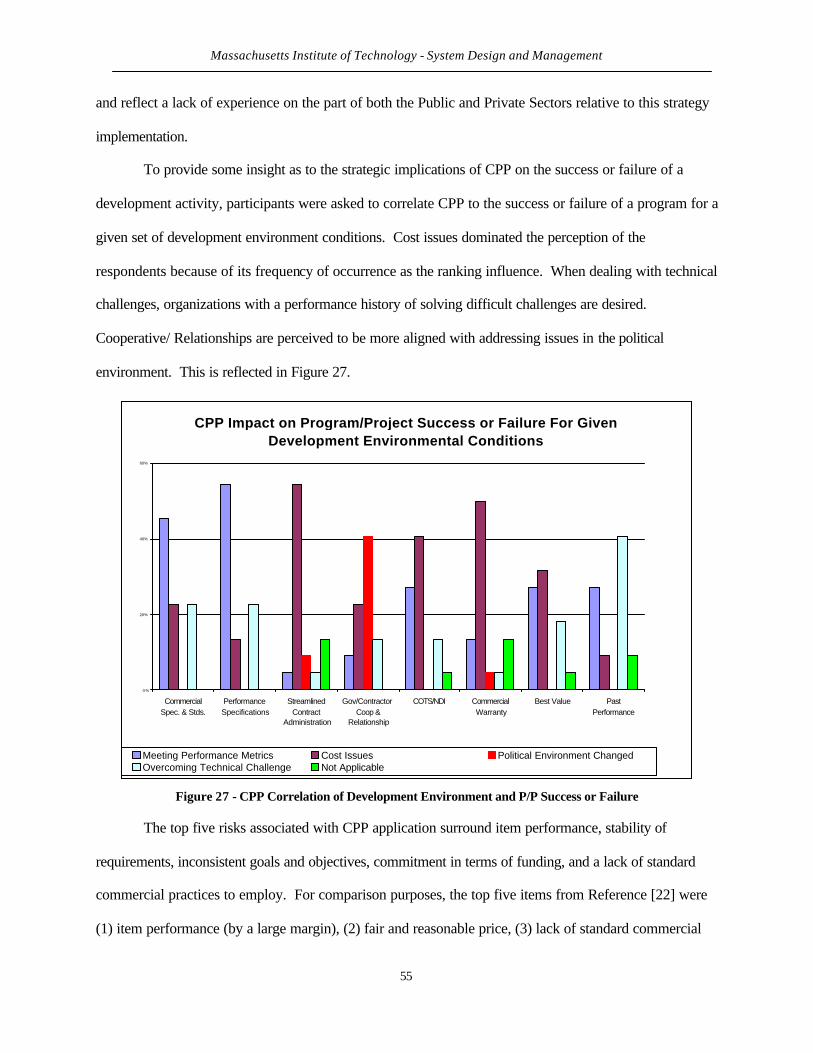
Massachusetts Institute of Technology - System Design and Management
55
and reflect a lack of experience on the part of both the Public and Private Sectors relative to this strategy
implementation.
To provide some insight as to the strategic implications of CPP on the success or failure of a
development activity, participants were asked to correlate CPP to the success or failure of a program for a
given set of development environment conditions. Cost issues dominated the perception of the
respondents because of its frequency of occurrence as the ranking influence. When dealing with technical
challenges, organizations with a performance history of solving difficult challenges are desired.
Cooperative/ Relationships are perceived to be more aligned with addressing issues in the political
environment. This is reflected in Figure 27.
CPP Impact on Program/Project Success or Failure For Given Development Environmental Conditions
0%
20%
40%
60%
CommercialSpec. & Stds.
PerformanceSpecifications
StreamlinedContract
Administration
Gov/ContractorCoop &
Relationship
COTS/NDI CommercialWarranty
Best Value PastPerformance
Meeting Performance Metrics Cost Issues Political Environment ChangedOvercoming Technical Challenge Not Applicable
Figure 27 - CPP Correlation of Development Environment and P/P Success or Failure
The top five risks associated with CPP application surround item performance, stability of
requirements, inconsistent goals and objectives, commitment in terms of funding, and a lack of standard
commercial practices to employ. For comparison purposes, the top five items from Reference [22] were
(1) item performance (by a large margin), (2) fair and reasonable price, (3) lack of standard commercial

Massachusetts Institute of Technology - System Design and Management
56
practices, (4) interoperability and (5) trust in contractor.7 This comparison is shown in Figure 28. This
change could be the result of different participant organizational positions and the lack of focus on a
particular P/P. In addition, interoperability is a strong driver amongst military system development and is
the reason it ranks high in Reference [22]. This could also be reflective of development activities in the
aerospace community where traditionally close coupling of missions, functions and systems was not
perceived as a good attribute. This is because of the uniqueness in missions and the potential down side
of political dynamics. [24]
Perceived CPP Risk Comparison
0%
10%
20%
30%
40%
50%
60%
70%
Item P
erfor
mance
Fair &
Rea
sona
ble P
rice
Incon
sisten
t Goa
ls an
d Obje
ctive
s
Commitm
ent (L
eade
rship)
Gover
nmen
t/Con
tracto
r Cult
ure
Commitm
ent (F
undin
g)
Financ
ial Li
abilit
y
Stabilit
y of R
equir
emen
ts
Leve
l of G
over
nmen
t Par
ticipa
tion
Agenc
y Pre
ssur
e
Inter
oper
abilit
y
Trus
t in C
ontra
ctor
Lack
of S
td. C
ommer
cial P
racti
ces
other
Douglas
Anderson
Figure 28 - Perceived CPP Risk Comparison-Douglas & Anderson
Survey participants indicated that they often used performance specification as the main element
of complex system acquisition strategies. This was followed by greater than forty percent (40 %)
indicating frequent use of past performance as the main element. An infrequent use of
Government/Contractor Cooperative Relationships for CPP is shown in Figure 29. Participants indicated
virtually little or no use of Commercial Warranty in their experience base.
7 Reference [22] (Anderson) surveyed 23 projects and each project was given one choice. In addition, the population of Anderson’s work was DoD programs versus the broad based population used in this thesis. The choices for this thesis’ survey were augmented with commitment (Leadership and Funding).
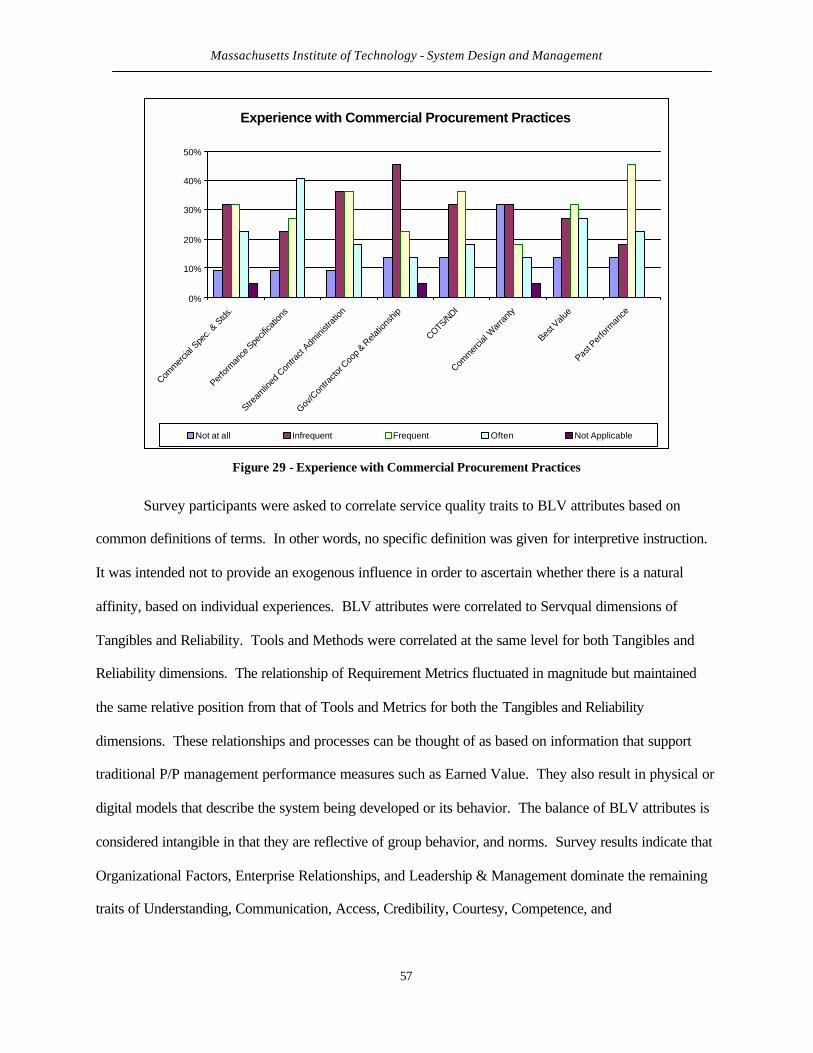
Massachusetts Institute of Technology - System Design and Management
57
Experience with Commercial Procurement Practices
0%
10%
20%
30%
40%
50%
Commer
cial S
pec.
& Stds
.
Perfor
mance
Spe
cifica
tions
Stream
lined
Con
tract
Admini
strati
on
Gov/C
ontra
ctor C
oop &
Rela
tions
hip
COTS/N
DI
Commer
cial W
arra
nty
Best V
alue
Past P
erfor
mance
Not at all Infrequent Frequent Often Not Applicable
Figure 29 - Experience with Commercial Procurement Practices
Survey participants were asked to correlate service quality traits to BLV attributes based on
common definitions of terms. In other words, no specific definition was given for interpretive instruction.
It was intended not to provide an exogenous influence in order to ascertain whether there is a natural
affinity, based on individual experiences. BLV attributes were correlated to Servqual dimensions of
Tangibles and Reliability. Tools and Methods were correlated at the same level for both Tangibles and
Reliability dimensions. The relationship of Requirement Metrics fluctuated in magnitude but maintained
the same relative position from that of Tools and Metrics for both the Tangibles and Reliability
dimensions. These relationships and processes can be thought of as based on information that support
traditional P/P management performance measures such as Earned Value. They also result in physical or
digital models that describe the system being developed or its behavior. The balance of BLV attributes is
considered intangible in that they are reflective of group behavior, and norms. Survey results indicate that
Organizational Factors, Enterprise Relationships, and Leadership & Management dominate the remaining
traits of Understanding, Communication, Access, Credibility, Courtesy, Competence, and
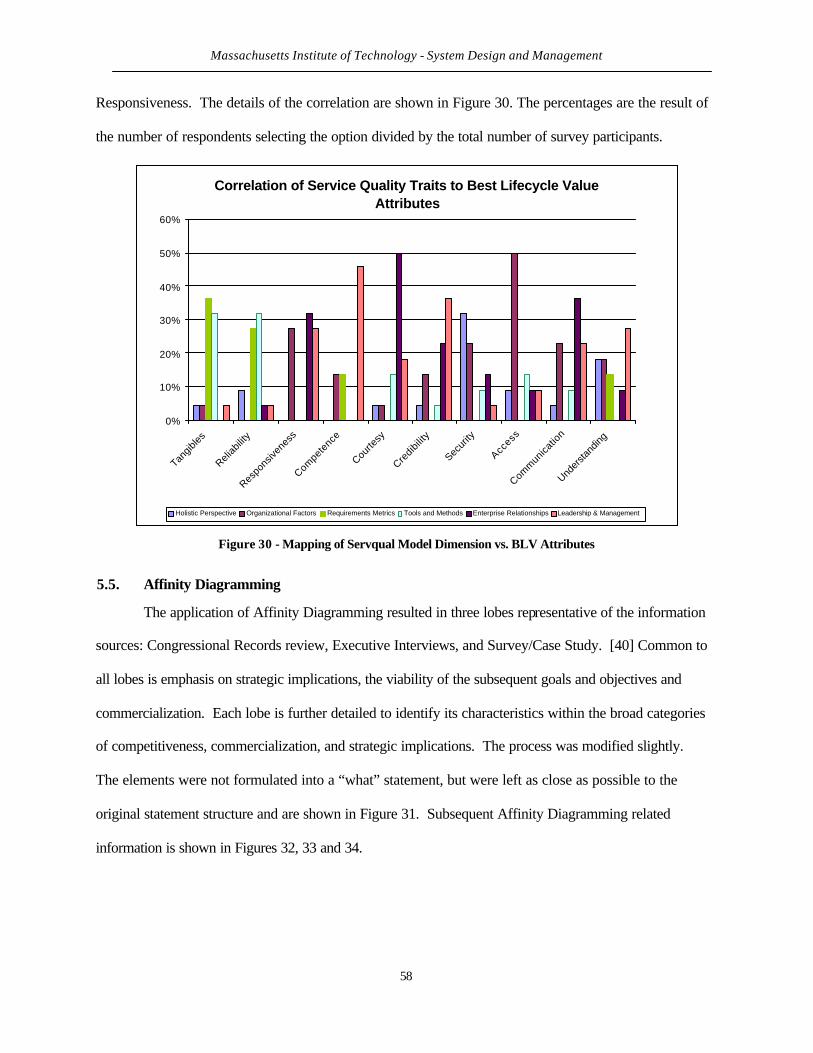
Massachusetts Institute of Technology - System Design and Management
58
Responsiveness. The details of the correlation are shown in Figure 30. The percentages are the result of
the number of respondents selecting the option divided by the total number of survey participants.
Correlation of Service Quality Traits to Best Lifecycle Value Attributes
0%
10%
20%
30%
40%
50%
60%
Tangib
les
Reliab
ility
Respo
nsive
ness
Compe
tenc
e
Courte
sy
Credib
ility
Secur
ity
Access
Comm
unica
tion
Under
stand
ing
Holistic Perspective Organizational Factors Requirements Metrics Tools and Methods Enterprise Relationships Leadership & Management
Figure 30 - Mapping of Servqual Model Dimension vs. BLV Attributes
5.5. Affinity Diagramming
The application of Affinity Diagramming resulted in three lobes representative of the information
sources: Congressional Records review, Executive Interviews, and Survey/Case Study. [40] Common to
all lobes is emphasis on strategic implications, the viability of the subsequent goals and objectives and
commercialization. Each lobe is further detailed to identify its characteristics within the broad categories
of competitiveness, commercialization, and strategic implications. The process was modified slightly.
The elements were not formulated into a “what” statement, but were left as close as possible to the
original statement structure and are shown in Figure 31. Subsequent Affinity Diagramming related
information is shown in Figures 32, 33 and 34.
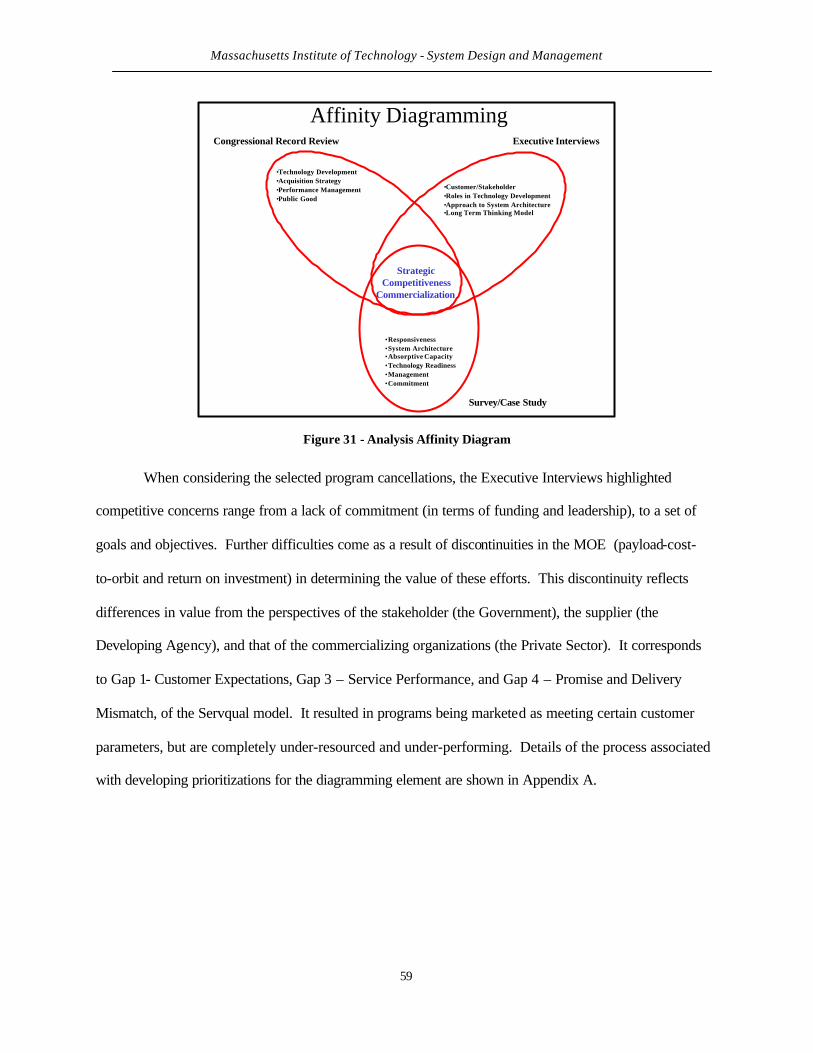
Massachusetts Institute of Technology - System Design and Management
59
Affinity Diagramming
StrategicCompetitiveness
Commercialization
•Technology Development•Acquisition Strategy•Performance Management•Public Good
•Responsiveness•System Architecture•Absorptive Capacity•Technology Readiness•Management•Commitment
•Customer/Stakeholder•Roles in Technology Development•Approach to System Architecture•Long Term Thinking Model
Survey/Case Study
Executive InterviewsCongressional Record Review
Figure 31 - Analysis Affinity Diagram
When considering the selected program cancellations, the Executive Interviews highlighted
competitive concerns range from a lack of commitment (in terms of funding and leadership), to a set of
goals and objectives. Further difficulties come as a result of discontinuities in the MOE (payload-cost-
to-orbit and return on investment) in determining the value of these efforts. This discontinuity reflects
differences in value from the perspectives of the stakeholder (the Government), the supplier (the
Developing Agency), and that of the commercializing organizations (the Private Sector). It corresponds
to Gap 1- Customer Expectations, Gap 3 – Service Performance, and Gap 4 – Promise and Delivery
Mismatch, of the Servqual model. It resulted in programs being marketed as meeting certain customer
parameters, but are completely under-resourced and under-performing. Details of the process associated
with developing prioritizations for the diagramming element are shown in Appendix A.

Massachusetts Institute of Technology - System Design and Management
60
CompetitivenessCompetitiveness
ExecutivesExecutives CommercializationCommercialization
StrategicStrategic
•Commitment•Technology Development•Programmatic Management•Performance Measures•Congruent Tactical Strategies•Leverage Market Position•ROI Compatibility
•Commitment•Technology Development•Programmatic Management•Performance Measures•Congruent Tactical Strategies•Leverage Market Position•ROI Compatibility
•Understanding Customer•Market Segmentation
•Understanding Customer•Market Segmentation
•Goal/Objective Development•Communication•Compelling Need•Enabling R&D Investments•Role and Responsibility•Congruent Long Term Strategy•Mental Model For DifferentBehaviors
•Goal/Objective Development•Communication•Compelling Need•Enabling R&D Investments•Role and Responsibility•Congruent Long Term Strategy•Mental Model For DifferentBehaviors
Affinity Diagram
Executive Interviews
Figure 32 - Executive Interviews Affinity Diagram Categorization
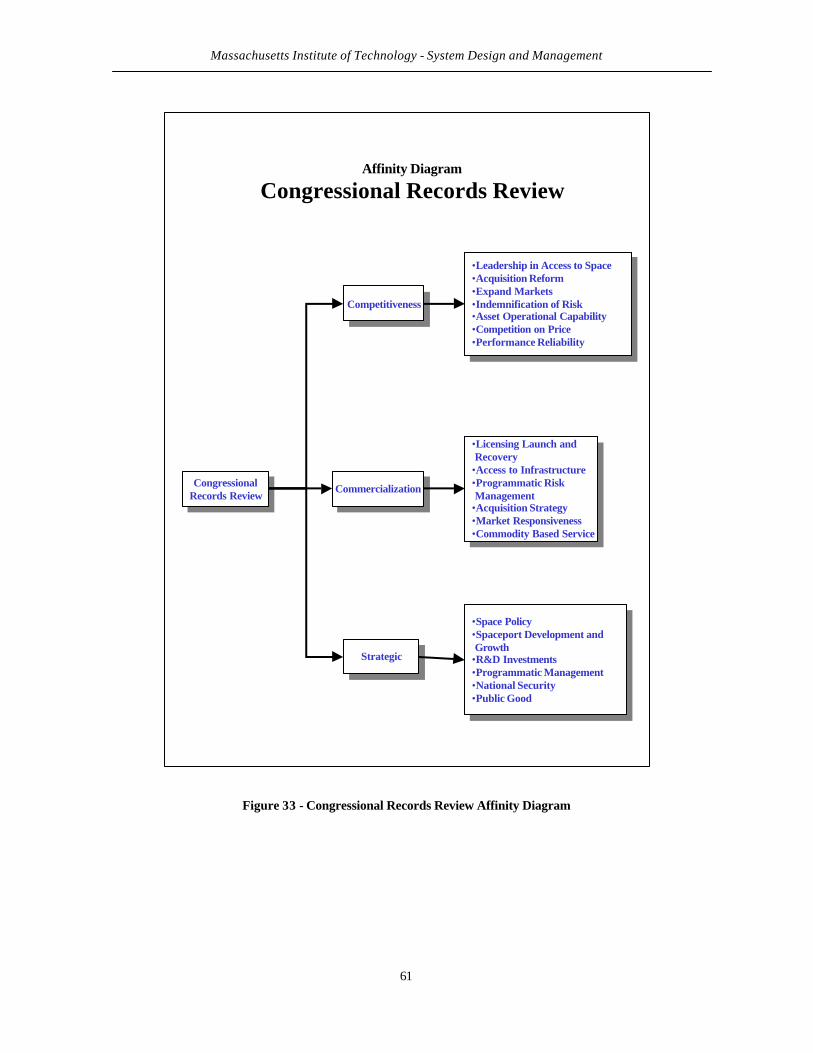
Massachusetts Institute of Technology - System Design and Management
61
CompetitivenessCompetitiveness
CongressionalRecords Review
CongressionalRecords Review Commercialization
Commercialization
StrategicStrategic
•Leadership in Access to Space•Acquisition Reform•Expand Markets•Indemnification of Risk•Asset Operational Capability•Competition on Price•Performance Reliability
•Leadership in Access to Space•Acquisition Reform•Expand Markets•Indemnification of Risk•Asset Operational Capability•Competition on Price•Performance Reliability
•Licensing Launch and Recovery
•Access to Infrastructure•Programmatic RiskManagement
•Acquisition Strategy•Market Responsiveness•Commodity Based Service
•Licensing Launch and Recovery
•Access to Infrastructure•Programmatic RiskManagement
•Acquisition Strategy•Market Responsiveness•Commodity Based Service
•Space Policy•Spaceport Development andGrowth
•R&D Investments•Programmatic Management•National Security•Public Good
•Space Policy•Spaceport Development andGrowth
•R&D Investments•Programmatic Management•National Security•Public Good
Affinity Diagram
Congressional Records Review
Figure 33 - Congressional Records Review Affinity Diagram
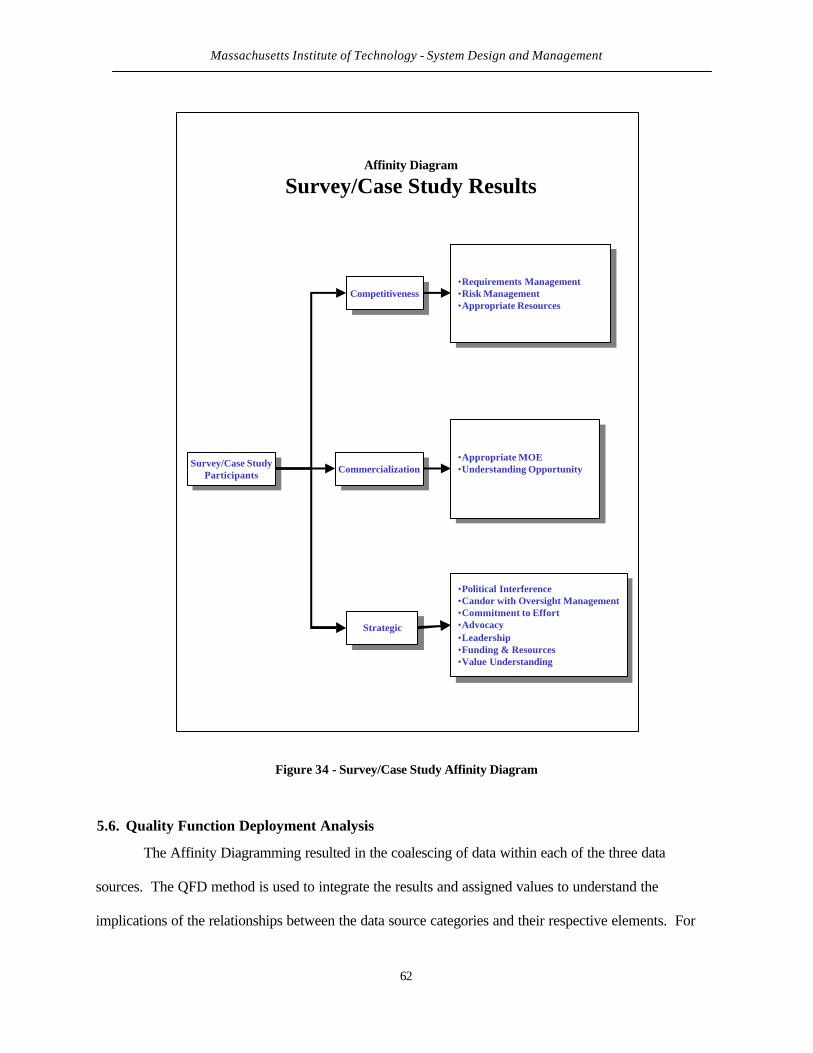
Massachusetts Institute of Technology - System Design and Management
62
CompetitivenessCompetitiveness
Survey/Case StudyParticipants
Survey/Case StudyParticipants CommercializationCommercialization
StrategicStrategic
•Requirements Management•Risk Management•Appropriate Resources
•Requirements Management•Risk Management•Appropriate Resources
•Appropriate MOE•Understanding Opportunity
•Appropriate MOE•Understanding Opportunity
•Political Interference•Candor with Oversight Management•Commitment to Effort•Advocacy•Leadership•Funding & Resources•Value Understanding
•Political Interference•Candor with Oversight Management•Commitment to Effort•Advocacy•Leadership•Funding & Resources•Value Understanding
Affinity Diagram
Survey/Case Study Results
Figure 34 - Survey/Case Study Affinity Diagram
5.6. Quality Function Deployment Analysis
The Affinity Diagramming resulted in the coalescing of data within each of the three data
sources. The QFD method is used to integrate the results and assigned values to understand the
implications of the relationships between the data source categories and their respective elements. For
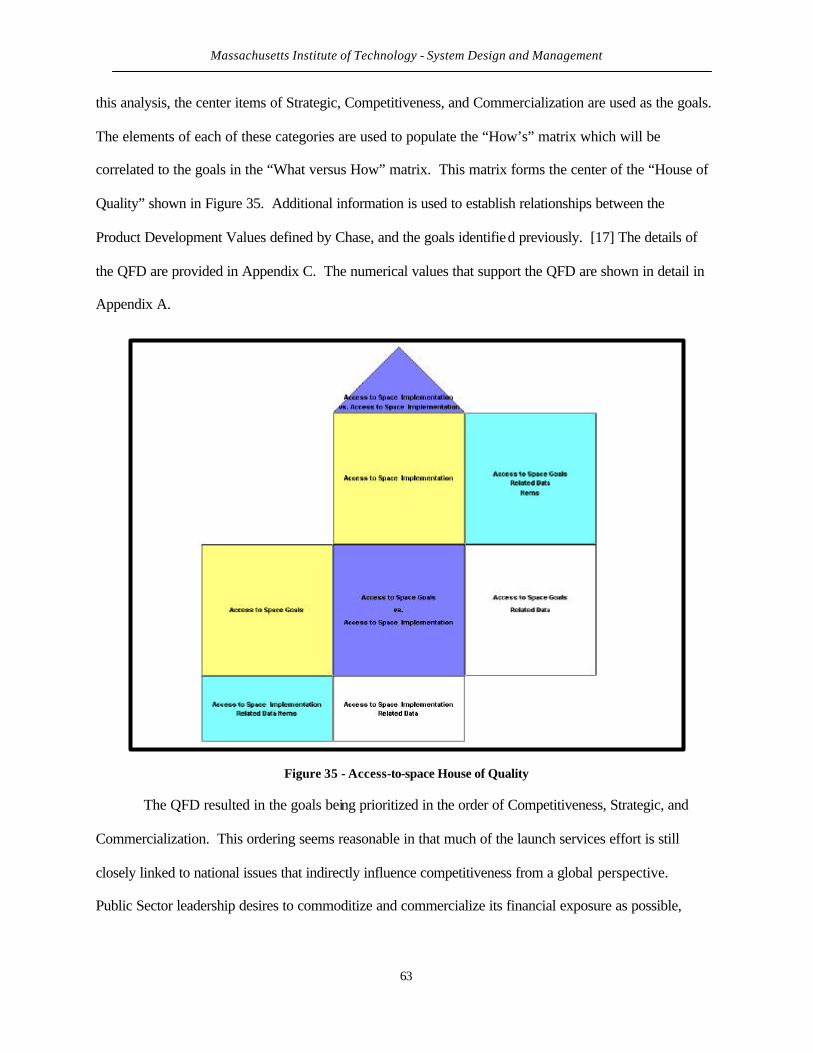
Massachusetts Institute of Technology - System Design and Management
63
this analysis, the center items of Strategic, Competitiveness, and Commercialization are used as the goals.
The elements of each of these categories are used to populate the “How’s” matrix which will be
correlated to the goals in the “What versus How” matrix. This matrix forms the center of the “House of
Quality” shown in Figure 35. Additional information is used to establish relationships between the
Product Development Values defined by Chase, and the goals identified previously. [17] The details of
the QFD are provided in Appendix C. The numerical values that support the QFD are shown in detail in
Appendix A.
Figure 35 - Access-to-space House of Quality
The QFD resulted in the goals being prioritized in the order of Competitiveness, Strategic, and
Commercialization. This ordering seems reasonable in that much of the launch services effort is still
closely linked to national issues that indirectly influence competitiveness from a global perspective.
Public Sector leadership desires to commoditize and commercialize its financial exposure as possible,
Massachusetts Institute of Technology - System Design and Management
64
which better aligns with its methods of funding. However, this induces complications in terms of its real
ability to actually commercialize much of its efforts.
When considering the correlation between the “What’s” and “How’s,” the number one item was
Customer Relationship Management, with a score of 7.75. This reflects an imperative desire, on the part
of both the Government and the Contractors, to service one another. The roles are dynamic as the
acquisition process and PD lifecycle are accomplished. Next, is the realization that complex system
development, in the access-to-space market, must have market pull (score of 6.79) in order to be
successful. Third, is the recognition that the strategies of the customer and supplier must be in agreement
(score of 6.51) in order for partnering and cooperative relationships to result in successful efforts.
Indemnification, appropriate MOE and return on investment compatibility, all tied with scores of 5.57 and
reflect the notion that MOE’s, used to determine success, must be commensurate with the situation and
environment, and may indicate a need for the development and implementation of a more appropriate set
of measures. This is also consistent with the concept of changing the mental models. [36]
Last of the top five is Requirements Management. This staple of solid P/P management is still
recognized as critical to controlling cost and schedule , but more so for shoring up the communications
effort.
The roof portion is where the implementation How’s are reviewed for potential conflicts with
other How’s. This reflects only those situations where weak or strong conflict potential might exist. It
resulted in two clusters: (1) stemming from the influence of organizational vision and behavior
modification on a number of other How’s that address goals/objectives, strategies and measures of
performance and (2) represents the balance that must be maintained in order to be an effective and viable
activity, when considering customer/stakeholder strategies and how well the P/P aligns with them. These
are due to changes in organizational vision and behavior that would devalue existing knowledge and
introduce risks associated with the customer/supplier relationship where assurances must be conveyed. In
addition, how well the MOE and in particular profitability metrics, align to best provide insight to the
situation or opportunity. All of this is contingent upon the customer/stakeholders’ ability to establish and
Massachusetts Institute of Technology - System Design and Management
65
convey the compelling need. This may not align well with the thinking of the suppliers and make for a
difficult relationship.
When considering the Product Development Values developed by Chase, a correlation to goals in
the order of activity efficiency, activity quality, communication, risk and information was shown. This
also maintained the same goals priorities mentioned earlier. It is also consistent with the intent of the
Servqual model where quality and efficiency should be dominant and the result of excellent
communication, management of risk and utilization of information.
The competitive pressures portion looks at the competitors in the launch services market using
information from Reference [28]. This data indicated a significant lead in launch services by the
European Space Agency (ESA). Factors were developed to establish a relationship between the
competitors relative to the goals derived from the data sources. The result is an improvement factor,
which correlates the U.S. position to the leader, in terms of how much improvement is needed. The
indications are that significant effort is required to reach par, relative to the goals of Competitiveness and
Commercialization. Less effort is required when considering strategic issues.
The last section considers the specifics of implementing each of the ‘How’s.” Portions of this
section are intentionally left blank because solutions would be effort specific. The point is to recognize
that issues exist and that the P/P teams should be well aware and take steps to look for solutions that fit
their specific situation and environment, in which the development activity is occurring.
Chapter 6 will address the mapping of the analysis results to the development of the heuristic
model and features proposed previously. It will also demonstrate correlation between the characteristics
and traits of the P/P phase and the service management models.
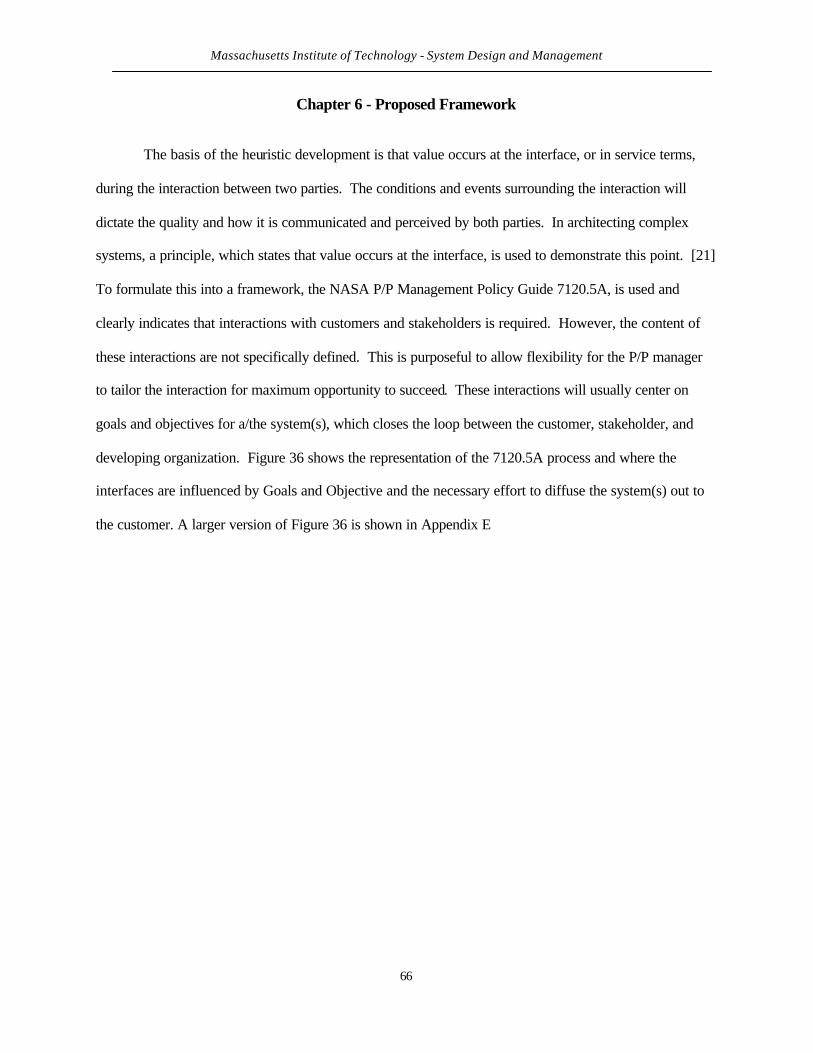
Massachusetts Institute of Technology - System Design and Management
66
Chapter 6 - Proposed Framework
The basis of the heuristic development is that value occurs at the interface, or in service terms,
during the interaction between two parties. The conditions and events surrounding the interaction will
dictate the quality and how it is communicated and perceived by both parties. In architecting complex
systems, a principle, which states that value occurs at the interface, is used to demonstrate this point. [21]
To formulate this into a framework, the NASA P/P Management Policy Guide 7120.5A, is used and
clearly indicates that interactions with customers and stakeholders is required. However, the content of
these interactions are not specifically defined. This is purposeful to allow flexibility for the P/P manager
to tailor the interaction for maximum opportunity to succeed. These interactions will usually center on
goals and objectives for a/the system(s), which closes the loop between the customer, stakeholder, and
developing organization. Figure 36 shows the representation of the 7120.5A process and where the
interfaces are influenced by Goals and Objective and the necessary effort to diffuse the system(s) out to
the customer. A larger version of Figure 36 is shown in Appendix E
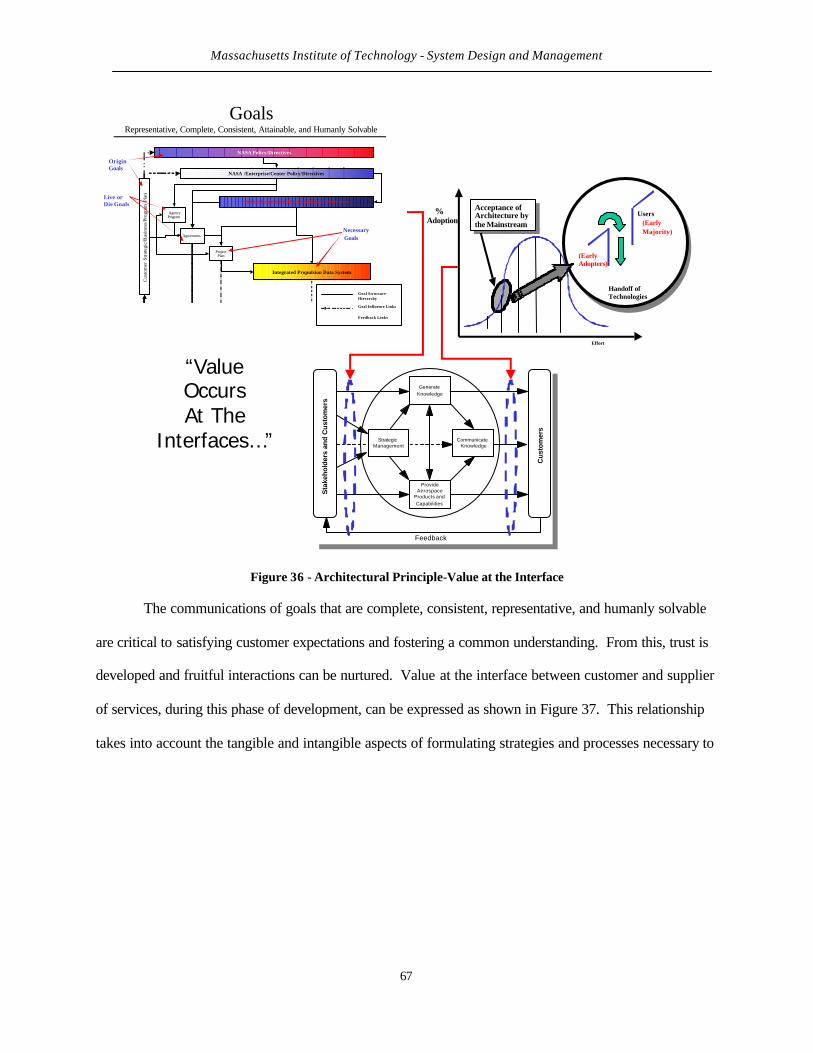
Massachusetts Institute of Technology - System Design and Management
67
GenerateKnowledge
CommunicateKnowledge
StrategicManagement
ProvideAerospace
Products andCapabilities
Sta
keh
old
ers
and
Cu
sto
mer
s
Cu
sto
mer
sFeedback
%Adoption
Effort
Acceptance of
In the Mainstream
Acceptance ofArchitecture bythe Mainstream
(Early Adopters)
Users(EarlyMajority)
Handoff ofTechnologies
GoalsRepresentative, Complete, Consistent, Attainable, and Humanly Solvable
NASA /Enterprise/Center Policy/Directives
NASA Policy/Directives
Cus
tom
er S
trat
egic
/Bus
ines
s/Pr
ogra
m P
lan
Rocket Propulsion Test Lead Center/Directives
Agreements
ProjectPlan
Integrated Propulsion Data System
AgencyProgram
OriginGoals
Live orDie Goals
NecessaryGoals
Goal StructureHierarchy
Goal Influence Links
Feedback Links
“ValueOccursAt The
Interfaces…”
Figure 36 - Architectural Principle-Value at the Interface
The communications of goals that are complete, consistent, representative, and humanly solvable
are critical to satisfying customer expectations and fostering a common understanding. From this, trust is
developed and fruitful interactions can be nurtured. Value at the interface between customer and supplier
of services, during this phase of development, can be expressed as shown in Figure 37. This relationship
takes into account the tangible and intangible aspects of formulating strategies and processes necessary to
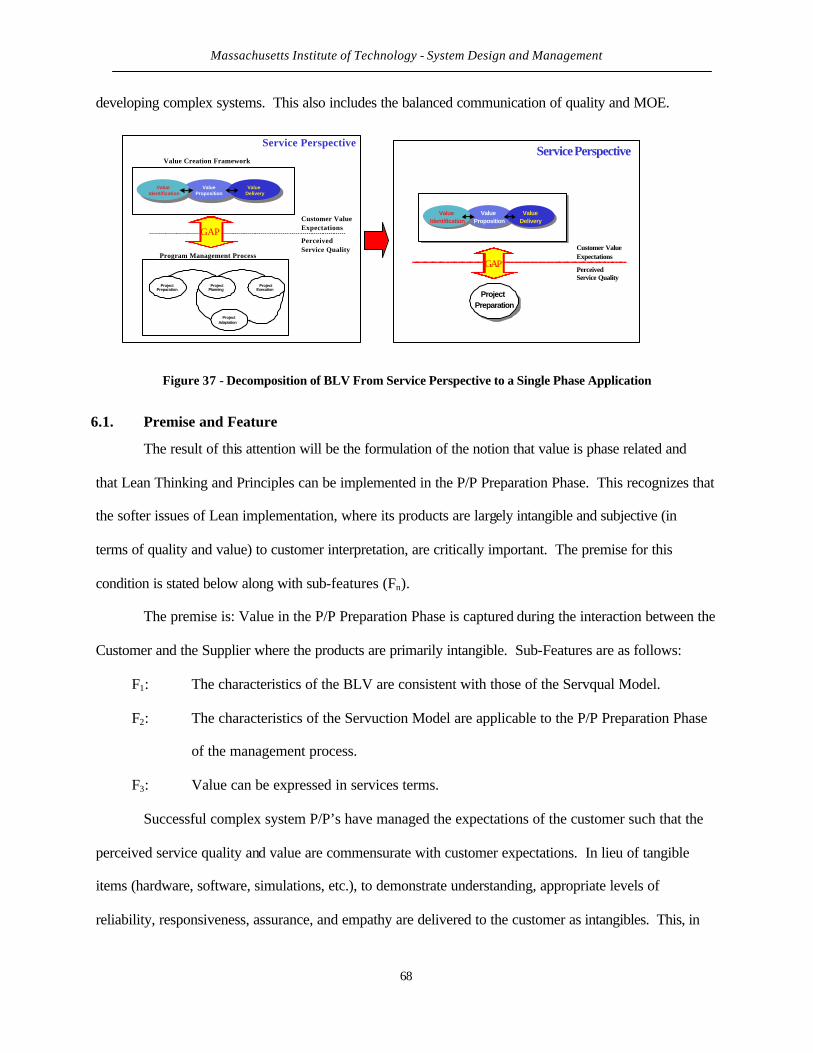
Massachusetts Institute of Technology - System Design and Management
68
developing complex systems. This also includes the balanced communication of quality and MOE.
Value Proposition
Value Proposition
Value Identification
Value Identification
Value Delivery
Value Delivery
Value Creation Framework
ProjectPreparation
ProjectPlanning
ProjectExecution
ProjectAdaptation
Program Management Process
GAP
Service Perspective
Customer ValueExpectations
PerceivedService Quality
Service Perspective
Customer ValueExpectations
PerceivedService Quality
Value Proposition
Value Proposition
Value Identification
Value Identification
Value Delivery
Value Delivery
ProjectPreparation
GAP
Figure 37 - Decomposition of BLV From Service Perspective to a Single Phase Application
6.1. Premise and Feature
The result of this attention will be the formulation of the notion that value is phase related and
that Lean Thinking and Principles can be implemented in the P/P Preparation Phase. This recognizes that
the softer issues of Lean implementation, where its products are largely intangible and subjective (in
terms of quality and value) to customer interpretation, are critically important. The premise for this
condition is stated below along with sub-features (Fn).
The premise is: Value in the P/P Preparation Phase is captured during the interaction between the
Customer and the Supplier where the products are primarily intangible. Sub-Features are as follows:
F1: The characteristics of the BLV are consistent with those of the Servqual Model.
F2: The characteristics of the Servuction Model are applicable to the P/P Preparation Phase
of the management process.
F3: Value can be expressed in services terms.
Successful complex system P/P’s have managed the expectations of the customer such that the
perceived service quality and value are commensurate with customer expectations. In lieu of tangible
items (hardware, software, simulations, etc.), to demonstrate understanding, appropriate levels of
reliability, responsiveness, assurance, and empathy are delivered to the customer as intangibles. This, in
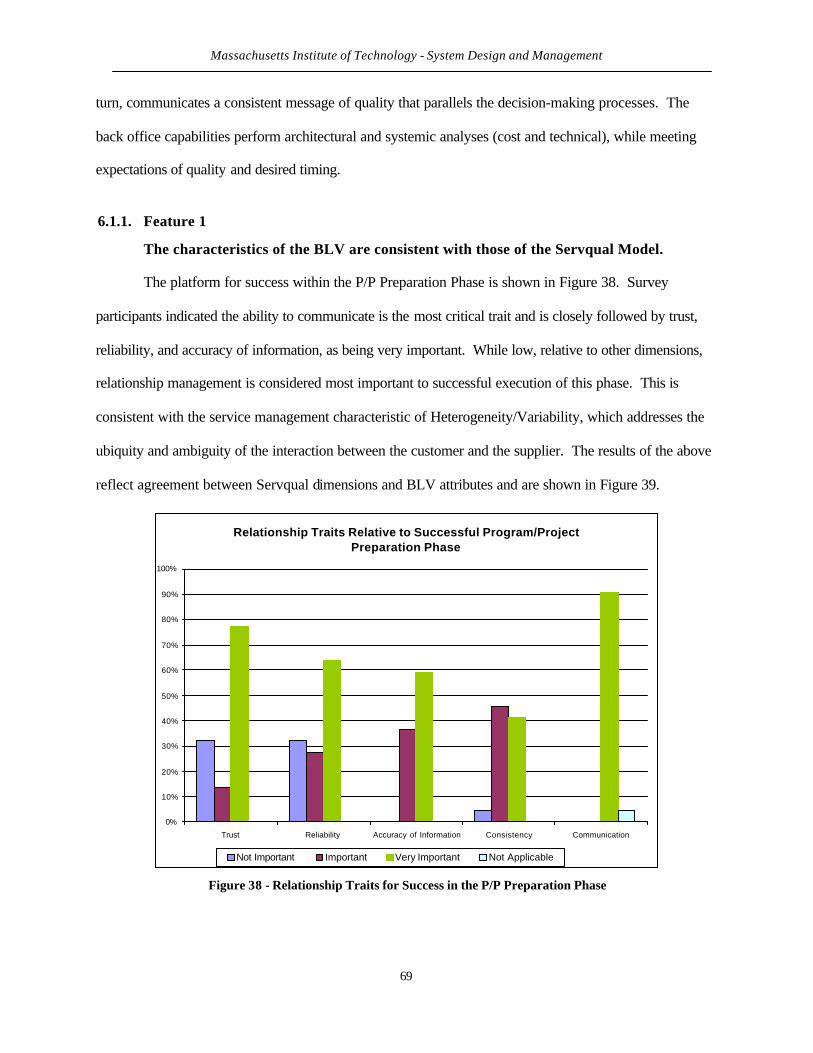
Massachusetts Institute of Technology - System Design and Management
69
turn, communicates a consistent message of quality that parallels the decision-making processes. The
back office capabilities perform architectural and systemic analyses (cost and technical), while meeting
expectations of quality and desired timing.
6.1.1. Feature 1
The characteristics of the BLV are consistent with those of the Servqual Model.
The platform for success within the P/P Preparation Phase is shown in Figure 38. Survey
participants indicated the ability to communicate is the most critical trait and is closely followed by trust,
reliability, and accuracy of information, as being very important. While low, relative to other dimensions,
relationship management is considered most important to successful execution of this phase. This is
consistent with the service management characteristic of Heterogeneity/Variability, which addresses the
ubiquity and ambiguity of the interaction between the customer and the supplier. The results of the above
reflect agreement between Servqual dimensions and BLV attributes and are shown in Figure 39.
Relationship Traits Relative to Successful Program/Project Preparation Phase
0%
10%
20%
30%
40%
50%
60%
70%
80%
90%
100%
Trust Reliability Accuracy of Information Consistency Communication
Not Important Important Very Important Not Applicable
Figure 38 - Relationship Traits for Success in the P/P Preparation Phase
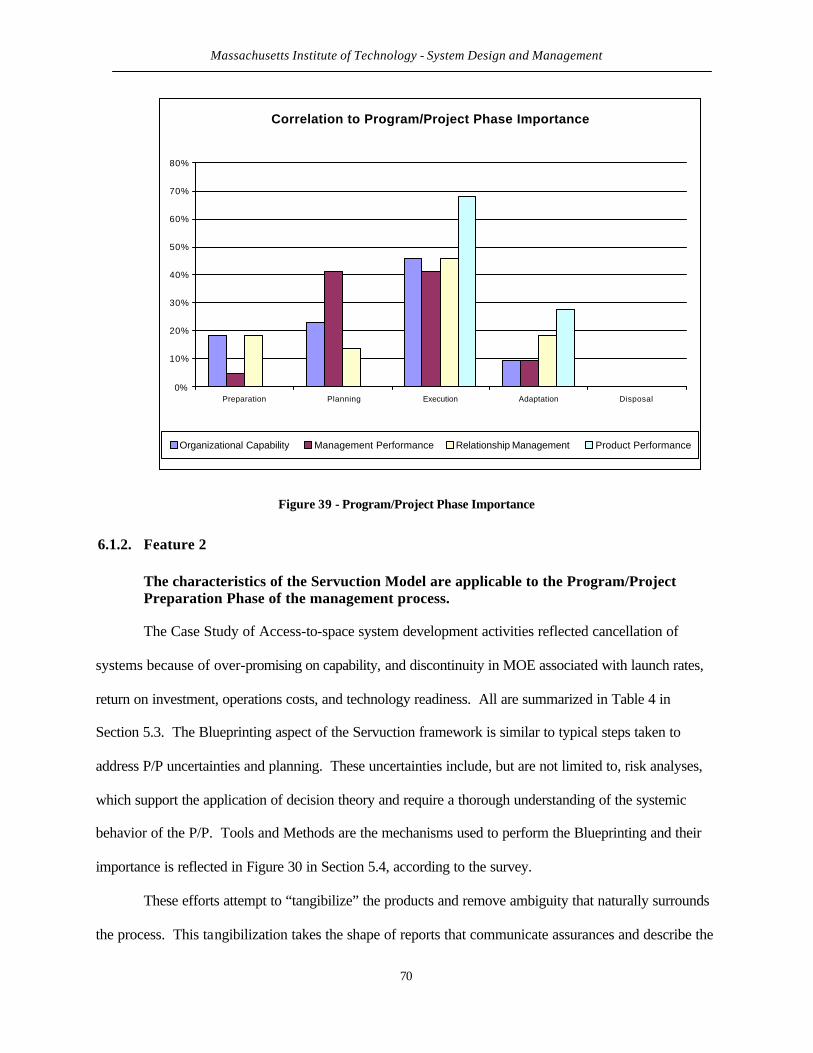
Massachusetts Institute of Technology - System Design and Management
70
Correlation to Program/Project Phase Importance
0%
10%
20%
30%
40%
50%
60%
70%
80%
Preparation Planning Execution Adaptation Disposal
Organizational Capability Management Performance Relationship Management Product Performance
Figure 39 - Program/Project Phase Importance
6.1.2. Feature 2
The characteristics of the Servuction Model are applicable to the Program/Project Preparation Phase of the management process.
The Case Study of Access-to-space system development activities reflected cancellation of
systems because of over-promising on capability, and discontinuity in MOE associated with launch rates,
return on investment, operations costs, and technology readiness. All are summarized in Table 4 in
Section 5.3. The Blueprinting aspect of the Servuction framework is similar to typical steps taken to
address P/P uncertainties and planning. These uncertainties include, but are not limited to, risk analyses,
which support the application of decision theory and require a thorough understanding of the systemic
behavior of the P/P. Tools and Methods are the mechanisms used to perform the Blueprinting and their
importance is reflected in Figure 30 in Section 5.4, according to the survey.
These efforts attempt to “tangibilize” the products and remove ambiguity that naturally surrounds
the process. This tangibilization takes the shape of reports that communicate assurances and describe the
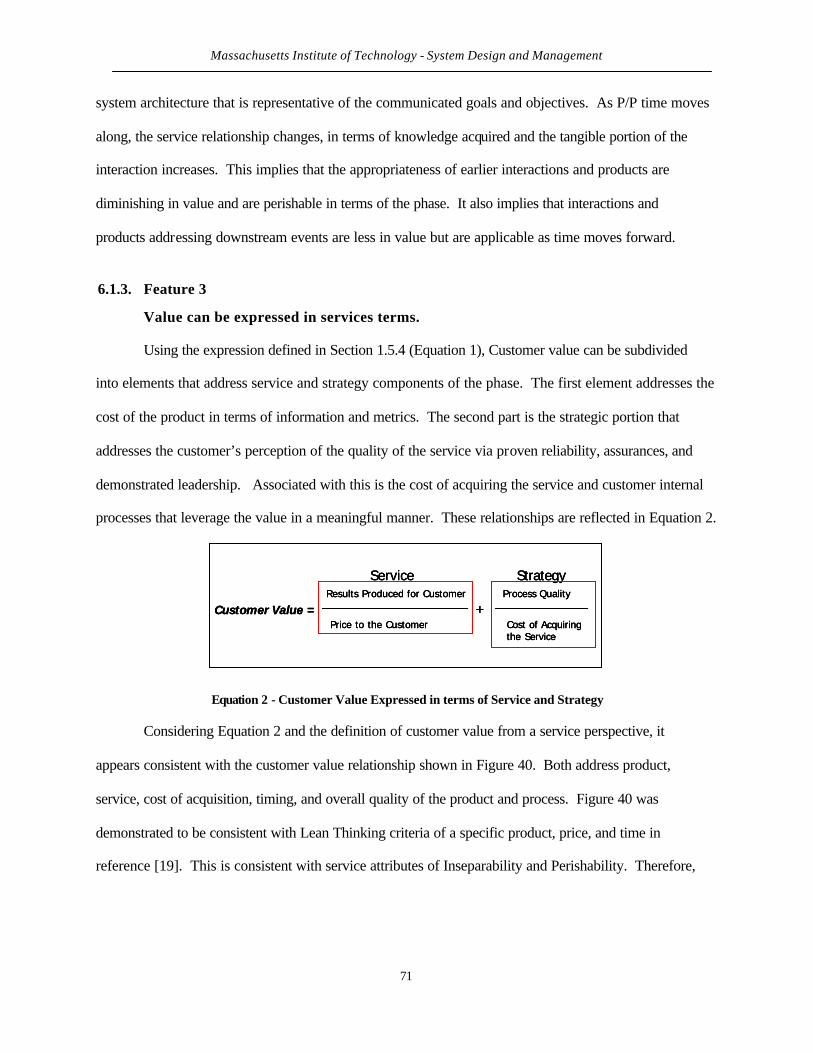
Massachusetts Institute of Technology - System Design and Management
71
system architecture that is representative of the communicated goals and objectives. As P/P time moves
along, the service relationship changes, in terms of knowledge acquired and the tangible portion of the
interaction increases. This implies that the appropriateness of earlier interactions and products are
diminishing in value and are perishable in terms of the phase. It also implies that interactions and
products addressing downstream events are less in value but are applicable as time moves forward.
6.1.3. Feature 3
Value can be expressed in services terms.
Using the expression defined in Section 1.5.4 (Equation 1), Customer value can be subdivided
into elements that address service and strategy components of the phase. The first element addresses the
cost of the product in terms of information and metrics. The second part is the strategic portion that
addresses the customer’s perception of the quality of the service via proven reliability, assurances, and
demonstrated leadership. Associated with this is the cost of acquiring the service and customer internal
processes that leverage the value in a meaningful manner. These relationships are reflected in Equation 2.
StrategyService
Customer Value =Results Produced for Customer
Price to the Customer+
Process Quality
Cost of Acquiringthe Service
StrategyService
Customer Value =Results Produced for Customer
Price to the Customer+
Process Quality
Cost of Acquiringthe Service
StrategyService
Customer Value =Results Produced for Customer
Price to the Customer+
Process Quality
Cost of Acquiringthe Service
Equation 2 - Customer Value Expressed in terms of Service and Strategy
Considering Equation 2 and the definition of customer value from a service perspective, it
appears consistent with the customer value relationship shown in Figure 40. Both address product,
service, cost of acquisition, timing, and overall quality of the product and process. Figure 40 was
demonstrated to be consistent with Lean Thinking criteria of a specific product, price, and time in
reference [19]. This is consistent with service attributes of Inseparability and Perishability. Therefore,
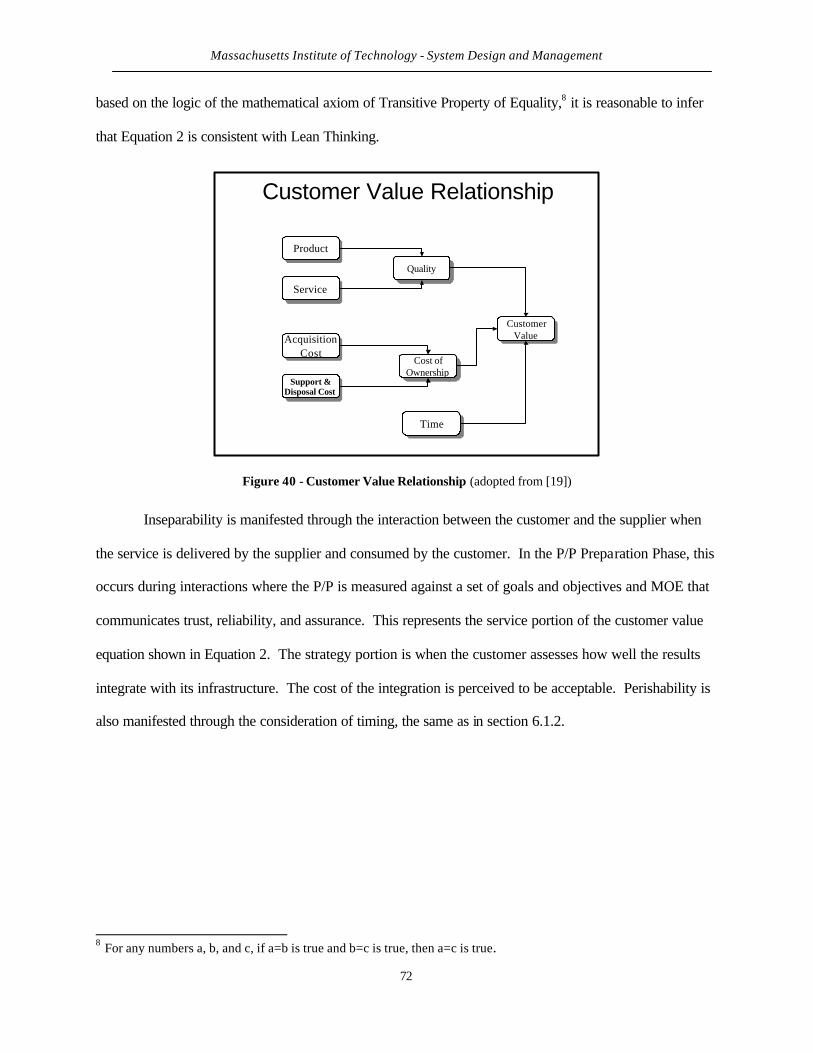
Massachusetts Institute of Technology - System Design and Management
72
based on the logic of the mathematical axiom of Transitive Property of Equality,8 it is reasonable to infer
that Equation 2 is consistent with Lean Thinking.
ProductProduct
ServiceService
Support &Disposal Cost
Support &Disposal Cost
AcquisitionCost
AcquisitionCost
TimeTime
Cost ofOwnership
Cost ofOwnership
QualityQuality
CustomerValue
CustomerValue
Customer Value Relationship
Figure 40 - Customer Value Relationship (adopted from [19])
Inseparability is manifested through the interaction between the customer and the supplier when
the service is delivered by the supplier and consumed by the customer. In the P/P Preparation Phase, this
occurs during interactions where the P/P is measured against a set of goals and objectives and MOE that
communicates trust, reliability, and assurance. This represents the service portion of the customer value
equation shown in Equation 2. The strategy portion is when the customer assesses how well the results
integrate with its infrastructure. The cost of the integration is perceived to be acceptable. Perishability is
also manifested through the consideration of timing, the same as in section 6.1.2.
8 For any numbers a, b, and c, if a=b is true and b=c is true, then a=c is true.

Massachusetts Institute of Technology - System Design and Management
73
Correlation of Program/Project Phases to Product State of Tangible vs Intangible
0%
10%
20%
30%
40%
50%
60%
70%
Preparation Planning Execution Adaptation Disposal
Intangible Mix of Both Tangible and Intangible Tangible Not Applicable
Figure 41 - P/P Phase Product Correlation.
The concept of phase-related value is based upon acceptance of the notion that Equation 2 is a
valid representation of value in Lean Thinking and Principles terms. This includes the characteristic of
Perishability and Heterogeneity/Variability, which correlates to timing, as noted by Slack. Therefore,
using the logic of the mathematical axiom of The Distributive Law of Multiplication over Addition, it is
reasonable to apply the Value Creation Framework on a P/P Phase-related basis. This is consistent with
the survey results shown in Figure 41 and Figure 39 of Section 6.1.1.
6.2. Gap Correlation
By managing the Servqual model gaps of expectations, perceptions and consistent
communication, perceived value is delivered given the fact that no system hardware exists. The case
study on Access-to-space was used to develop corresponding Gap management issues for the cancelled
programs. Additional insight was applied from the executive interviews and review of Congressional
records. The relationships used for this correlation are those conditions where the Private Sector is
providing services to the Government, and Congress is playing the role of customer/stakeholder. The
Massachusetts Institute of Technology - System Design and Management
74
other scenario is the condition where the Government is providing services to the Private Sector and
Congress is playing the role of stakeholder (to a lesser influential position). For the systems considered,
the end user is usually not the recipient of the services provided. The Gaps address Customer
Expectations, Quality Standards, Performance, and the Mismatch between Promises and the Delivery
Service. Details of these correlations can be found in Appendix D.
6.2.1. Gap – 1, Customer Expectations
Gap-1 issues included inconsistencies in goals and objective setting that lead to discontinuity
between the expectations of the customer/stakeholder and perceptions of quality provided by the supplier
of the services. Using reports and other secondary means of contact, manager’s understanding of
customer reality can fall short of the desired mark. This is especially true of organizations like the U.S.
Government and the convoluted role it plays as customer and stakeholder. The lack of direct interaction
with the Developmental Agency P/P team and general public further complicates the relationship and the
issues that make this Gap difficult to close. Developmental Agency P/P managers and their support
contractors are disadvantaged in that interactions with its powerful customer/stakeholder (Congress) are
akin to command performances and usually are negative in purpose. They are further disadvantaged by
the fact that communication is via secondary monitoring organizations (e.g., Congressional Committees,
OMB, OIG, GAO, etc.)9. This naturally allows the potential for a confrontational relationship (e.g., if the
P/P Manager or management team is not a strong and seasoned). The P/P team must remain sensitive to
customer/stakeholder needs variation in order to be responsive, given the dynamics of the political
environment. Hence, success is not based on technical correctness or accuracy, but on perceptions and
votes. A summary is shown in Figure 42.
9 Office of the Inspector General (OIG), Office of Management and Budget (OMB), Government Accounting Office (GAO)
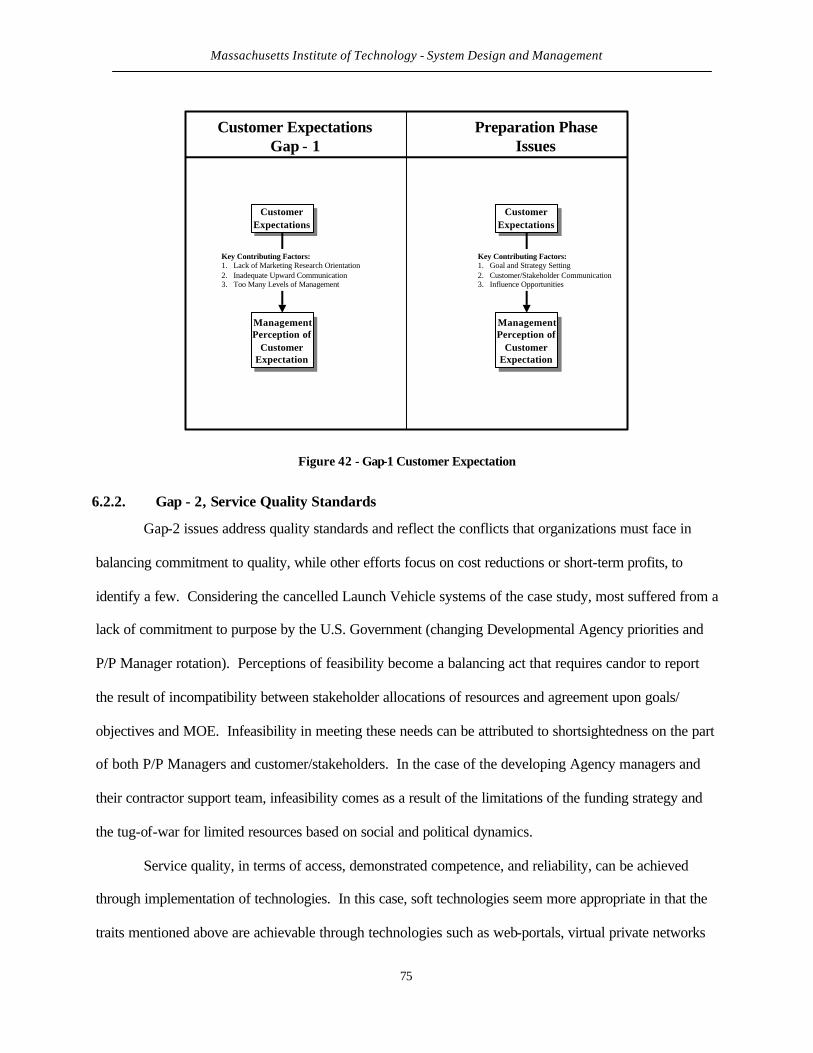
Massachusetts Institute of Technology - System Design and Management
75
CustomerExpectations
CustomerExpectations
ManagementPerception of
CustomerExpectation
ManagementPerception of
CustomerExpectation
Key Contributing Factors:1. Lack of Marketing Research Orientation2. Inadequate Upward Communication3. Too Many Levels of Management
CustomerExpectations
CustomerExpectations
ManagementPerception of
CustomerExpectation
ManagementPerception of
CustomerExpectation
Key Contributing Factors:1. Goal and Strategy Setting2. Customer/Stakeholder Communication3. Influence Opportunities
Customer ExpectationsGap - 1
Preparation PhaseIssues
Figure 42 - Gap-1 Customer Expectation
6.2.2. Gap - 2, Service Quality Standards
Gap-2 issues address quality standards and reflect the conflicts that organizations must face in
balancing commitment to quality, while other efforts focus on cost reductions or short-term profits, to
identify a few. Considering the cancelled Launch Vehicle systems of the case study, most suffered from a
lack of commitment to purpose by the U.S. Government (changing Developmental Agency priorities and
P/P Manager rotation). Perceptions of feasibility become a balancing act that requires candor to report
the result of incompatibility between stakeholder allocations of resources and agreement upon goals/
objectives and MOE. Infeasibility in meeting these needs can be attributed to shortsightedness on the part
of both P/P Managers and customer/stakeholders. In the case of the developing Agency managers and
their contractor support team, infeasibility comes as a result of the limitations of the funding strategy and
the tug-of-war for limited resources based on social and political dynamics.
Service quality, in terms of access, demonstrated competence, and reliability, can be achieved
through implementation of technologies. In this case, soft technologies seem more appropriate in that the
traits mentioned above are achievable through technologies such as web-portals, virtual private networks
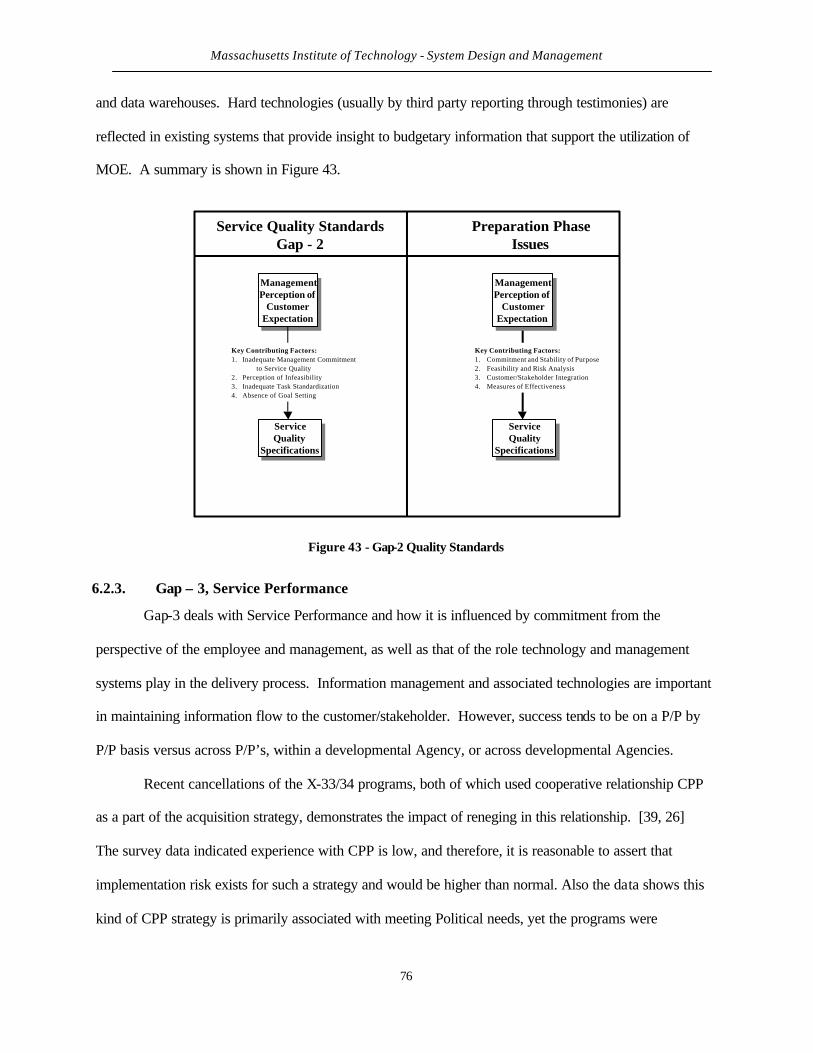
Massachusetts Institute of Technology - System Design and Management
76
and data warehouses. Hard technologies (usually by third party reporting through testimonies) are
reflected in existing systems that provide insight to budgetary information that support the utilization of
MOE. A summary is shown in Figure 43.
ServiceQuality
Specifications
ServiceQuality
Specifications
ManagementPerception of
CustomerExpectation
ManagementPerception of
CustomerExpectation
Key Contributing Factors:1. Inadequate Management Commitment
to Service Quality2. Perception of Infeasibility3. Inadequate Task Standardization4. Absence of Goal Setting
Key Contributing Factors:1. Commitment and Stability of Purpose2. Feasibility and Risk Analysis3. Customer/Stakeholder Integration4. Measures of Effectiveness
Service Quality StandardsGap - 2
Preparation PhaseIssues
ManagementPerception of
CustomerExpectation
ManagementPerception of
CustomerExpectation
ServiceQuality
Specifications
ServiceQuality
Specifications
Figure 43 - Gap-2 Quality Standards
6.2.3. Gap – 3, Service Performance
Gap-3 deals with Service Performance and how it is influenced by commitment from the
perspective of the employee and management, as well as that of the role technology and management
systems play in the delivery process. Information management and associated technologies are important
in maintaining information flow to the customer/stakeholder. However, success tends to be on a P/P by
P/P basis versus across P/P’s, within a developmental Agency, or across developmental Agencies.
Recent cancellations of the X-33/34 programs, both of which used cooperative relationship CPP
as a part of the acquisition strategy, demonstrates the impact of reneging in this relationship. [39, 26]
The survey data indicated experience with CPP is low, and therefore, it is reasonable to assert that
implementation risk exists for such a strategy and would be higher than normal. Also the data shows this
kind of CPP strategy is primarily associated with meeting Political needs, yet the programs were
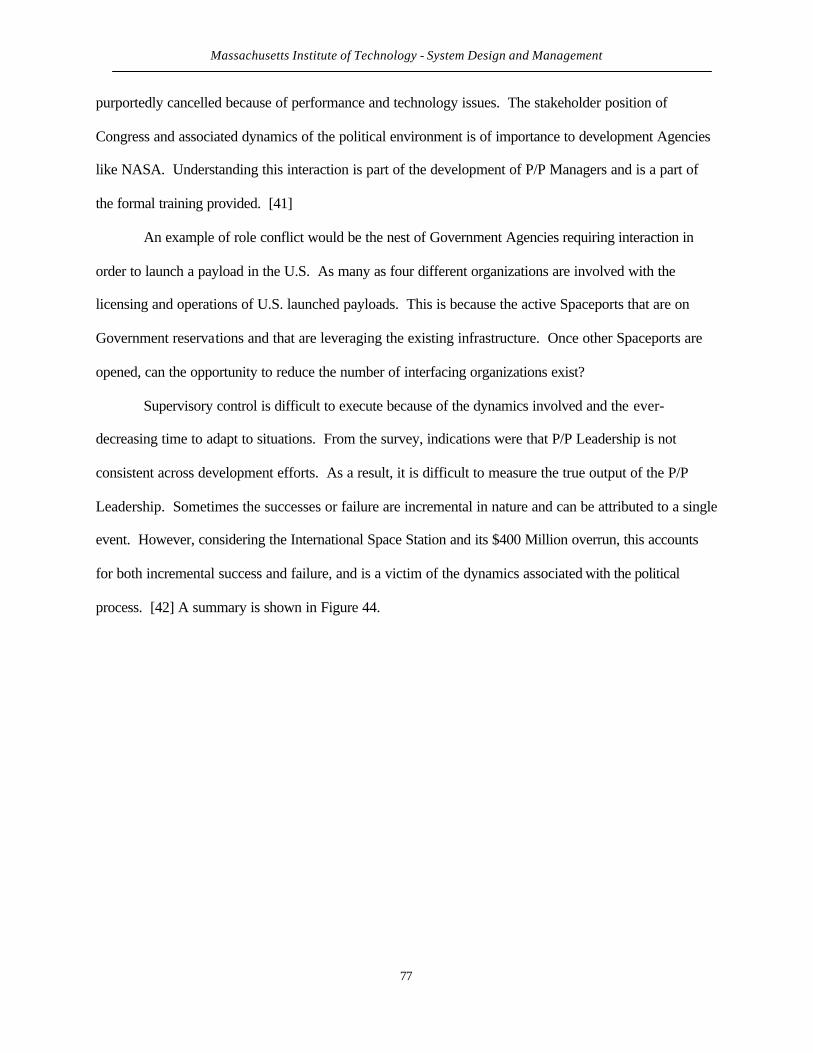
Massachusetts Institute of Technology - System Design and Management
77
purportedly cancelled because of performance and technology issues. The stakeholder position of
Congress and associated dynamics of the political environment is of importance to development Agencies
like NASA. Understanding this interaction is part of the development of P/P Managers and is a part of
the formal training provided. [41]
An example of role conflict would be the nest of Government Agencies requiring interaction in
order to launch a payload in the U.S. As many as four different organizations are involved with the
licensing and operations of U.S. launched payloads. This is because the active Spaceports that are on
Government reservations and that are leveraging the existing infrastructure. Once other Spaceports are
opened, can the opportunity to reduce the number of interfacing organizations exist?
Supervisory control is difficult to execute because of the dynamics involved and the ever-
decreasing time to adapt to situations. From the survey, indications were that P/P Leadership is not
consistent across development efforts. As a result, it is difficult to measure the true output of the P/P
Leadership. Sometimes the successes or failure are incremental in nature and can be attributed to a single
event. However, considering the International Space Station and its $400 Million overrun, this accounts
for both incremental success and failure, and is a victim of the dynamics associated with the political
process. [42] A summary is shown in Figure 44.
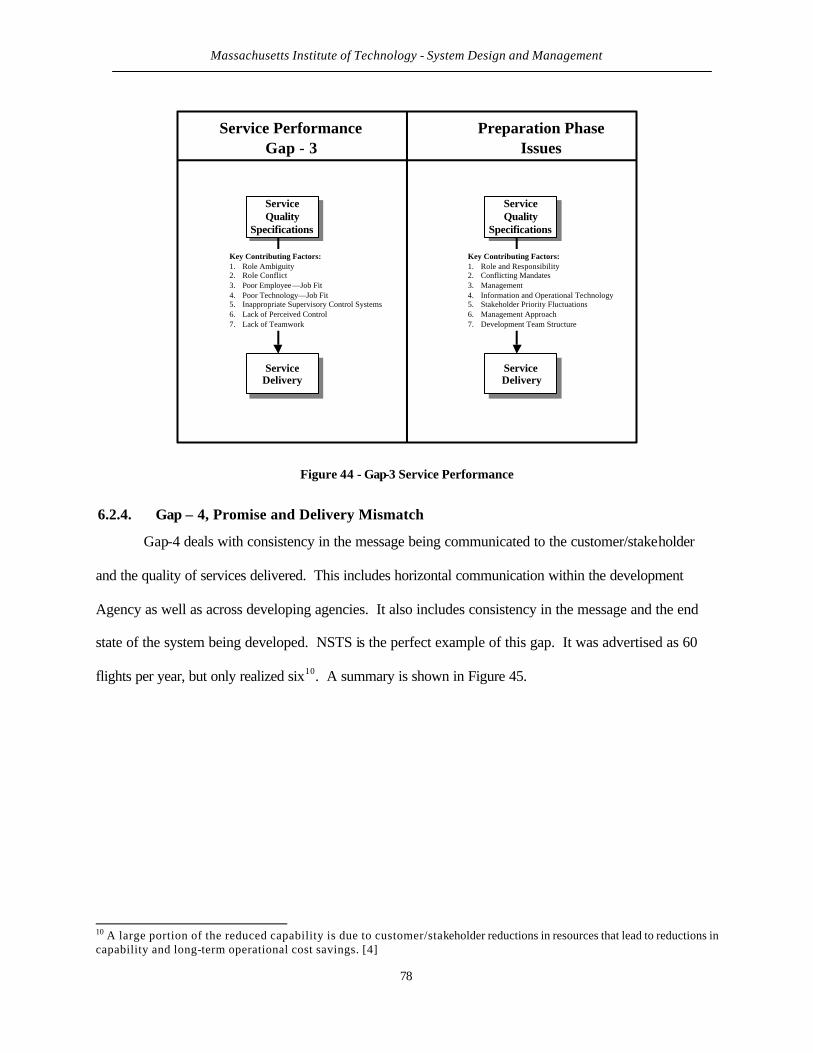
Massachusetts Institute of Technology - System Design and Management
78
ServiceQuality
Specifications
ServiceQuality
Specifications
Key Contributing Factors:1. Role Ambiguity2. Role Conflict3. Poor Employee—Job Fit4. Poor Technology—Job Fit5. Inappropriate Supervisory Control Systems6. Lack of Perceived Control7. Lack of Teamwork
Service PerformanceGap - 3
Preparation PhaseIssues
ServiceDelivery
ServiceDelivery
ServiceQuality
Specifications
ServiceQuality
Specifications
Key Contributing Factors:1. Role and Responsibility2. Conflicting Mandates3. Management4. Information and Operational Technology5. Stakeholder Priority Fluctuations6. Management Approach7. Development Team Structure
ServiceDelivery
ServiceDelivery
Figure 44 - Gap-3 Service Performance
6.2.4. Gap – 4, Promise and Delivery Mismatch
Gap-4 deals with consistency in the message being communicated to the customer/stakeholder
and the quality of services delivered. This includes horizontal communication within the development
Agency as well as across developing agencies. It also includes consistency in the message and the end
state of the system being developed. NSTS is the perfect example of this gap. It was advertised as 60
flights per year, but only realized six10. A summary is shown in Figure 45.
10 A large portion of the reduced capability is due to customer/stakeholder reductions in resources that lead to reductions in capability and long-term operational cost savings. [4]
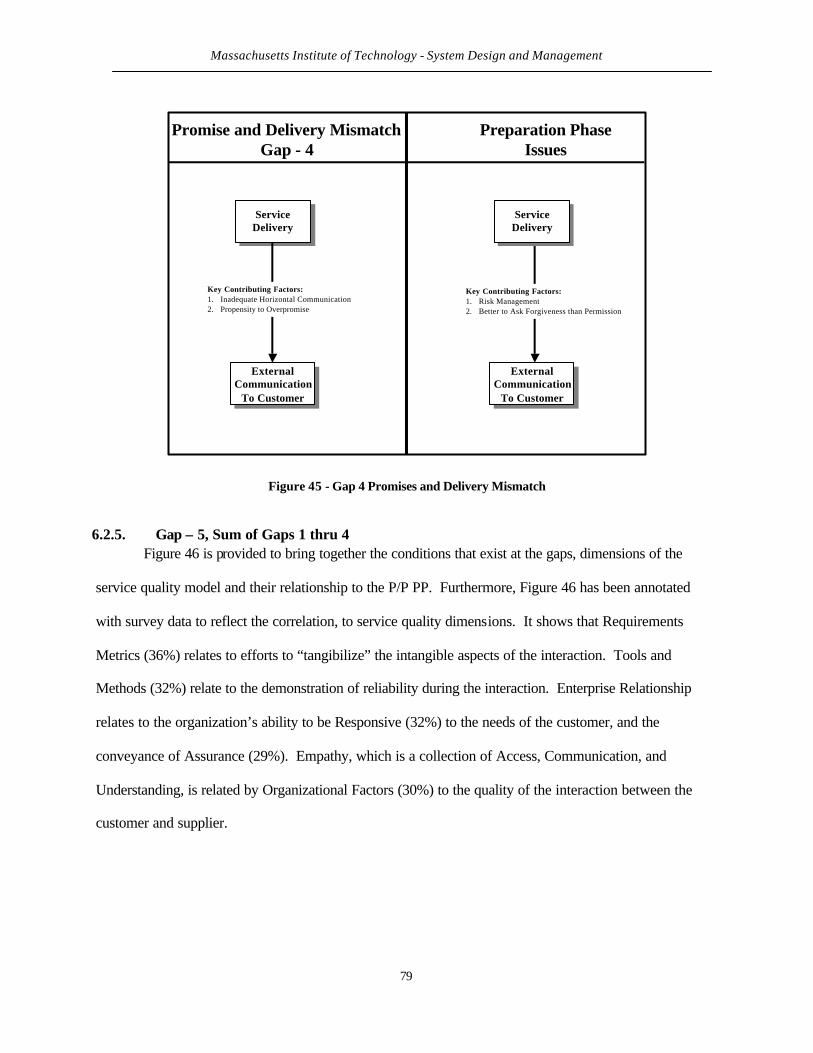
Massachusetts Institute of Technology - System Design and Management
79
Promise and Delivery MismatchGap - 4
Preparation PhaseIssues
ServiceDelivery
ServiceDelivery
Key Contributing Factors:1. Inadequate Horizontal Communication2. Propensity to Overpromise
ExternalCommunication
To Customer
ExternalCommunication
To Customer
ServiceDelivery
ServiceDelivery
ExternalCommunication
To Customer
ExternalCommunication
To Customer
Key Contributing Factors:1. Risk Management2. Better to Ask Forgiveness than Permission
Figure 45 - Gap 4 Promises and Delivery Mismatch
6.2.5. Gap – 5, Sum of Gaps 1 thru 4 Figure 46 is provided to bring together the conditions that exist at the gaps, dimensions of the
service quality model and their relationship to the P/P PP. Furthermore, Figure 46 has been annotated
with survey data to reflect the correlation, to service quality dimensions. It shows that Requirements
Metrics (36%) relates to efforts to “tangibilize” the intangible aspects of the interaction. Tools and
Methods (32%) relate to the demonstration of reliability during the interaction. Enterprise Relationship
relates to the organization’s ability to be Responsive (32%) to the needs of the customer, and the
conveyance of Assurance (29%). Empathy, which is a collection of Access, Communication, and
Understanding, is related by Organizational Factors (30%) to the quality of the interaction between the
customer and supplier.
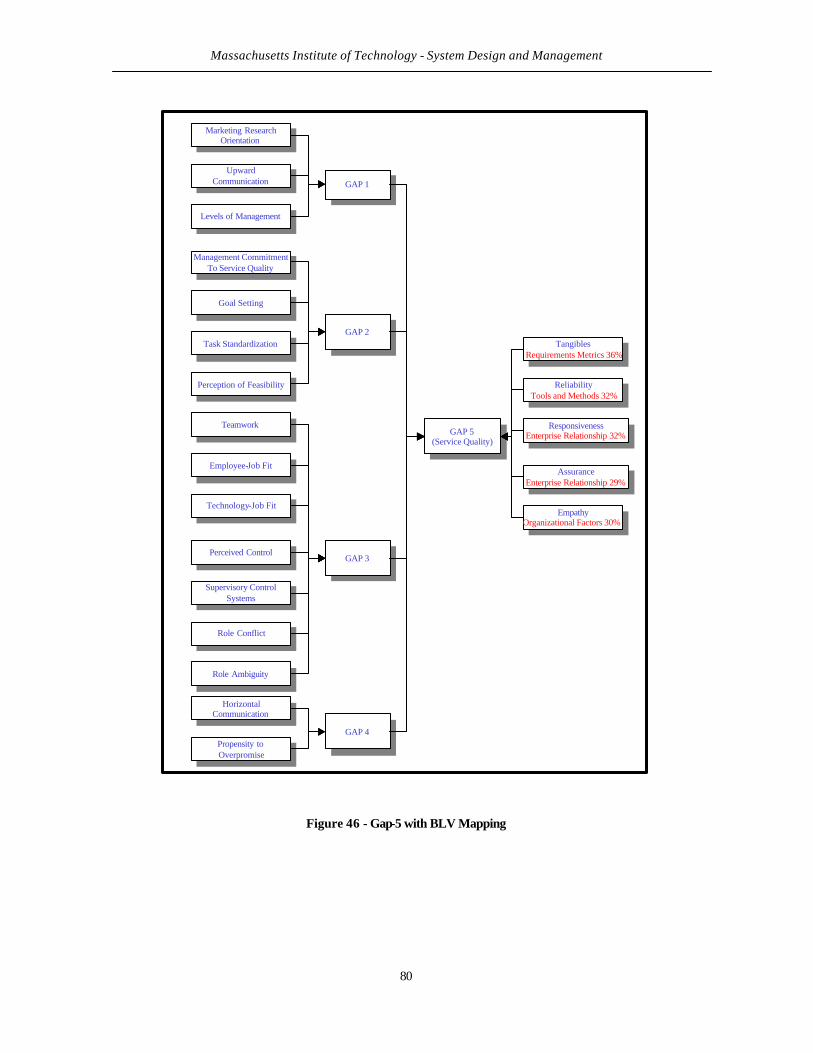
Massachusetts Institute of Technology - System Design and Management
80
Marketing ResearchOrientation
Marketing ResearchOrientation
UpwardCommunication
UpwardCommunication
Levels of ManagementLevels of Management
Management CommitmentTo Service Quality
Management CommitmentTo Service Quality
Goal SettingGoal Setting
Task StandardizationTask Standardization
Perception of FeasibilityPerception of Feasibility
GAP 1GAP 1
GAP 2GAP 2
TeamworkTeamwork
Employee-Job FitEmployee-Job Fit
Technology-Job FitTechnology-Job Fit
Perceived ControlPerceived Control
Supervisory ControlSystems
Supervisory ControlSystems
Role ConflictRole Conflict
Role AmbiguityRole Ambiguity
HorizontalCommunication
HorizontalCommunication
Propensity toOverpromise
Propensity toOverpromise
GAP 3GAP 3
GAP 4GAP 4
GAP 5(Service Quality)
GAP 5(Service Quality)
TangiblesRequirements Metrics 36%
TangiblesRequirements Metrics 36%
ReliabilityTools and Methods 32%
ReliabilityTools and Methods 32%
ResponsivenessEnterprise Relationship 32%
ResponsivenessEnterprise Relationship 32%
AssuranceEnterprise Relationship 29%
AssuranceEnterprise Relationship 29%
EmpathyOrganizational Factors 30%
EmpathyOrganizational Factors 30%
Figure 46 - Gap-5 with BLV Mapping
Massachusetts Institute of Technology - System Design and Management
81
6.3. Summary
The P/P Preparation Phase exist for the purpose of coalescing ideas, concepts, and goals into a
cohesive set of behaviors and processes that result in a product that the customer/stakeholder find
valuable. The previous sections bring together the notion that this phase of complex system development
can be managed using the frameworks of the service management industry. This is of particular
importance when considering the access-to-space infrastructure and its repeated efforts to develop new
systems. The majority of the efforts undertaken failed to mature beyond the early stages of the
development lifecycle. Consequently, the systems employed today are based on Post WWII ballistic
missile, staged architectures.
Stanke and Slack demonstrated what constitutes value throughout the PD lifecycle. Both resulted
in frameworks and models that are well grounded in Lean Thinking and Principles, but do not address a
phase-based relationship to value. Given the case study of U.S. access-to-space vehicle development
cancellations, there is need to better understand value as a function of PD phase. Obviously, value of the
end product was recognized and viewed sufficient to make resources available to support the initiation of
a development effort. However, with so many cancellations, in such a relatively short time frame,
indicates that value is not solely based on the end product, but is phase related once the overall concept
value is accepted. Therefore, the Value Creation Frame Work presented by Stanke is reasonable for
phase-based application. [8, 19]
Slack introduces the concept of customer value relationship, which brings aspects of quality, cost,
and timing to bear on the PD lifecycle. Slack’s perspective on Lean value in the PD lifecycle captures
Quality via the product or service itself, cost in terms acquisition and support costs and finally timing in
terms of market conditions. [19] This thesis brings these two concepts together and applying them to the
P/P Preparation Phase. Then adding the notion of value being phase related, brings to mind the concept
that a “gap” exists between these approaches to value and the phases of the PD lifecycle. Subsequently
the question arises of how can these two concepts of value be related such as to afford the greatest
opportunity for success during the P/P Preparation Phase.
Massachusetts Institute of Technology - System Design and Management
82
The “gap” between the Value Capture Framework and the phases of the PD lifecycle can be
viewed as service oriented and managed via the application of Management of Services models. These
models provide a framework that embraces the intangible nature of the products resulting from the P/P
Preparation Phase. Primarily the Servqual model provides a methodology for understanding and
managing the “ gap” between customer expectations and the perceptions of service quality provided by
the supplier. The management of the “gap” includes significant efforts to understand customer needs and
the system that will deliver the service. The model further address identified “gaps” in customer
expectations and supplier perceptions via customer expectations, service quality, service performance,
and consistencies in product and the message delivered to the customer. [9, 11]
The cancelled programs come as the result of perceptions that the need or conditions had changed
or that exogenous decisions have had negative impact on the development effort. This is consistent with
the Rechtin, Maier heuristic approach mentioned earlier, which states, “it’s not the facts, it’s the
perceptions that count”, and that critical issues must be transparent to the political elite.
This thesis has demonstrated that the P/P Phase can be managed using Management of Services
models and techniques. It also emphasizes that the products during this phase are both tangible and
intangible and that the interaction between the customer and the supplier is where value is captured. As a
result, a different set of behavioral emphasis, (including modes of communication, the relationship of
“back-office” activities to overall quality) and recognition of the importance to managing the
customer/supplier relationship. Table 5 summarizes P/P Preparation Phase traits (that reflects the bi-
directionally, U.S. Government/Developing Agency/Contractor relationship) and relates them to the
dimensions of the Service Quality Model.
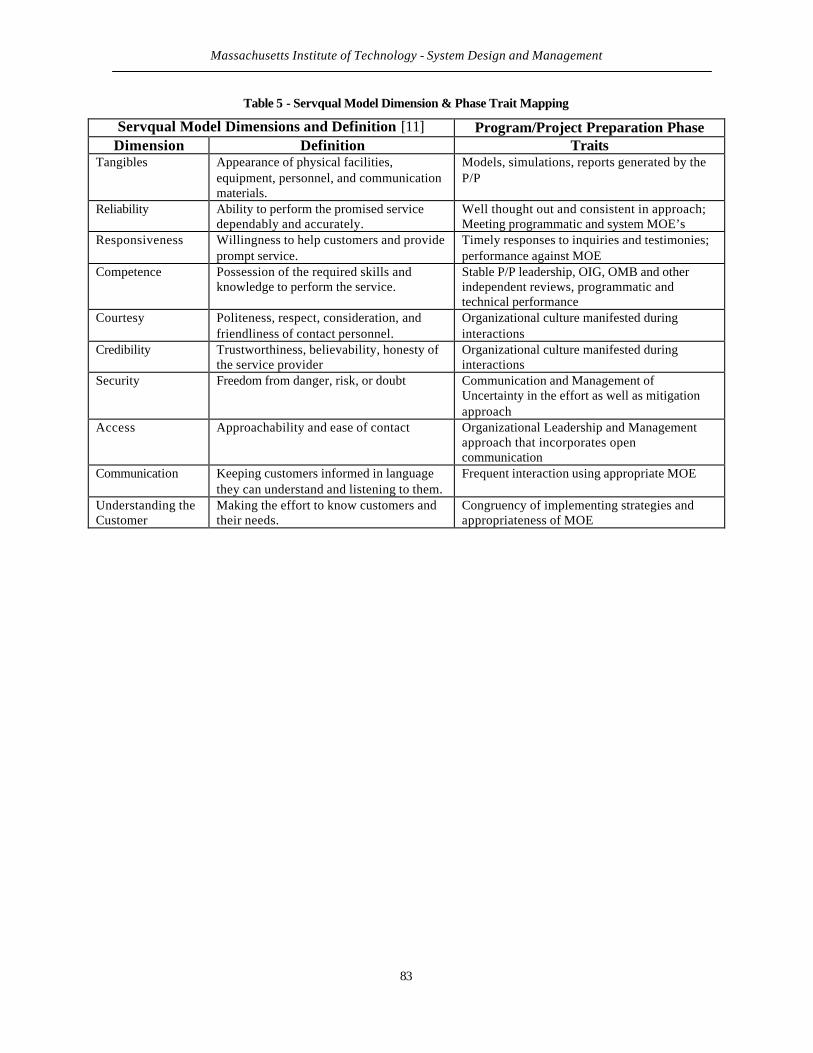
Massachusetts Institute of Technology - System Design and Management
83
Table 5 - Servqual Model Dimension & Phase Trait Mapping
Servqual Model Dimensions and Definition [11] Program/Project Preparation Phase Dimension Definition Traits
Tangibles Appearance of physical facilities, equipment, personnel, and communication materials.
Models, simulations, reports generated by the P/P
Reliability Ability to perform the promised service dependably and accurately.
Well thought out and consistent in approach; Meeting programmatic and system MOE’s
Responsiveness Willingness to help customers and provide prompt service.
Timely responses to inquiries and testimonies; performance against MOE
Competence Possession of the required skills and knowledge to perform the service.
Stable P/P leadership, OIG, OMB and other independent reviews, programmatic and technical performance
Courtesy Politeness, respect, consideration, and friendliness of contact personnel.
Organizational culture manifested during interactions
Credibility Trustworthiness, believability, honesty of the service provider
Organizational culture manifested during interactions
Security Freedom from danger, risk, or doubt Communication and Management of Uncertainty in the effort as well as mitigation approach
Access Approachability and ease of contact Organizational Leadership and Management approach that incorporates open communication
Communication Keeping customers informed in language they can understand and listening to them.
Frequent interaction using appropriate MOE
Understanding the Customer
Making the effort to know customers and their needs.
Congruency of implementing strategies and appropriateness of MOE
Massachusetts Institute of Technology - System Design and Management
84
Chapter 7 - Follow-on Activities
The work of this thesis is by no means exhaustive. As a result, opportunities exist for additional
study. Several have been identified and are briefly addressed in the following paragraphs.
Two Schools of Thought on Applying the Value Capture Framework
The wiser approach to presenting this section is to start with that which is common in the schools
of thought:
1. The interaction between the customer and supplier during any of the phases of P/P management
depends significantly on what are called “soft” issues. These issues include communication,
impressions, expectations, and feelings of assurance, demonstrated competence, and reliability.
2. Especially during the Preparation Phase, the issues of item 1 are paramount because of the lack of
time and other resources to generate tangible and meaningful results that can be used as MOE.
This is critical when considering complex systems that have long preparation and planning
phases, before significant resources have been expended to support the generation of discernable
MOE and hardware products.
The two schools differ in the ideas surrounding the application of the Value Creation Framework
to the P/P management cycle. One thought proposes that the interaction between these two models is
more “stovepipe” as shown in Figure 47. Then, applying the Management of Services concepts to the
“gaps” that should be managed, as part of the interaction between the customer and supplier, are actually
between specific phases of the process versus the entire process as shown in Figure 2 in Section 1.3. This
school of thought would have the value identification process linked only to the Preparation Phase; the
value proposition process linked only to the planning stage; and finally, value delivery linked only to the
execution and adaptation phases.
Follow-on work could center on the development of detailed mathematical proof(s) of the logic
employed in substantiating the phase-based relationship between the Value Creation Framework and the
Program/Project Phases.
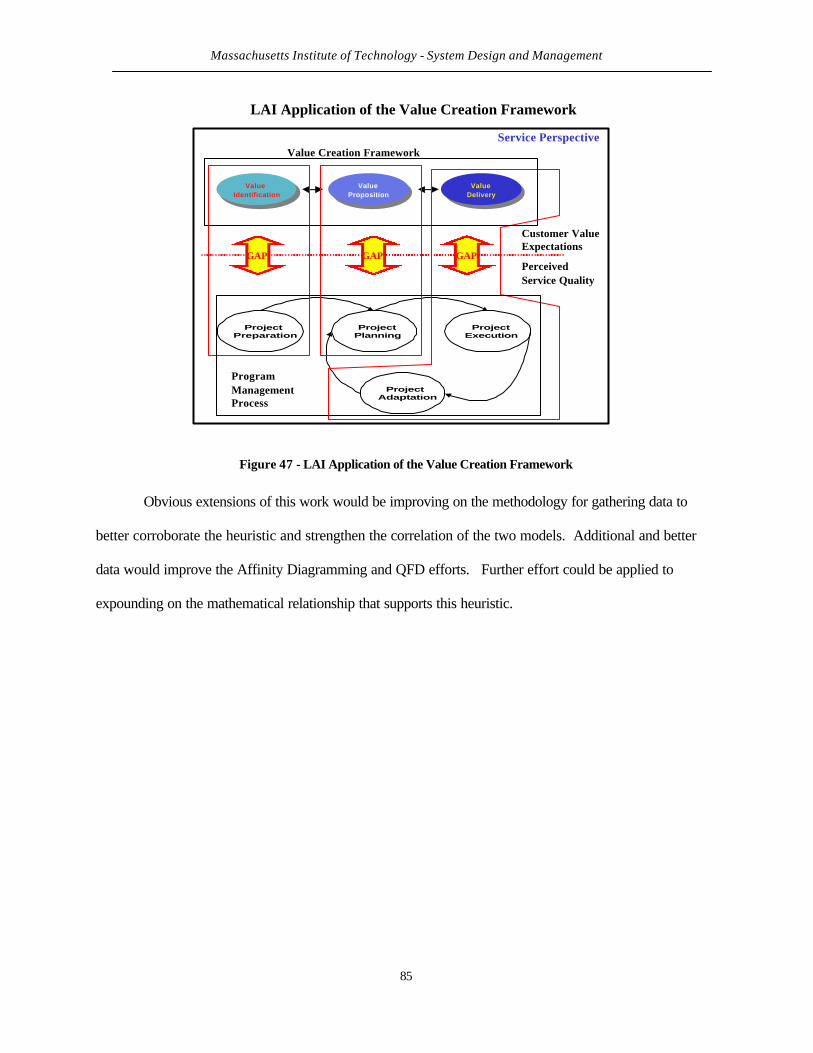
Massachusetts Institute of Technology - System Design and Management
85
Value Proposition
Value Proposition
Value Identification
Value Identification
Value Delivery
Value Delivery
Value Creation Framework
ProjectPreparation
ProjectPlanning
ProjectExecution
ProjectAdaptation
ProgramManagementProcess
Service Perspective
Customer ValueExpectations
PerceivedService Quality
GAPGAPGAP
LAI Application of the Value Creation Framework
Figure 47 - LAI Application of the Value Creation Framework
Obvious extensions of this work would be improving on the methodology for gathering data to
better corroborate the heuristic and strengthen the correlation of the two models. Additional and better
data would improve the Affinity Diagramming and QFD efforts. Further effort could be applied to
expounding on the mathematical relationship that supports this heuristic.
Massachusetts Institute of Technology - System Design and Management
86
Bibliography
1 Warmkessel, Joynce. Course Lecture Notes. 1.432J System and Project Management. Massachusetts Institute of Technology, Cambridge, MA: Fall 2000.
2 Executive Interview 1, 29 October 2001.
3 United States. Census Bureau, Statistical Abstract of the United States. Pg. 614-628, 1999.
4 Wade, Mark. "Encyclopedia Aeronautica." 26 March 2001. September 2001
<www.aeronautix.com>.
5 United States. Department of Defense. Defense System Management College. Program Managers Tool Kit, Tenth Edition June 2001.
6 United States. National Aeronautics and Space Administration. NASA Policy Guidance
7120.5A. NASA Program and Project Management Processes and Requirements. Revision 5A 3 April 1998.
7 Hines, James. Course Lecture Notes. 15.982 System Dynamics I. Massachusetts Institute of
Technology, Cambridge, MA: Summer 2001. 8 Stanke, Alexis K. A Framework For Achieving Lifecycle Value in Product Development.
Thesis. Massachusetts Institute of Technology, 2001. Cambridge, MA, 2001.
9 Dussart, Christian. Course Lecture Notes. 15.768 Management of Services: Concept, Design, and Delivery. Massachusetts Institute of Technology, Cambridge, MA: Fall 2001.
10 Shostack, G. Lynn. “Understanding Services Through Blueprinting.” Advances in Services Marketing and Management, Vol. 1 1992: 75-90.
11 Zeithaml, V. and et.al. Delivering Quality Service Balancing Customer Perceptions and Expectations. New York, NY: Simon and Schuster, 1990.
12 Heskett, J. and et. al. The Service Profit Chain, How Leading Companies Link Profit and Growth to Loyalty, Satisfaction, and Value. New York, NY: The Free Press, 1997.
13 Womack, James, and et. al., Machine That Changed The World. New York, NY Simon and
Schuster, 1990.
14 Womack, James, and Jones, Daniel. Lean Thinking, Banish Waste and Create Wealth in Your Corporation. New York, NY: Simon and Schuster, 1996.
15 Moore, R. and Scheinkopf, Lisa. “Theory of Constraints and Lean Manufacturing: Friends or
Foes?” Chesapeake Consulting, Inc., 1998. 16 Rechtin, Eberhardt, and Mark Maier. The Art of Systems Architecting. Boca Raton, FL: CRC
Press LLC, 1997.
17 Chase, James. “Measuring Value in Product Development” The Lean Aerospace Initiative Working Paper Series. WP00-05 (2001).
Massachusetts Institute of Technology - System Design and Management
87
18 Kaplan, Robert, and David Norton. The Balanced Scorecard-Translating Strategy into Action.
Boston, MA: Harvard Business School Press, 1996.
19 Slack, Robert A. The Lean Value Principle in Military Aerospace Product Development. Thesis. Massachusetts Institute of Technology, 1998. Cambridge, MA 1998.
20 Nightingale, Deborah. “Lean Enterprise – Beyond the Factor Floor.” Lean Management
Solutions Conference. Massachusetts Institute of Technology, Cambridge, MA: 11 September 2001.
21 Crawley, Edward. Course Lecture Notes. 16.882 System Architecture. Massachusetts
Institute of Technology, Cambridge, MA: Fall 2000.
22 Anderson, Michael H. A Study of the Federal Government’s Experiences with Commercial Procurement Practices in Major Defense Acquisitions. Thesis. Massachusetts Institute of Technology, 1997. Cambridge, MA, 1997.
23 Executive Interview 2, 20 November 2001. 24 Rechtin, Eberhardt. Systems Architecting, Creating & Building Complex Systems. Prentice
Hall. Upper Saddle River, NJ 1991.
25 Crow, E. Dr., Vice President Engineering. “Technology Strategy at Pratt & Whitney.” System Design and Management, Fall 2001 Business Trip. Pratt & Whitney, East Hartford, Connecticut. 24 Oct 2001.
26 Goldin, Daniel. “Future of Unified Technologies.” System Design and Management
Distinguished Lecture on Complex Systems. Massachusetts Institute of Technology. Cambridge, MA: Spring 2000.
27 Foster, R. Innovation: The Attacker’s Advantage. Summit Books, Simon and Schuster. New
York, NY, 1986. 28 Douglas, Freddie. “Strategic Analysis of US Efforts to Effectively Access and Commercialize
Space.” Term Paper 15.351 Managing the Innovation Process. Massachusetts Institute of Technology Fall 2001.
29 Goodman, Richard, and Michael Lawless. Technology and Strategy, Conceptual Models and
Diagnostics. New York, NY: Oxford University Press, 1994. 30 United States. Congress. Senate. Commerce Committee. Foreign Commerce and Tourism
Subcommittee. 4 October 1989.
31 Teece, D., The Competitive Challenge. Cambridge, MA. Ballinger Publishing, 1987. 32 Utterback, James. Mastering the Dynamics of Innovation. Boston, MA: Harvard Business
School Press, 1996.
33 Chesbrough and Teece. “When is Virtual Virtuous? Organizing for Innovation” Harvard Business Review, Jan-Feb 1996, pp. 65-74.
Massachusetts Institute of Technology - System Design and Management
88
34 Nightingale, Deborah. Course Lecture Notes. ESD.16J Integrating the Lean Enterprise.
Massachusetts Institute of Technology, Cambridge, MA: Fall 2000.
35 “What’s Ahead in Aerospace.” Aerospace Daily, Aviation Week Newsletter 10 September 2001:4-4.
36 Executive Interview 3, 20 November 2001.
37 Henderson, Rebecca. Course Lecture Notes. 15.984 Special DLL Seminar in Management: Technology Strategy. Massachusetts Institute of Technology, Cambridge, MA: Spring 2001.
38 Henderson, R. & Clark, K. Architectural Innovation: The Reconfiguration of Existing
Product Technologies and the Failure of Established Firms, Administrative Science Quarterly, pg. 9-30. 1990.
39 United States. National Aeronautics and Space Administration. Space Launch Initiative.
Revolutionizing Space Transportation for the 21st Century. June 2001.
40 Boppe, Charles. Course Lecture Notes. 16.880 System Engineering. Massachusetts Institute of Technology, Cambridge, MA: Summer 2001.
41 Program Overview. Evolved Expendable Launch Vehicle. 9 November 1998.
42 United States. National Aeronautics and Space Administration, NASA Academy for
Program/Project Leadership, Advanced Project Management. 3 January 2002 <http://www.nasaappl.com/managers/schoolhouse/schoolhouse home.htm>.
43 Executive Interview 4, 20 November 2001.
44 Executive Interview 5, 20 November 2001. 45 Executive Interview 6, 20 October 2001.
46 United States. Congress. Senate. Commerce Committee. Science and Transportation. Science,
Technology and Space. Commercialization of Space. Graham, Robert, Senator 5 March 1998.
47 United States. Congress. Senate. Commerce Committee. Science and Transportation. Science, Technology and Space. Commercialization of Space. Klinger, Gil, Deputy Under Secretary for Space. 5 March 1998.
48 United States. Congress. House. Science, Space and Aeronautics Committee. FY2000 Budget
for Space Commercialization Programs. Mahone, Bruce L., Director, Aerospace Industries Association. 11 March 1999.
49 United States. Congress. House. Science, Space and Aeronautics Committee. The X-33
Reusable Launch Vehicle. Williamson, Ray, Senior Research Scientist, George Washington University. 1 November 1995.
Massachusetts Institute of Technology - System Design and Management
89
50 United States. Congress. Senate. Commerce Committee. Science and Transportation. Science, Technology and Space. Commercialization of Space. Gross, Roberta L. Inspector General. 29 April 1999.
51 United States. Congress. House. Committee on Science. Space and Aeronautics. Smith,
Patricia G., Federal Aviation Administration, Associate Administrator for Commercial Space Transportation. 11March 1999.
52 United States. Congress. House. Government Reform and Oversight Committee. National
Security, International Affairs, and Criminal Justice. Aerospace and Technology Development. Web, David Dr. Consultant. 9 May 1997.
Massachusetts Institute of Technology - System Design and Management
90
References Collins, Patrick. "Space Future, Space Policy, Space Tourism and Economic Policy." June 2001. <www.spacefuture.com/archieve/space_policy_space_tourism_and_economic_ policy.shtml>. Cusumano, Michael, and Kentaro Nobeoka. Thinking Beyond Lean. New York, NY: The Free Press, 1998. Garlan, David, and Mary Shaw. Software Architecture, Perspectives on An Emerging Discipline. Upper Saddle River, NJ: Prentice Hall, 1996. Harvard Buisness School on Measuring Corporate Performance. Boston, MA: Harvard Business School Press, 1998. Kerzner, Harold. Project Management, A Systems Approach to Planning, Scheduling, and Controlling. New York, NY: John Wiley and Sons, Inc., 1998. Kochan, Thomas, Russell Lansbury, and John Paul MacDuffie. After Lean Production, Evolving Employment Practices in the World Auto Industry. Ithaca, NY: Cornell University Press, 1997. Lim, Kwanghui. Course Lecture Notes 15.351 Introduction to Managing the Innovation Process. Massachusetts Institute of Technology, Cambridge, MA: Fall 2001. McCurdy, Howard. Inside NASA, High Technology and Organizational Change in the US Space Program. Baltimore, MA: The John Hopkins University Press, 1993. Nelson, Don. NASA New Millennium Problems and Solutions. : Xlibris Corporation, 2001. Ransom, Jim. "Space Future, Access-to-space: SSX." 1991. 10 October 2001 <www.spacefuture.com/archieve/access_to_space_ssx.shtml>. Reinertsen, Donald. Managing the Design Factory, A Product Developer's Toolkit. New York, NY: The Free Press, 1997. Schrage, Michael. Serious Play, How the World's Best Companies Simulate to Innovate. Boston, MA: Harvard Business School Press, 1999. Shapiro, Carl, and Hal Varian. Information Rules, A Strategic Guide to the Network Economy. Boston, MA: Harvard Business School Press, 1999. Silbiger, Steven. The Ten-Day MBA. New York, NY: William Morrow and Company, Inc., 1993. Smith, Preston , and Donald Reinertsen. Developing Products in Half the Time, New Rules, New Tools. New York, NY: John Wiley & Sons, Inc., 1998. Thomas, Kuhn. The Structure of Scientific Revolutions. Chicago, IL: The University of Chicago Press, 1996.

Massachusetts Institute of Technology - System Design and Management
91
Ulrich, Karl, and Steven Eppinger. Product Design and Development. Boston, MA: MGraw-Hill Higher Education, 2000. United States. Congress. House. Science, Space, and Aeronautics Committee. Future of the US Space Program. Brown, George, Acting Chair. 29 January 1991. United States. Congress. House. Science, Space, and Aeronautics Committee. NASA Plans for Development of Future Space Transportation Systems. Mulville, Daniel, Chief Engineer Office of the Administrator National Aeronautics and Space Administration. 29 October 1999. United States. Congress. House. Science, Space and Aeronautics Committee. NASA’s Reusable Launch Vehicle Program. Rohrabacher, Dan Chairman. 29 September 1999. United States. Congress. House. Science, Space, and Aeronautics. NASA Budget. Captiol Hill Hearing Testimony. 11 April 2000. United States. Congress. Senate. Commerce, Science and Transportation Committee. Science, Technology, and Space. Testimony NASA Aeronautics Program. Goldin, Daniel, Director, National Aeronautics and Space Administration. 24 April 2001. United States. Congress. Senate. Commerce, Science and Transportation Committee. Science, Technology, and Space. Testimony NASA Budget Request for Fiscal Year 1990 and Fiscal Year 1991. Gore, Al, Senator, Chairman. 9 February 1989. United States. National Aeronautics and Space Administration. Independent Assessment of NASA Expendable Launch Vehicle Safety & Mission Assurance Processes. 30 August 1999. Walton, Myles. “Strategies for Lean Product Development” The Lean Aerospace Initiative, Working Paper Series. W99-01-91 (1999).
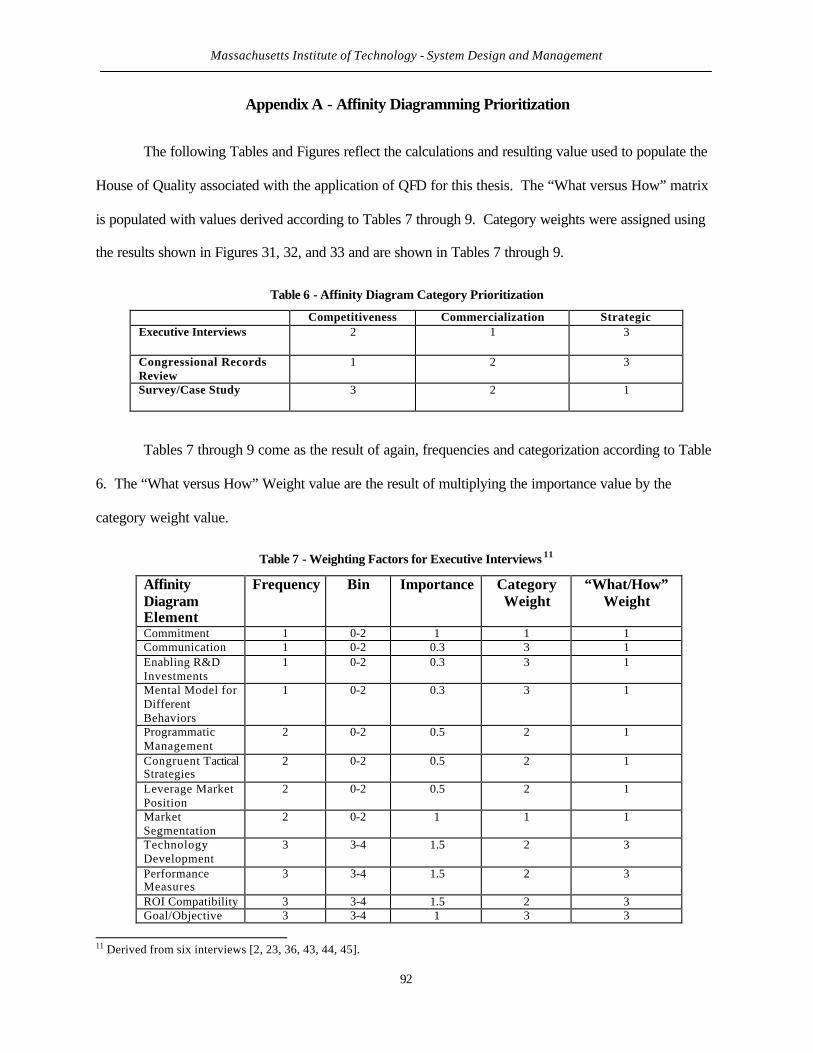
Massachusetts Institute of Technology - System Design and Management
92
Appendix A - Affinity Diagramming Prioritization
The following Tables and Figures reflect the calculations and resulting value used to populate the
House of Quality associated with the application of QFD for this thesis. The “What versus How” matrix
is populated with values derived according to Tables 7 through 9. Category weights were assigned using
the results shown in Figures 31, 32, and 33 and are shown in Tables 7 through 9.
Table 6 - Affinity Diagram Category Prioritization
Competitiveness Commercialization Strategic Executive Interviews 2 1 3
Congressional Records Review
1 2 3
Survey/Case Study 3 2 1
Tables 7 through 9 come as the result of again, frequencies and categorization according to Table
6. The “What versus How” Weight value are the result of multiplying the importance value by the
category weight value.
Table 7 - Weighting Factors for Executive Interviews 11
Affinity Diagram Element
Frequency Bin Importance Category Weight
“What/How” Weight
Commitment 1 0-2 1 1 1 Communication 1 0-2 0.3 3 1 Enabling R&D Investments
1 0-2 0.3 3 1
Mental Model for Different Behaviors
1 0-2 0.3 3 1
Programmatic Management
2 0-2 0.5 2 1
Congruent Tactical Strategies
2 0-2 0.5 2 1
Leverage Market Position
2 0-2 0.5 2 1
Market Segmentation
2 0-2 1 1 1
Technology Development
3 3-4 1.5 2 3
Performance Measures
3 3-4 1.5 2 3
ROI Compatibility 3 3-4 1.5 2 3 Goal/Objective Development
3 3-4 1 3 3
11 Derived from six interviews [2, 23, 36, 43, 44, 45].
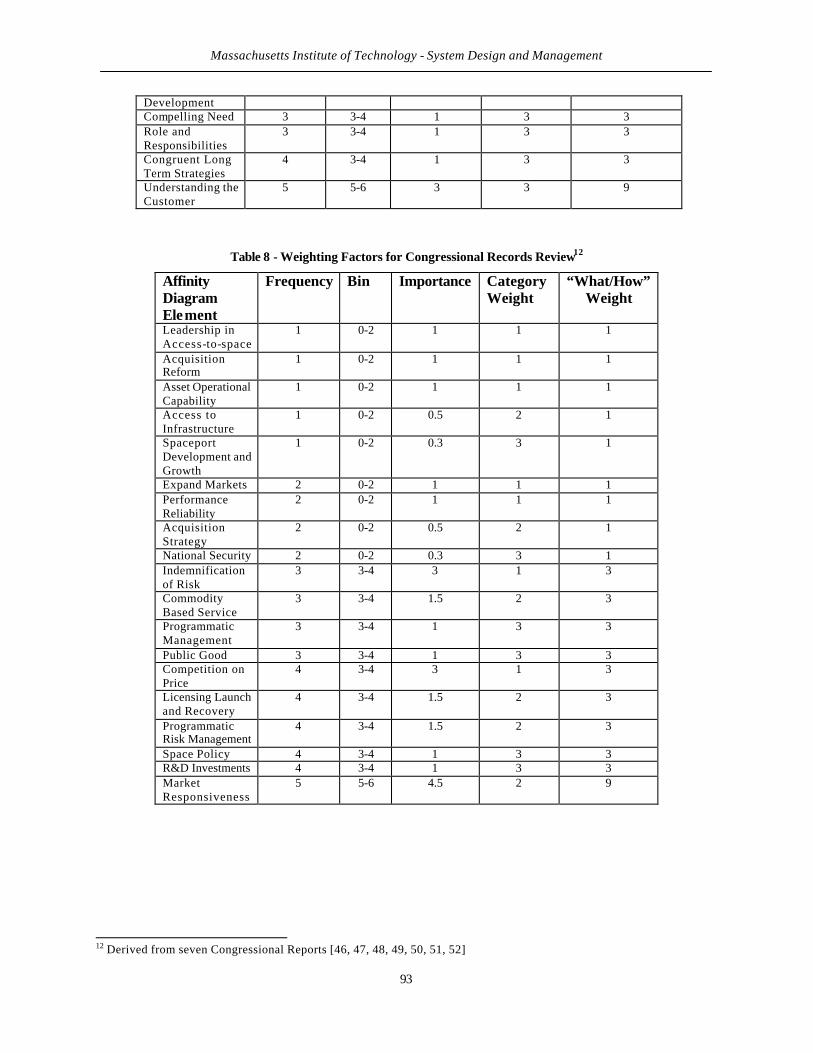
Massachusetts Institute of Technology - System Design and Management
93
Development Compelling Need 3 3-4 1 3 3 Role and Responsibilities
3 3-4 1 3 3
Congruent Long Term Strategies
4 3-4 1 3 3
Understanding the Customer
5 5-6 3 3 9
Table 8 - Weighting Factors for Congressional Records Review12
Affinity Diagram Element
Frequency Bin Importance Category Weight
“What/How” Weight
Leadership in Access-to-space
1 0-2 1 1 1
Acquisition Reform
1 0-2 1 1 1
Asset Operational Capability
1 0-2 1 1 1
Access to Infrastructure
1 0-2 0.5 2 1
Spaceport Development and Growth
1 0-2 0.3 3 1
Expand Markets 2 0-2 1 1 1 Performance Reliability
2 0-2 1 1 1
Acquisition Strategy
2 0-2 0.5 2 1
National Security 2 0-2 0.3 3 1 Indemnification of Risk
3 3-4 3 1 3
Commodity Based Service
3 3-4 1.5 2 3
Programmatic Management
3 3-4 1 3 3
Public Good 3 3-4 1 3 3 Competition on Price
4 3-4 3 1 3
Licensing Launch and Recovery
4 3-4 1.5 2 3
Programmatic Risk Management
4 3-4 1.5 2 3
Space Policy 4 3-4 1 3 3 R&D Investments 4 3-4 1 3 3 Market Responsiveness
5 5-6 4.5 2 9
12 Derived from seven Congressional Reports [46, 47, 48, 49, 50, 51, 52]
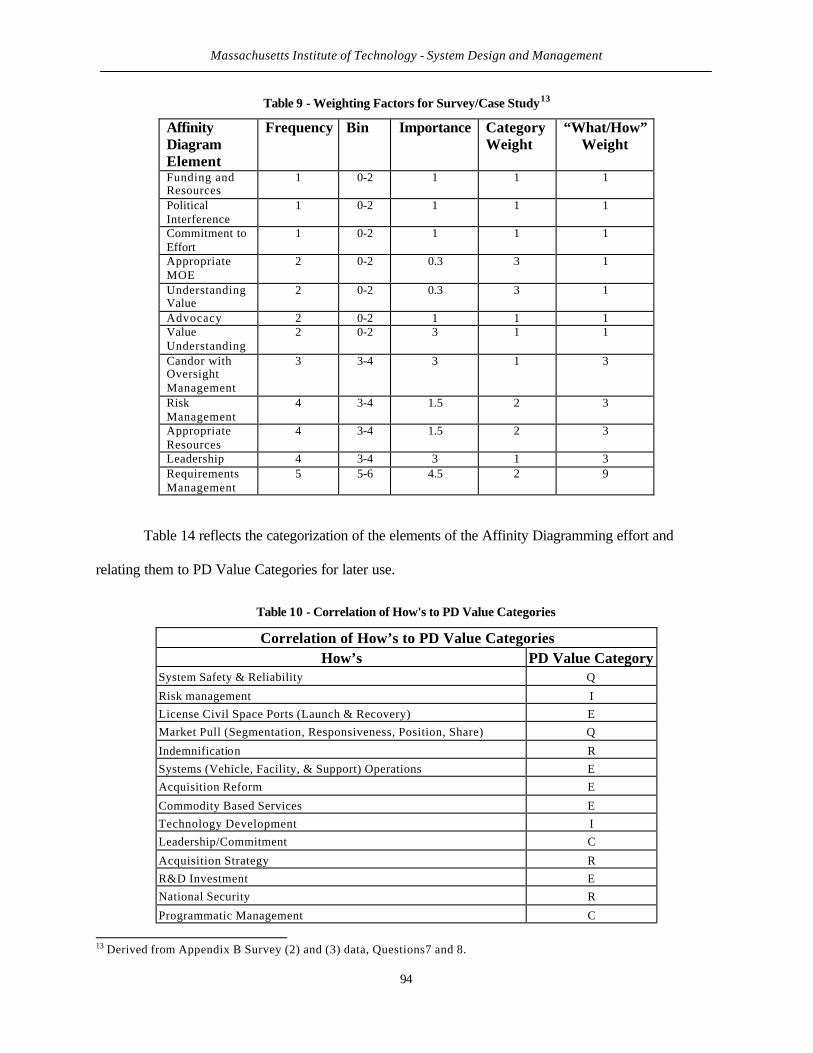
Massachusetts Institute of Technology - System Design and Management
94
Table 9 - Weighting Factors for Survey/Case Study13
Affinity Diagram Element
Frequency Bin Importance Category Weight
“What/How” Weight
Funding and Resources
1 0-2 1 1 1
Political Interference
1 0-2 1 1 1
Commitment to Effort
1 0-2 1 1 1
Appropriate MOE
2 0-2 0.3 3 1
Understanding Value
2 0-2 0.3 3 1
Advocacy 2 0-2 1 1 1 Value Understanding
2 0-2 3 1 1
Candor with Oversight Management
3 3-4 3 1 3
Risk Management
4 3-4 1.5 2 3
Appropriate Resources
4 3-4 1.5 2 3
Leadership 4 3-4 3 1 3 Requirements Management
5 5-6 4.5 2 9
Table 14 reflects the categorization of the elements of the Affinity Diagramming effort and
relating them to PD Value Categories for later use.
Table 10 - Correlation of How's to PD Value Categories
Correlation of How’s to PD Value Categories How’s PD Value Category
System Safety & Reliability Q
Risk management I
License Civil Space Ports (Launch & Recovery) E
Market Pull (Segmentation, Responsiveness, Position, Share) Q
Indemnification R
Systems (Vehicle, Facility, & Support) Operations E
Acquisition Reform E
Commodity Based Services E
Technology Development I
Leadership/Commitment C
Acquisition Strategy R
R&D Investment E
National Security R
Programmatic Management C
13 Derived from Appendix B Survey (2) and (3) data, Questions7 and 8.

Massachusetts Institute of Technology - System Design and Management
95
Public Good Q
Communication C
Organizational Vision and Behavior Modification C
Congruency of Strategies R
Appropriate Measures of Effectiveness I
ROI Compatibility C
Goals/Objectives Development Process C
Compelling Need Q
Roles & Responsibility E
Customer Relationship Management E
Access to Infrastructure E
Space Policy Development Q
Appropriate Funding and Resources E
Political Interference R
Value Understanding Q
Requirements Management Q
Table 11 is the result of element correlations to PD Value attributes, as shown in Table 10. This
count is reduced to a percentage for later use.
Table 11 - How vs. PD Frequency Distribution
How/PD Correlation Percentage Frequency Percent Quality 7 0.23 Efficiency 9 0.30 Information 3 0.10
Risk 5 0.17 Communication 6 0.20
Sum 30
Table 12 is derived by the count of elements in each of the Goals from the three sources of data.
This count is multiplied by the PD Value percentage shown in Table 11. This is repeated for each of the
Values and Goal groups.
Table 12 - Correlation of PD Value Attributes to Data Goals
Correlation of PD Value to How elements Executive Frequency Quality Efficiency Information Risk Communication
Competitiveness 7 1.63 2.1 0.7 1.17 1.4
Commercialization 2 0.60 0.6 0.2 0.33 0.4
Strategic 8 0.80 2.4 0.8 1.33 1.6
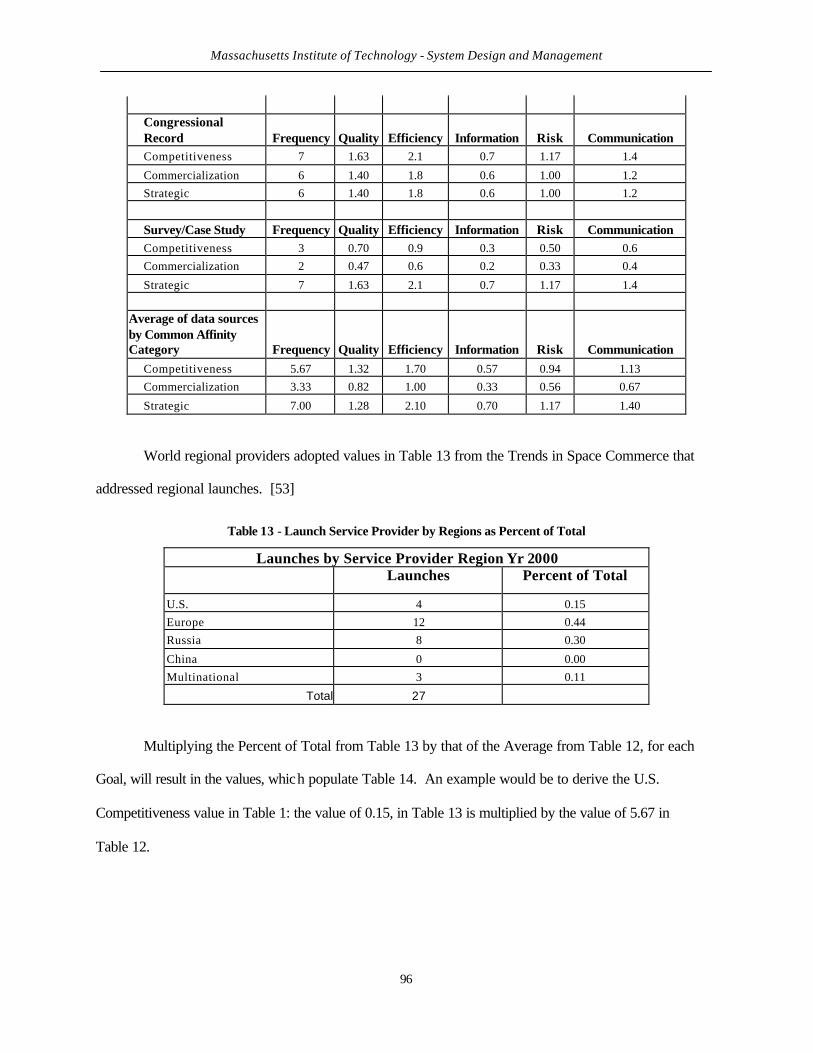
Massachusetts Institute of Technology - System Design and Management
96
Congressional Record Frequency Quality Efficiency Information Risk Communication
Competitiveness 7 1.63 2.1 0.7 1.17 1.4
Commercialization 6 1.40 1.8 0.6 1.00 1.2
Strategic 6 1.40 1.8 0.6 1.00 1.2
Survey/Case Study Frequency Quality Efficiency Information Risk Communication
Competitiveness 3 0.70 0.9 0.3 0.50 0.6
Commercialization 2 0.47 0.6 0.2 0.33 0.4
Strategic 7 1.63 2.1 0.7 1.17 1.4
Average of data sources by Common Affinity Category Frequency Quality Efficiency Information Risk Communication
Competitiveness 5.67 1.32 1.70 0.57 0.94 1.13
Commercialization 3.33 0.82 1.00 0.33 0.56 0.67
Strategic 7.00 1.28 2.10 0.70 1.17 1.40
World regional providers adopted values in Table 13 from the Trends in Space Commerce that
addressed regional launches. [53]
Table 13 - Launch Service Provider by Regions as Percent of Total
Launches by Service Provider Region Yr 2000
Launches Percent of Total
U.S. 4 0.15
Europe 12 0.44
Russia 8 0.30
China 0 0.00
Multinational 3 0.11
Total 27
Multiplying the Percent of Total from Table 13 by that of the Average from Table 12, for each
Goal, will result in the values, which populate Table 14. An example would be to derive the U.S.
Competitiveness value in Table 1: the value of 0.15, in Table 13 is multiplied by the value of 5.67 in
Table 12.

Massachusetts Institute of Technology - System Design and Management
97
Table 14 - Competitive Pressure Calculation by Region
Competitive Pressures Calculations Region U.S. Europe Russia Multi-national
Competitiveness 0.84 2.52 1.68 0.63
Commercialization 0.49 1.48 0.99 0.37
Strategic 1.04 3.11 2.07 0.78
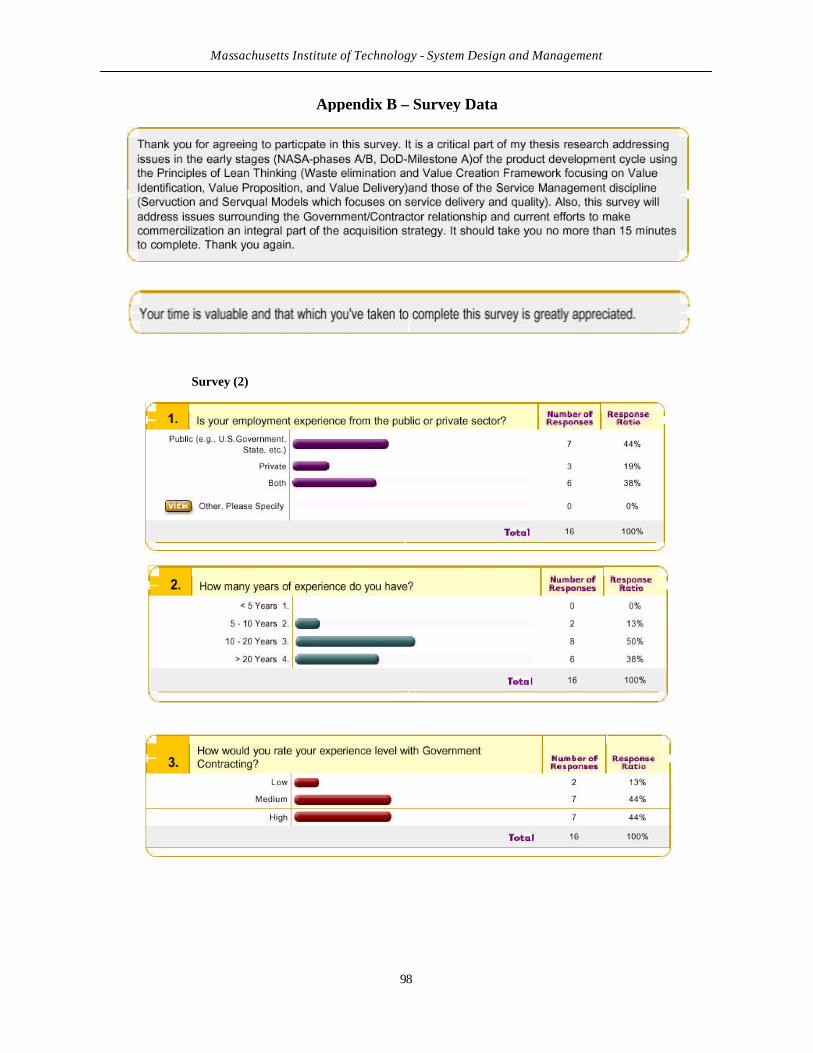
Massachusetts Institute of Technology - System Design and Management
98
Appendix B – Survey Data
Survey (2)
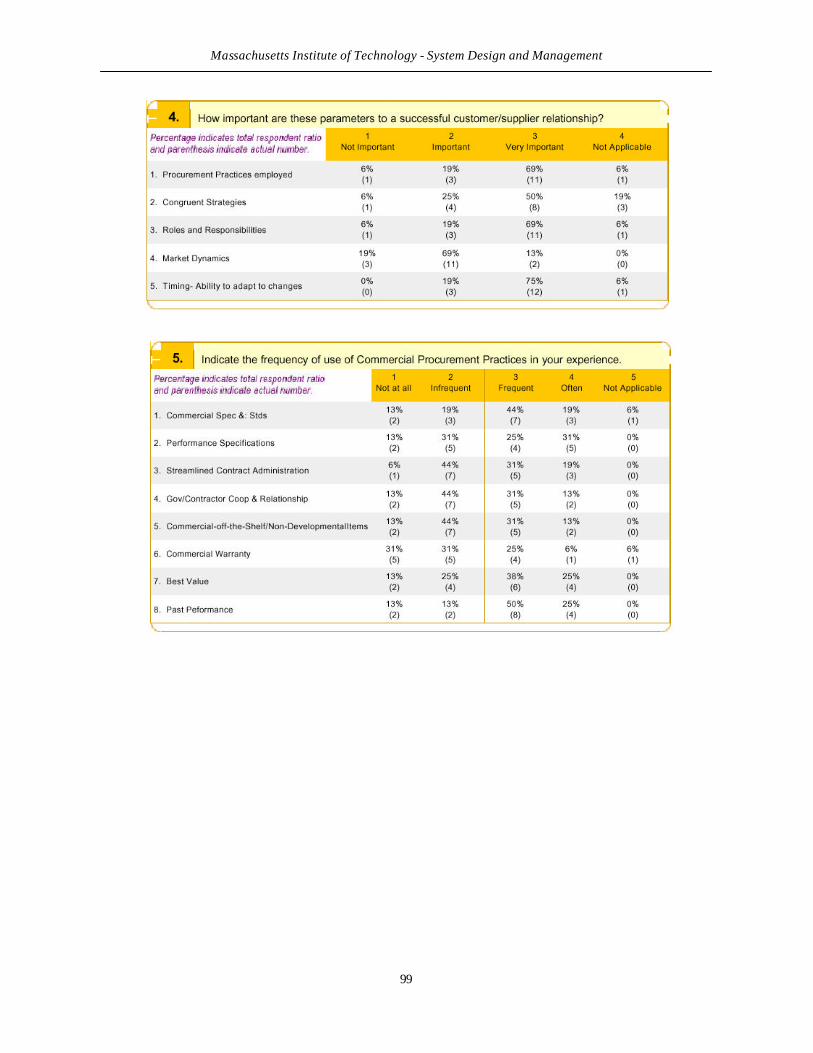
Massachusetts Institute of Technology - System Design and Management
99
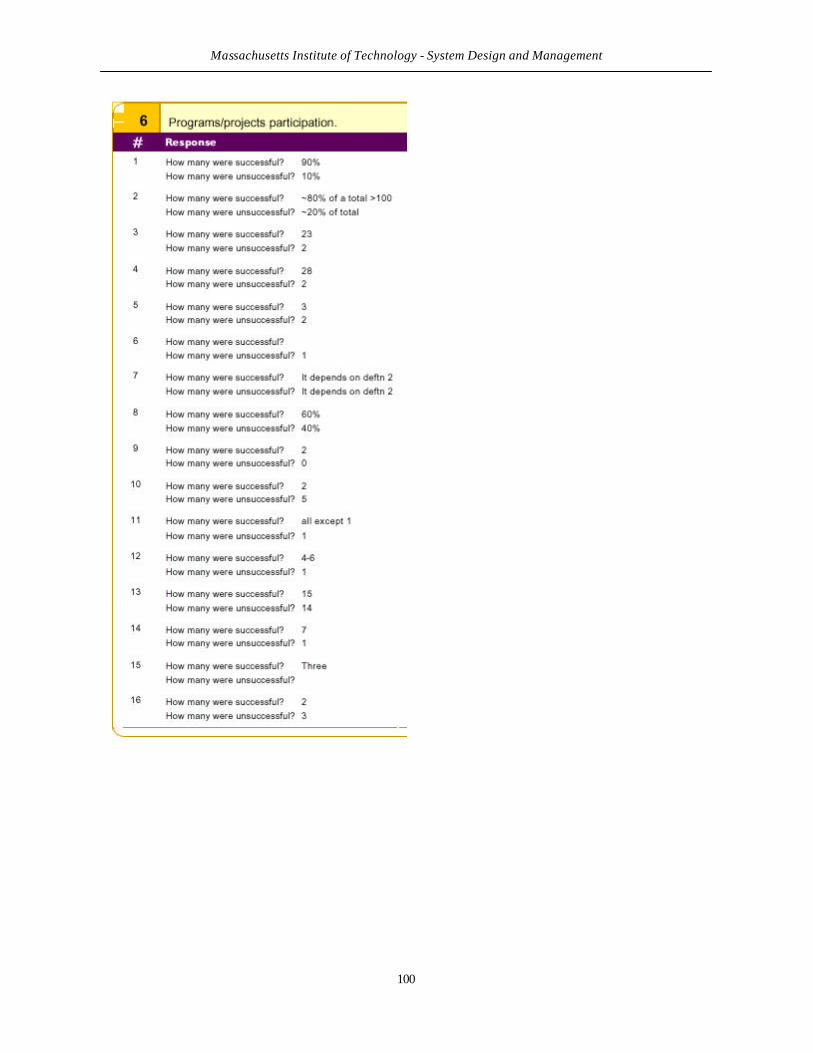
Massachusetts Institute of Technology - System Design and Management
100
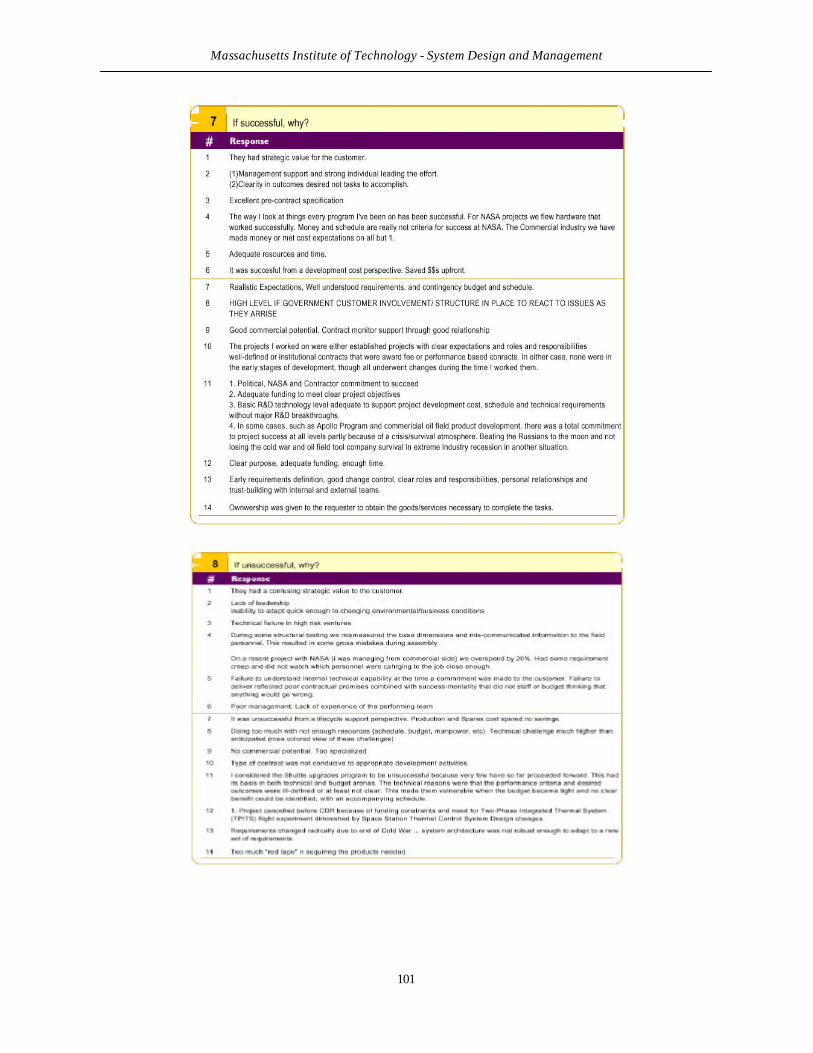
Massachusetts Institute of Technology - System Design and Management
101

Massachusetts Institute of Technology - System Design and Management
102
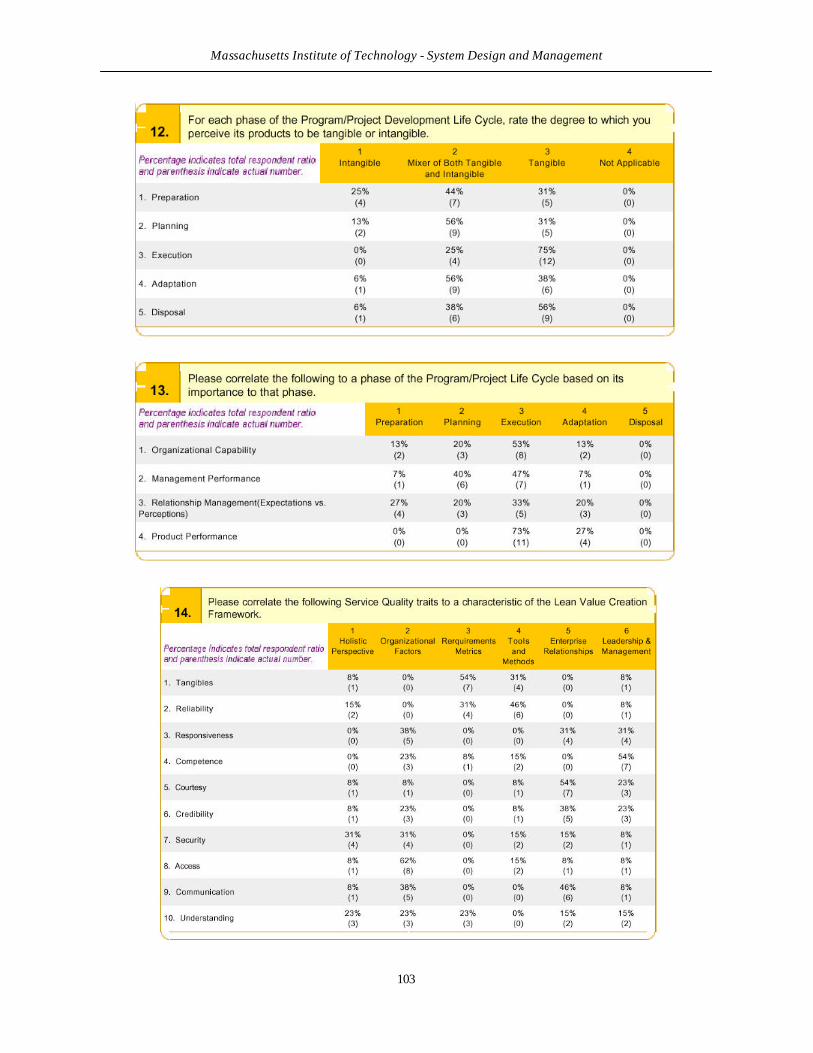
Massachusetts Institute of Technology - System Design and Management
103
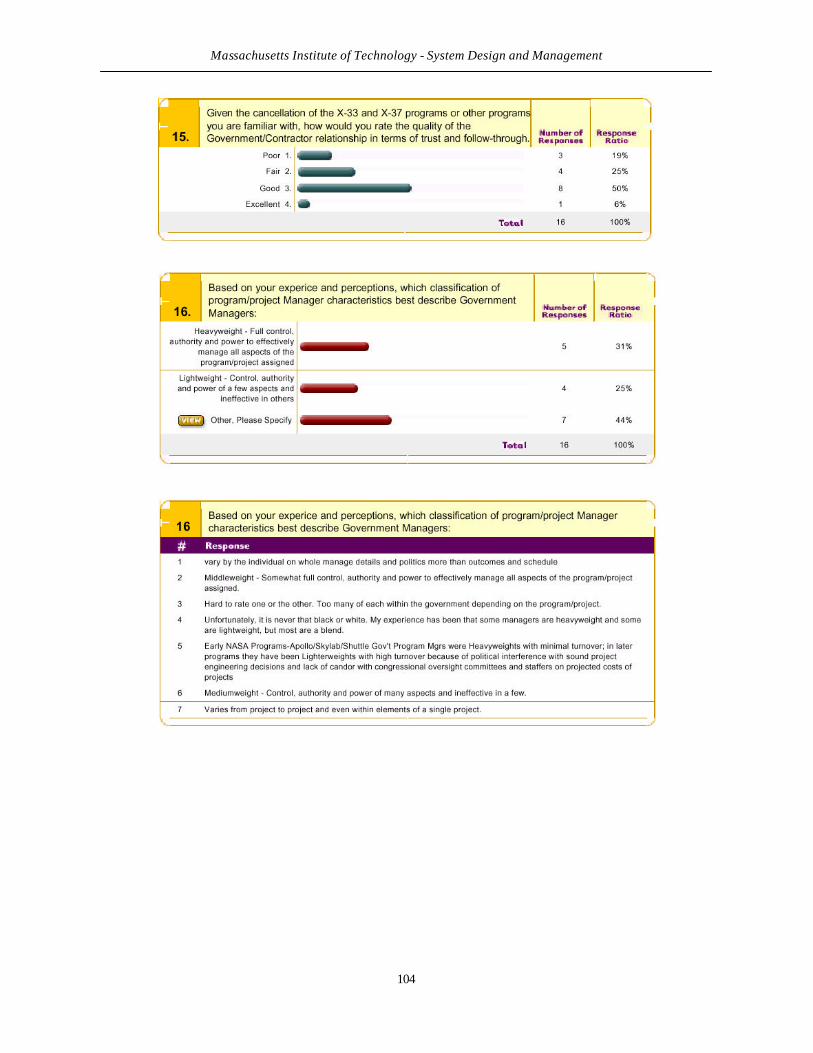
Massachusetts Institute of Technology - System Design and Management
104
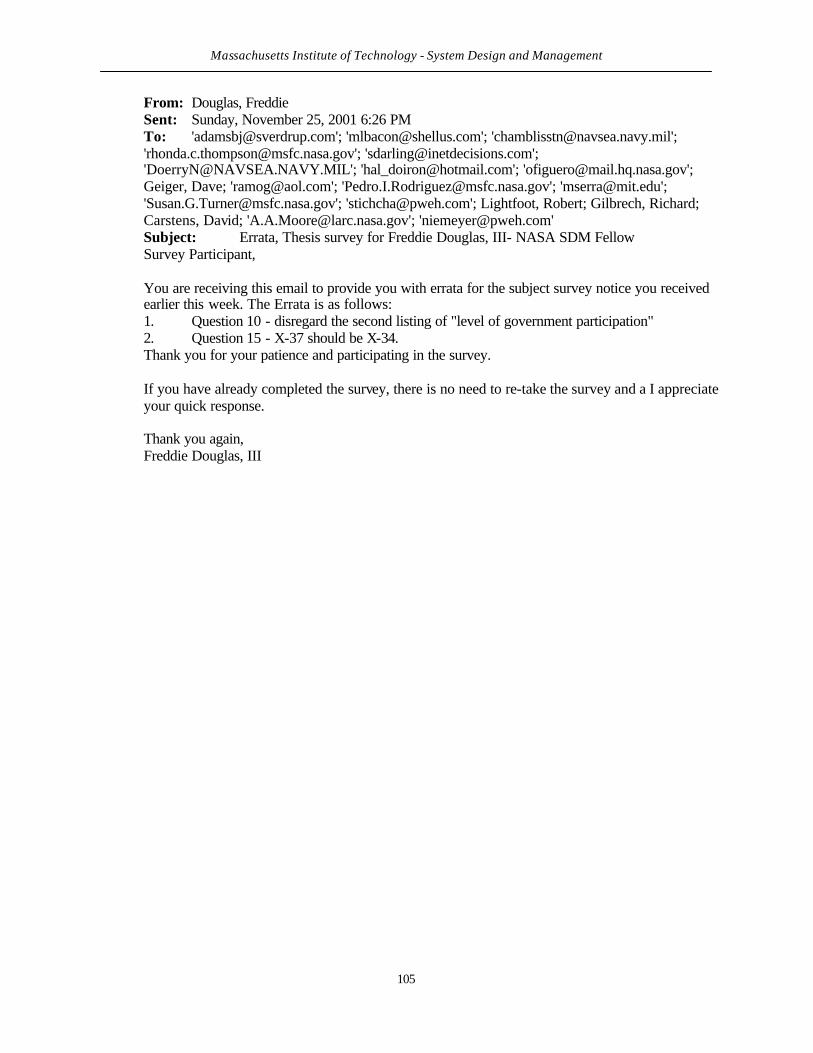
Massachusetts Institute of Technology - System Design and Management
105
From: Douglas, Freddie Sent: Sunday, November 25, 2001 6:26 PM To: '[email protected]'; '[email protected]'; '[email protected]'; '[email protected]'; '[email protected]'; '[email protected]'; '[email protected]'; '[email protected]'; Geiger, Dave; '[email protected]'; '[email protected]'; '[email protected]'; '[email protected]'; '[email protected]'; Lightfoot, Robert; Gilbrech, Richard; Carstens, David; '[email protected]'; '[email protected]' Subject: Errata, Thesis survey for Freddie Douglas, III- NASA SDM Fellow Survey Participant, You are receiving this email to provide you with errata for the subject survey notice you received earlier this week. The Errata is as follows: 1. Question 10 - disregard the second listing of "level of government participation" 2. Question 15 - X-37 should be X-34. Thank you for your patience and participating in the survey. If you have already completed the survey, there is no need to re-take the survey and a I appreciate your quick response. Thank you again, Freddie Douglas, III
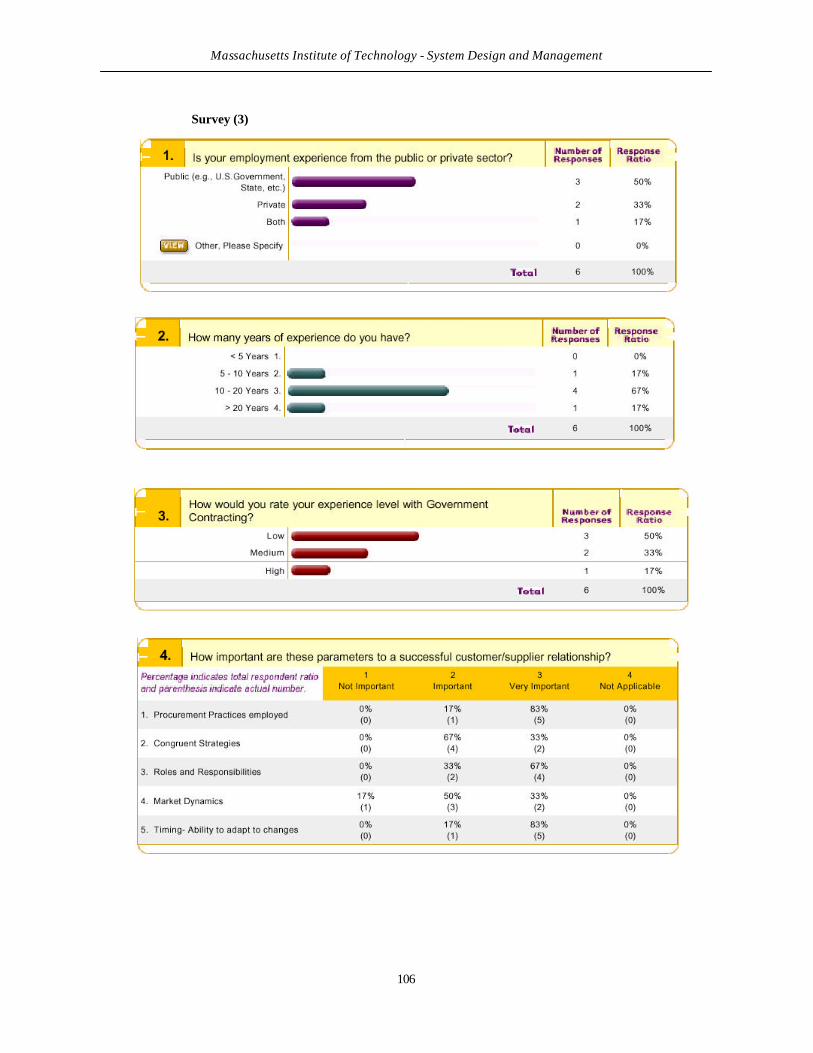
Massachusetts Institute of Technology - System Design and Management
106
Survey (3)
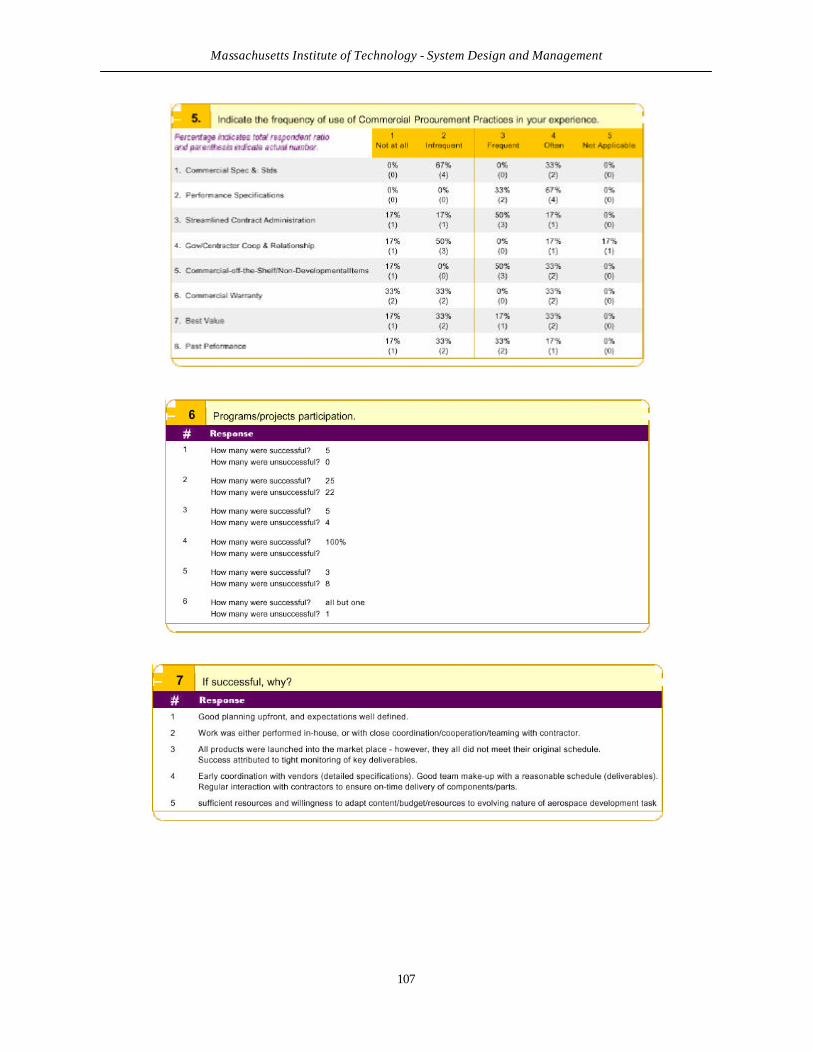
Massachusetts Institute of Technology - System Design and Management
107
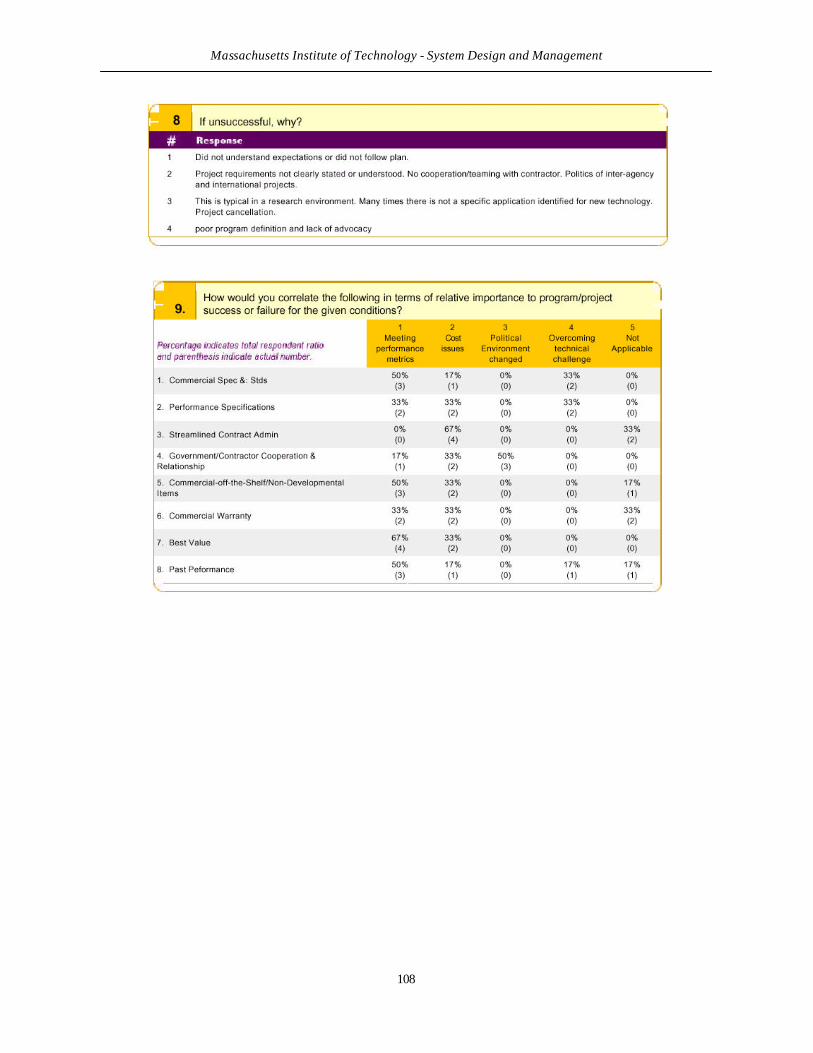
Massachusetts Institute of Technology - System Design and Management
108
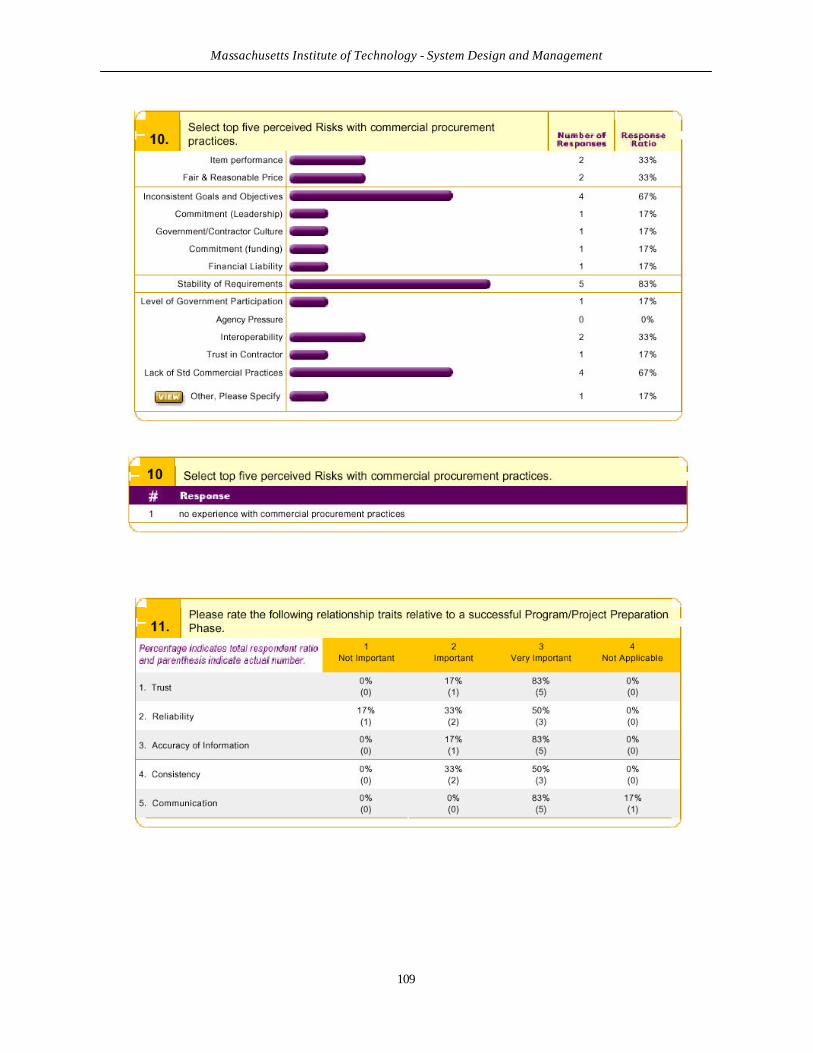
Massachusetts Institute of Technology - System Design and Management
109
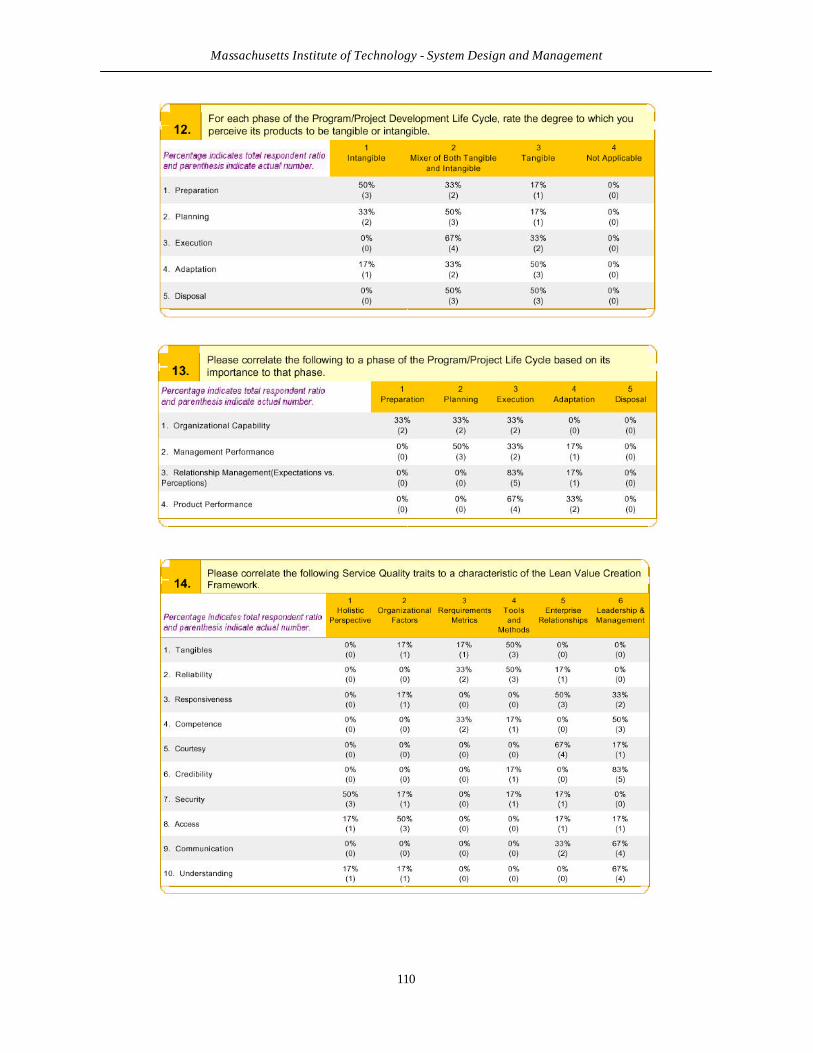
Massachusetts Institute of Technology - System Design and Management
110
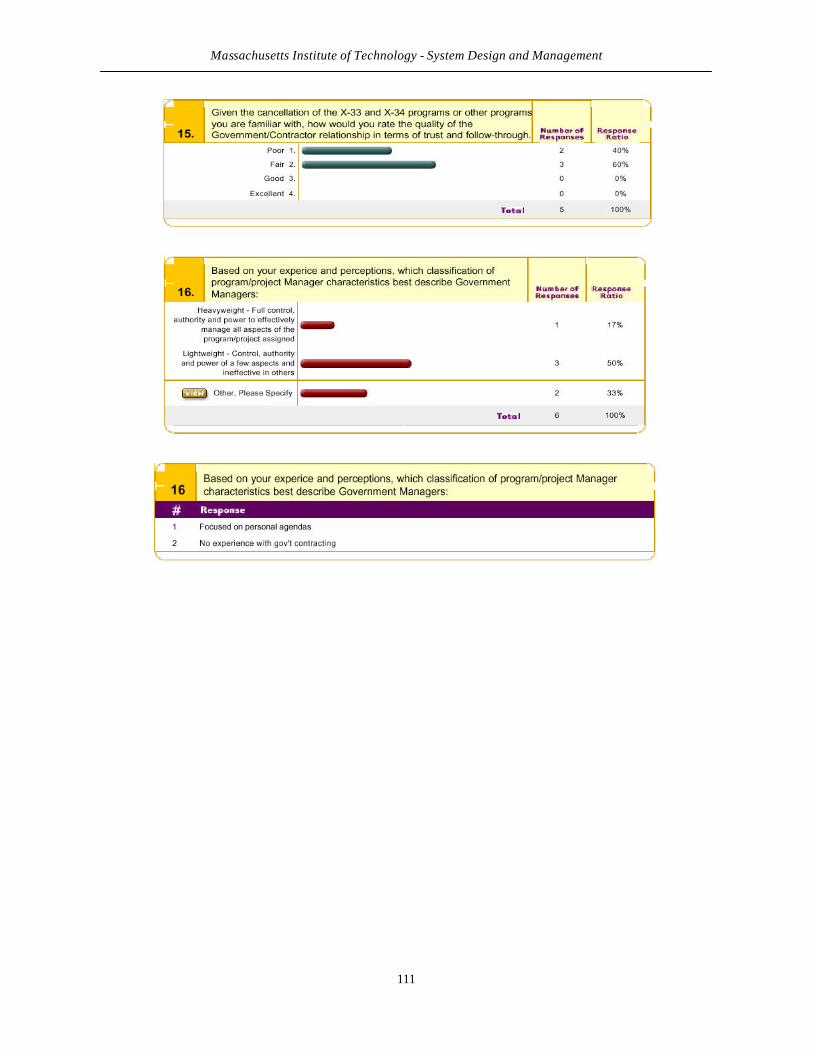
Massachusetts Institute of Technology - System Design and Management
111
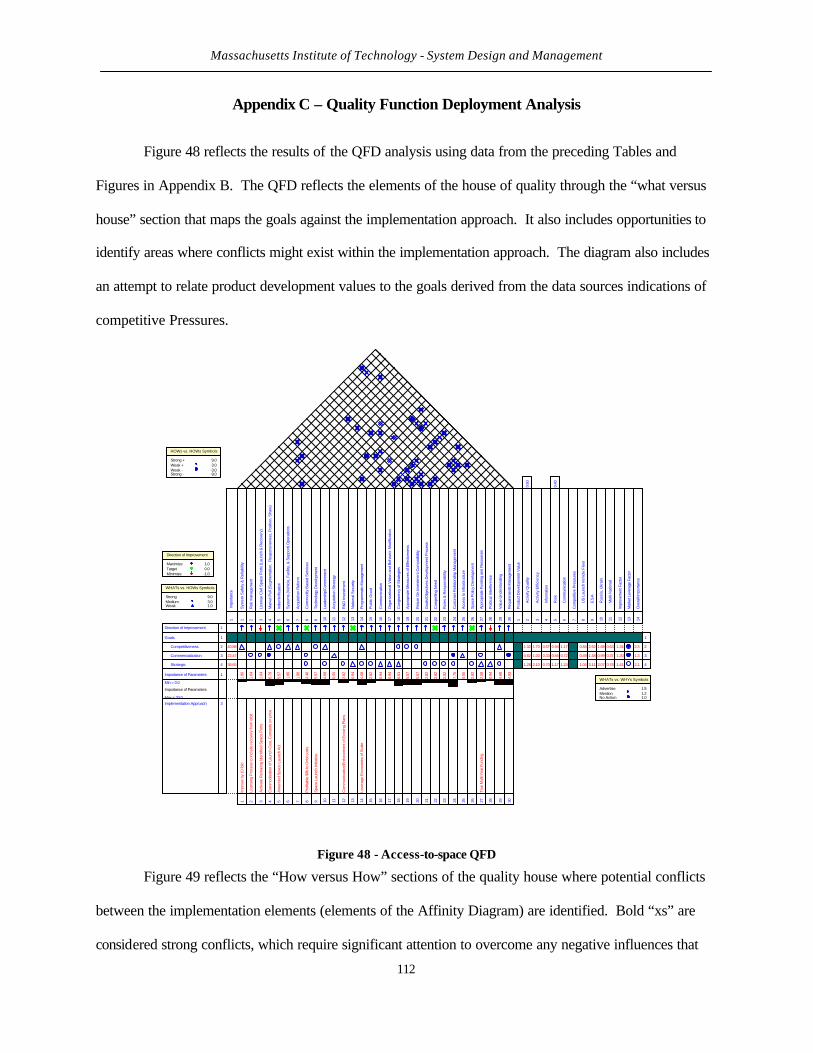
Massachusetts Institute of Technology - System Design and Management
112
Appendix C – Quality Function Deployment Analysis
Figure 48 reflects the results of the QFD analysis using data from the preceding Tables and
Figures in Appendix B. The QFD reflects the elements of the house of quality through the “what versus
house” section that maps the goals against the implementation approach. It also includes opportunities to
identify areas where conflicts might exist within the implementation approach. The diagram also includes
an attempt to relate product development values to the goals derived from the data sources indications of
competitive Pressures.
Im
porta
nce
1
36.65
40.88
22.47
Sys
tem
Saf
ety
& R
elia
bilit
y
Ris
k m
anag
emen
t
Lic
ense
Civ
il S
pace
Por
ts (L
aunc
h &
Rec
over
y)
Mar
ket P
ull (
Seg
men
tatio
n, R
espo
nsiv
enes
s, P
ositi
on, S
hare
)
Inde
min
ifica
tion
Sys
tem
s (V
ehic
le, F
acilit
y, &
Sup
port)
Ope
ratio
ns
Acq
uisi
tion
Ref
orm
Com
mod
ity B
ased
Ser
vice
s
Tec
hnol
ogy
Dev
elop
men
t
Lea
ders
hip/
Com
mitm
ent
Acq
uisi
tion
Stra
tegy
R&
D In
vest
men
t
Nat
iona
l Sec
urity
Pro
gram
mat
ic M
anag
emen
t
Pub
lic G
ood
Com
mun
icat
ion
Org
aniz
atio
nal V
isio
n an
d B
ehav
ior M
odifi
catio
n
Con
grue
ncy
of S
trate
gies
App
ropr
iate
Mea
sure
s of
Effe
ctiv
enes
s
Ret
urn
On
Inve
stm
ent C
ompa
tibilit
y
Goa
ls/O
bjec
tives
Dev
elop
men
t Pro
cess
Com
pellin
g N
eed
Rol
es &
Res
pons
ibili
ty
Cus
tom
er R
elat
ions
hip
Man
agem
ent
Acc
ess
to In
frast
ruct
ure
Spa
ce P
olic
y D
evel
opm
ent
App
ropr
iate
Fun
ding
and
Res
ourc
es
Pol
itica
l Int
erfe
renc
e
Val
ue U
nder
stan
ding
Req
uire
men
ts M
anag
emen
t
1 2 3 4 5 6 7 8 9 10
11
12
13
14
15
16
17
18
19
20
21
22
23
24
25
26
27
28
29
30
Pro
duct
Dev
elop
men
t Val
ue
1
Act
ivity
Qua
lity
2
0.60
1.32
0.82
1.28
Act
ivity
Effi
cien
cy
3
1.70
1.00
2.10
Info
rmat
ion
4
0.57
0.33
0.70
Ris
k
50.
40
0.94
0.56
1.17
Com
mun
icat
ion
6
1.17
0.72
1.24
Com
petit
ive
Pre
ssur
es
7
US
Lau
nch
Veh
icle
Fle
et
8
1.04
0.84
0.49
ES
A
9
2.52
1.48
3.11
Rus
sia,
Ukr
ain
1
0
1.68
0.99
2.07
Mul
ti-N
atio
nal
11
0.63
0.37
0.78
Impr
ovem
ent F
acto
r 1
2
1.41
1.34
1.20
Mar
ket L
ever
age
Fact
or
13
Ove
rall
Impo
rtanc
e
14
2.1
2.3
1.3
1
2
3
4
Direction of Improvement 1
Goals
Competitiveness
Commercialization
Strategic
1
2
3
4
Importance of Parameters 1
1.86
1.64
1.64
6.79
5.57
1.86
1.86
4.46
5.57
4.68
0.55
2.82
0.94
4.68
2.82
0.94
0.94
6.51
5.57
5.57
2.82
2.82
2.82
7.75
0.55
2.82
2.58
0.94
4.68
4.93
Min = 0.0
Importance of Parameters
Max = 20.0 Implementation Approach 3
Leve
rage
Eco
nom
ies
of S
cale
True
Mul
ti-Y
ear F
undi
ng
Com
mun
icat
ion/
Enf
orce
men
t of E
xist
ing
Pla
ns
Impr
ove
by 1
0 fo
ld
Lice
nsin
g P
roce
ss to
incl
ude
reco
very
from
orb
it
Act
ivat
e R
emai
nig
Iden
tifie
d S
pace
Por
ts
Com
mod
izat
ion
of L
aunc
h C
ost,
Com
pete
on
pric
e
Am
ende
d S
pace
Lau
nch
Act
Pro
fitab
le $
/lb to
Orib
t cos
ts
Spa
ce L
aunc
h In
itiat
ive
1 2 3 4 5 6 7 8 9 10
11
12
13
14
15
16
17
18
19
20
21
22
23
24
25
26
27
28
29
30
HOWs vs. HOWs Symbols
Strong + 9.0Weak + 3.0Weak - -3.0Strong - -9.0
WHATs vs. WHYs Symbols
Advertise 1.5Mention 1.2No Action 1.0
WHATs vs. HOWs Symbols
Strong 9.0Medium 3.0Weak 1.0
Direction of Improvement
Maximize 1.0Target 0.0Minimize -1.0
Figure 48 - Access-to-space QFD
Figure 49 reflects the “How versus How” sections of the quality house where potential conflicts
between the implementation elements (elements of the Affinity Diagram) are identified. Bold “xs” are
considered strong conflicts, which require significant attention to overcome any negative influences that
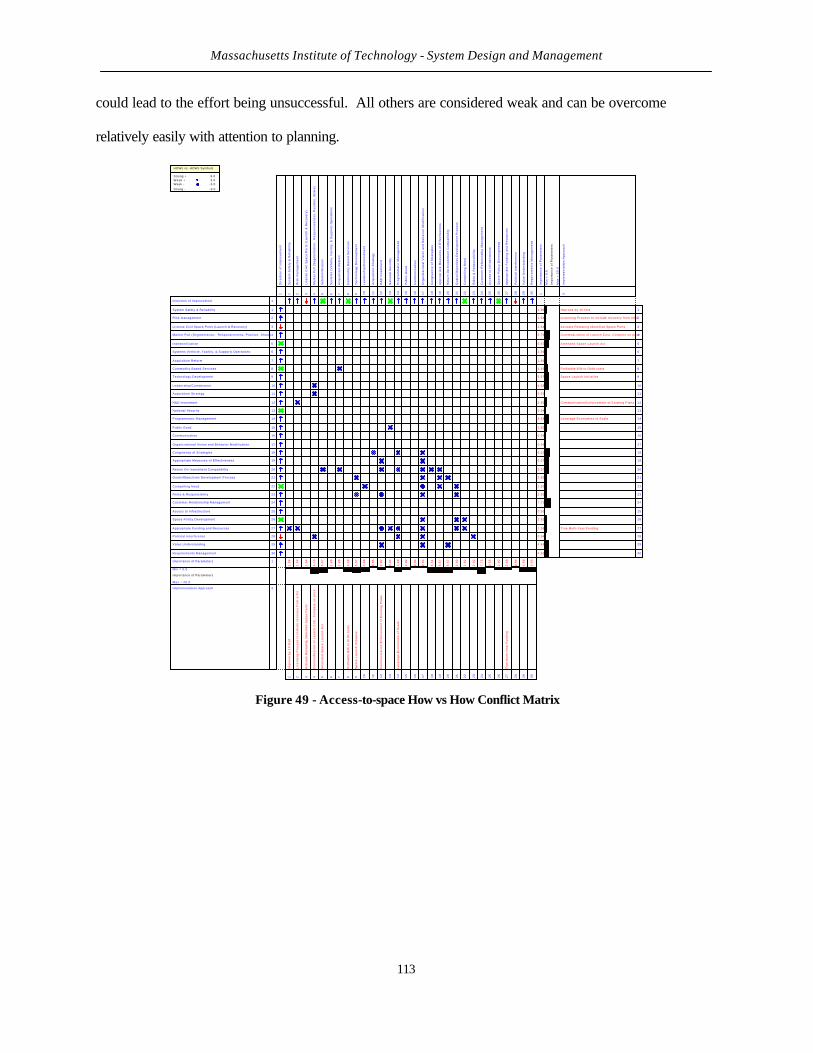
Massachusetts Institute of Technology - System Design and Management
113
could lead to the effort being unsuccessful. All others are considered weak and can be overcome
relatively easily with attention to planning.
Dir
ect
ion
of
Imp
rove
me
nt
1
Sys
tem
Sa
fety
& R
eli
ab
ilit
y
Ris
k m
an
ag
em
en
t
Lic
en
se C
ivil
Sp
ace
Po
rts
(La
un
ch &
Re
cove
ry)
Ma
rke
t P
ull
(S
eg
me
nta
tio
n,
Re
spo
nsi
ven
ess
, P
osi
tio
n,
Sh
are
)
In
de
min
ific
ati
on
Sys
tem
s (V
eh
icle
, F
aci
lity
, &
Su
pp
ort
) O
pe
rati
on
s
Acq
uis
itio
n R
efo
rm
Co
mm
od
ity
Ba
se
d S
erv
ice
s
Te
ch
no
log
y D
ev
elo
pm
en
t
Le
ad
ers
hip
/Co
mm
itm
en
t
Acq
uis
itio
n S
tra
teg
y
R&
D I
nve
stm
en
t
Na
tio
na
l S
ecu
rity
Pro
gra
mm
ati
c M
an
ag
em
en
t
Pu
bli
c G
oo
d
Co
mm
un
ica
tio
n
Org
an
iza
tio
na
l V
isio
n a
nd
Be
ha
vio
r M
od
ific
ati
on
Co
ng
rue
ncy
of
Str
ate
gie
s
Ap
pro
pri
ate
Me
asu
res
of
Eff
ect
ive
ne
ss
Re
turn
On
In
vest
me
nt
Co
mp
ati
bil
ity
Go
als
/Ob
ject
ive
s D
eve
lop
me
nt
Pro
cess
Co
mp
ell
ing
Ne
ed
Ro
les
& R
esp
on
sib
ilit
y
Cu
sto
me
r R
ela
tio
nsh
ip M
an
ag
em
en
t
Acc
ess
to
In
fra
stru
ctu
re
Sp
ac
e P
oli
cy
De
ve
lop
me
nt
Ap
pro
pri
ate
Fu
nd
ing
an
d R
eso
urc
es
Po
liti
cal
Inte
rfe
ren
ce
Va
lue
Un
de
rsta
nd
ing
Re
qu
ire
me
nts
Ma
na
ge
me
nt
1 2 3 4 5 6 7 8 9 10
11
12
13
14
15
16
17
18
19
20
21
22
23
24
25
26
27
28
29
30
Im
po
rta
nce
of
Pa
ram
ete
rs
1
1 .86
1.64
1.64
6.79
5.57
1.86
1.86
4.46
5.57
4.68
0.55
2.82
0.94
4.68
2.82
0.94
0.94
6.51
5.57
5.57
2.82
2.82
2.82
7.75
0.55
2.82
2.58
0.94
4.68
4.93
Min
= 0
.0
Imp
ort
an
ce o
f P
ara
me
ters
Ma
x =
20
.0
Im
ple
me
nta
tio
n A
pp
roa
ch
3
Leverage Economies of Scale
True Mult i-Year Funding
Communicat ion/Enforcement of Exist ing Plans
Improve by 10 fo ld
Licensing Process to inc lude recovery f rom orbi t
Act ivate Remainig Identi f ied Space Ports
Commodizat ion of Launch Cost, Compete on pr ice
Amended Space Launch Act
Profitable $/lb to Oribt costs
Space Launch In i t ia t ive
1
2
3
4
5
6
7
8
9
10
11
12
13
14
15
16
17
18
19
20
21
22
23
24
25
26
27
28
29
30
Direct ion of Improvement 1
System Safety & Rel iabi l i ty
R isk management
License Civi l Space Ports (Launch & Recovery)
Market Pul l (Segmentat ion, Responsiveness, Posit ion, Share)
Indemini f icat ion
Systems (Vehicle, Facil i ty, & Support) Operations
Acquisit ion Reform
Commodity Based Services
Technology Development
Leadership/Commitment
Acquisi t ion Strategy
R&D Investment
National Security
Programmat ic Management
Public Good
Communicat ion
Organizat ional Vis ion and Behavior Modif icat ion
Congruency of Strategies
Appropr iate Measures of Effect iveness
Return On Investment Compatibi l i ty
Goals/Object ives Development Process
Compell ing Need
Roles & Responsibi l i ty
Customer Relat ionship Management
Access to Infrastructure
Space Pol icy Development
Appropriate Funding and Resources
Pol i t ical Interference
Value Understanding
Requirements Management
1
2
3
4
5
6
7
8
9
10
11
12
13
14
15
16
17
18
19
20
21
22
23
24
25
26
27
28
29
30
Importance of Parameters 1
1.8
6
1.6
4
1.6
4
6.7
9
5.5
7
1.8
6
1.8
6
4.4
6
5.5
7
4.6
8
0.5
5
2.8
2
0.9
4
4.6
8
2.8
2
0.9
4
0.9
4
6.5
1
5.5
7
5.5
7
2.8
2
2.8
2
2.8
2
7.7
5
0.5
5
2.8
2
2.5
8
0.9
4
4.6
8
4.9
3
M in = 0.0
Importance of Parameters
Max = 20.0
Implementat ion Approach 3
Le
ve
rag
e E
co
no
mie
s o
f S
ca
le
Tru
e M
ult
i-Y
ea
r F
un
din
g
Co
mm
un
ica
tio
n/E
nfo
rce
me
nt
of
Exi
stin
g P
lan
s
Imp
rov
e b
y 1
0 f
old
Lic
en
sin
g P
roc
es
s t
o i
nc
lud
e r
ec
ov
ery
fro
m o
rbit
Act
iva
te R
em
ain
ig I
de
nti
fie
d S
pa
ce P
ort
s
Co
mm
od
iza
tio
n o
f L
au
nch
Co
st,
Co
mp
ete
on
pri
ce
Am
en
de
d S
pa
ce
La
un
ch
Ac
t
Pro
fita
ble
$/l
b t
o O
rib
t co
sts
Sp
ac
e L
au
nc
h I
nit
iati
ve
1 2 3 4 5 6 7 8 9 10
11
12
13
14
15
16
17
18
19
20
21
22
23
24
25
26
27
28
29
30
D irect ion of Improvement
Max im i ze 1.0Target 0.0M in im ize -1.0
HOWs vs. HOWs Symbols
Strong + 9.0Weak + 3.0Weak - -3.0
Strong - -9.0
Figure 49 - Access-to-space How vs How Conflict Matrix
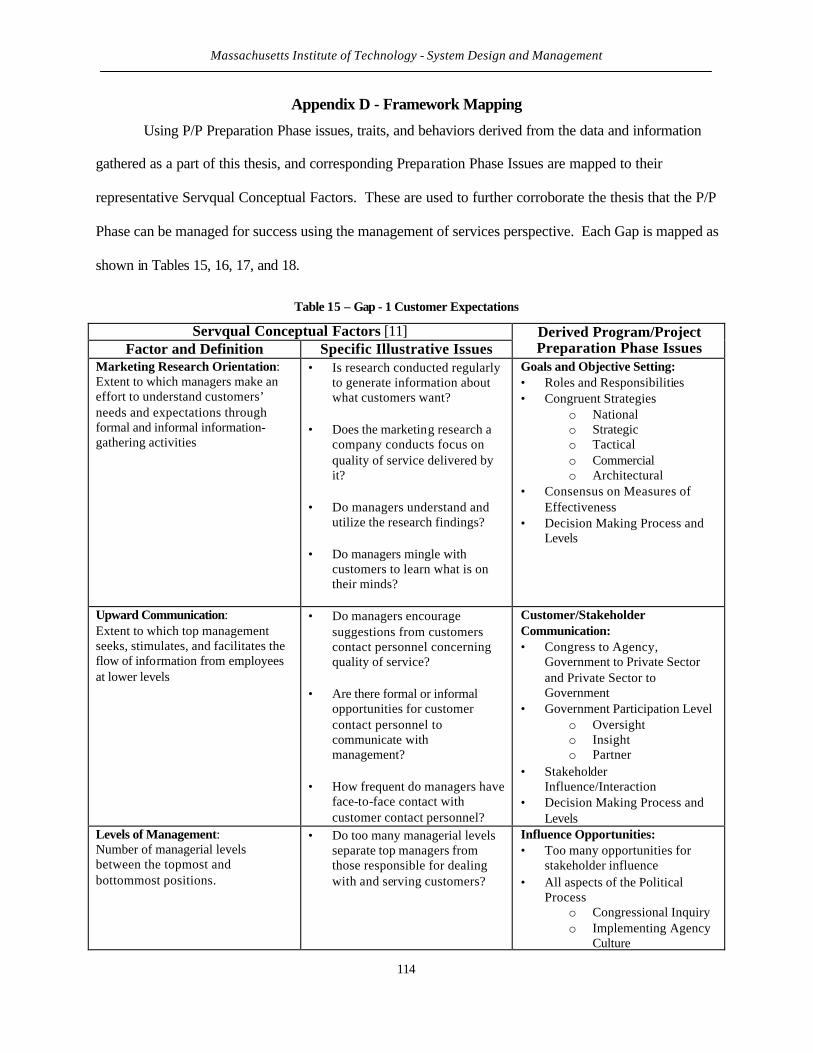
Massachusetts Institute of Technology - System Design and Management
114
Appendix D - Framework Mapping
Using P/P Preparation Phase issues, traits, and behaviors derived from the data and information
gathered as a part of this thesis, and corresponding Preparation Phase Issues are mapped to their
representative Servqual Conceptual Factors. These are used to further corroborate the thesis that the P/P
Phase can be managed for success using the management of services perspective. Each Gap is mapped as
shown in Tables 15, 16, 17, and 18.
Table 15 – Gap - 1 Customer Expectations
Servqual Conceptual Factors [11] Factor and Definition Specific Illustrative Issues
Derived Program/Project Preparation Phase Issues
Marketing Research Orientation: Extent to which managers make an effort to understand customers’ needs and expectations through formal and informal information-gathering activities
• Is research conducted regularly to generate information about what customers want?
• Does the marketing research a
company conducts focus on quality of service delivered by it?
• Do managers understand and
utilize the research findings? • Do managers mingle with
customers to learn what is on their minds?
Goals and Objective Setting: • Roles and Responsibilities • Congruent Strategies
o National o Strategic o Tactical o Commercial o Architectural
• Consensus on Measures of Effectiveness
• Decision Making Process and Levels
Upward Communication: Extent to which top management seeks, stimulates, and facilitates the flow of information from employees at lower levels
• Do managers encourage suggestions from customers contact personnel concerning quality of service?
• Are there formal or informal
opportunities for customer contact personnel to communicate with management?
• How frequent do managers have
face-to-face contact with customer contact personnel?
Customer/Stakeholder Communication: • Congress to Agency,
Government to Private Sector and Private Sector to Government
• Government Participation Level o Oversight o Insight o Partner
• Stakeholder Influence/Interaction
• Decision Making Process and Levels
Levels of Management: Number of managerial levels between the topmost and bottommost positions.
• Do too many managerial levels separate top managers from those responsible for dealing with and serving customers?
Influence Opportunities: • Too many opportunities for
stakeholder influence • All aspects of the Political
Process o Congressional Inquiry o Implementing Agency
Culture
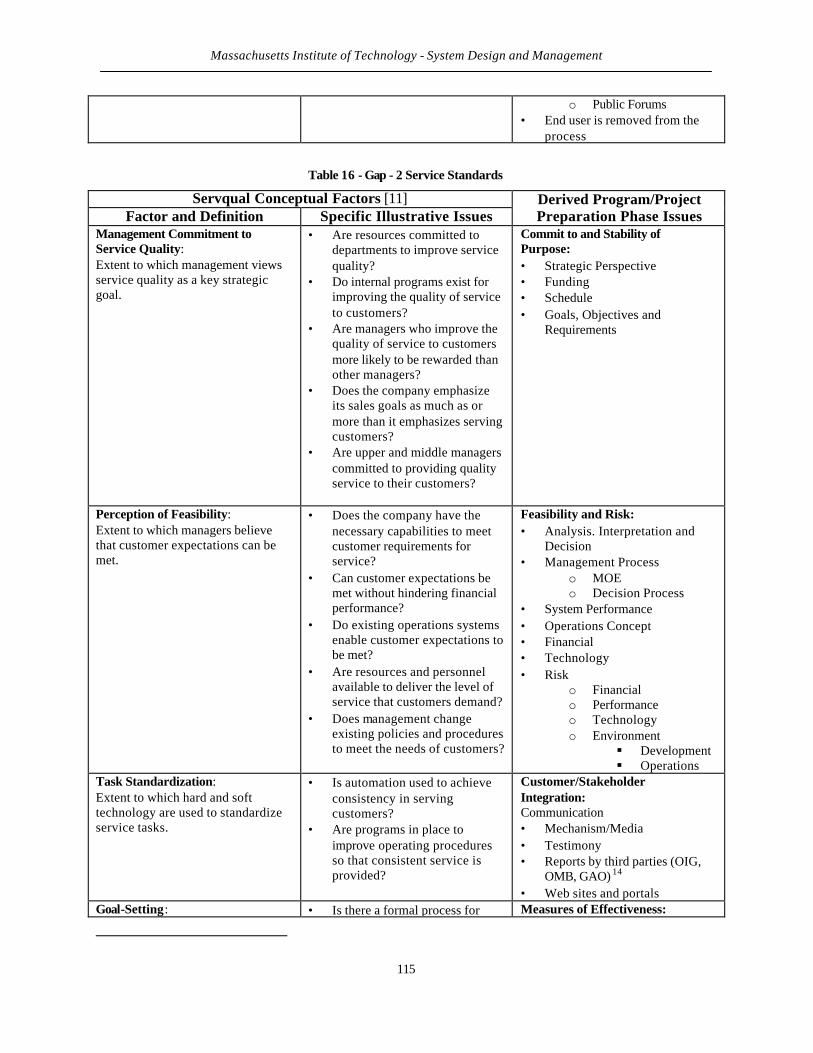
Massachusetts Institute of Technology - System Design and Management
115
o Public Forums • End user is removed from the
process
Table 16 - Gap - 2 Service Standards
Servqual Conceptual Factors [11] Factor and Definition Specific Illustrative Issues
Derived Program/Project Preparation Phase Issues
Management Commitment to Service Quality: Extent to which management views service quality as a key strategic goal.
• Are resources committed to departments to improve service quality?
• Do internal programs exist for improving the quality of service to customers?
• Are managers who improve the quality of service to customers more likely to be rewarded than other managers?
• Does the company emphasize its sales goals as much as or more than it emphasizes serving customers?
• Are upper and middle managers committed to providing quality service to their customers?
Commit to and Stability of Purpose: • Strategic Perspective • Funding • Schedule • Goals, Objectives and
Requirements
Perception of Feasibility: Extent to which managers believe that customer expectations can be met.
• Does the company have the necessary capabilities to meet customer requirements for service?
• Can customer expectations be met without hindering financial performance?
• Do existing operations systems enable customer expectations to be met?
• Are resources and personnel available to deliver the level of service that customers demand?
• Does management change existing policies and procedures to meet the needs of customers?
Feasibility and Risk: • Analysis. Interpretation and
Decision • Management Process
o MOE o Decision Process
• System Performance • Operations Concept • Financial • Technology • Risk
o Financial o Performance o Technology o Environment
§ Development § Operations
Task Standardization: Extent to which hard and soft technology are used to standardize service tasks.
• Is automation used to achieve consistency in serving customers?
• Are programs in place to improve operating procedures so that consistent service is provided?
Customer/Stakeholder Integration: Communication • Mechanism/Media • Testimony • Reports by third parties (OIG,
OMB, GAO) 14 • Web sites and portals
Goal-Setting: • Is there a formal process for Measures of Effectiveness:
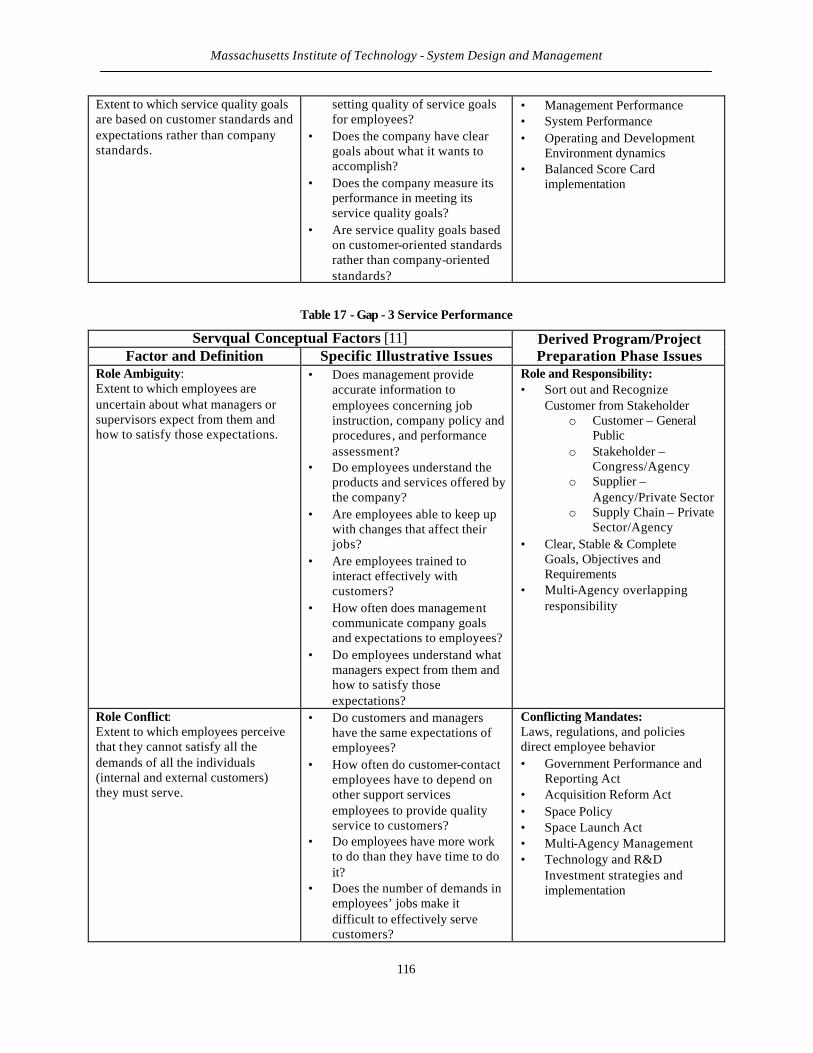
Massachusetts Institute of Technology - System Design and Management
116
Extent to which service quality goals are based on customer standards and expectations rather than company standards.
setting quality of service goals for employees?
• Does the company have clear goals about what it wants to accomplish?
• Does the company measure its performance in meeting its service quality goals?
• Are service quality goals based on customer-oriented standards rather than company-oriented standards?
• Management Performance • System Performance • Operating and Development
Environment dynamics • Balanced Score Card
implementation
Table 17 - Gap - 3 Service Performance
Servqual Conceptual Factors [11] Factor and Definition Specific Illustrative Issues
Derived Program/Project Preparation Phase Issues
Role Ambiguity: Extent to which employees are uncertain about what managers or supervisors expect from them and how to satisfy those expectations.
• Does management provide accurate information to employees concerning job instruction, company policy and procedures, and performance assessment?
• Do employees understand the products and services offered by the company?
• Are employees able to keep up with changes that affect their jobs?
• Are employees trained to interact effectively with customers?
• How often does management communicate company goals and expectations to employees?
• Do employees understand what managers expect from them and how to satisfy those expectations?
Role and Responsibility: • Sort out and Recognize
Customer from Stakeholder o Customer – General
Public o Stakeholder –
Congress/Agency o Supplier –
Agency/Private Sector o Supply Chain – Private
Sector/Agency • Clear, Stable & Complete
Goals, Objectives and Requirements
• Multi-Agency overlapping responsibility
Role Conflict: Extent to which employees perceive that they cannot satisfy all the demands of all the individuals (internal and external customers) they must serve.
• Do customers and managers have the same expectations of employees?
• How often do customer-contact employees have to depend on other support services employees to provide quality service to customers?
• Do employees have more work to do than they have time to do it?
• Does the number of demands in employees’ jobs make it difficult to effectively serve customers?
Conflicting Mandates: Laws, regulations, and policies direct employee behavior • Government Performance and
Reporting Act • Acquisition Reform Act • Space Policy • Space Launch Act • Multi-Agency Management • Technology and R&D
Investment strategies and implementation
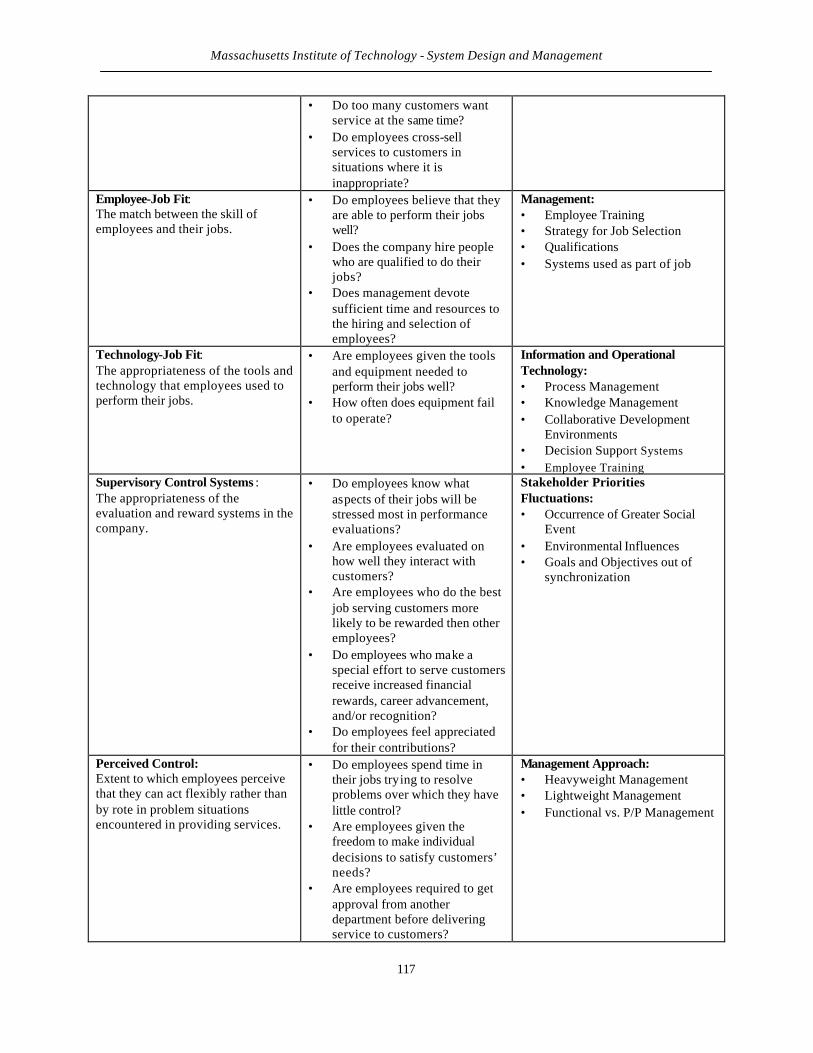
Massachusetts Institute of Technology - System Design and Management
117
• Do too many customers want service at the same time?
• Do employees cross-sell services to customers in situations where it is inappropriate?
Employee-Job Fit: The match between the skill of employees and their jobs.
• Do employees believe that they are able to perform their jobs well?
• Does the company hire people who are qualified to do their jobs?
• Does management devote sufficient time and resources to the hiring and selection of employees?
Management: • Employee Training • Strategy for Job Selection • Qualifications • Systems used as part of job
Technology-Job Fit: The appropriateness of the tools and technology that employees used to perform their jobs.
• Are employees given the tools and equipment needed to perform their jobs well?
• How often does equipment fail to operate?
Information and Operational Technology: • Process Management • Knowledge Management • Collaborative Development
Environments • Decision Support Systems • Employee Training
Supervisory Control Systems : The appropriateness of the evaluation and reward systems in the company.
• Do employees know what aspects of their jobs will be stressed most in performance evaluations?
• Are employees evaluated on how well they interact with customers?
• Are employees who do the best job serving customers more likely to be rewarded then other employees?
• Do employees who make a special effort to serve customers receive increased financial rewards, career advancement, and/or recognition?
• Do employees feel appreciated for their contributions?
Stakeholder Priorities Fluctuations: • Occurrence of Greater Social
Event • Environmental Influences • Goals and Objectives out of
synchronization
Perceived Control: Extent to which employees perceive that they can act flexibly rather than by rote in problem situations encountered in providing services.
• Do employees spend time in their jobs trying to resolve problems over which they have little control?
• Are employees given the freedom to make individual decisions to satisfy customers’ needs?
• Are employees required to get approval from another department before delivering service to customers?
Management Approach: • Heavyweight Management • Lightweight Management • Functional vs. P/P Management
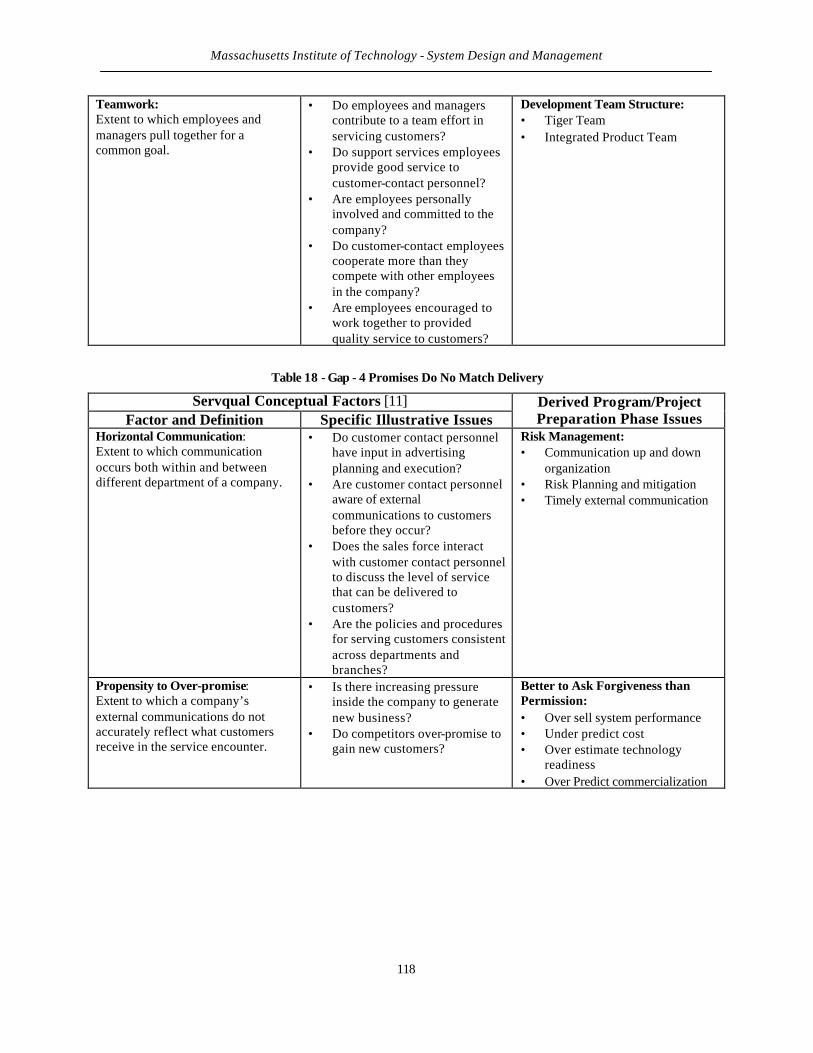
Massachusetts Institute of Technology - System Design and Management
118
Teamwork: Extent to which employees and managers pull together for a common goal.
• Do employees and managers contribute to a team effort in servicing customers?
• Do support services employees provide good service to customer-contact personnel?
• Are employees personally involved and committed to the company?
• Do customer-contact employees cooperate more than they compete with other employees in the company?
• Are employees encouraged to work together to provided quality service to customers?
Development Team Structure: • Tiger Team • Integrated Product Team
Table 18 - Gap - 4 Promises Do No Match Delivery
Servqual Conceptual Factors [11] Factor and Definition Specific Illustrative Issues
Derived Program/Project Preparation Phase Issues
Horizontal Communication: Extent to which communication occurs both within and between different department of a company.
• Do customer contact personnel have input in advertising planning and execution?
• Are customer contact personnel aware of external communications to customers before they occur?
• Does the sales force interact with customer contact personnel to discuss the level of service that can be delivered to customers?
• Are the policies and procedures for serving customers consistent across departments and branches?
Risk Management: • Communication up and down
organization • Risk Planning and mitigation • Timely external communication
Propensity to Over-promise: Extent to which a company’s external communications do not accurately reflect what customers receive in the service encounter.
• Is there increasing pressure inside the company to generate new business?
• Do competitors over-promise to gain new customers?
Better to Ask Forgiveness than Permission: • Over sell system performance • Under predict cost • Over estimate technology
readiness • Over Predict commercialization