lean six sigma tools and techniques for continuous improvement session five this product was funded...
TRANSCRIPT

Lean Six Sigma Tools and Techniques for Continuous Improvement
Session Five
This product was funded by a grant awarded under the President’s High Growth Job Training Initiative as implemented by the U.S. Department of Labor’s Employment & Training Administration. The information
contained in this product was created by a grantee organization and does not necessarily reflect the official position of the U.S. Department of Labor. All references to non-governmental companies or
organizations, their services, products, or resources are offered for informational purposes and should not be construed as an endorsement by the Department of Labor. This product is copyrighted by the
institution that created it and is intended for individual organizational, non-commercial use only.

Six Lean Tools
1. Learning to See ‘Muda’ by Standardizing Operations
2. Visual Workplace and Visual Controls
3. Process Simulations
4. POUS and Quality at the Source
5. Value Stream Mapping
Current State Workshop
Future State Workshop
Push Vs. Pull Systems
Materials Flows – Information Flows
6. Quick-and-Easy Kaizens

Push vs. Pull Systems Push System
Produces product, using forecasts or schedules, without regard for what is required by the next operation or the Customer
Pull SystemA method of controlling the flow of resources by indirectly linking dissimilar functions, through the use of visual controls (Kanbans and Supermarkets), replacing only what has been consumed by the Customer
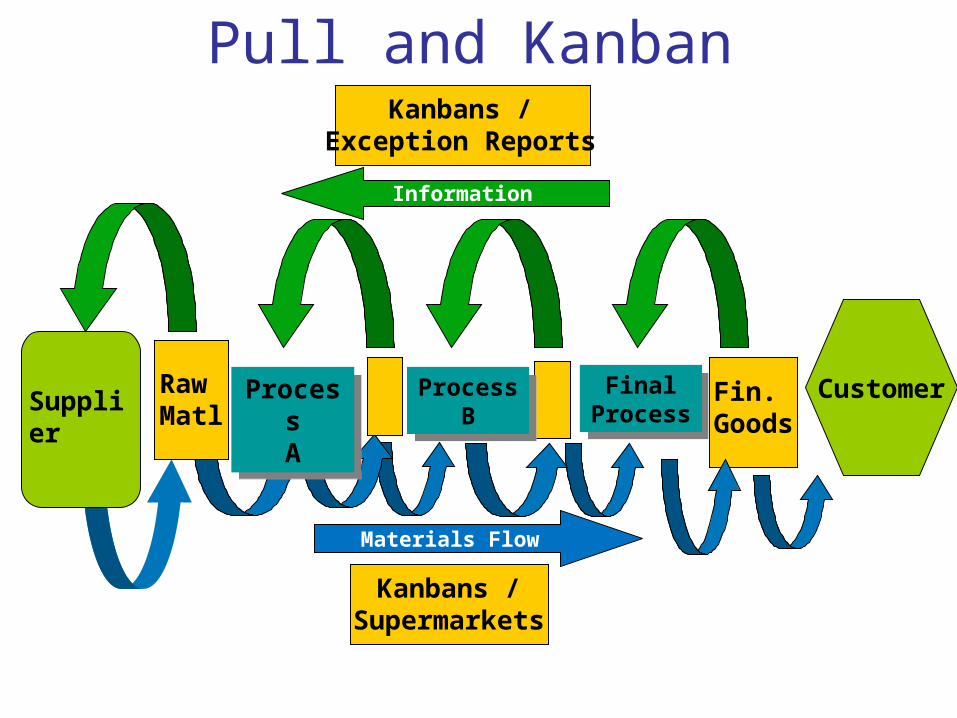
Pull and Kanban
Information Flow
SupplierRawMatl
ProcessA
ProcessA
Fin. Goods
Kanbans /Supermarkets
FinalProcess
FinalProcess
Customer
Materials Flow
ProcessB
ProcessB
Kanbans /Exception Reports
Future State Attributes• Identify Improved Information Flows &
Materials Flows• Identify needed Exception Reporting • Identify Supermarkets - Pull Systems
(where, what materials, what quantity)• Order Processing (FIFO)

Information Flows (Future State)• Exception Reporting - Replenishment Cycles
Raw Materials Replenishment Cycle Min-Max Levels Kanban Cards (Internal) or Containers
(Vendors) Vendor Managed Inventory
Finished Goods Replenishment Cycle “Build to Stock” Model Min-Max Levels “Build to Order” Model FIFO Order
Processing


What is a Kanban/Kanban Card?
• A visual instruction device that is set up to allow every operation to produce only the amount of a product that will actually be used in the next step of the production process.
• Example data that may be on a Kanban Card:Part numberPicture or DrawingStyleAddress where product originated (supply
process)Delivery point (next process)

103612YCRCV3358
Wheel3” X 3 5/8” Poly
100 PiecesRequesting Dept. – Rollers
II III I II IIII II IIIRev. 3-16-06
Kanban Card (Internal)

Kanban Container (External)

Materials Flows (Future State)
• Visual Supermarkets
• POUS
• Kanban Cards or Containers

Visual Supermarket
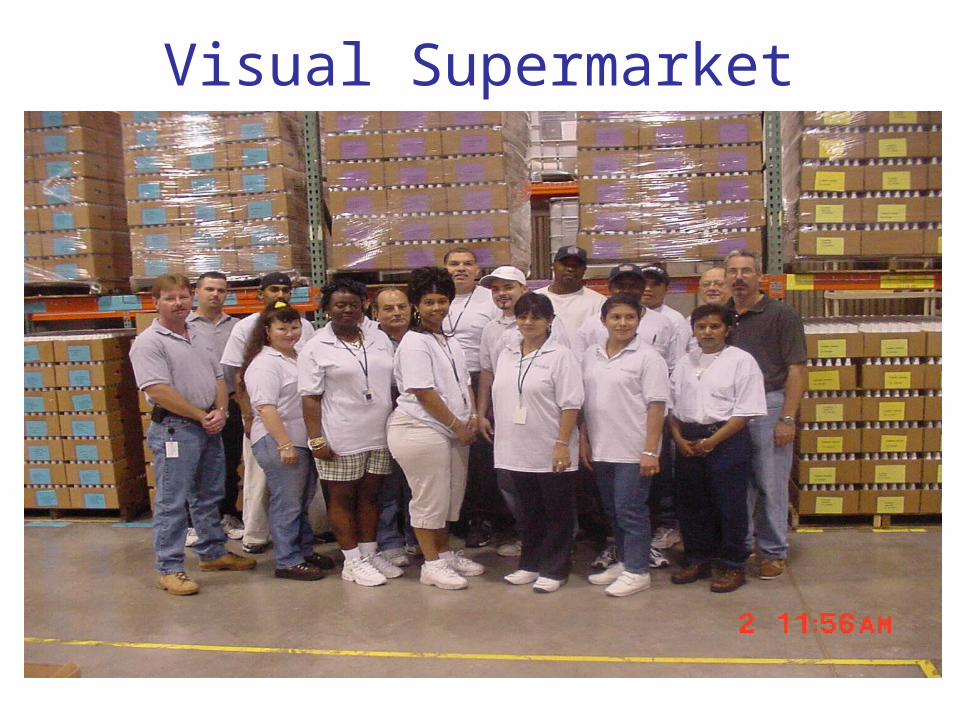
Visual Supermarket

Visual Inventory System (No ERP)

Creating the Future State Workshop1. Teams create your own Future State Map using the QI
Macros.
2. Include Major Process Steps and… Signals (what to do next)
Supermarkets, Kanban Pull Systems Exception Reports
Where needed & Content Kaizen Targets
Create Signals where none exist Total Lead Time
Target 50 % Reduction from Current State
3. Display and report on the teams’ Future State
4. Time: 90 min.

Six Lean Tools
1. Learning to See ‘Muda’ by Standardizing Operations
2. Visual Workplace and Visual Controls
3. Process Simulations
4. POUS and Quality at the Source
5. Value Stream Mapping
Current State Workshop
Future State Workshop
• Push Vs. Pull Systems
• Materials Flows – Information Flows
6. Quick-and-Easy Kaizens

Kaizen = Change + Improvement
Change your
way of working
Qui
ck
Sim
ple
Easy KAIZEN
Change your
point of view
Change your
way of thinking

12 - Kaizen Target Areas• Customer Service – can be improved
• Quality – can be improved
• Costs – can be lowered
• Information Flow – improve delivery and production time
• Cycle Time, Set-up Time – can be reduced
• Inventory – reduce the unnecessary stock
• Materials Flow – Can be improved
• Safety – reduce possible accidents
• People – improve worker’s skills and knowledge
• Equipment – improve downtime and efficiency
• Environment – improve air quality, reduce odors
• Visual – use colors, clean up, find things easier
• Location – reduce unnecessary motion or facilitate necessary interaction, etc.
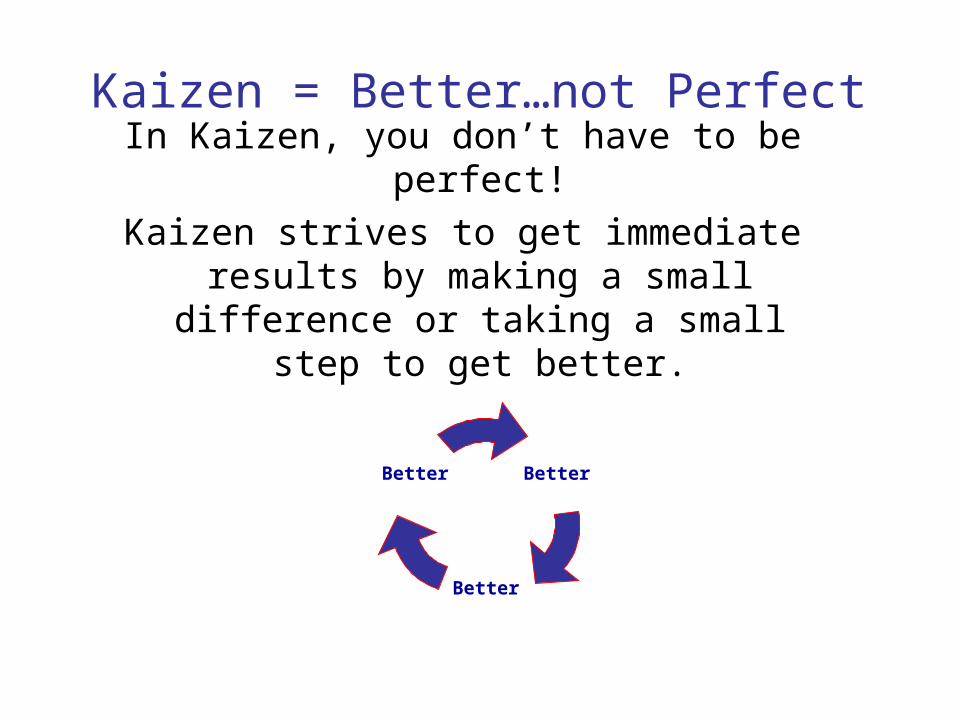
Kaizen = Better…not PerfectIn Kaizen, you don’t have to be perfect!
Kaizen strives to get immediate results by making a small difference or taking a
small step to get better.
Better
Better
Better

3 Elements That Make Kaizen Work
• Surface – Write [t]he Idea Down.
• Implement – You Make the Change.
• Share – Post it, Review it, and Talk about it.

3 Kaizen Report Items:
• Before: What was the problem?
• After: How was it improved?
• Effect: What were the results?
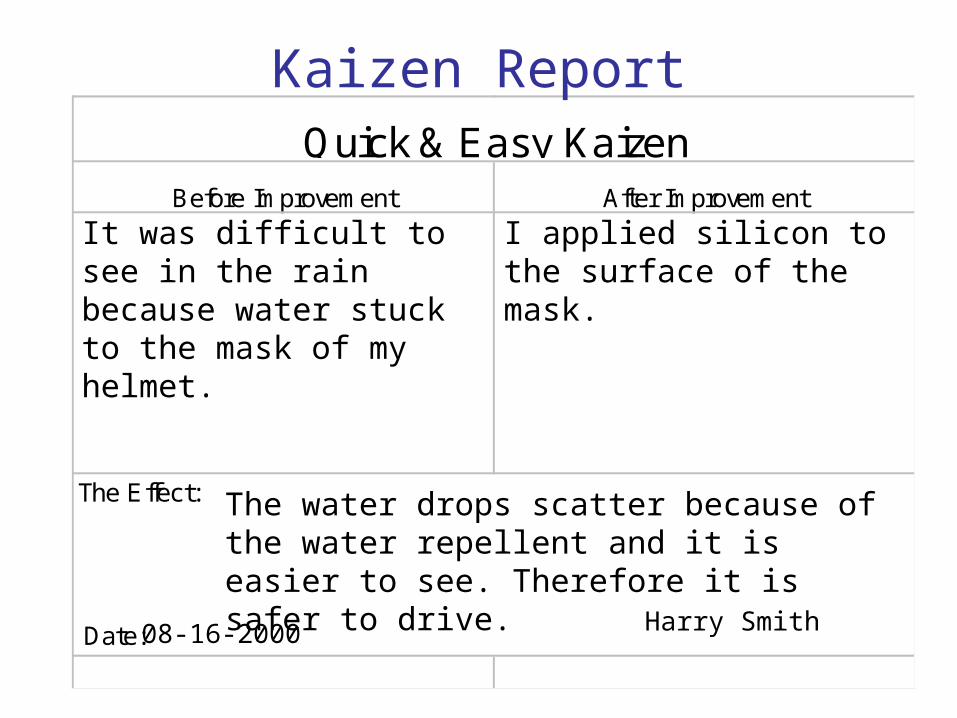
Before Improvement After Improvement
Quick & Easy Kaizen
The Effect:
Date: Name:
It was difficult to see in the rain because water stuck to the mask of my helmet.
I applied silicon to the surface of the mask.
The water drops scatter because of the water repellent and it is easier to see. Therefore it is safer to drive.
08-16-2000 Harry Smith
Kaizen Report

“I know we can’t do this because…
But if we could, how would we…”
Overcoming Limitations
Limitations• Budget• Time • Manpower• Equipment• Facilities• Human Factors• Organizational Constraints
Actions• If we don’t have a large
enough budget, we come up with ideas for things we can do within our limited budget.
• If we only have three people to do the job, we need to come up with a method to do the job with three people.That is Kaizen.

Kaizen = Change !• Changing your viewpoint or your position• Changing your steps or methods• Changing the way you are combining
things• Changing materials and parts• Changing in a “pinch” or in a difficult time• Changing negative to positive• Changing the timing, etc.

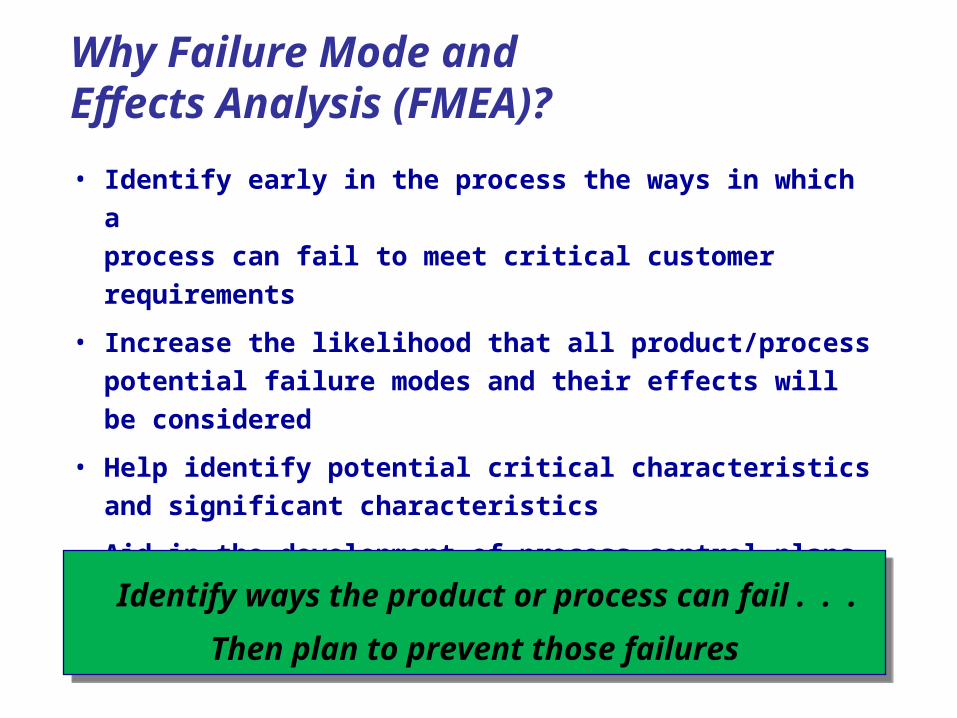
• Identify early in the process the ways in which a
process can fail to meet critical customer requirements
• Increase the likelihood that all product/process potential
failure modes and their effects will be considered
• Help identify potential critical characteristics and significant
characteristics
• Aid in the development of process control plans
• Prioritize the actions that should be taken to improve the
process
Identify ways the product or process can fail . . .
Then plan to prevent those failures
Identify ways the product or process can fail . . .
Then plan to prevent those failures
The FMEA Lean Six Sigma Tool
• Identify early in the process the ways in which a
process can fail to meet critical customer requirements
• Increase the likelihood that all product/process potential
failure modes and their effects will be considered
• Help identify potential critical characteristics and significant
characteristics
• Aid in the development of process control plans
• Prioritize the actions that should be taken to improve the
process
Identify ways the product or process can fail . . .
Then plan to prevent those failures
Identify ways the product or process can fail . . .
Then plan to prevent those failures
Why Failure Mode and Effects Analysis (FMEA)?

FMEA Basic Definitions• Failure Mode:
• The manner in which a specific part/process fails
• If not detected and either corrected or removed, will cause one of the “effects” to occur (can sometimes be identical to effect)
• Can be associated with a defect or nonconformance that goes outside of specification. How could this process fail to complete its intended function?
– Examples: Late, defects on a form, wrong entry, bent, cracked, defect in ‘Y” or CTQ (X)
• Cause:
• A condition that produces a Failure Mode or a process deficiency that results in a Failure Mode
• Causes are sources of process variability
• Failure Effect:
• Impact on customer requirements if [Failure Mode] is not prevented or detected (often cost, schedule, and/or performance related). What will happen as a result of the failure mode?
• Should be expressed in terms of the product/process function

CausesBroken tools
No standard processWorn bearings Computer interface not accuratePoor handling No PriorityInadequate gating Lack of ownershipInefficient cooling Manual ProcessHeat treat shrinkage
Failure modesOversize Cracked Late deliveryUndersize Open Wrong informationRough ShortedEccentric Leaking Lost paperworkMisassembled Damaged Wrong count
High losses Reduced sales
Field failure Unsatisfied customers
Effects
Examples

Effect
Failure Mode (Defect)
MeasurementPeopleMaterials
EnvironmentMachinesMethods
Goal of FMEAGoal of FMEA
Prevent or Detect
Eliminate/Reduce/Mitigate Effect
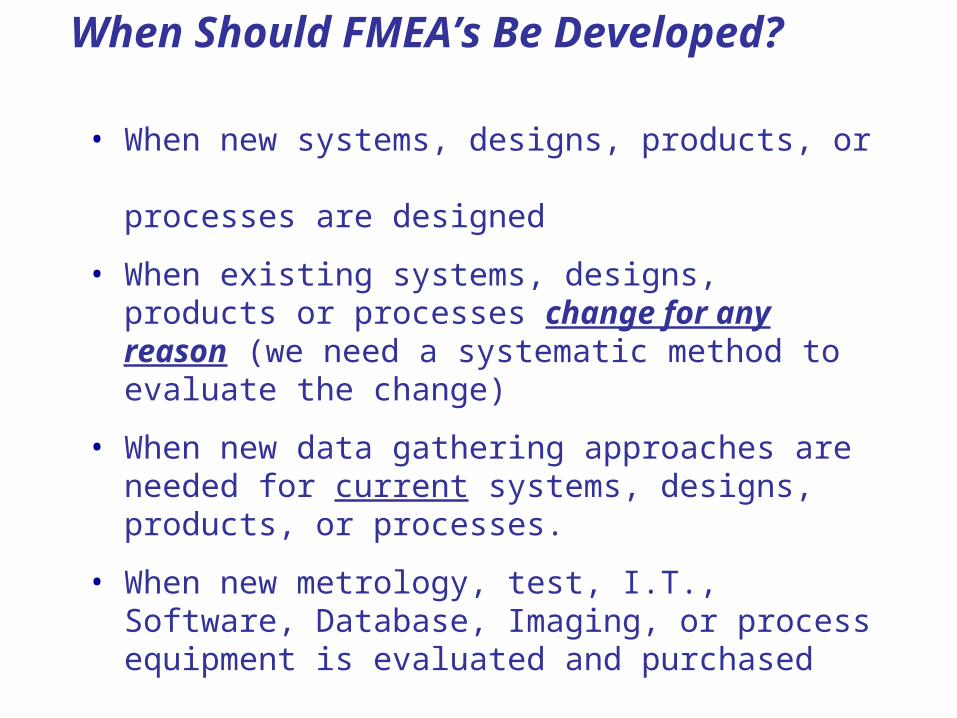
When Should FMEA’s Be Developed?• When new systems, designs, products, or
processes are designed
• When existing systems, designs, products or processes change for any reason (we need a systematic method to evaluate the change)
• When new data gathering approaches are needed for current systems, designs, products, or processes.
• When new metrology, test, I.T., Software, Database, Imaging, or process equipment is evaluated and purchased

Benefits of FMEA
Proactive approach
Developed during the introduction of a new designs or processes with purpose of preventing potential failures by
–Eliminate potential causes of failures
–Select better alternatives
–Develop process controls and containment and test methods
–Develop preventive maintenance programs
–Develop problem response plans
Reactive approach
Apply to existing process with purpose of managing failures by :
–Analyze known failures due to a specific process step
–Use[d] as a risk assessment tool
–Prioritize corrective action to prevent/reduce reoccurrence of failures
–Strengthen control and containment of current failures
–Develop problem response plan

• Severity (SEV): How significant is the impact of the Effect to the customer (internal or external)?
• Occurrence (OCC): How likely is the Cause of the Failure Mode to occur?
• Detection (DET): How likely will the current system detect the Cause or Failure Mode if it occurs?
Scoring
1 10
Least
Significant
FMEA includes detection in the risk equationFMEA includes detection in the risk equation
Not
Likely to
OccurLikely to
Detect
Most
Significant
Likely
to
OccurNot Likely
to Detect
Ratings to Determine Overall Risk

FMEA Definitions
•Risk Priority Number (RPN)
•A numerical calculation of the relative risk of a particular Failure Mode
•RPN = Severity x Occurrence x DetectionSEV x OCC x DET
•This number is then used to place priority on which items need additional quality planning
•Current Controls
•The mechanisms that prevent or detect the Failure Mode before it reaches your customer. Current Controls include SPC, Inspections, Monitoring, Training, and Preventive Maintenance
•Recommended Actions
•Corrective actions to reduce severity, occurrence and/or detection rankings. Directed at the highest RPN and critical severity items

Tool Box – FMEA FormTool Box – FMEA Form
Lists Failure Modes for
each Process Step
Lists the Effects of
each Failure Mode
List of Process Steps or
Product Parts
Rates the Severity of the Effect to the Customer
on a 1 to 10 Scale
Doing The FMEA Analysis

Rates how often a particular Cause or
Failure Mode Occurs:
1=Not Often
10=Very Often
Lists the Causes for each Failure
Mode: Each Cause is
associated with a process input
out-of-Spec
Documents how the Cause is
currently being controlled in the
process
Rates how well the Cause or the Failure
Mode can be detected.
1=Detect Every Time
10=Cannot Detect
FMEA Form-Assessing Current Situation
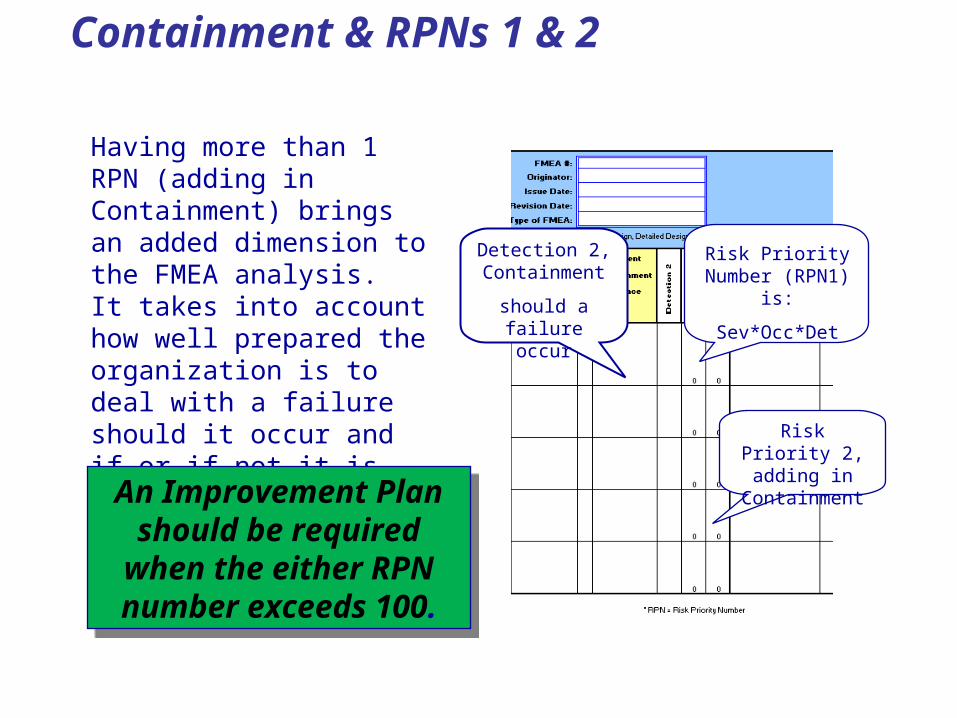
Containment & RPNs 1 & 2
Risk Priority Number (RPN1) is:
Sev*Occ*Det
Detection 2, Containment
should a failure occur
Risk Priority 2, adding in
Containment
Having more than 1 RPN (adding in Containment) brings an added dimension to the FMEA analysis. It takes into account how well prepared the organization is to deal with a failure should it occur and if or if not it is detected.
An Improvement Plan should be required
when the either RPN number exceeds 100.
An Improvement Plan should be required
when the either RPN number exceeds 100.

Designates who is responsible for
action and projected completion data
Documents actions recommended based
on RPN Pareto When [c]orrective [a]ction Is [to be]
[c]ompleted
This portion of the plan is as critical as the previous elements. Without action the FMEA is simply not worth doing.
This portion of the plan is as critical as the previous elements. Without action the FMEA is simply not worth doing.
FMEA Form Continued - Improvement Plan

Completing The FMEA
List what was done. This often
references more detailed
documentation and procedures
Recalculate Severity Occurrence, Detections 1,
Detection 2 and assess new score.
Is it adequate?
The FMEA assists with assessing the effeteness of the remedies implemented and is part of the projects permanent documentation.
The FMEA assists with assessing the effeteness of the remedies implemented and is part of the projects permanent documentation.

1. Select the Process FMEA team.
2. Develop a Process Map and identify all process steps.
3. For each Process Step, list its intended function.
4. Start the process FMEA.
5. For each Process Step, list ways that it can fail to complete its intended function. This is normally some in process defect and is called the failure mode.
6. List possible causes that may bring about the failure mode.
7. Assign Ratings:
- Severity to Effect,
- Occurrence to Cause,
- Detection 1 & 2 to each Cause (preferred) or Failure Mode.
8. Calculate the risk priority number for each potential cause.
9. Determine recommended actions to reduce all RPNs: Eliminate Causes, improve detection of causes and early detection of failure modes.
10.Take appropriate actions.
11.Re-calculate all RPNs – Are they good enough?
The FMEA Process Pulling It All Together

Implement Pilot Solutions1. Collect data according to the FMEA Action Plan
2. Implement Contingency Plans
3. Evaluate Results
4. See Chapter 10, pg 77 of Step-By-Step Problem Solving