leanview - bluespring online
TRANSCRIPT

LeanView™ The Next Generation of Lean Copyright 2012 bluespring | SOFTWARE Page 1 www.bluespringsoftware.com
LeanView™
The Next Generation of Lean
Improving Lean Program Performance
Quick Start Tutorial
Copyright 2012 Bluespring Software All Rights Reserved
www.bluespringsoftware.com
For use with versions 4.0.39 – 6.0.0 of LeanView

LeanView™ The Next Generation of Lean Copyright 2012 bluespring | SOFTWARE Page 2 www.bluespringsoftware.com
With LeanViewTM
, it’s as simple as:
Enter Customer Demand
Draw the Value Stream
Record the Value Stream
Now it’s time to run the Analytics (Map Analysis Report)
1
3
2
Go

LeanView™ The Next Generation of Lean Copyright 2012 bluespring | SOFTWARE Page 3 www.bluespringsoftware.com
Objective
Learning Objective:
This tutorial is intended to familiarize the user with the basic capabilities of the LeanView environment, data entry,
recording value streams, creating customer demand data and running the Map Analysis Report (Analytics). We will
walk you through the following procedures:
• Opening a LeanView
Template
• Developing & Entering Business Objectives
• Entering Value Stream Map Properties
• Entering Customer Demand Data **
• Understanding Work Time
• Creating a Master Raw Materials / WIP List
• Drawing a Basic Value Stream Map **
• Entering Process Properties
• Entering WIP at an Inventory location
• Recording a Value Stream **
• Producing a Map Analysis Report
** While there are many items in the list, Only Entering Customer Demand, Drawing the Value Stream Map, and
Recording the Value Stream are strictly required for the system to produce a Map Analysis Report. Obviously,
entering data for processes and inventory makes the report more meaningful.
Time to Complete Exercise:
You should allow 20-25 minutes to complete this exercise.
Advanced Functionality / Learning more about LeanView:
There are many more features in the LeanView solution. For information on those features, please visit us on the
web at www.bluespringsoftware.com/products and click on the “LeanView” link, or contact us directly at
877.794.1764 to inquire about training.
LeanView™ The Next Generation of Lean Copyright 2012 bluespring | SOFTWARE Page 4 www.bluespringsoftware.com
I. Quick Start
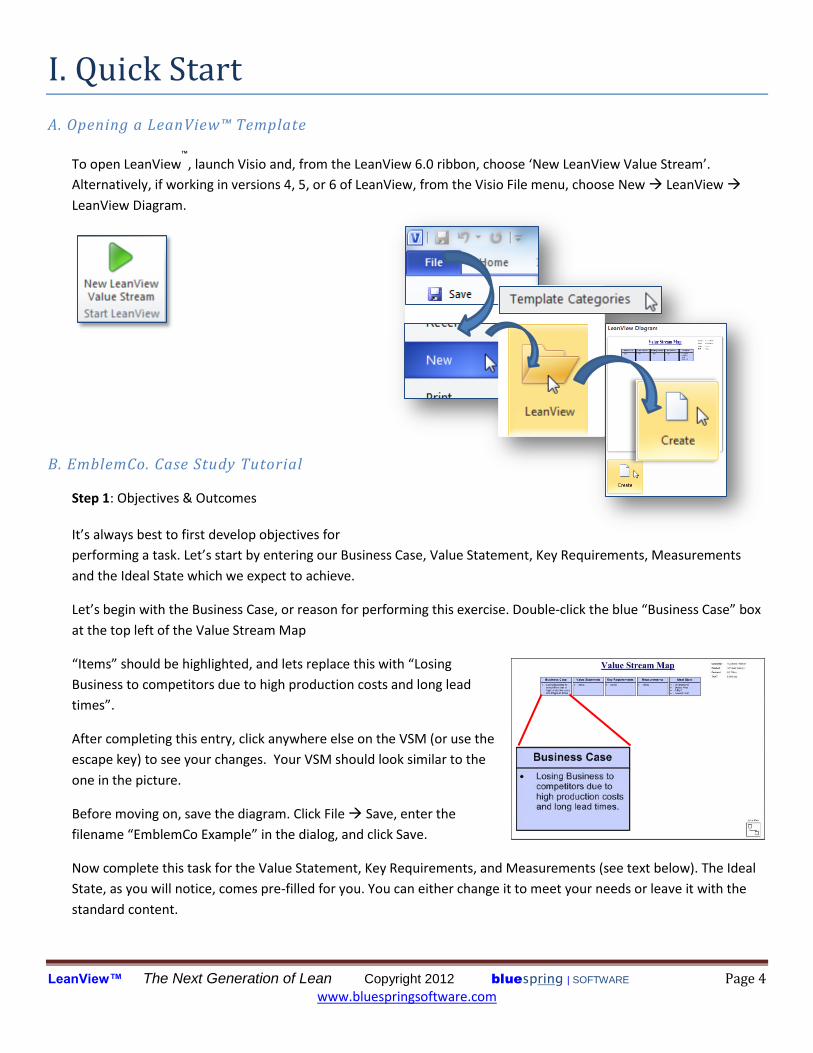
A. Opening a LeanView™ Template
To open LeanView™
, launch Visio and, from the LeanView 6.0 ribbon, choose ‘New LeanView Value Stream’.
Alternatively, if working in versions 4, 5, or 6 of LeanView, from the Visio File menu, choose New LeanView
LeanView Diagram.
B. EmblemCo. Case Study Tutorial
Step 1: Objectives & Outcomes
It’s always best to first develop objectives for
performing a task. Let’s start by entering our Business Case, Value Statement, Key Requirements, Measurements
and the Ideal State which we expect to achieve.
Let’s begin with the Business Case, or reason for performing this exercise. Double-click the blue “Business Case” box
at the top left of the Value Stream Map
“Items” should be highlighted, and lets replace this with “Losing
Business to competitors due to high production costs and long lead
times”.
After completing this entry, click anywhere else on the VSM (or use the
escape key) to see your changes. Your VSM should look similar to the
one in the picture.
Before moving on, save the diagram. Click File Save, enter the
filename “EmblemCo Example” in the dialog, and click Save.
Now complete this task for the Value Statement, Key Requirements, and Measurements (see text below). The Ideal
State, as you will notice, comes pre-filled for you. You can either change it to meet your needs or leave it with the
standard content.

LeanView™ The Next Generation of Lean Copyright 2012 bluespring | SOFTWARE Page 5 www.bluespringsoftware.com
Step 1: Developing Objectives & Expected Outcomes Continued
Value Statement:
Improve cost performance by synchronizing production with customer demand.
Key Requirements:
1) No New Hires
2) No Overtime
Measurements:
1) Total Flow Time
2) Inventory Cost and Quantity
Ideal State: Use the default values
1) On-Demand
2) Defect Free
3) 1-By-1
4) Lowest Cost
The Business Case Analysis Work Area of your VSM should now look like this:
Note: While entering some of the statements, you may get text that overflows these boxes. If this happens, you
can highlight the text and change the font size to a smaller value, or you can change the size of the box.
Note: If the auto-save functionality is enabled, Visio will automatically save your work at set intervals. It is a
good idea, however, to get into the habit of saving your work to avoid unintentional loss of data by using File
Save or using the shortcut Ctrl-S.
Next, let’s move on to the Map Properties.
Business Case
· Losing Business to competitors due to high production costs and long lead times.
Value Statement
· Improve cost performance by synchronizing production with customer demand.
Key Requirements
· No New Hires· No Overtime
Measurements
· Total Flow Time· Inventory Cost and
Quantity
Ideal State
· On-Demand· Defect Free· 1-By-1· Lowest Cost
LeanView™ The Next Generation of Lean Copyright 2012 bluespring | SOFTWARE Page 6 www.bluespringsoftware.com
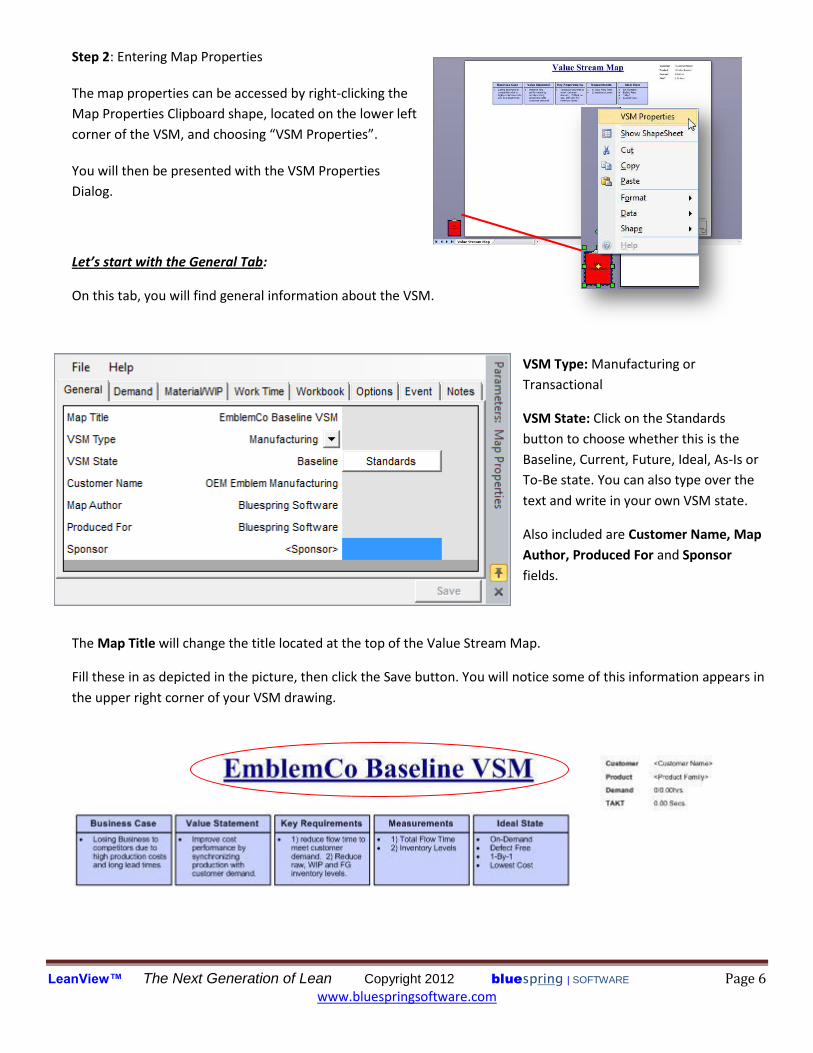
Step 2: Entering Map Properties
The map properties can be accessed by right-clicking the
Map Properties Clipboard shape, located on the lower left
corner of the VSM, and choosing “VSM Properties”.
You will then be presented with the VSM Properties
Dialog.
Let’s start with the General Tab:
On this tab, you will find general information about the VSM.
VSM Type: Manufacturing or
Transactional
VSM State: Click on the Standards
button to choose whether this is the
Baseline, Current, Future, Ideal, As-Is or
To-Be state. You can also type over the
text and write in your own VSM state.
Also included are Customer Name, Map
Author, Produced For and Sponsor
fields.
The Map Title will change the title located at the top of the Value Stream Map.
Fill these in as depicted in the picture, then click the Save button. You will notice some of this information appears in
the upper right corner of your VSM drawing.

LeanView™ The Next Generation of Lean Copyright 2012 bluespring | SOFTWARE Page 7 www.bluespringsoftware.com
Step 2: Entering Map Properties Continued
Now Let’s move to the Customer Demand Tab:
At EmblemCo, we manufacture 3
different types of Emblems in our
O.E.M. Emblems Product Family.
On the Customer Demand tab, you will
define the Product Family and
Customer Demand Period.
In the table, you will list each product,
the quantity (needed during the
defined customer demand period),
and the price per unit size.
You may define unit size as anything
you want (each, case, batch etc…).
Once you’ve entered the data as it appears, a TAKT time of 54.6 seconds is computed by LeanView.
The total dollar value of product that will be produced (Quantity x Price) is computed automatically in the far right
column.
Click the save button on this dialog to make sure you’ve saved your changes to the LeanView diagram.

LeanView™ The Next Generation of Lean Copyright 2012 bluespring | SOFTWARE Page 8 www.bluespringsoftware.com
Step 2: Entering Map Properties Continued
Now let’s move to the Work Time tab:
The Work Time tab allows you to define average work hours per day, work days per week and work days per year
during which your plant operates.
You should not include days or hours that your plant is closed, or time you shut the operation down for breaks,
lunches etc…
For this example, let’s use 24 hrs per
day, 7 days per week and 255 days
per year.
When you are finished adjusting
these numbers, then click “Save”.
Note: After saving these changes, you will notice that your takt time on the Customer Demand tab has now changed to 2.73 minutes.
LeanView™ The Next Generation of Lean Copyright 2012 bluespring | SOFTWARE Page 9 www.bluespringsoftware.com
Step 2: Entering Map Properties Continued
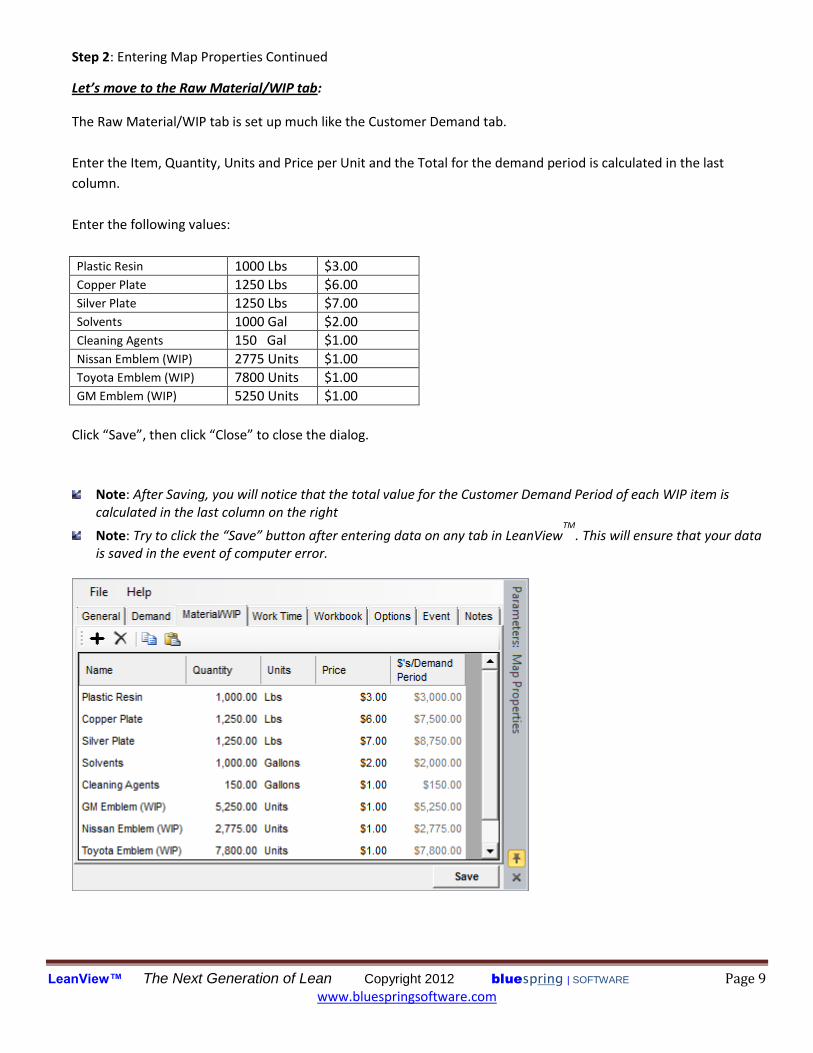
Let’s move to the Raw Material/WIP tab:
The Raw Material/WIP tab is set up much like the Customer Demand tab.
Enter the Item, Quantity, Units and Price per Unit and the Total for the demand period is calculated in the last
column.
Enter the following values:
Plastic Resin 1000 Lbs $3.00 Copper Plate 1250 Lbs $6.00 Silver Plate 1250 Lbs $7.00 Solvents 1000 Gal $2.00
Cleaning Agents 150 Gal $1.00 Nissan Emblem (WIP) 2775 Units $1.00 Toyota Emblem (WIP) 7800 Units $1.00 GM Emblem (WIP) 5250 Units $1.00
Click “Save”, then click “Close” to close the dialog.
Note: After Saving, you will notice that the total value for the Customer Demand Period of each WIP item is calculated in the last column on the right
Note: Try to click the “Save” button after entering data on any tab in LeanViewTM
. This will ensure that your data is saved in the event of computer error.
LeanView™ The Next Generation of Lean Copyright 2012 bluespring | SOFTWARE Page 10 www.bluespringsoftware.com
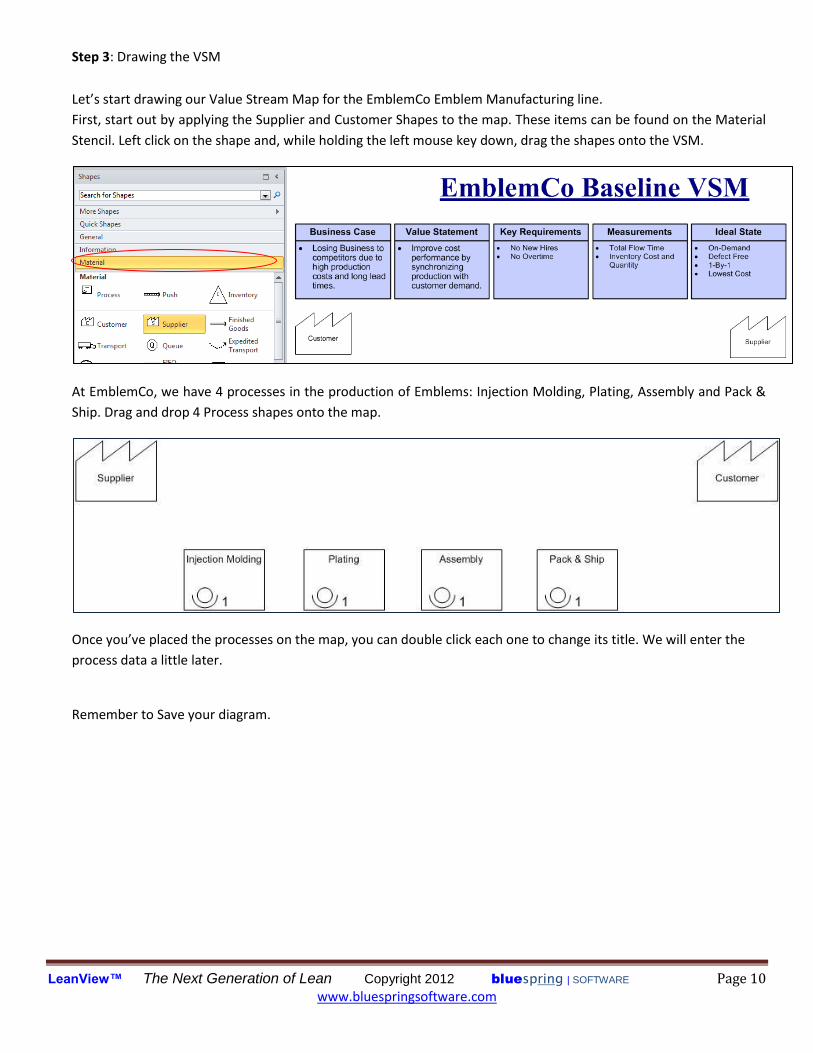
Step 3: Drawing the VSM
Let’s start drawing our Value Stream Map for the EmblemCo Emblem Manufacturing line.
First, start out by applying the Supplier and Customer Shapes to the map. These items can be found on the Material
Stencil. Left click on the shape and, while holding the left mouse key down, drag the shapes onto the VSM.
At EmblemCo, we have 4 processes in the production of Emblems: Injection Molding, Plating, Assembly and Pack &
Ship. Drag and drop 4 Process shapes onto the map.
Once you’ve placed the processes on the map, you can double click each one to change its title. We will enter the
process data a little later.
Remember to Save your diagram.

LeanView™ The Next Generation of Lean Copyright 2012 bluespring | SOFTWARE Page 11 www.bluespringsoftware.com
Step 3: Drawing the VSM Continued
We’ll use finished goods arrows from the supplier and to the customer; then, we’ll use push arrows to connect all
other Processes within the value stream.
Add Inventory shapes before Injection Molding, between each Process and after Pack & Ship.
Your diagram should now look like the one below:
To define the information flow, let’s add in a production planning model with communications between customer,
plant and supplier.
On the Information Stencil, we can drag an information shape onto the map and name it “Production Planning”.
Then add Electronic information arrows from Production Planning to Supplier (named “30/60/90 Day Forecast”) and
from Customer to Production Planning (named “850/862 EDI Orders”).
Next add Manual Information arrows from Production Planning to each of the Processes. From left to right, name
them “Molding Schedule”, “Plating Schedule”, “Assembly Schedule”, and “Packing & Shipping Schedule”
After completion, your VSM should look like this:
Note: You will need to right click on the information arrows and select “Show Title” to get the title to appear.
Alternatively, you can use the Ctrl key to select multiple information arrows, then go to the LeanView menu and
select View Shape Title Show.
4
Injection Molding
2
Pack & Ship
2
Plating
3
Assembly
I II I I
SupplierCustomer
4
Injection Molding
2
Pack & Ship
2
Plating
3
Assembly
I II I I
Production Planning
30/60/90 Day Forecast 850/862 EDI OrdersSupplierCustomer
Molding Schedule
Pla
ting S
chedule
Asse
mbly S
chedule
Packing & Shipping Schedule

LeanView™ The Next Generation of Lean Copyright 2012 bluespring | SOFTWARE Page 12 www.bluespringsoftware.com
Step 4: Entering Process Properties
Now that we’ve drawn the VSM, let’s add Properties to
each of the processes. Right-click on the Injection
Molding Process, and choose Process Properties from
the menu.
A dialog like the one below will appear:
You will notice that the process
properties have several available data
fields. For this exercise, we will work
with:
People –Total (FTE)
Flow Time – Input (FT)
Manual Time (MT)
Auto Time (AT)
Normal Process Quantity
% Yield (YLD)
% VA Processing Time
Note: You will notice that People-Total (FTE) has a dropdown list. You can choose to define total People for this
process or the number of people per station. We will use People-Total (FTE) for this exercise. You will also notice
that Flow Time-Input (FT) has a dropdown list. Flow Time-Input (FT) allows you to enter your own value. You can
also choose Flow Time-Calculated (FT) to allow LeanView to compute the total Flow Time for you. We will use
Flow Time-Input (FT) for this exercise.
Add the properties from the tables on the next page to the General tab of each of the processes, clicking Save after
completing each one.

LeanView™ The Next Generation of Lean Copyright 2012 bluespring | SOFTWARE Page 13 www.bluespringsoftware.com
Step 4: Entering Process Properties Continued
Process Properties:
NOTE: NPR = Normal Production Run, NPQ = Normal Process Quantity
Process Injection Molding
Starts With Receipt of Weekly Production Orders
Ends With Production of Orders
People Flow Time MT AT C/O Time NPR NPQ % Yield
4 15 Mins 3 Mins 11 Mins 0 15,000 15,000 86%
%VA Processing Time 15%
Process Plating
Starts With Receipt of Emblem Totes
Ends With Plated Emblems
People Flow Time MT AT C/O Time NPR NPQ % Yield
2 6 Hrs 1.25 Hrs 3.5 Hrs 0 15,000 15,000 92%
%VA Processing Time 4%
Process Assembly
Starts With Receipt of Plated Emblem Totes
Ends With Assembled Emblems
People Flow Time MT AT C/O Time NPR NPQ % Yield
3 4.1 Hrs 2.25 Hrs 30 Mins 0 Hrs 22,000 22,000 96.5%
%VA Processing Time 7%
Process Pack & Ship
Starts With Receipt of Assembled Emblem Totes
Ends With Emblems Packed by Ship-to Customer
People Flow Time MT AT C/O Time NPR NPQ % Yield
2 2.5 Hrs 1.5 Hrs 0 Hrs 0 25,000 25,000 98.5%
%VA Processing Time 3%
Upon completion, your VSM should look
like this (Note that you must right click
on the process and choose “Show Stats”
to see the statistics below each process):
Note: To show statistics on a shape,
right click and choose “Show Statistics”.
Alternatively, custom displays can be
created using the Microsoft Visio Data
Graphics (available in Visio 2007
Professional and Visio 2010 Professional
and Premium).
LeanView™ The Next Generation of Lean Copyright 2012 bluespring | SOFTWARE Page 14 www.bluespringsoftware.com
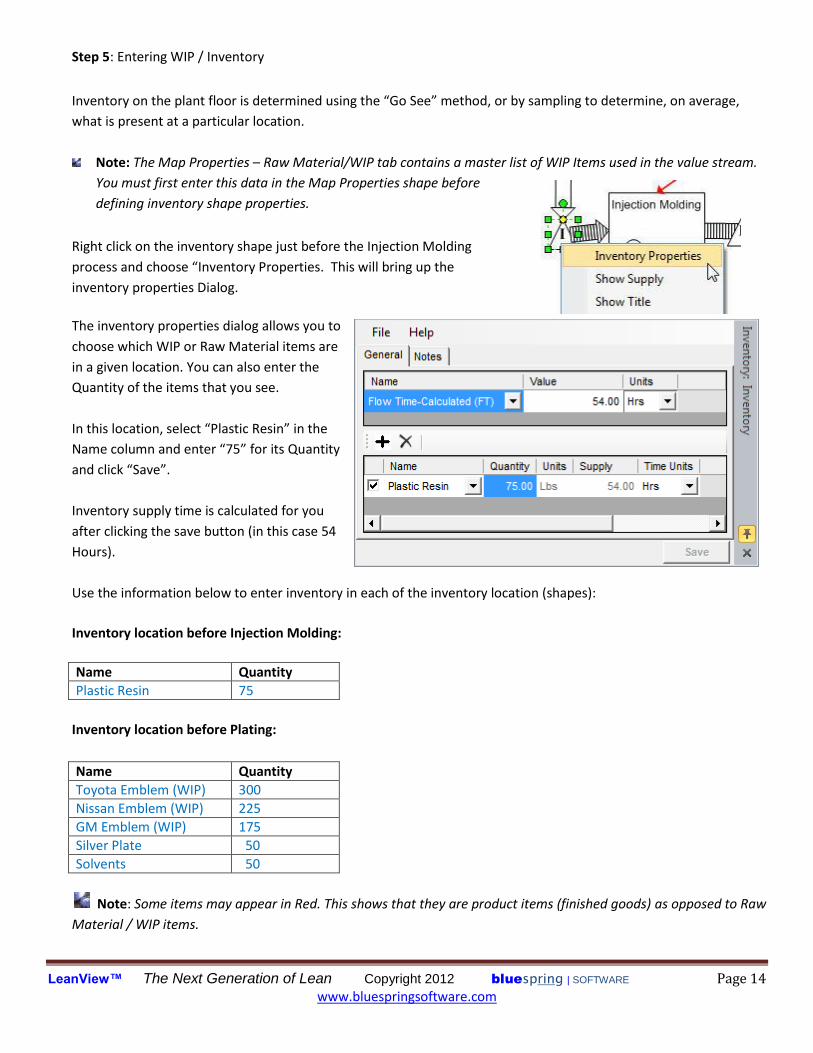
Step 5: Entering WIP / Inventory
Inventory on the plant floor is determined using the “Go See” method, or by sampling to determine, on average,
what is present at a particular location.
Note: The Map Properties – Raw Material/WIP tab contains a master list of WIP Items used in the value stream.
You must first enter this data in the Map Properties shape before
defining inventory shape properties.
Right click on the inventory shape just before the Injection Molding
process and choose “Inventory Properties. This will bring up the
inventory properties Dialog.
The inventory properties dialog allows you to
choose which WIP or Raw Material items are
in a given location. You can also enter the
Quantity of the items that you see.
In this location, select “Plastic Resin” in the
Name column and enter “75” for its Quantity
and click “Save”.
Inventory supply time is calculated for you
after clicking the save button (in this case 54
Hours).
Use the information below to enter inventory in each of the inventory location (shapes):
Inventory location before Injection Molding:
Name Quantity
Plastic Resin 75
Inventory location before Plating:
Name Quantity
Toyota Emblem (WIP) 300
Nissan Emblem (WIP) 225
GM Emblem (WIP) 175
Silver Plate 50
Solvents 50
Note: Some items may appear in Red. This shows that they are product items (finished goods) as opposed to Raw
Material / WIP items.

LeanView™ The Next Generation of Lean Copyright 2012 bluespring | SOFTWARE Page 15 www.bluespringsoftware.com
Step 5: Entering WIP / Inventory Continued
Inventory location before Assembly:
Name Quantity
GM Emblem WIP 175
Toyota Emblem WIP 250
Nissan Emblem WIP 150
Inventory location before Packing & Shipping:
Name Quantity
GM Emblem WIP 190
Toyota Emblem WIP 225
Nissan Emblem WIP 175
Inventory location after Packing & Shipping:
Name Quantity
GM Emblem 400
Toyota Emblem 600
Nissan Emblem 250
Upon completion, you can right-click on the
inventory shapes and choose “Show Supply” to
display the inventory contents on the drawing
canvas.
4
Injection Molding
I
Plastic Resin 75.00=54.00h
$225.00
I
GM Emblem (WIP) 175.00=24.00h
$175.00
Nissan Emblem (WIP) 225.00=58.38h
$225.00
Toyota Emblem (WIP) 300.00=27.69h
$300.00
Silver Plate 50.00=28.80h
$350.00
Solvents 50.00=36.00h
$100.00
Supplier

LeanView™ The Next Generation of Lean Copyright 2012 bluespring | SOFTWARE Page 16 www.bluespringsoftware.com
Step 6: Recording the Value Stream Path
In the lower right hand corner of the Value Stream Map, you will see a Value Path shape. The
Value Path shape is used to record a value stream in LeanView. You can have as many value
stream paths as you would like by adding additional Value Path shapes from the General stencil.
Let’s rename this value path shape to reflect the Value Stream we want to record. Double click
the Value Path shape and rename it “Emblem Production Value Stream Path”.
To record a Value Stream, we begin by right-clicking on the Value Path
shape and choosing “Define Value Stream Path”.
You will be presented with the Value Path dialog.
Click the red record button on the “Items” tab to
begin recording a Value Stream.
This will allow you to begin selecting the shapes you
want to be included in your value stream.
Now begin with the Supplier shape. Once you click on it, you will notice a numbered oval appear over the shape,
and you will notice the shape will appear in the Value Path dialog.
You can now record the full value stream, in order: Supplier, Inventory, Injection Molding, Inventory, Plating,
Inventory, Assembly, Inventory, Pack & Ship, Inventory, and Customer.
Note: In order to capture a shapes data in your analysis, it must be recorded in the Value Stream Path. If a shape
is not recorded, its data is excluded from the Map Analysis Report (MAR).

LeanView™ The Next Generation of Lean Copyright 2012 bluespring | SOFTWARE Page 17 www.bluespringsoftware.com
Step 6: Recording the Value Stream Path Continued
Your fully recorded value stream should appear as follows:
Step 7: Producing the Map Analysis Report (MAR)
To produce a map analysis report, go to the Analysis section of the LeanView ribbon and click Map Analysis Report.
(If working in versions 4 or 5 of LeanVeiw, go to the LeanView menu, click on Reports Map Analysis Report.)
The ‘Select Value Stream Analysis Path’ dialog is presented so you can identify the value stream path to be analyzed
and the time units to be used to report Flow Time, Manual Time, and other time-based performance metrics.
Choose the “Emblem Production Value Stream Path”. Leave the Report Time Units at the default “Hrs”, and click
“Ok”.
Note: Depending on your system and software, reports may take a few moments to complete.

LeanView™ The Next Generation of Lean Copyright 2012 bluespring | SOFTWARE Page 18 www.bluespringsoftware.com
LeanView will open Microsoft Excel, and output the analytics (Map Analysis Report) from your Value Stream. You
should avoid pressing any keys while the report is running.
Step 7: Producing the Map Analysis Report (MAR) Continued
When LeanView is finished writing value stream performance information to Microsoft Excel, several worksheets
will be available for review.
To obtain a detailed description of the Map Analysis Report and to review information about LeanView’s other
reporting options, explore the User’s Guide. (LeanView Help User’s Guide)
This tutorial should have given you a broad overview of just some of the capabilities of the LeanView value stream
mapping and analysis solution. Now, you should understand how you can utilize the software to very quickly and
accurately capture current manufacturing or transactional operations, analyze critical data, share documents and
perform what-if analysis to explore the impact of change before investing in modifying your process.
This concludes this tutorial, but you may review the User’s Guide for information about additional capabilities, like
building VA/NVA timelines, creating an A3 report, and more.
Please visit us at www.bluespringsoftware.com for more information on Advanced Functionality and Training or call
us directly at 877.794.1764.