lecture 13-14: welfare and social choice charit tingsabadh m.sc. programme in environmental and...
Post on 19-Dec-2015
220 views
TRANSCRIPT

Lecture 13-14: Welfare and Social Choice
Charit TingsabadhM.Sc. Programme in Environmental
and natural resource economicsSemester 1/2006

Outline
• From positive economics to normative economics
• What is being compared
• Measures of welfare
• Examples
• Empirics

Key Concepts
•Consumer surplus: the difference between what consumers are willing to pay and the price they pay for it. Calculated as the area under the demand curve and above the market price up to the quantity consumers buy. •Producer surplus: the difference between the amount for which a good sells and the minimum amount necessary for sellers to be willing to produce the good. •Deadweight loss: a net reduction in welfare from losses of surplus by one group that are not offset by gains to another group. •Subsidy: a payment for the pruchase of a good; the opposite of a tax. •Tariff: a tax levied on imported goods. •Quota: a statutory limit on the amount imported. •Rent seeking: effort and spending done to gain rent or profit from government action.
Chapter 9
Applying the Competitive Model
Perloff, Microeconomics 3rd edition

Figure 9.1 Consumer
Surplus

Figure 9.1a Consumer Surplus

Figure 9.1b Consumer Surplus

Figure 9.2 Fall in Consumer Surplus From Roses as Price
Rises

Table 9.1 Effect of a 10% Increase in Price on Consumer Surplus (Revenue and Consumer Surplus in Billions of
1999 Dollars)
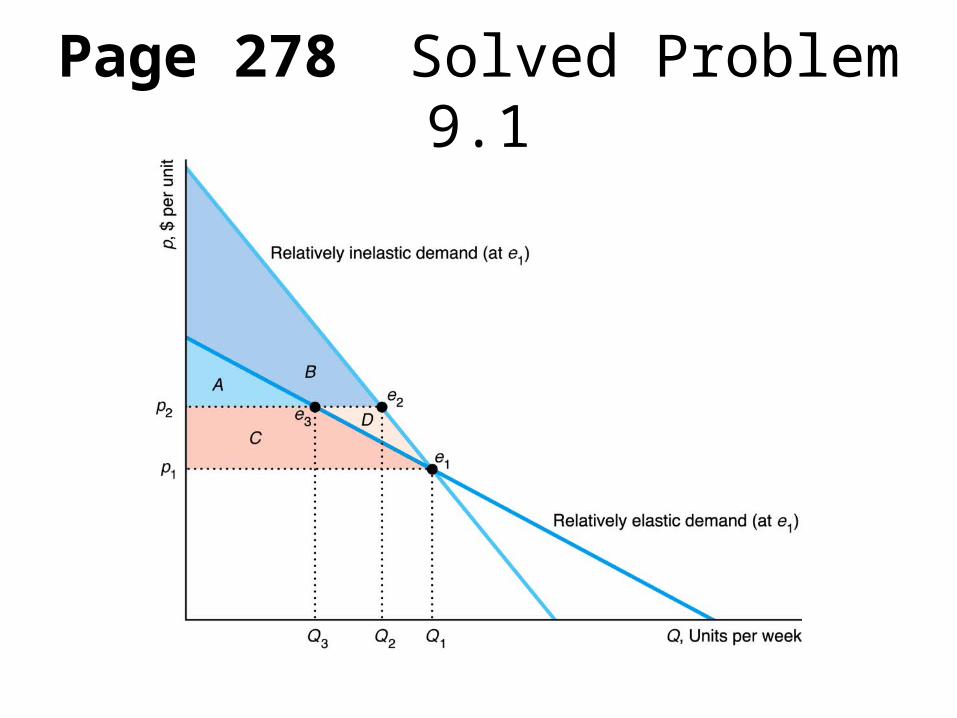
Page 278 Solved Problem 9.1

Figure 9.3 Producer Surplus

Figure 9.3a Producer Surplus

Figure 9.3b Producer Surplus

Page 281 Solved Problem 9.2
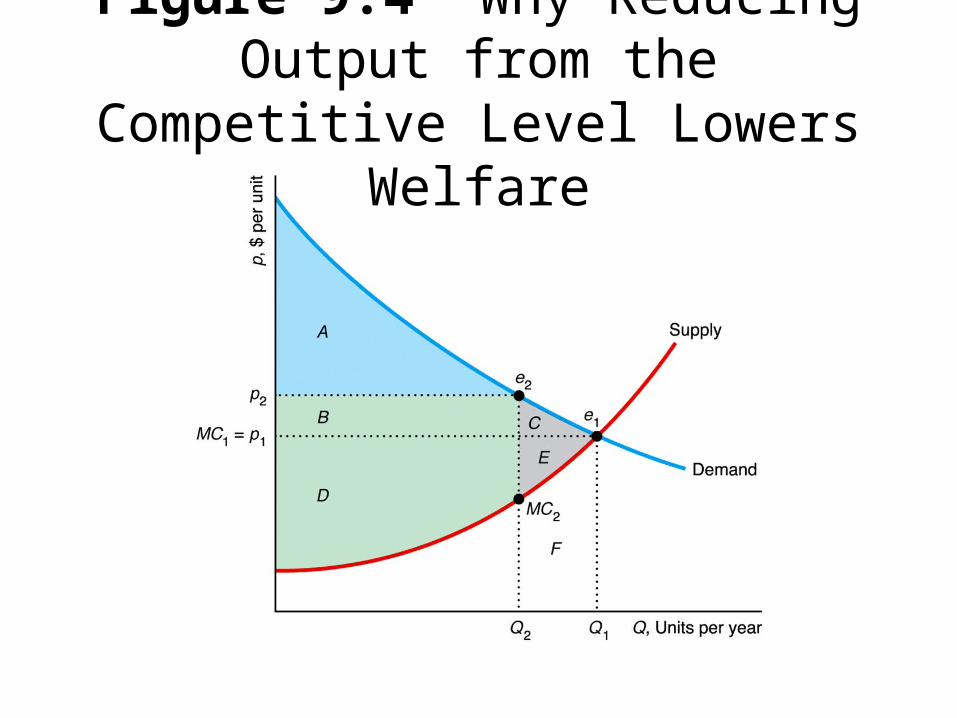
Figure 9.4 Why Reducing Output from the Competitive Level Lowers
Welfare

Figure 9.5 Why Increasing Output from the Competitive Level Lowers
Welfare
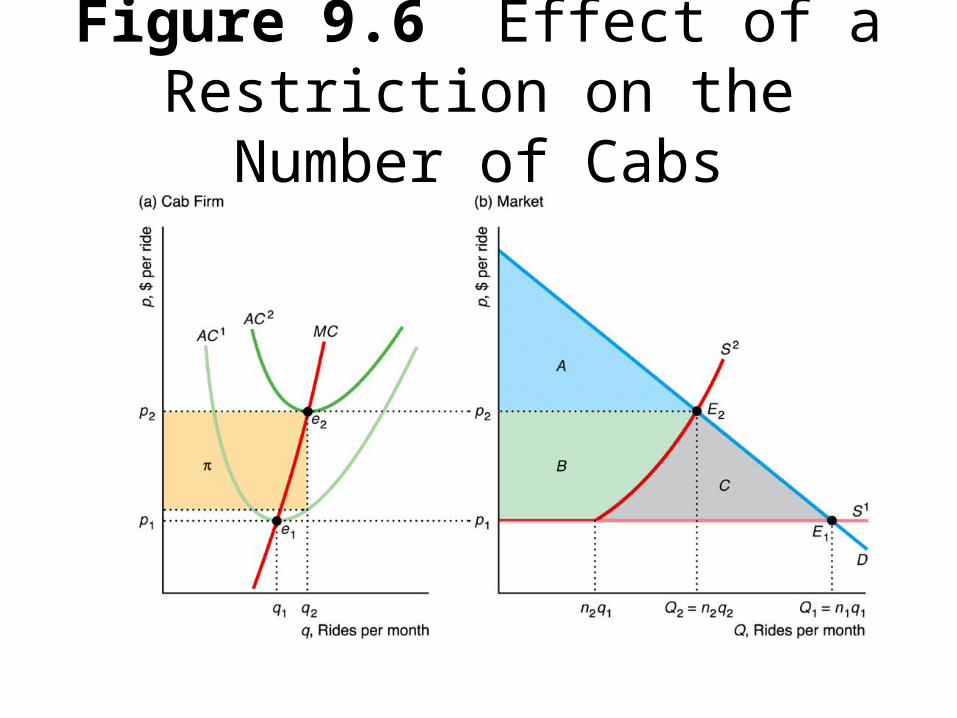
Figure 9.6 Effect of a Restriction on the Number of
Cabs

Figure 9.7 Welfare Effects of a Specific Tax on Roses

Figure 9.8 Welfare Effects of a Per-Unit Subsidy on Roses
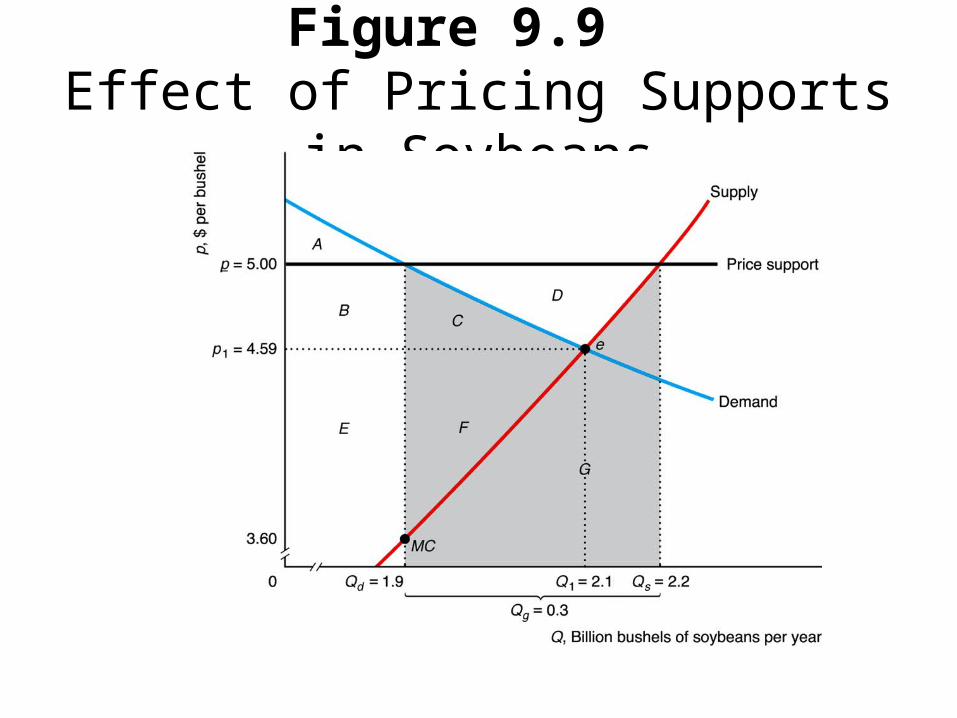
Figure 9.9 Effect of Pricing Supports in
Soybeans
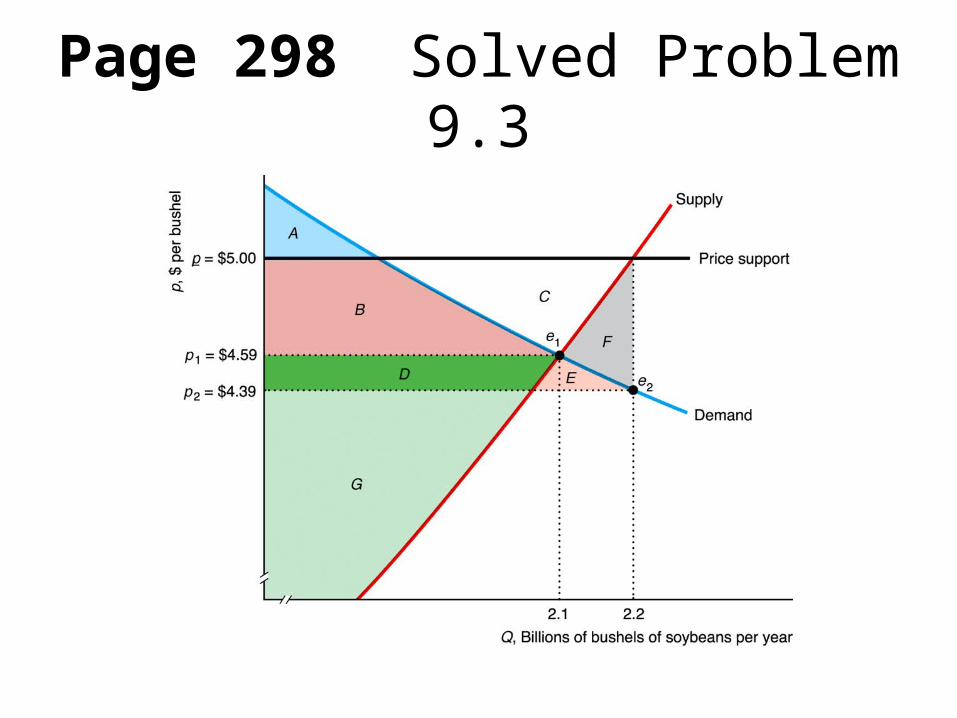
Page 298 Solved Problem 9.3

Page 300 Solved Problem 9.4

Figure 9.10 Loss from Eliminating Free Trade
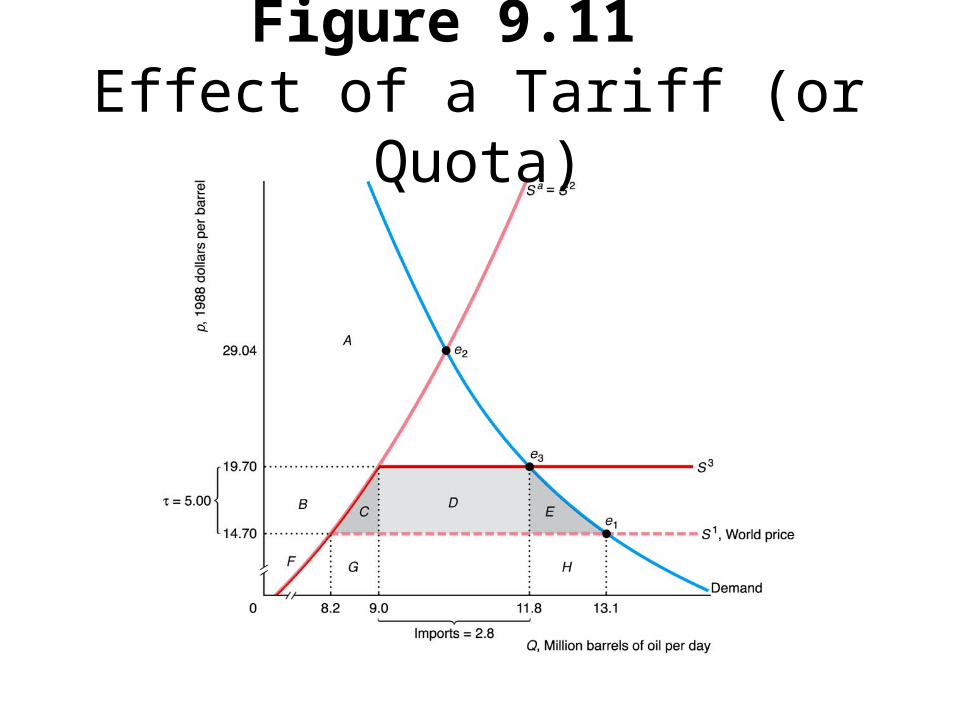
Figure 9.11 Effect of a Tariff (or Quota)
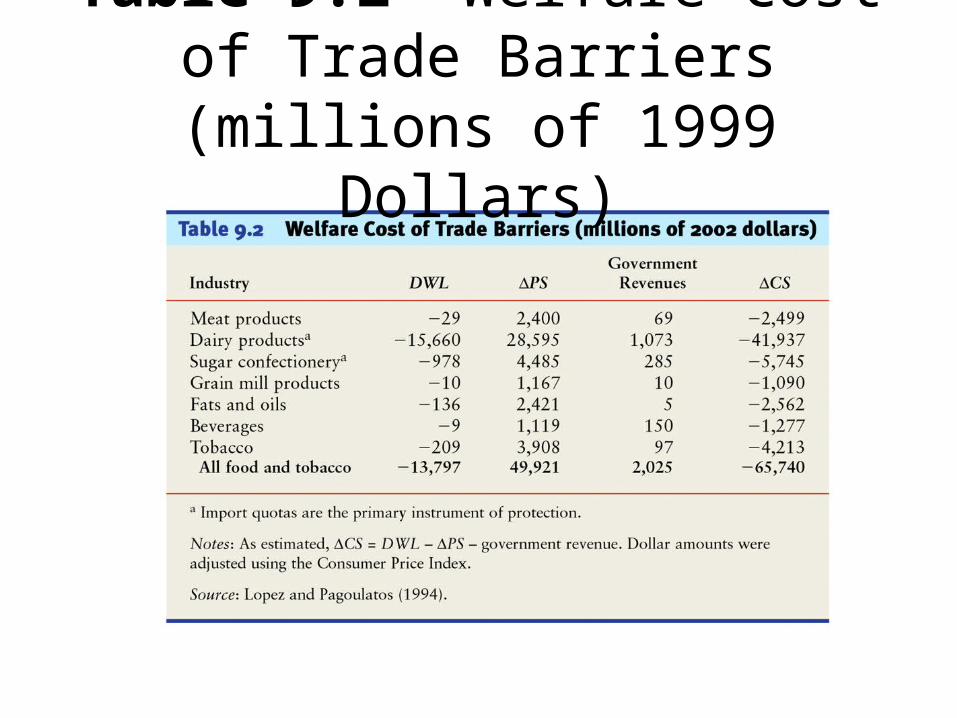
Table 9.2 Welfare Cost of Trade Barriers (millions of 1999
Dollars)

Chapter 18
Externalities, Commons, and Public Goods

Figure 18.1 Welfare Effects of Pollution in a Competitive Market
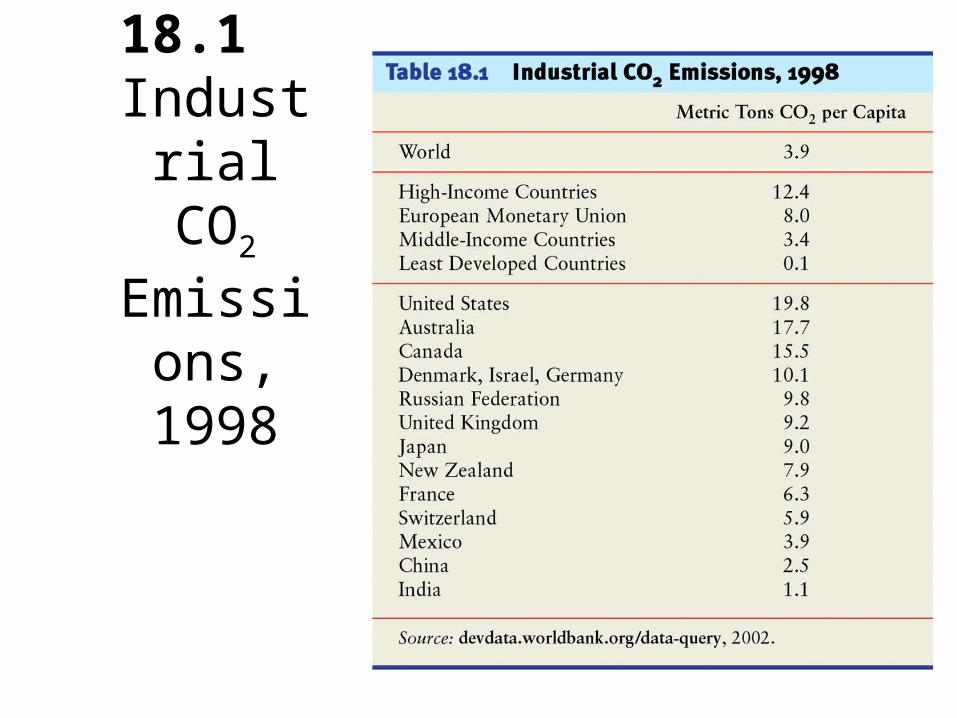
Table 18.1
Industrial CO2
Emissions, 1998

Figure 18.2 Taxes to Control Pollution

Figure 18.3 Cost-
Benefit Analysis
of Pollution
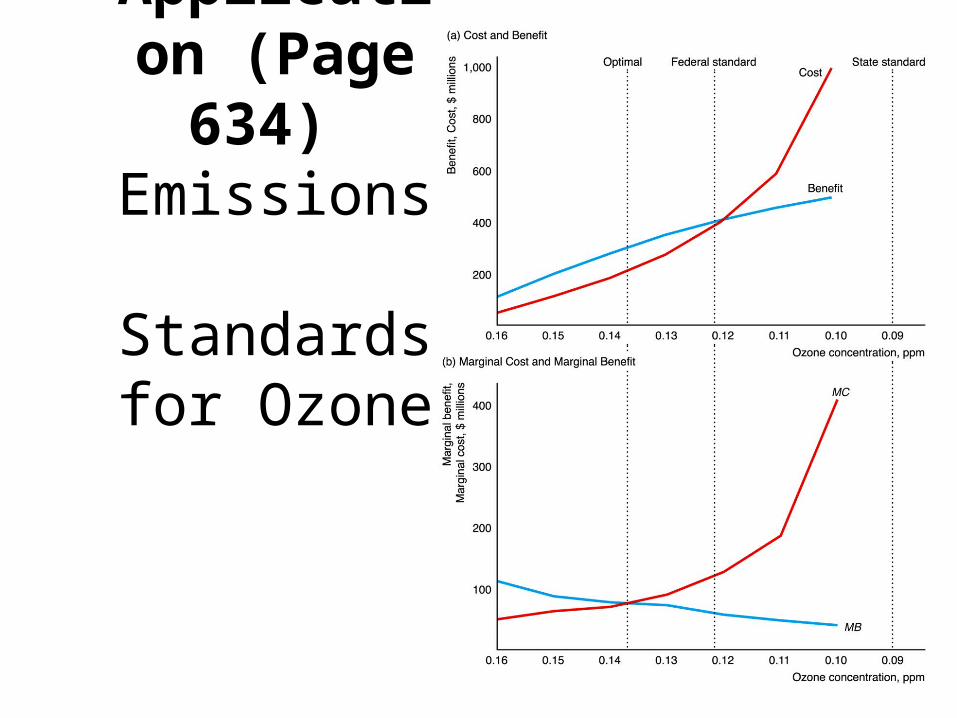
Application (Page 634) Emissions Standards for Ozone
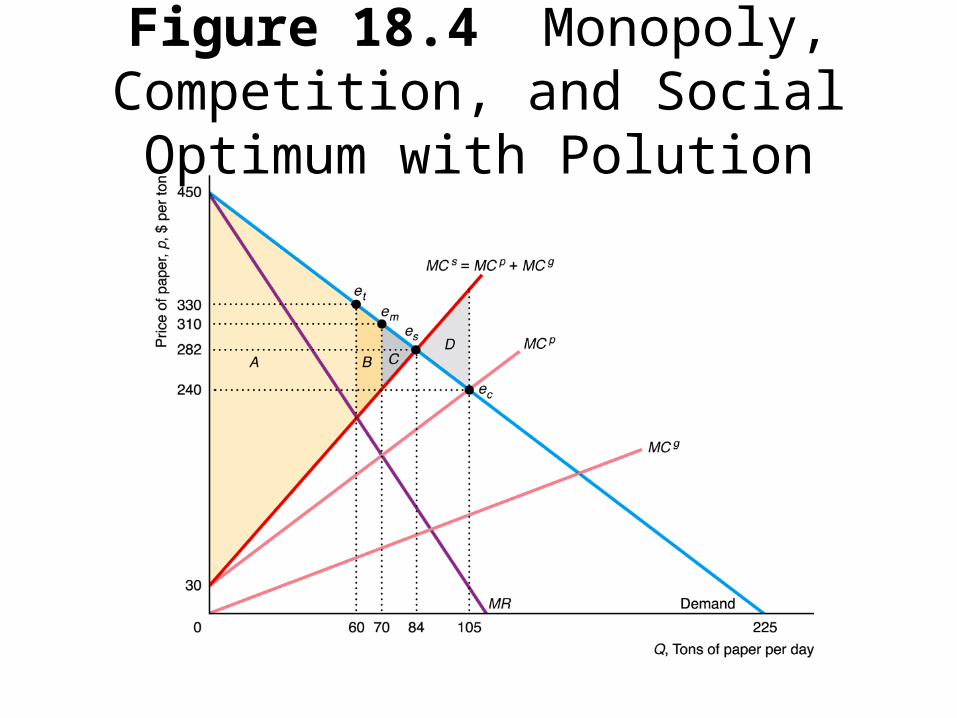
Figure 18.4 Monopoly, Competition, and Social Optimum
with Polution
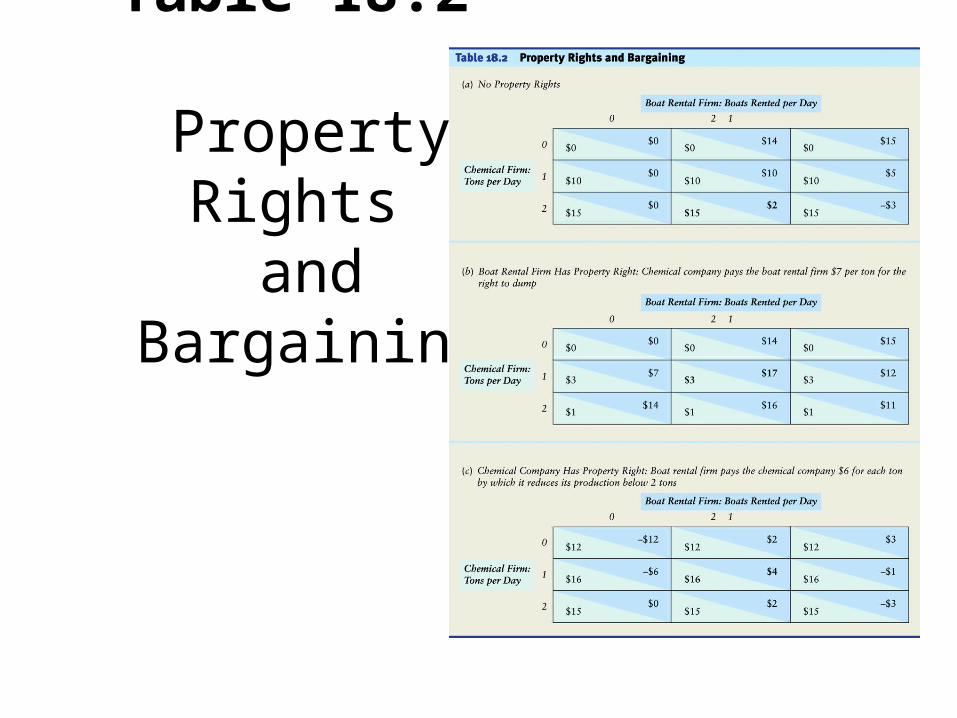
Table 18.2 Property Rights
and Bargaining

Table 18.2a Property Rights and Bargaining

Table 18.2b Property Rights and Bargaining

Table 18.2c Property Rights and Bargaining
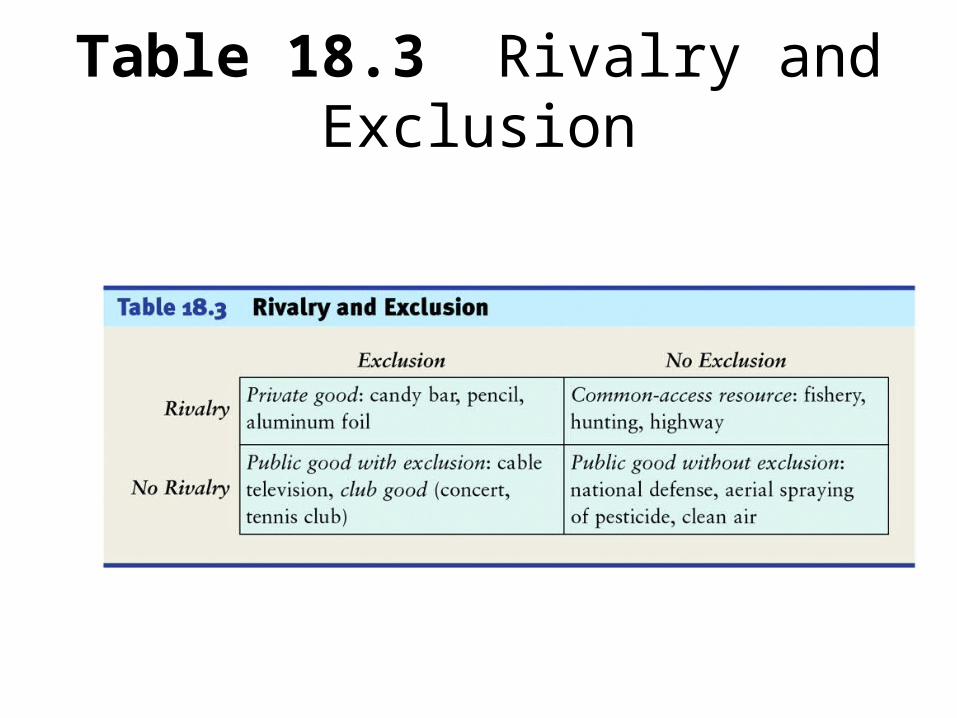
Table 18.3 Rivalry and Exclusion
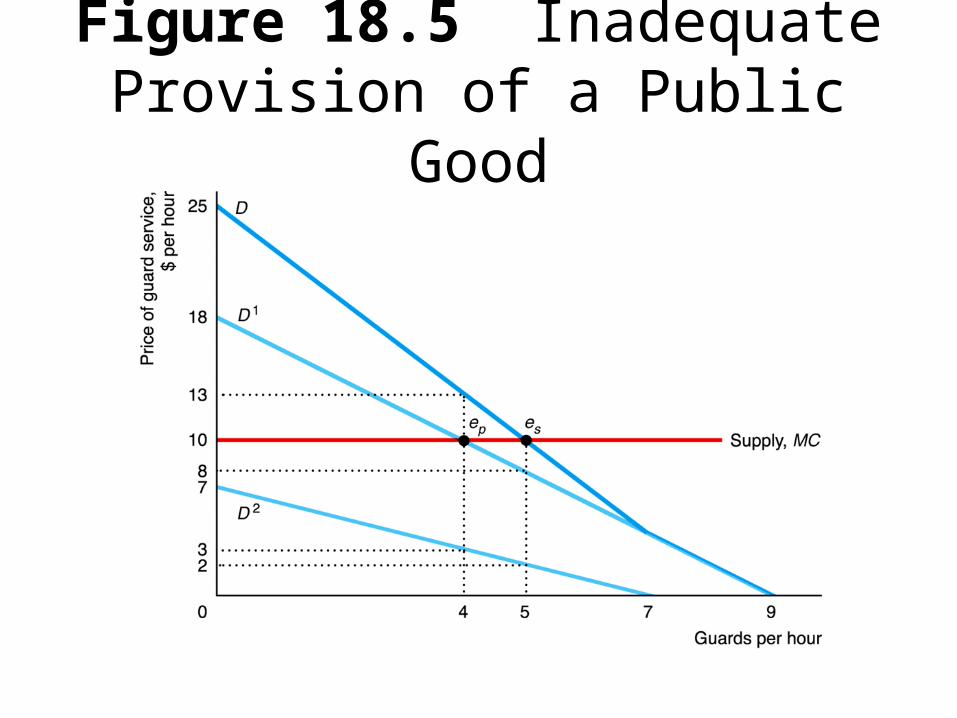
Figure 18.5 Inadequate Provision of a Public Good

Table 18.4 Private Payments for a Public
Good

Table 18.5 Voting on $300 Traffic Signals
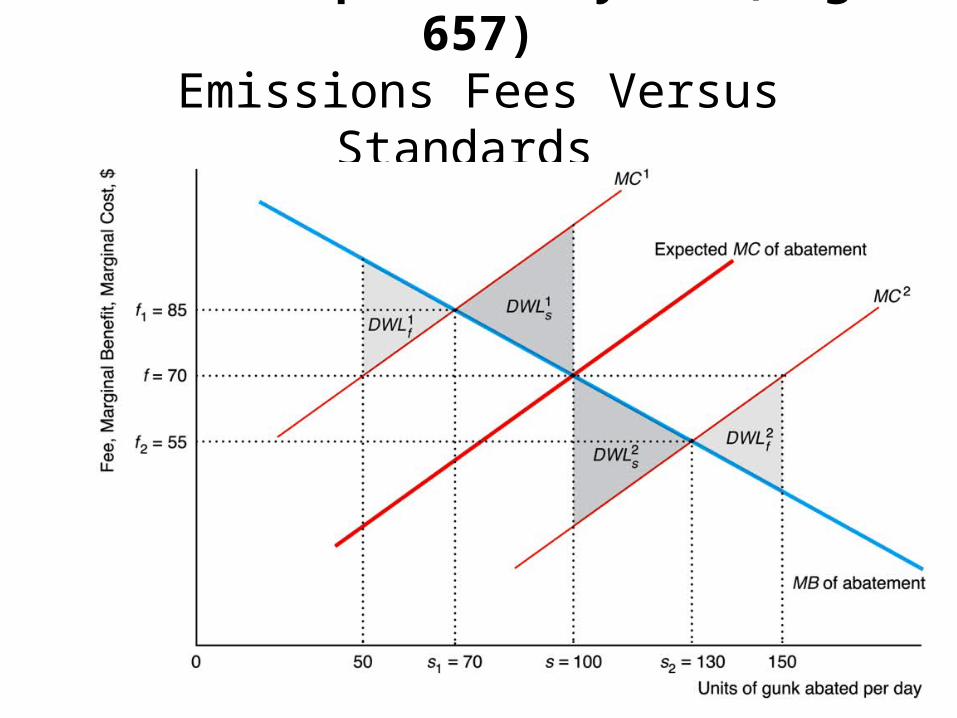
Cross-Chapter Analysis (Page 657)Emissions Fees Versus Standards
Under Uncertainty