lecture 2 econ110 2015 (1)
TRANSCRIPT

Chapter 3 Measuring gross domestic product
Learning objectives
• Interpret circular flow models of a simple economy
• Distinguish between consumption goods and capital goods
• Outline the three different approaches to measuring gross domestic product (GDP)
• Identify the principal components of GDP
• Distinguish between real and nominal GDP
• Appreciate the uses and shortcomings of the GDP measure

The circular flow diagram: a model of the macroeconomy
A circular flow diagram illustrates the flow of funds through the economy
A TWO-SECTOR CIRCULAR FLOW MODEL

The circular flow diagram: a model of the macroeconomy• This two-sector circular model shows how firms and
households interact in markets and how funds flow through the economy
• Owners of factors of production (households) supply and sell inputs to firms and earn income (wage)
• Firms create output and earn income as they sell the outputs in the market
• Households use their earned income to buy outputs in the market
• Income, goods and services and spending are connected

Measuring GDP
Gross Domestic Product (GDP) is the most commonly used measure of total output of goods and services produced in the economy over a period of time.
Formal Definition:GDP = the market value of all final goods and services produced in the domestic economy over a given period of time.
The Australian Bureau of Statistics (ABS) keeps a set of accounts called the National Accounts from which it calculates GDP.

Measuring GDP Q. How do you add different goods together?GDP is a single number, but it measures the production of many different things like cars, insurance and CDs.
A. Use market value because all goods are measured in the same unit ($).
Example:
In the economy of country A, production consists of 10 CDs and 20 bus trips. If each CD has a price of $25 and a bus trip is $10, how much is the GDP of country A?
GDP = (10 × $25) + (20 × $10) = 250 + 200 = $450

• This method adds up the production of each firm or industry in the economy
• In this method we must avoid the double-counting of intermediate goods and only count the value added in production
• Value added is the value of a firm’s production minus the value of intermediate goods
• An intermediate good is a good that undergoes further processing before it is sold
1 The production approach to measuring GDP

Value added in coffee from beans to espresso
Example: Double counting occurs when the valueof growing and picking beans is included once at the coffee growingstage of production and then again at the roasting stage of production.

Total spending is divided into four categories:
• Consumption
• Investment
• Government expenditure
• Net exports (exports minus imports)
2 The spending approach to measuring GDP

Consumption (C):
The first category, consumption (C), includes purchases of final goods and services by individuals or households. In the Australian national accounts, this item is called household expenditure, or private final consumption expenditure.
2 The spending approach to measuring GDP

2 The spending approach to measuring GDP
CONSUMPTION AS A SHARE OF GDP

2 The spending approach to measuring GDP
CONSUMPTION AS A SHARE OF GDP

• Investment (I) consists of purchases of final goods by firms as well as construction (including housing) and inventory investment. Investment takes the form of newly produced capital goods
• Note: spending by governments on capital goods is not included in this grouping; it is included under government spending
2 The spending approach to measuring GDP

• Business fixed investment: investment expenditure by businesses on physical capital, such as factories and equipment
• Inventory investment: a change in the inventory from one date to another.
• Inventory investment is positive when goods produced in the current period are not sold to final users. This causes inventory levels to rise. The National Accounts treats these goods as purchased by firms off themselves in the period in which they are produced.
• Inventory investment is negative when the inventory levels of firms are lower at the end of the current period than they were at the beginning.
• Disinvestment: refers to negative investment
2 The spending approach to measuring GDP

• Residential investment: purchases of new houses and apartments
• Depreciation: the decrease in an asset’s value over time. For physical capital, it is the amount by which physical capital wears out over a period of time
• Net investment: gross investment minus depreciation
• Gross investment: the total amount of investment, including that which goes to replacing worn-out capital
• Be sure to understand what macroeconomists mean by “investment” compared to what “investment” means in everyday use.
2 The spending approach to measuring GDP

2 The spending approach to measuring GDP
INVESTMENT AND CONSUMPTION AS A SHARE OF GDP

• Government expenditure (G): purchases by federal, State/Territory and local governments of new goods and services.
• G includes government consumption spending, government spending on capital goods and changes in the inventories of public authorities.
• Not all items in the government’s budget are counted as part of government expenditure. Welfare and retirement payments made by the government are not counted as part of these purchases
2 The spending approach to measuring GDP

• Government expenditures on capital goods is also called public infrastructure investment and refers to purchases of capital by the government for use as public goods, which add to the productive capacity of the economy. Eg roads, ports, buildings etc.
• Transfer payments: payments that transfer spending power and are not directly associated with the production of current period output. Examples include unemployment benefits, retirement payments and family benefit payments.
• Government expenditure (G) = government outlays − government transfer payments
2 The spending approach to measuring GDP

2 The spending approach to measuring GDP
GOVERNMENT EXPENDITURE, (PRIVATE) INVESTMENT AND (HOUSEHOLD) CONSUMPTION AS A SHARE OF GDP

• Exports: the total value of the goods and services that people in one country sell to people in other countries
• Imports: the total value of the goods and services that people in one country buy from people in other countries
• Net exports (X): the value of exports minus the value of imports
• Trade balance: the value of exports minus the value of imports; another term for net exports
2 The spending approach to measuring GDP

• If net exports are positive, the country has a trade surplus
• If net exports are negative, the country has a trade deficit
• For example in 2010, exports equaled $1838 billion and imports equaled $2354 billion. The Australian trade deficit for 2010 was $516 billion
2 The spending approach to measuring GDP

Algebraic summary:
2 The spending approach to measuring GDP
Y ≡ C + I + G + X

The income approach: the sum of labour income, capital income and indirect taxes less subsidies gives a measure of GDP.
3 The income approach to measuring GDP
AGGREGATE INCOME AND GDP, 2010–2011

Labour income: the sum of wages, salaries and supplements paid to workers. Known in the National Accounts as “compensation of employees”
3 The income approach to measuring GDP
LABOUR’S SHARE OF TOTAL INCOME, 1998–2011

Capital income: the sum of profits, rental payments and interest payments. Known in the National Accounts as “Gross Operating Surplus”
3 The income approach to measuring GDP
THE CAPITAL’S SHARE OF TOTAL INCOME, 1998–2011

• Mixed income refers to income generated from both labour and capital
• In the aggregate income table, the first two items are called factor incomes
• The total of these factor incomes gives GDP at factor cost
• This is not the same as the GDP figure calculated from the expenditure approach, which is based on the market prices of final goods and services
3 The income approach to measuring GDP
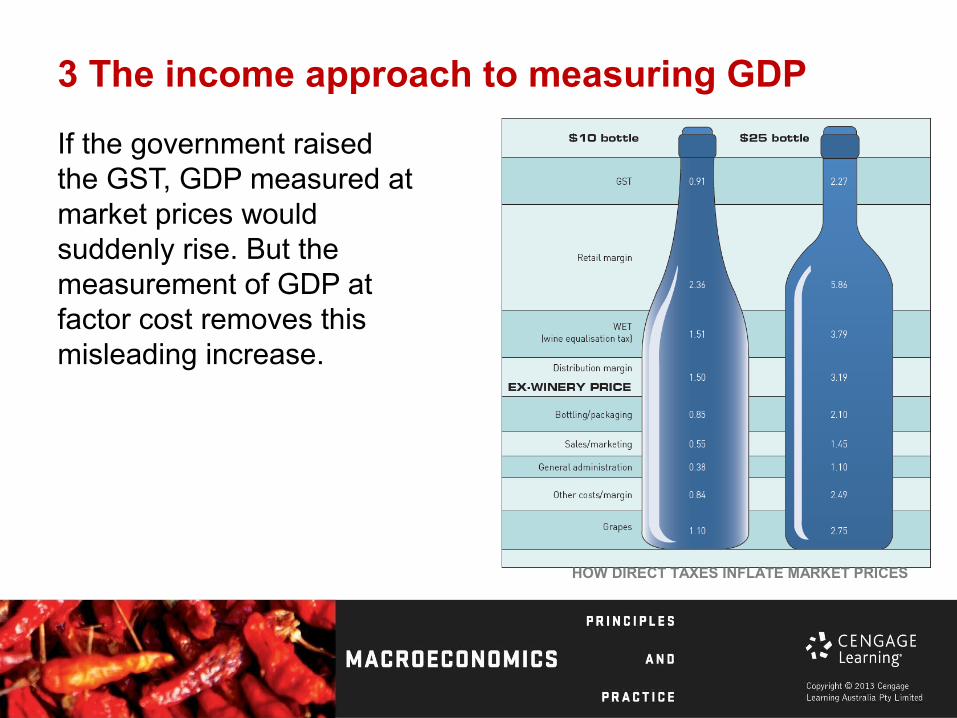
If the government raised the GST, GDP measured at market prices would suddenly rise. But the measurement of GDP at factor cost removes this misleading increase.
3 The income approach to measuring GDP
HOW DIRECT TAXES INFLATE MARKET PRICES

• So GDP calculated by the income approach and the spending approach will be equal, indirect taxes are added and subsidies are subtracted from GDP at factor cost.
• Indirect taxes: taxes, such as the GST, that are levied on products when they are sold
• Net indirect taxes: indirect taxes minus subsidies
3 The income approach to measuring GDP

The circular flow of income and expenditure

The circular flow of income and expenditure revisited
• This figure shows how aggregate expenditure equals aggregate income
• Consumption (C) is joined by government expenditure (G), investment (I) and net exports (X) to sum to aggregate expenditure on the left
• At the top of the figure, this aggregate spending is received by firms that produce the output and then pay out aggregate income (Y) in the form of wages, rents, interest payments and profits
• The government also takes direct taxes from income and makes transfer payments to households
Real GDP and nominal GDP• Nominal GDP is the value of current period production at
current period prices. However, nominal GDP can mislead when comparing GDP over time. Why?
GDP is a measure of aggregate output but when prices rise, ceteris paribus, this increases GDP without an increase in the quantity of goods and services produced.
Economists therefore want a measure of GDP that removes the impact of changing prices.
• Real GDP is a measure of the value of all final goods and services produced in a country during some period of time, adjusted for changing prices. Real GDP changes only when quantities produced change.

• The traditional method for calculating real GDP is called the constant price or base year method. It involves choosing a year, called the “base year”, and uses the prices of goods and services that year to calculate real GDP in each year. In doing so the prices of goods and services are being held constant for each year GDP is calculated. The value of real GDP now changes only when quantities produced change.
• A more contemporary method for calculating real GDP is the “chain weighted” or “chain volume” method – you can read about this on pages: 378-379 of Littleboy et al.
• For this unit we will stick with the base year method.
Converting nominal GDP into real GDP

Converting nominal GDP into real GDP
• Suppose an economy only produces music CDs and bus trips, and we want to compare this total production in two different years: 2013 and 2014
• Nominal GDP in 2013 = ($25 × 1000) + ($10 × 2000) = $45 000
• Nominal GDP in 2014 = ($30 × 1200) + ($15 × 2200) = $69 000

Converting nominal GDP into real GDP• Production (in 2013 prices) in 2013
= ($25 × 1000) + ($10 × 2000) = $45 000
• Production (in 2013 prices) in 2014 = ($25 × 1200) + ($10 × 2200) = $52 000
• Keeping prices constant at 2013 levels, or using 2013 as ‘the base year’, we see that the increase in production is from $45 000 in 2013 to $52 000 in 2014, an increase in real terms of 16 per cent
By contrast the % change in nominal GDP between 2013 and 2014 was 53%
• Economic growth refers to the % change in real GDP over a period of time.

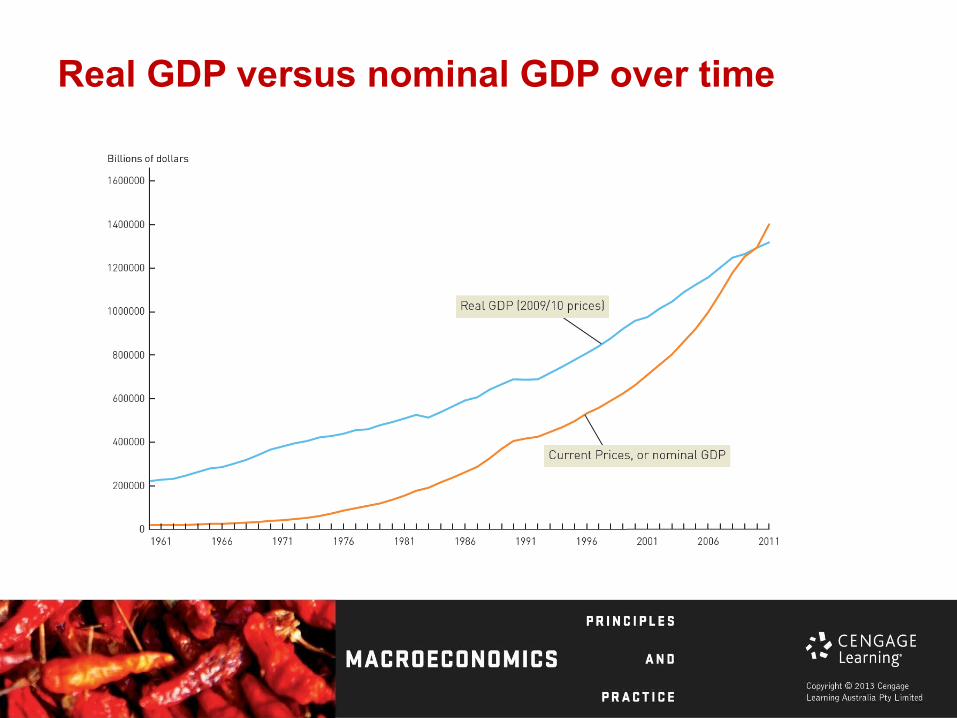
Real GDP versus nominal GDP over time
• Typically, real GDP increases much less than nominal GDP because real GDP is adjusted for rising prices
• Most of the increase in nominal GDP is due to rising prices. The chart shows real GDP in 2009–10 dollars
Real GDP versus nominal GDP over time

Shortcomings of the GDP measureReal GDP per capita has shortcomings as an indicator of wellbeing in a society. Items are omitted, such as:
• Unpaid activity or activity not subject to a legal market process, such as work and production in the home. Some exceptions are made such as farm output consumed on farms and imputed rents of owner-occupied dwellings.
•Leisure activity – going for a walk rather than working will probably cause GDP to fall but your wellbeing to rise. The consumption of leisure is omitted from GDP unless it involves a purchase in the market, such as a cinema ticket etc.
•The underground economy: illegal transactions are not recorded in the National Accounts. In Australia the size of the underground economy is estimated to be 15% of GDP.
•Quality improvements – difficult to adjust for.
Shortcomings of the GDP measure
•Real GDP per capita does not tell us anything about the actual distribution of real GDP among people.
There are other aspects of the wellbeing of individuals that are not counted in GDP like:
•Vital statistics on the quality of life – over time some other indicators of quality of life have improved with increases in real GDP such as average life expectancy, educational attainment, and child mortality. However, other indicators have deteriorated as real GDP has increased like the incidence of diabetes and obesity. chi
•Environmental quality
Inflation:
The increase in the overall price level over time
Inflation rate:
• The annual percentage rate of change in the price level, as measured, for example, by the CPI
• Economists use the consumer price index (CPI) to measure the price level and inflation
• The CPI for any period measures the cost of living during a particular period of time
Inflation

Measures of Inflation – Consumer price index
Consumer price index (CPI): is the cost of purchasing a fixed collection – a “market basket” – of consumer goods and services in a given year divided by the cost of purchasing the same collection in some base year.
How the CPI is constructed:
•Suppose the government of Australia has chosen 2000 as the base year
•Assume a typical Australian family only purchases three items – rents an apartment, fish and chips and a holiday

Measures of Inflation – Consumer price index
Monthly household budget of the typical family in 2000 (base year) Cost (in 2000)
Rent (three-bedroom apartment) $500
Fish and chips (60 at $2 each) $120
Holiday $60
Total expenditure $680
Cost of buying the market basket in 2000, which is the base year.

Suppose that in 2010, the prices of these items have risen. By how much did the family’s cost of living increase between 2000 and 2010?
Measures of Inflation – Consumer price index
Cost of buying (base-year) basket of goods and services in 2010 Cost (in 2010)
Rent (three-bedroom apartment) $630
Fish and chips (60 at $2.50 each) $150
Holiday $70
Total expenditure $850

Measures of Inflation – Consumer price index
• The tables demonstrate that if the typical family wanted to consume the same basket of goods and services in the year 2010 as they did in 2000, they would have to spend $850 per month, or $170 more than their total expenditure in 2000

Measures of Inflation – Consumer price index
• The CPI in any given year is computed using the following formula:
€
CPI = Cost of base-year basket of goods and services in current yearCost of base-year basket of goods and services in base year
€
CPI in year 2010 = $850$680
= 1.25
• The cost of living in the year 2010 is 25 per cent higher than in 2000

Measures of Inflation – GDP deflator
• If nominal GDP grows faster than real GDP this is due to inflation.
• If nominal GDP increases less than real GDP this due to deflation – a situation where the price level is falling over time.
• Its possible to derive a measure of the general price level using nominal and real GDP and from this a measure of inflation:
GDP deflator = nominal GDP/real GDP
The % change in the GDP deflator from year to year is a measure of inflation.
© 2012 Cengage Learning. All Rights Reserved. May not be copied, scanned, or duplicated, in whole or in part, except for use as permitted in a license distributed with a certain product or service or otherwise on a password-protected website for classroom use.