linear versus branching depictions of evolutionary history
TRANSCRIPT

Linear Versus Branching Depictions of EvolutionaryHistory: Implications for Diagram Design
Laura R. Novick,a Courtney K. Shade,a Kefyn M. Catleyb
aDepartment of Psychology and Human Development, Vanderbilt UniversitybDepartment of Biology, Western Carolina University
Received 30 March 2009; received in revised form 11 August 2009; accepted 22 September 2009
Abstract
This article reports the results of an experiment involving 108 college students with varying back-
grounds in biology. Subjects answered questions about the evolutionary history of sets of hominid
and equine taxa. Each set of taxa was presented in one of three diagrammatic formats: a nonclado-
genic diagram found in a contemporary biology textbook or a cladogram in either the ladder or tree
format. As predicted, the textbook diagrams, which contained linear components, were more likely
than the cladogram formats to yield explanations of speciation as an anagenic process, a common
misconception among students. In contrast, the branching cladogram formats yielded more appropri-
ate explanations concerning levels of ancestry than did the textbook diagrams. Although students
with stronger backgrounds in biology did better than those with weaker biology backgrounds, they
generally showed the same effects of diagrammatic format. Implications of these results for evolution
education and for diagram design more generally are discussed.
Keywords: Diagrammatic format; Cladograms; Evolution; Phylogeny; Tree thinking; Biology educa-
tion; Historical representations; Reasoning
1. Introduction
Linguistic symbols convey meaning. Animal keeper, for example, has a different meaning
than elephant. More importantly, how these symbols are arranged also affects meaning. For
example, The animal keeper squirted the elephant with water differs from The elephant
Correspondence should be sent to Laura R. Novick, Department of Psychology and Human Development,
552 GPC, 230 Appleton Place, Vanderbilt University, Nashville, TN 37203-5721. E-mail: laura.novick@
vanderbilt.edu
Correspondence may also be sent to Kefyn M. Catley, Department of Biology, 132 Natural Science Building,
Western Carolina University, Cullowhee, NC 28723. E-mail: [email protected]
Topics in Cognitive Science (2010) 1–24Copyright � 2010 Cognitive Science Society, Inc. All rights reserved.ISSN: 1756-8757 print / 1756-8765 onlineDOI: 10.1111/j.1756-8765.2009.01077.x

squirted the animal keeper with water with respect to the actor, the means of action, and the
recipient of the action. The same holds true for visual elements: Different such symbols
privilege different interpretations. For example, Tversky, Zacks, Lee, and Heiser (2000)
found that circles tend to be used to represent enclosed spaces. Lines, in contrast, tend to be
used to represent physical connections between locations. How these elements are combined
and ⁄ or arranged also is important. For example, Hurley and Novick (in press) found that
two circles connected by a line were more easily interpreted as two objects (e.g., two doc-
tors) that are related in some way (e.g., worked together to learn a new surgical technique)
than were two lines connected by a circle.
The Gestalt perceptual principles, such as grouping and good continuation (e.g., Kellman,
2000), also show how combinations or arrangements of visual elements convey meaning.
For example, although the left and right sides of Fig. 1A show the same six circles, those on
the left are most easily interpreted as two sets of three—perhaps rows of band members
marching toward the bottom of the page—whereas those on the right are most easily inter-
preted as three sets of two—perhaps rows of band members marching to the right. In
Fig. 1B, the line drawing at the top can be decomposed into parts in either of the ways
shown below the drawing, but the decomposition on the left, which preserves good continu-
ation of lines, is seen as more natural (or better) than the one on the right (e.g., van Tuijl,
1980).
Another constraint that viewers bring to the task of interpreting (i.e., extracting meaning
from) arrangements of visual elements is reading order—from left to right and top to bottom
in English and most other modern written languages. When there is a natural starting point
A
B
Fig. 1. The Gestalt principles of grouping and good continuation.
2 L. R. Novick, C. K. Shade, K. M. Catley ⁄ Topics in Cognitive Science (2010)
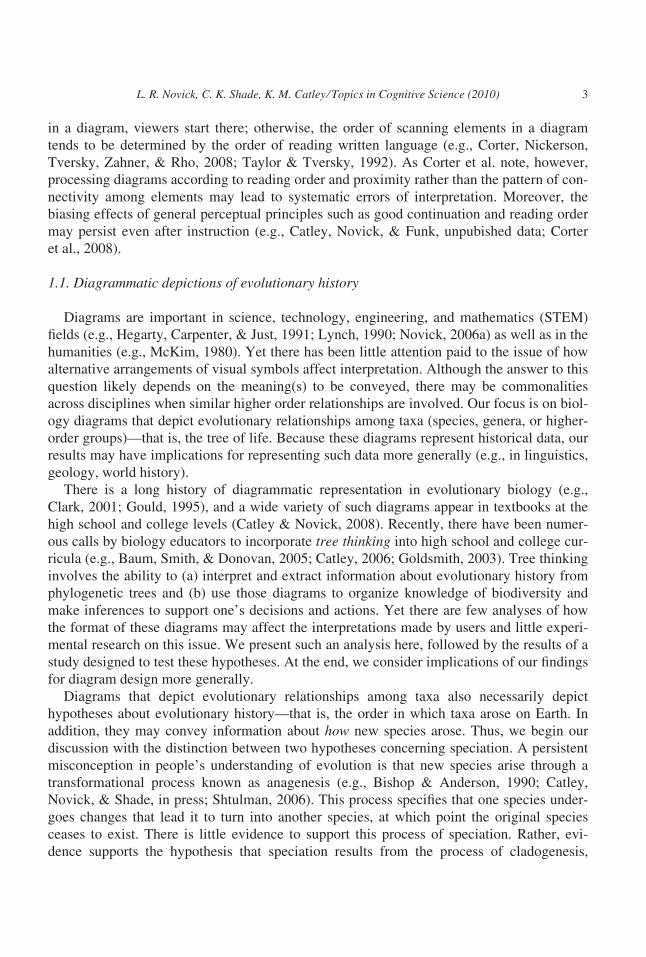
in a diagram, viewers start there; otherwise, the order of scanning elements in a diagram
tends to be determined by the order of reading written language (e.g., Corter, Nickerson,
Tversky, Zahner, & Rho, 2008; Taylor & Tversky, 1992). As Corter et al. note, however,
processing diagrams according to reading order and proximity rather than the pattern of con-
nectivity among elements may lead to systematic errors of interpretation. Moreover, the
biasing effects of general perceptual principles such as good continuation and reading order
may persist even after instruction (e.g., Catley, Novick, & Funk, unpubished data; Corter
et al., 2008).
1.1. Diagrammatic depictions of evolutionary history
Diagrams are important in science, technology, engineering, and mathematics (STEM)
fields (e.g., Hegarty, Carpenter, & Just, 1991; Lynch, 1990; Novick, 2006a) as well as in the
humanities (e.g., McKim, 1980). Yet there has been little attention paid to the issue of how
alternative arrangements of visual symbols affect interpretation. Although the answer to this
question likely depends on the meaning(s) to be conveyed, there may be commonalities
across disciplines when similar higher order relationships are involved. Our focus is on biol-
ogy diagrams that depict evolutionary relationships among taxa (species, genera, or higher-
order groups)—that is, the tree of life. Because these diagrams represent historical data, our
results may have implications for representing such data more generally (e.g., in linguistics,
geology, world history).
There is a long history of diagrammatic representation in evolutionary biology (e.g.,
Clark, 2001; Gould, 1995), and a wide variety of such diagrams appear in textbooks at the
high school and college levels (Catley & Novick, 2008). Recently, there have been numer-
ous calls by biology educators to incorporate tree thinking into high school and college cur-
ricula (e.g., Baum, Smith, & Donovan, 2005; Catley, 2006; Goldsmith, 2003). Tree thinking
involves the ability to (a) interpret and extract information about evolutionary history from
phylogenetic trees and (b) use those diagrams to organize knowledge of biodiversity and
make inferences to support one’s decisions and actions. Yet there are few analyses of how
the format of these diagrams may affect the interpretations made by users and little experi-
mental research on this issue. We present such an analysis here, followed by the results of a
study designed to test these hypotheses. At the end, we consider implications of our findings
for diagram design more generally.
Diagrams that depict evolutionary relationships among taxa also necessarily depict
hypotheses about evolutionary history—that is, the order in which taxa arose on Earth. In
addition, they may convey information about how new species arose. Thus, we begin our
discussion with the distinction between two hypotheses concerning speciation. A persistent
misconception in people’s understanding of evolution is that new species arise through a
transformational process known as anagenesis (e.g., Bishop & Anderson, 1990; Catley,
Novick, & Shade, in press; Shtulman, 2006). This process specifies that one species under-
goes changes that lead it to turn into another species, at which point the original species
ceases to exist. There is little evidence to support this process of speciation. Rather, evi-
dence supports the hypothesis that speciation results from the process of cladogenesis,
L. R. Novick, C. K. Shade, K. M. Catley ⁄ Topics in Cognitive Science (2010) 3
whereby new species are formed when a parent species is split into two populations. If these
populations remain isolated from each other over a long period of time, selection among
individuals will continue separately in each group, driven by differential pressures of the
two local environments. Sometimes two new species result; other times the parental species
may remain intact. Only cladogenesis can explain the increase in the number of species over
time. Put succinctly, anagenesis is a linear process of succession, whereas cladogenesis
involves branching or splitting.
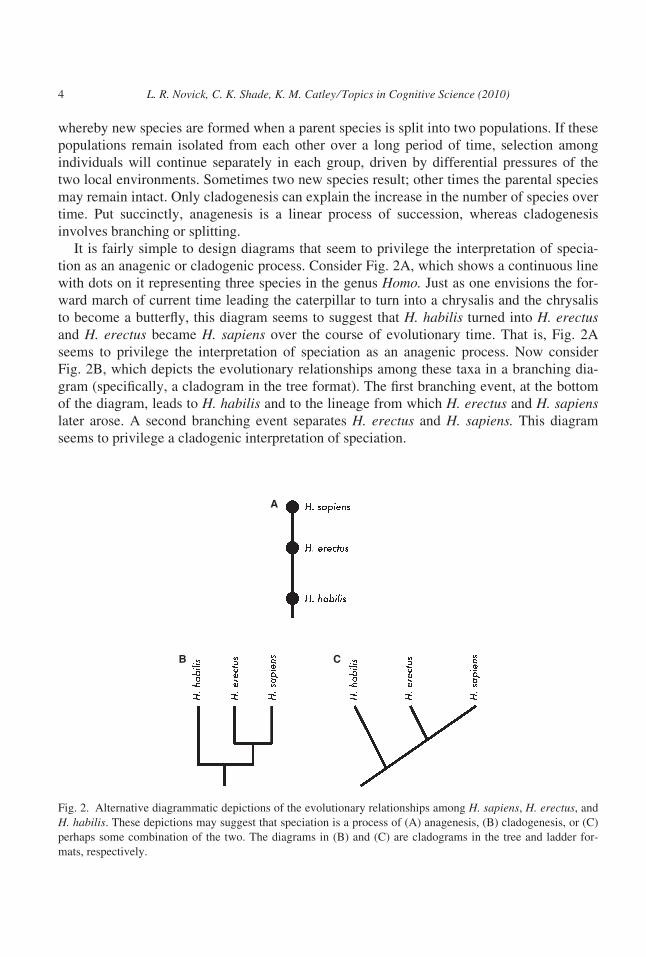
It is fairly simple to design diagrams that seem to privilege the interpretation of specia-
tion as an anagenic or cladogenic process. Consider Fig. 2A, which shows a continuous line
with dots on it representing three species in the genus Homo. Just as one envisions the for-
ward march of current time leading the caterpillar to turn into a chrysalis and the chrysalis
to become a butterfly, this diagram seems to suggest that H. habilis turned into H. erectusand H. erectus became H. sapiens over the course of evolutionary time. That is, Fig. 2A
seems to privilege the interpretation of speciation as an anagenic process. Now consider
Fig. 2B, which depicts the evolutionary relationships among these taxa in a branching dia-
gram (specifically, a cladogram in the tree format). The first branching event, at the bottom
of the diagram, leads to H. habilis and to the lineage from which H. erectus and H. sapienslater arose. A second branching event separates H. erectus and H. sapiens. This diagram
seems to privilege a cladogenic interpretation of speciation.
A
B C
Fig. 2. Alternative diagrammatic depictions of the evolutionary relationships among H. sapiens, H. erectus, and
H. habilis. These depictions may suggest that speciation is a process of (A) anagenesis, (B) cladogenesis, or (C)
perhaps some combination of the two. The diagrams in (B) and (C) are cladograms in the tree and ladder for-
mats, respectively.
4 L. R. Novick, C. K. Shade, K. M. Catley ⁄ Topics in Cognitive Science (2010)

It is important to note that these diagrams privilege (we hypothesize) rather than compel
these alternative interpretations. Indeed, one can interpret each diagram in other ways. For
example, the diagram in Fig. 2A may simply show that H. habilis predates H. erectus, which
predates H. sapiens, in the same way that a historical timeline shows Barack Obama to be
the current president of the United States, George W. Bush to be the immediately preceding
president, and Bill Clinton to be the president before Bush. The diagram in Fig. 2B, on the
other hand, may be interpreted to show that H. habilis on the left evolved into H. erectusand H. sapiens on the right, to which it is directly connected.
Fig. 2C represents a potentially intermediate case. This (ladder format) cladogram is iso-
morphic to the cladogram in Fig. 2B, but because of the Gestalt principle of good continua-
tion (see Novick & Catley, 2007), the continuous diagonal line at the bottom of the figure
and the progression of ‘‘rungs’’ leading to the top of the diagonal could sway viewers to
interpret the relationships as involving anagenesis rather than cladogenesis.
Catley and Novick’s (2008) survey of 21 contemporary high school and college introduc-
tory biology textbooks found both types of cladograms as well as noncladogenic representa-
tions of evolutionary relationships. In the high school textbooks, 53% of the evolutionary
diagrams were cladograms and 47% were noncladogenic representations. In the college-
level texts geared for nonbiology versus biology majors, the percentage of cladograms
increased to 65% and 83%, respectively.
Because the noncladogenic depictions in textbooks are a heterogeneous group, it is most
relevant here to consider the prevalence of linear depictions that may suggest anagenesis
(i.e., those like Fig. 2A). In particular, it is important to know whether such depictions are
isolated in a few textbooks or are found more broadly. Catley and Novick (2008) reported
that such diagrams were found in 67% of the high school biology textbooks they surveyed,
50% of the college introductory texts for nonbiology majors, and 83% of the college intro-
ductory texts for biology majors. Most of these diagrams depicted either H. sapiens in the
context of other hominid species (Homo and ⁄ or Australopithecus) and possibly also other
primates or relationships among extinct and extant horse taxa.
Catley (in press) investigated college students’ interpretations of evolutionary history rep-
resented in two diagrams containing linear components suggestive of anagenesis: one
involving hominid taxa and the other equine taxa. For each diagram, subjects were asked to
describe the evolutionary relationships among three taxa that were arranged in a line. For
example, the hominid diagram contained the component shown in Fig. 2A, and subjects
were asked what the single branch connecting H. habilis, H. erectus, and H. sapiens conveys
about the evolutionary relationship between H. habilis and H. sapiens. Subjects’ answers to
the open-ended question for each diagram were content coded. Of particular interest here
is the relative frequency of the categories reflecting anagenic thinking (e.g., responses
indicating that Eohippus changed over time to become Equus or that H. habilis evolved into
H. erectus, which evolved into H. sapiens) versus ancestry relationships (e.g., stating that
Equus descended from Eohippus or that H. habilis is an ancestor of H. sapiens). Catley
et al.’s analysis revealed that 54% of subjects gave responses that used anagenic language,
whereas only 25% gave responses that talked about the relationships using the neutral
language of ancestors and descendants.
L. R. Novick, C. K. Shade, K. M. Catley ⁄ Topics in Cognitive Science (2010) 5
1.2. Overview of the present study
Catley’s (in press) results are consistent with our hypothesis that linear components like
that shown in Fig. 2A privilege interpretation of speciation as an anagenic process. The
results are not conclusive, however, because there was no comparison to students’ descrip-
tions of relationships on branching diagrams. It may be that college students use anagenic
language to describe evolution regardless of the type of diagram. Novick and Catley (unpub-
lished data) compared college students’ performance on a variety of tree-thinking questions
when the evolutionary relationships were depicted in tree- and ladder-formatted cladograms.
They found that subjects were more accurate and gave higher quality justifications focusing
on levels of ancestry with the tree format, but they did not code anagenic responses.
In the present study, we compared students’ interpretations of the two textbook diagrams
used by Catley (in press) to their interpretations of cladogenic depictions of the relationships
among the same taxa. For each set of taxa, we constructed cladograms in both the tree
(Fig. 2B) and ladder (Fig. 2C) formats based on current scientific evidence concerning the
evolutionary history of those taxa. We asked several questions about each set of diagrams
that we expected might reveal different interpretations (e.g., anagenic vs. ancestral) of the
alternative depictions of evolutionary history.
Our primary hypothesis is that for each set of taxa, the textbook diagram, with its linear
components, will yield more anagenic responses than the two cladograms. If there is a dif-
ference in anagenic responding between the two cladograms, it will be in the direction of
more anagenic responses for the ladder format than the tree format. We correspondingly
predict that responses indicating an appropriate interpretation of evolutionary history in
terms of levels of ancestry will be more prevalent with the cladogram formats than the
textbook diagrams. The feature of levels is a core characteristic of hierarchical diagrams
(Novick & Hurley, 2001) and one with which college students are well acquainted (Novick,
2001, 2006b). The tree format may yield more such responses than the ladder format.
A third hypothesis is that subjects’ misinterpretation of the hierarchical structure of
cladograms in the ladder format (Novick & Catley, 2007) will lead them to miscount in a
specific way the number of branches leading from a particular point on a ladder (described
later). In contrast, there is no reason for subjects to encounter difficulty counting branches in
either a tree format cladogram or the textbook diagrams.
We divided our subjects into two groups based on their background in biology. Although
Catley (in press) reported their results for students’ interpretations of evolutionary relation-
ships depicted in the two textbook diagrams based on a single heterogeneous sample of
college students, our research on students’ interpretations of cladograms (Novick & Catley,
2007, unpublished data) has found better understanding among those with stronger
backgrounds in biology. Although we expect stronger background students to have higher
accuracy scores on our questions and to provide higher quality justifications focusing on lev-
els of ancestry, we do not expect them to be immune to diagram effects. Just as stronger
background students, like their weaker background peers, have more difficulty extracting
the correct hierarchical structure from ladder than tree cladograms (Novick & Catley, 2007,
unpublished data), despite their overall superior performance, we expect them likewise to
6 L. R. Novick, C. K. Shade, K. M. Catley ⁄ Topics in Cognitive Science (2010)
be led down the garden path to anagenic interpretations of evolutionary history by the linear
depictions in the textbook diagrams. Similarly, we predict that both groups will miscount
the lines leading from a certain location on the ladder.
2. Method
2.1. Subjects
The subjects were 108 students from Vanderbilt University who were recruited during
two consecutive fall semesters. The students participated in partial fulfillment of course
requirements for introductory psychology (10 females, 5 males) or evolutionary biology (21
females, 30 males), for extra credit in the psychology (21 females, 2 males) or education (15
females, 3 males) class from which they were recruited, or for pay (1 male).
Subjects completed a background information questionnaire on which they were asked if
they had taken any of 12 primarily organismal biology and three relevant (historical) geol-
ogy courses. Subjects were assigned to the stronger background group if they had taken at
least the two-semester introductory biology sequence required for biology majors and pre-
med students. On average, the 54 stronger background students (23 females, 31 males) had
taken 3.56 semesters of biology (or relevant geology) classes (of those listed on our ques-
tionnaire). The remaining 54 students (44 females, 10 males), who were assigned to the
weaker background group, typically had little exposure to biology (M = 0.45 semesters).
There is nearly an 8:1 difference in coursework between the two groups.
2.2. Materials
For counterbalancing purposes, we selected three diagrams from contemporary high
school and college biology textbooks—the hominid and horse diagrams previously men-
tioned and a diagram involving primates. The hominid and horse diagrams were chosen
because they include linear depictions of evolutionary history. Catley and Novick (2008)
found that most such depictions in textbooks involve these two sets of taxa. Because the pri-
mate diagram did not contain linear depictions of evolutionary history, we restrict further
discussion to the hominid and horse diagrams; only they are relevant to determining the
effects of linear versus branching depictions of evolutionary history.
The hominid textbook diagram, which we found in two high school biology books (John-
son, 1998; Johnson & Raven, 2001), depicts relationships among H. sapiens (modern
humans), extinct members of the genus Homo, and extinct members of the closely related
genus Australopithecus. Catley (in press) found that this diagram leads some students to an
anagenic interpretation of the evolution of at least some of the taxa. For comparison pur-
poses, we created two new diagrams in which the evolutionary relationships among these
taxa were depicted in a tree cladogram and a ladder cladogram. The cladograms were adapted
from the one provided in Foley (1987). Fig. 3 shows the textbook, ladder, and tree diagrams.
L. R. Novick, C. K. Shade, K. M. Catley ⁄ Topics in Cognitive Science (2010) 7

A
B
C
Fig. 3. (A) Textbook, (B) ladder, and (C) tree diagrams for the hominid taxa. The textbook diagram is from
Johnson and Raven (2001), p. 308, fig. 14-7. Copyright 2001 by Holt, Rinehart, and Winston. Adapted with per-
mission.
8 L. R. Novick, C. K. Shade, K. M. Catley ⁄ Topics in Cognitive Science (2010)

The horse textbook diagram depicts relationships among Equus, the modern horse, and
several extinct relatives. We found this diagram in the book used for the human biology
class at Vanderbilt University (Chiras, 2002). Like the hominid textbook diagram, this dia-
gram leads some students to interpret the evolution of at least some of the taxa as arising
through anagenesis (Catley, in press). The corresponding tree and ladder cladograms were
adapted from the one provided in Evander (1989). Fig. 4 shows each diagram.
A
B
C
Fig. 4. (A) Textbook, (B) ladder, and (C) tree diagrams for the horse taxa. The textbook diagram is from Chiras
(2002), p. 501, fig. 21-15. Copyright 2002 by Jones and Bartlett. Adapted with permission.
L. R. Novick, C. K. Shade, K. M. Catley ⁄ Topics in Cognitive Science (2010) 9

As discussed in Novick and Catley (2007), the tree and ladder cladogram formats are iso-
morphic. Unfortunately, it is not possible to construct cladograms that are unequivocally
isomorphic to the linear depictions of evolutionary history in the textbook diagrams. In clad-
ograms, taxa are depicted only at the terminal branches of the diagram, whereas nonclado-
genic diagrams allow taxa to be depicted at internal nodes as well (which can lead to the
linear depictions seen in the textbook diagrams used in the present study). Nevertheless, it is
possible to create questions about corresponding parts of cladogenic and noncladogenic dia-
grams for which subjects can provide comparable answers, as discussed earlier. Of course,
the diagrammatic formats themselves could still bias interpretation in one way or another,
as we hypothesize. With just two exceptions, we created such equivalent questions for each
set of diagrams, and those are the questions whose responses we discuss in this article. All
questions are given in the Appendix.
We wrote four questions for the hominid diagrams. The first two were identical for all
three diagrams. The third question asked about the relationship between A. robustus and the
taxon to which it is directly connected. That taxon is different in the textbook diagram ver-
sus the two cladograms (see Fig. 3), so the question was phrased accordingly for each dia-
gram. The fourth question asked about a particular taxon that plays noncorresponding roles
in the textbook diagram versus in the cladograms. Therefore, we will not present the results
for that question. We wrote four questions about the horse taxa that were identical across
diagrams. A fifth question was asked about the textbook diagram only, about a portion of
that diagram that had no corresponding part in the cladograms. We discuss the results for
the four common questions.
2.3. Design and procedure
One independent variable was diagram format. Subjects received three diagrams, each
drawn in a different format—textbook, ladder cladogram, and tree cladogram. The assign-
ment of the three sets of taxa—hominid, horse, primate—to diagram formats was counter-
balanced across subjects. For each of the six possible combinations of taxa and formats, the
three stimulus pages could be arranged in six different orders, yielding 36 different booklets
that were randomly distributed to subjects. For each set of taxa, diagram format was
manipulated between subjects. The second independent variable, which also varied between
subjects, was weaker versus stronger background in biology. Due to the counterbalancing,
16–20 subjects in each biology background group received each diagram.
The materials for this experiment were presented as one of several booklets that sub-
jects completed at their own pace in a single session that lasted approximately 50–
90 min. These booklets constituted data collection for separate experiments that
addressed distinct conceptual and theoretical issues. The final page in the folder was a
background information questionnaire that included the coursework question needed to
assign subjects to biology background groups. The results of the other studies will be
reported elsewhere. Most subjects (both weaker and stronger background) participated in
groups, although occasionally only one person signed up or showed up for the experi-
mental session. All subjects completed the booklets either in a large lab room with
10 L. R. Novick, C. K. Shade, K. M. Catley ⁄ Topics in Cognitive Science (2010)

individual tables set up for paper-and-pencil data collection that looks like a classroom
or in an actual classroom.
3. Results
3.1. Coding the written responses
Each free response answer received a code based on the content of the response. Because
our goal was to determine (a) the extent to which students have components of a correct
understanding of evolutionary history (especially levels of ancestry) and (b) the extent to
which they view evolution as an anagenic process, we only distinguished responses that
shed light on these issues. Development of the coding scheme for each question was guided
by our prior research in this area (Novick & Catley, unpublished data) and by the responses
most often provided by subjects. Subjects received a single code for each question. The
codes were ranked according to level of sophistication, with 2–4 codes for each question
receiving quality scores of 1, 0.5, or 0.25. Subjects’ responses that did not fit into these cod-
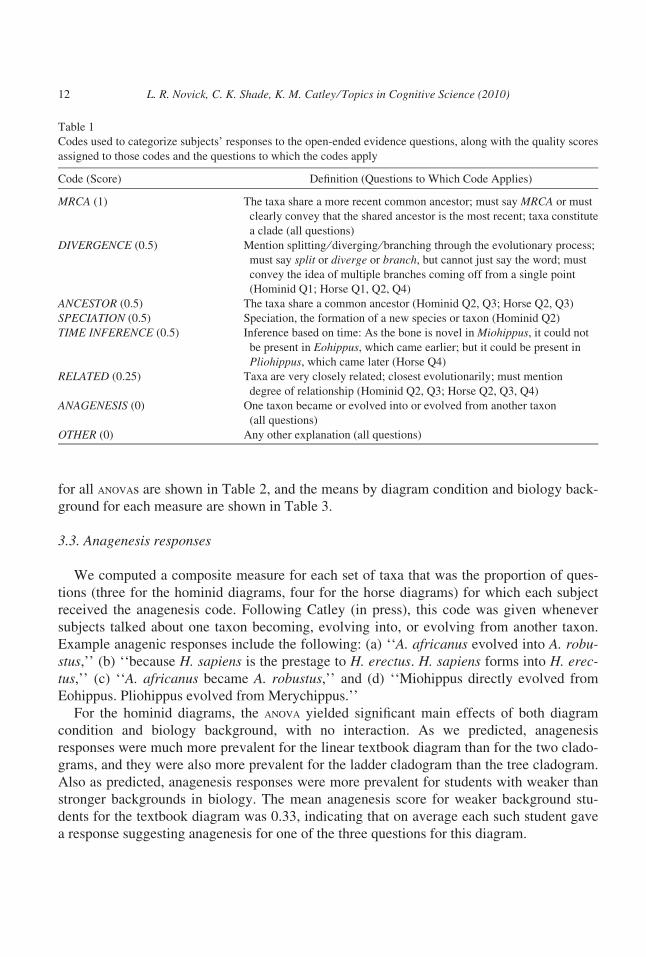
ing categories received a quality score of 0 and were coded as either anagenesis or other.The codes, their definitions, and their associated quality scores are described prior to the rel-
evant analyses. In addition, all code definitions and the questions to which each code applies
are given in Table 1.
The second author and an undergraduate research assistant coded the data from 20 of the
86 subjects who participated during the fall 2007 semester for training purposes. Then they
independently coded the responses from the remaining 66 subjects. The coding was done
blind to diagram condition. For the questions reported here, the two coders agreed on the
appropriate code for 84% of subjects’ justifications (range of 73–92% across questions).
Discrepancies were resolved by the first author, who then coded the data (blind to diagram
condition) from the 22 subjects who participated during the fall 2008 semester.1
3.2. Overview of the analyses
The objective questions were scored as either correct (1) or incorrect (0). As noted, the
content codes for the open-ended questions received a quality score ranging from 0 to 1.
Question accuracy and evidence quality were determined by the third author, who is an evo-
lutionary biologist. A diagram format (textbook vs. ladder vs. tree) X biology background
(stronger vs. weaker) between-subjects analysis of variance (anova) was conducted for each
dependent variable. An alpha level of 0.05 was the criterion for statistical significance.
Effect size is reported as partial g2, with 0.01 being the minimum value for a small effect,
0.09 the minimum for a medium-sized effect, and 0.25 the minimum for a large effect.
In the next section, we report the results concerning anagenesis responses for both sets of
taxa. Then we report the results for the evolutionary distance questions. We asked one such
question about each set of taxa. In the final two sections, we report the results for the
remaining questions that were idiosyncratic to the hominid and horse diagrams. The results
L. R. Novick, C. K. Shade, K. M. Catley ⁄ Topics in Cognitive Science (2010) 11
for all anovas are shown in Table 2, and the means by diagram condition and biology back-
ground for each measure are shown in Table 3.
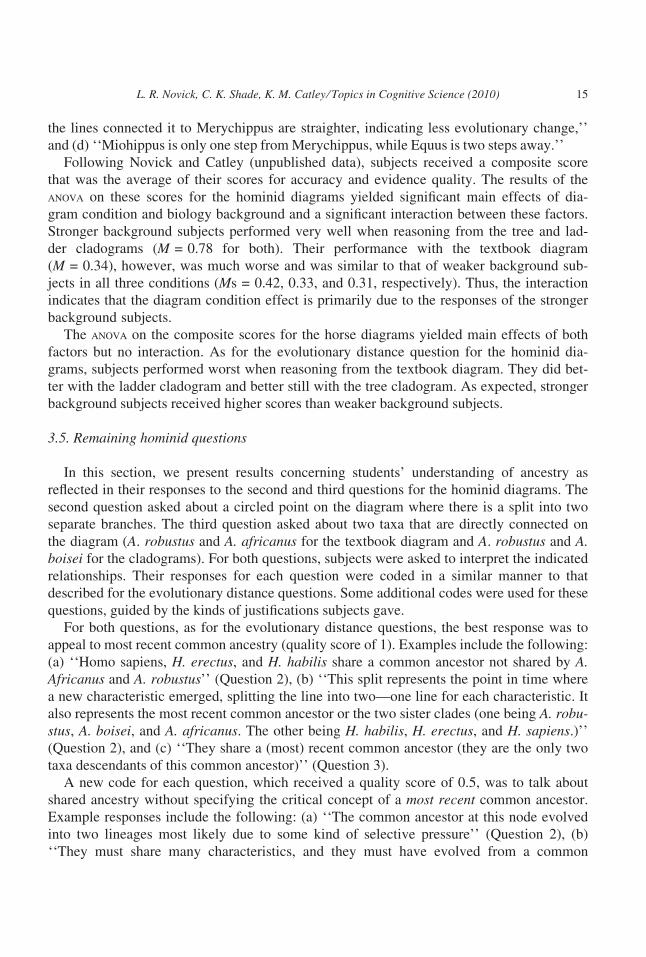
3.3. Anagenesis responses
We computed a composite measure for each set of taxa that was the proportion of ques-
tions (three for the hominid diagrams, four for the horse diagrams) for which each subject
received the anagenesis code. Following Catley (in press), this code was given whenever
subjects talked about one taxon becoming, evolving into, or evolving from another taxon.
Example anagenic responses include the following: (a) ‘‘A. africanus evolved into A. robu-stus,’’ (b) ‘‘because H. sapiens is the prestage to H. erectus. H. sapiens forms into H. erec-tus,’’ (c) ‘‘A. africanus became A. robustus,’’ and (d) ‘‘Miohippus directly evolved from
Eohippus. Pliohippus evolved from Merychippus.’’
For the hominid diagrams, the anova yielded significant main effects of both diagram
condition and biology background, with no interaction. As we predicted, anagenesis
responses were much more prevalent for the linear textbook diagram than for the two clado-
grams, and they were also more prevalent for the ladder cladogram than the tree cladogram.
Also as predicted, anagenesis responses were more prevalent for students with weaker than
stronger backgrounds in biology. The mean anagenesis score for weaker background stu-
dents for the textbook diagram was 0.33, indicating that on average each such student gave
a response suggesting anagenesis for one of the three questions for this diagram.
Table 1
Codes used to categorize subjects’ responses to the open-ended evidence questions, along with the quality scores
assigned to those codes and the questions to which the codes apply
Code (Score) Definition (Questions to Which Code Applies)
MRCA (1) The taxa share a more recent common ancestor; must say MRCA or must
clearly convey that the shared ancestor is the most recent; taxa constitute
a clade (all questions)
DIVERGENCE (0.5) Mention splitting ⁄ diverging ⁄ branching through the evolutionary process;
must say split or diverge or branch, but cannot just say the word; must
convey the idea of multiple branches coming off from a single point
(Hominid Q1; Horse Q1, Q2, Q4)
ANCESTOR (0.5) The taxa share a common ancestor (Hominid Q2, Q3; Horse Q2, Q3)
SPECIATION (0.5) Speciation, the formation of a new species or taxon (Hominid Q2)
TIME INFERENCE (0.5) Inference based on time: As the bone is novel in Miohippus, it could not
be present in Eohippus, which came earlier; but it could be present in
Pliohippus, which came later (Horse Q4)
RELATED (0.25) Taxa are very closely related; closest evolutionarily; must mention
degree of relationship (Hominid Q2, Q3; Horse Q2, Q3, Q4)
ANAGENESIS (0) One taxon became or evolved into or evolved from another taxon
(all questions)
OTHER (0) Any other explanation (all questions)
12 L. R. Novick, C. K. Shade, K. M. Catley ⁄ Topics in Cognitive Science (2010)

Table 2
Results of the statistical analyses (two-factor between-subjects anovas) for each variable
Measure ⁄Questions Included
Main Effect
of Diagram Type
Main Effect
of Biology Background Interaction
Anagenesis
Hominid Qs
1–3 evidence
F(2, 102) = 13.42, p < .001,
partial g2 = 0.21, MSE = 0.03
F(1, 102) = 15.74, p < .001,
partial g2 = 0.13
F(2, 102) = 0.89, ns,
partial g2 = 0.02
Horse Qs
1–4 evidence
F(2, 102) = 5.57, p < .01,
partial g2 = 0.10, MSE = 0.02
F(1, 102) = 1.03, ns,
partial g2 = 0.01
F(2, 102) = 0.05, ns,
partial g2 = 0.00
Evolutionary distance
Hominid Q1
accuracy and
evidence
F(2, 102) = 10.82, p < .001,
partial g2 = 0.17, MSE = 0.07
F(1, 102) = 31.29, p < .001,
partial g2 = 0.23
F(2, 102) = 6.48, p < .01,
partial g2 = 0.11
Horse Q1
accuracy and
evidence
F(2, 102) = 23.11, p < .001,
partial g2 = 0.31, MSE = 0.09
F(1, 102) = 17.18, p < .001,
partial g2 = 0.14
F(2, 102) = 1.91, ns,
partial g2 = 0.04
Shared ancestry
Hominid Q2,
Q3 evidence
F(2, 102) = 1.55, ns,
partial g2 = 0.03, MSE = 0.04
F(1, 102) = 37.71, p < .001,
partial g2 = 0.27
F(2, 102) = 1.15, ns,
partial g2 = 0.02
Horse Q2, Q3,
Q4 evidence
F(2, 102) = 6.68, p < .01,
partial g2 = 0.12, MSE = 0.04
F(1, 102) = 58.69, p < .001,
partial g2 = 0.37
F(2, 102) = 4.80, p < .02,
partial g2 = 0.09
Good continuation
Horse Q2
accuracy
F(2, 102) = 13.41, p < .001,
partial g2 = 0.21, MSE = 0.17
F(1, 102) = 2.75, ns,
partial g2 = 0.03
F(2, 102) = 0.99, ns,
partial g2 = 0.02
Other
Horse Q4
accuracy
F(2, 102) = 4.83, p < .02,
partial g2 = 0.09, MSE = 0.22
F(1, 102) = 8.43, p < .01,
partial g2 = 0.08
F(2, 102) = 0.01, ns,
partial g2 = 0.00
Table 3
Mean scores for each measure as a function of type of diagram and biology background
Measure ⁄ Questions
Type of Diagram Biology Background
Tree Ladder Textbook Stronger Weaker
Anagenesis
Hominid Q1, Q2, Q3 0.04 (0.11) 0.12 (0.18) 0.25 (0.26) 0.07 (0.15) 0.20 (0.24)
Horse Q1, Q2, Q3, Q4 0.02 (0.07) 0.04 (0.14) 0.14 (0.22) 0.05 (0.13) 0.08 (0.19)
Evolutionary distance
Hominid Q1 0.60 (0.30) 0.53 (0.33) 0.33 (0.30) 0.63 (0.34) 0.35 (0.25)
Horse Q1 0.63 (0.31) 0.46 (0.39) 0.15 (0.24) 0.54 (0.38) 0.28 (0.31)
Shared ancestry
Hominid Q2, Q3 0.23 (0.24) 0.27 (0.25) 0.21 (0.24) 0.36 (0.26) 0.12 (0.13)
Horse Q2, Q3, Q4 0.37 (0.32) 0.35 (0.27) 0.20 (0.17) 0.46 (0.27) 0.15 (0.15)
Good continuation
Horse Q2 accuracy 0.78 (0.42) 0.40 (0.50) 0.89 (0.31) 0.76 (0.43) 0.63 (0.49)
Other
Horse Q4 accuracy 0.64 (0.49) 0.40 (0.50) 0.73 (0.45) 0.72 (0.45) 0.46 (0.50)
Note. Standard deviations are given in parentheses.
L. R. Novick, C. K. Shade, K. M. Catley ⁄ Topics in Cognitive Science (2010) 13

For the horse diagrams, the anova yielded only a main effect of diagram condition, which
showed a similar pattern as was found for the hominid diagrams: Anagenesis responses were
much more prevalent for the linear textbook diagram than for the cladograms. Overall, ana-
genesis responses were half as prevalent for the horse diagrams as for the hominid diagrams,
suggesting that students are less willing to acknowledge the coexistence of multiple hominid
species as multiple equine species. We will return to this difference in the discussion
section.
3.4. Evolutionary distance questions
The first question for both sets of taxa was an evolutionary distance question (Novick &
Catley, unpublished data) in which subjects were given a reference taxon (e.g., H. erectusfor the hominid diagrams) and asked which of two other taxa (e.g., H. habilis or H. sapiens)
is the closest evolutionary relation to that taxon. They were also asked to provide evidence
to support their answer. This question required subjects to interpret the structural relation-
ships (i.e., patterns of connectedness) among the taxa rather than simply the proximity of
the taxa on the diagram. The correct answer (score of 1) is the comparison taxon that shares
a more recent common ancestor (MRCA) with the reference taxon: H. sapiens for the homi-
nid diagrams because it shares a MRCA with H. erectus than does H. habilis, and Equus for
the horse diagrams because it shares a MRCA with Merychippus than does Miohippus.Three codes were used to assess subjects’ justifications in terms of their understanding of
most recent common ancestry, the critical concept in understanding evolutionary relation-
ship. The most sophisticated response was to mention that the reference taxon shares a
MRCA with the chosen taxon or that the reference taxon and the chosen taxon form a clade
(a group consisting of the most recent common ancestor of the group and all descendants of
that ancestor). Such responses received a quality score of 1. Examples include the following:
(a) ‘‘sapiens and erectus have a common ancestor more recently than habilis,’’ (b) ‘‘sapiens,
they form a clade & have more common ancestors,’’ (c) ‘‘have a more recent common
ancestor,’’ and (d) ‘‘Equus and Merychippus share a more recent common ancestor that
[sic] Miohippus and Merychippus.’’
The divergence code, which was next in terms of quality of reasoning, was given if sub-
jects mentioned splitting, branching, or diverging through the evolutionary process. Such
responses received a quality score of 0.5. Examples include the following: (a) ‘‘These two
diverged the most recently. H. habilis diverged from the other two at an earlier time,’’ (b)
‘‘it’s part of the same branch as H. erectus and the split between these two is later than erec-
tus and habilis,’’ and (c) ‘‘Equs [sic] and Merychippus branch from common ancestor &
both undergo less changes.’’
The remaining responses referred to a variety of factors such as the number of common
characteristics between taxa, taxa being connected or linked on the diagram, physical dis-
tance in space between the taxon labels, and anagenesis (discussed in the previous section).
All such responses received a quality score of 0. Examples include the following: (a) ‘‘The
size and shape of H. habilis looks more similar than H. sapiens,’’ (b) ‘‘The branches are smal-
ler leading to the Merychippus from the Miohippus taxon,’’ (c) ‘‘Equus is the closest because
14 L. R. Novick, C. K. Shade, K. M. Catley ⁄ Topics in Cognitive Science (2010)
the lines connected it to Merychippus are straighter, indicating less evolutionary change,’’
and (d) ‘‘Miohippus is only one step from Merychippus, while Equus is two steps away.’’
Following Novick and Catley (unpublished data), subjects received a composite score
that was the average of their scores for accuracy and evidence quality. The results of the
anova on these scores for the hominid diagrams yielded significant main effects of dia-
gram condition and biology background and a significant interaction between these factors.
Stronger background subjects performed very well when reasoning from the tree and lad-
der cladograms (M = 0.78 for both). Their performance with the textbook diagram
(M = 0.34), however, was much worse and was similar to that of weaker background sub-
jects in all three conditions (Ms = 0.42, 0.33, and 0.31, respectively). Thus, the interaction
indicates that the diagram condition effect is primarily due to the responses of the stronger
background subjects.
The anova on the composite scores for the horse diagrams yielded main effects of both
factors but no interaction. As for the evolutionary distance question for the hominid dia-
grams, subjects performed worst when reasoning from the textbook diagram. They did bet-
ter with the ladder cladogram and better still with the tree cladogram. As expected, stronger
background subjects received higher scores than weaker background subjects.
3.5. Remaining hominid questions
In this section, we present results concerning students’ understanding of ancestry as
reflected in their responses to the second and third questions for the hominid diagrams. The
second question asked about a circled point on the diagram where there is a split into two
separate branches. The third question asked about two taxa that are directly connected on
the diagram (A. robustus and A. africanus for the textbook diagram and A. robustus and A.boisei for the cladograms). For both questions, subjects were asked to interpret the indicated
relationships. Their responses for each question were coded in a similar manner to that
described for the evolutionary distance questions. Some additional codes were used for these
questions, guided by the kinds of justifications subjects gave.
For both questions, as for the evolutionary distance questions, the best response was to
appeal to most recent common ancestry (quality score of 1). Examples include the following:
(a) ‘‘Homo sapiens, H. erectus, and H. habilis share a common ancestor not shared by A.Africanus and A. robustus’’ (Question 2), (b) ‘‘This split represents the point in time where
a new characteristic emerged, splitting the line into two—one line for each characteristic. It
also represents the most recent common ancestor or the two sister clades (one being A. robu-stus, A. boisei, and A. africanus. The other being H. habilis, H. erectus, and H. sapiens.)’’
(Question 2), and (c) ‘‘They share a (most) recent common ancestor (they are the only two
taxa descendants of this common ancestor)’’ (Question 3).
A new code for each question, which received a quality score of 0.5, was to talk about
shared ancestry without specifying the critical concept of a most recent common ancestor.
Example responses include the following: (a) ‘‘The common ancestor at this node evolved
into two lineages most likely due to some kind of selective pressure’’ (Question 2), (b)
‘‘They must share many characteristics, and they must have evolved from a common
L. R. Novick, C. K. Shade, K. M. Catley ⁄ Topics in Cognitive Science (2010) 15
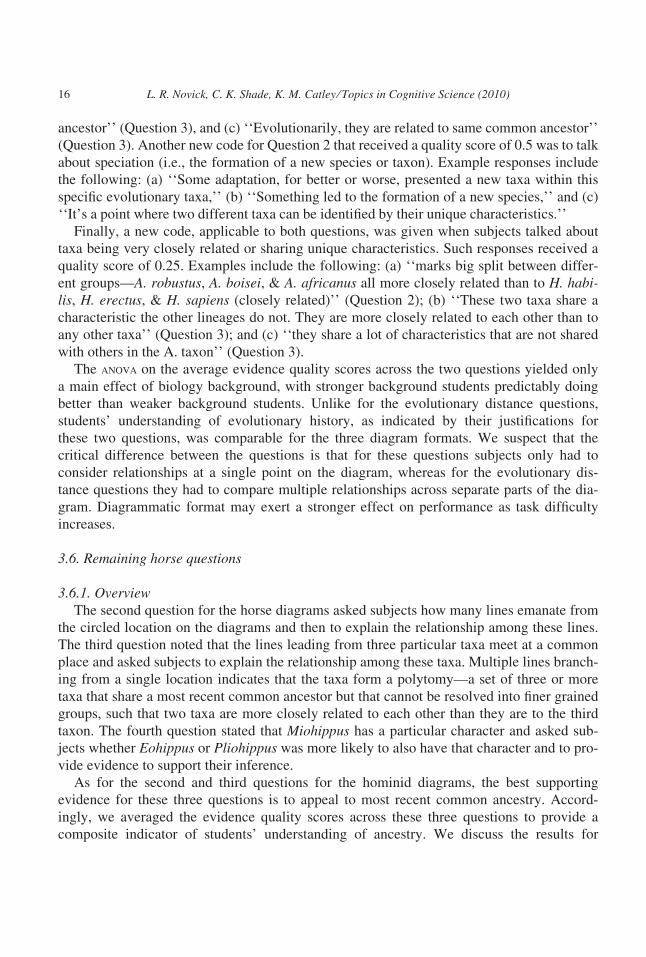
ancestor’’ (Question 3), and (c) ‘‘Evolutionarily, they are related to same common ancestor’’
(Question 3). Another new code for Question 2 that received a quality score of 0.5 was to talk
about speciation (i.e., the formation of a new species or taxon). Example responses include
the following: (a) ‘‘Some adaptation, for better or worse, presented a new taxa within this
specific evolutionary taxa,’’ (b) ‘‘Something led to the formation of a new species,’’ and (c)
‘‘It’s a point where two different taxa can be identified by their unique characteristics.’’
Finally, a new code, applicable to both questions, was given when subjects talked about
taxa being very closely related or sharing unique characteristics. Such responses received a
quality score of 0.25. Examples include the following: (a) ‘‘marks big split between differ-
ent groups—A. robustus, A. boisei, & A. africanus all more closely related than to H. habi-lis, H. erectus, & H. sapiens (closely related)’’ (Question 2); (b) ‘‘These two taxa share a
characteristic the other lineages do not. They are more closely related to each other than to
any other taxa’’ (Question 3); and (c) ‘‘they share a lot of characteristics that are not shared
with others in the A. taxon’’ (Question 3).
The anova on the average evidence quality scores across the two questions yielded only
a main effect of biology background, with stronger background students predictably doing
better than weaker background students. Unlike for the evolutionary distance questions,
students’ understanding of evolutionary history, as indicated by their justifications for
these two questions, was comparable for the three diagram formats. We suspect that the
critical difference between the questions is that for these questions subjects only had to
consider relationships at a single point on the diagram, whereas for the evolutionary dis-
tance questions they had to compare multiple relationships across separate parts of the dia-
gram. Diagrammatic format may exert a stronger effect on performance as task difficulty
increases.
3.6. Remaining horse questions
3.6.1. OverviewThe second question for the horse diagrams asked subjects how many lines emanate from
the circled location on the diagrams and then to explain the relationship among these lines.
The third question noted that the lines leading from three particular taxa meet at a common
place and asked subjects to explain the relationship among these taxa. Multiple lines branch-
ing from a single location indicates that the taxa form a polytomy—a set of three or more
taxa that share a most recent common ancestor but that cannot be resolved into finer grained
groups, such that two taxa are more closely related to each other than they are to the third
taxon. The fourth question stated that Miohippus has a particular character and asked sub-
jects whether Eohippus or Pliohippus was more likely to also have that character and to pro-
vide evidence to support their inference.
As for the second and third questions for the hominid diagrams, the best supporting
evidence for these three questions is to appeal to most recent common ancestry. Accord-
ingly, we averaged the evidence quality scores across these three questions to provide a
composite indicator of students’ understanding of ancestry. We discuss the results for
16 L. R. Novick, C. K. Shade, K. M. Catley ⁄ Topics in Cognitive Science (2010)

that measure first, followed by the results for the accuracy scores for the second and
fourth questions.
3.6.2. Understanding of ancestryThe MRCA code applied to all three questions and received a quality score of 1. The
divergence code (score of 0.5) applied to questions 2 and 4. The shared ancestry code
(score of 0.5) applied to questions 2 and 3. The closely related code (score of 0.25) applied
to all three questions. One new code, which received a quality score of 0.5, was used for
Question 4 to account for a unique pattern of reasoning observed for that question. Some
subjects supported their inference based on the semantics of the question and their knowl-
edge that evolution occurs over an extended time period. These subjects reasoned that
because the question stated that the ear bone was novel in Miohippus, it could not be pres-
ent in Eohippus because that taxon came before Miohippus. The bone could be present in
Pliohippus, however, because that taxon arose after Miohippus. Example responses include
the following: (a) ‘‘Since Eohippus evolved earlier than Miohhipus, and if it is assumed
that Eohippus does not have this bone, than the bone evolved after Eohippus and would
thus be present in Pliohippus because it evolved after Miohippus’’ and (b) ‘‘newer evolu-
tionary characteristic—can’t track backwards.’’ All other responses to these three ques-
tions received a quality score of 0.
The anova on the average evidence quality scores yielded significant main effects of dia-
gram type and biology background and a significant interaction between these factors. The
pattern of means is familiar: Subjects did better with the cladograms than with the textbook
diagram, and stronger background students did better than weaker background students. As
for the evolutionary distance question for the hominid diagrams, the interaction indicated
that the diagram type effect was driven by the responses of the stronger background students
(Ms of 0.56, 0.53, and 0.27 for the tree, ladder, and textbook diagrams, respectively); the
weaker background students did similarly poorly for all three diagram types (Ms of 0.14,
0.19, and 0.13, respectively).
3.6.3. Good continuationNovick and Catley (2007, unpublished data) found that, due to the Gestalt principle of
good continuation, subjects encode the long slanted line at the base of a ladder cladogram as
a single entity and lines that intersect that line as separate entities. Thus, for horse Question
2 we expected subjects in the present study to say that two lines extend from the circled
location on the ladder. The correct answer, however, as should be evident from the tree clad-
ogram, is three. In contrast, there is no reason for subjects to have difficulty counting the
lines for either the tree cladogram (three) or the textbook diagram (four). Thus, for this ques-
tion, we predicted worse performance for the ladder cladogram, regardless of biology back-
ground, than for the other two diagrams.
The results of the anova supported this hypothesis. The significant main effect of diagram
condition indicated much higher accuracy for the tree cladogram and the textbook diagram
than for the ladder cladogram. As expected, the modal response for the ladder was two lines(57% of subjects). No other effects were significant, indicating that both weaker and
L. R. Novick, C. K. Shade, K. M. Catley ⁄ Topics in Cognitive Science (2010) 17
stronger background subjects misinterpreted the ladder cladogram in accordance with the
Gestalt principle of good continuation.
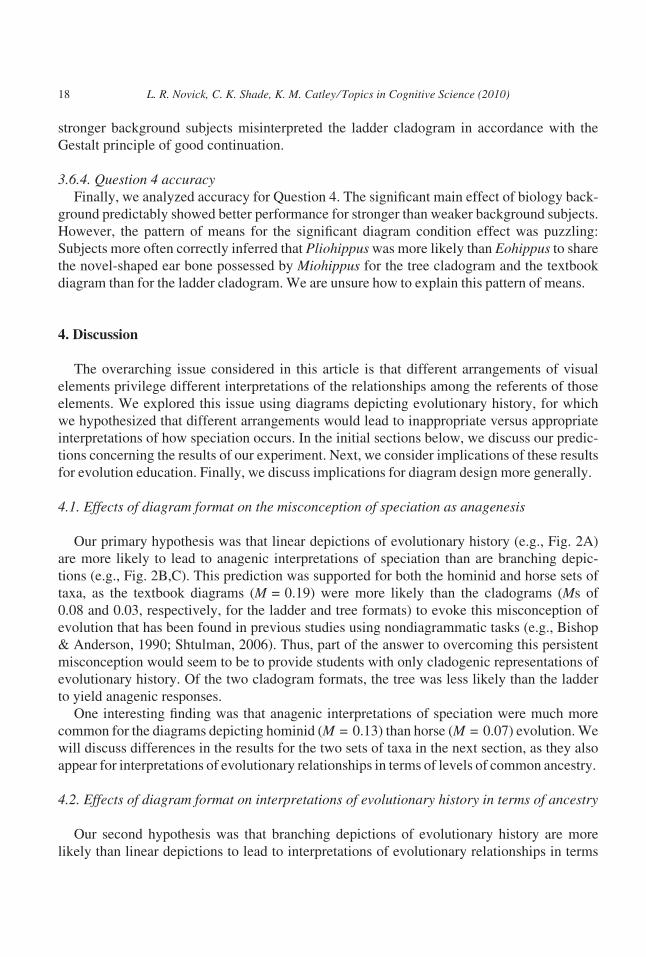
3.6.4. Question 4 accuracyFinally, we analyzed accuracy for Question 4. The significant main effect of biology back-
ground predictably showed better performance for stronger than weaker background subjects.
However, the pattern of means for the significant diagram condition effect was puzzling:
Subjects more often correctly inferred that Pliohippus was more likely than Eohippus to share
the novel-shaped ear bone possessed by Miohippus for the tree cladogram and the textbook
diagram than for the ladder cladogram. We are unsure how to explain this pattern of means.
4. Discussion
The overarching issue considered in this article is that different arrangements of visual
elements privilege different interpretations of the relationships among the referents of those
elements. We explored this issue using diagrams depicting evolutionary history, for which
we hypothesized that different arrangements would lead to inappropriate versus appropriate
interpretations of how speciation occurs. In the initial sections below, we discuss our predic-
tions concerning the results of our experiment. Next, we consider implications of these results
for evolution education. Finally, we discuss implications for diagram design more generally.
4.1. Effects of diagram format on the misconception of speciation as anagenesis
Our primary hypothesis was that linear depictions of evolutionary history (e.g., Fig. 2A)
are more likely to lead to anagenic interpretations of speciation than are branching depic-
tions (e.g., Fig. 2B,C). This prediction was supported for both the hominid and horse sets of
taxa, as the textbook diagrams (M = 0.19) were more likely than the cladograms (Ms of
0.08 and 0.03, respectively, for the ladder and tree formats) to evoke this misconception of
evolution that has been found in previous studies using nondiagrammatic tasks (e.g., Bishop
& Anderson, 1990; Shtulman, 2006). Thus, part of the answer to overcoming this persistent
misconception would seem to be to provide students with only cladogenic representations of
evolutionary history. Of the two cladogram formats, the tree was less likely than the ladder
to yield anagenic responses.
One interesting finding was that anagenic interpretations of speciation were much more
common for the diagrams depicting hominid (M = 0.13) than horse (M = 0.07) evolution. We
will discuss differences in the results for the two sets of taxa in the next section, as they also
appear for interpretations of evolutionary relationships in terms of levels of common ancestry.
4.2. Effects of diagram format on interpretations of evolutionary history in terms of ancestry
Our second hypothesis was that branching depictions of evolutionary history are more
likely than linear depictions to lead to interpretations of evolutionary relationships in terms
18 L. R. Novick, C. K. Shade, K. M. Catley ⁄ Topics in Cognitive Science (2010)

of levels of ancestry. Two sets of analyses tested this hypothesis. One set examined a com-
posite measure of accuracy and evidence quality for the evolutionary distance question for
each set of taxa. The second set examined mean evidence quality across the remaining ques-
tions for each set of taxa. For three of the four analyses there was a significant effect of dia-
gram format, in each case indicating better understanding of evolutionary relationship in
terms of levels of common ancestry for the two cladogram formats than for the textbook dia-
grams (overall Ms of 0.53 for the tree cladograms, 0.45 for the ladder cladograms, and 0.23
for the textbook diagrams).
The one exception was for the measure of shared ancestry for Questions 2 and 3 for the
hominid diagrams, for which subjects gave similarly poor responses regardless of diagram
format (overall M = 0.24). Thus, subjects were more likely to interpret evolutionary history
as reflecting anagenesis and less likely to interpret it as reflecting levels of shared ancestry
for the hominid taxa than for the horse taxa. This combination of results suggests that stu-
dents do not clearly understand that hominid evolution operates under the same principles
that drive the evolution of other taxa (also see Evans, 2001). Given Catley and Novick’s
(2008) analysis of the evolutionary diagrams found in contemporary biology textbooks, this
misconception may reflect what students, perhaps inadvertently, have been taught. Not only
are linear depictions of evolutionary history more likely to involve hominid evolution than
the evolution of any other subset of life on Earth, but both across and within textbooks, the
corpus of evolutionary diagrams suggests that the hominid and great ape lineages split as a
branching event (cladogenesis), but evolution within the hominid lineage subsequently fol-
lowed a primarily linear, anagenic process, with one species turning into another until the
‘‘final’’ appearance of H. sapiens.
4.3. The Gestalt principle of good continuation
Our previous research has found that college students, even those with stronger back-
grounds in biology, have difficulty extracting the correct hierarchical structure from ladder
format cladograms due to the Gestalt principle of good continuation (Novick & Catley,
2007, unpublished data). Because of the nature of this misinterpretation, we predicted that
subjects in the present study would miscount the number of lines (evolutionary branches)
extending from a particular location on the horse ladder cladogram. In particular, we pre-
dicted that they would count the two lines that extend up from the ‘‘main’’ diagonal line of
the ladder but would miss the branch that is the rightmost part of that diagonal. The results
supported our prediction. Moreover, students with both weaker and stronger backgrounds in
biology were equally likely to make this error.
4.4. Effects of diagram format on the responses of stronger background students
Finally, we predicted that the diagram effects would be found for subjects with stronger
as well as weaker backgrounds in biology, despite the overall better performance by the
stronger background students. This prediction was confirmed. Importantly, greater expertise
in biology did not inoculate students against inappropriate interpretations of evolution
L. R. Novick, C. K. Shade, K. M. Catley ⁄ Topics in Cognitive Science (2010) 19
suggested by the linear depictions of ancestry found in some textbook diagrams. Moreover,
for only two measures, both involving appropriate interpretations of evolutionary history in
terms of levels of ancestry, did diagram type interact with biology background. In both cases
the (predicted) diagram effects were due primarily (or solely) to the stronger background
subjects. Although for these two measures the biasing effect of cladogenic depictions on
interpretations in terms of ancestry was (largely) confined to stronger background students,
for the other two such measure the diagram effects were consistent across subject groups.
4.5. Implications for evolution education
Novick and Catley (2007, 2009) found that college students perform better on a variety
of tree-thinking tasks when evolutionary relationships are depicted in a tree cladogram
rather than a ladder cladogram. The present results indicate that both cladogram formats fos-
ter better reasoning than the noncladogenic depictions that coexist in contemporary text-
books. One implication of our results, therefore, is that textbook authors and illustrators
should avoid diagrams that contain linear components that inappropriately suggest that spe-
ciation is the result of anagenesis. A second implication, for both textbooks and classroom
teachers, is that in introducing tree thinking into high school and college biology curricula
(e.g., see Baum et al., 2005; Catley, 2006; Goldsmith, 2003), curriculum materials should
use tree format cladograms.
Cladograms in general, and the tree format in particular, may be especially important for
overcoming many students’ belief that our own species (H. sapiens) is special and not sub-
ject to the same laws of evolution that apply to the rest of Earth’s biota, both extinct and
extant (Evans, 2001). Among our subjects, anagenic explanations were more common for
the questions about the hominid than the horse textbook diagram (Ms of 0.25 and 0.14,
respectively). For the hominid taxa, simply switching from the textbook diagram to a tree
cladogram reduced such inappropriate responses by an impressive 84% (to M = 0.04); the
reduction was smaller, but still noteworthy, for the ladder cladogram (52% to M = 0.12).
It is clear that teachers of evolution need to pay close attention to how evolutionary rela-
tionships among taxa are depicted diagrammatically as well as to how the supporting con-
cepts are described verbally. By providing students with appropriate tools, science
educators have the best chance to help them conceptualize the historical processes that pro-
vide the pattern of biological diversity we see in the world.
4.6. Broader implications
4.6.1. Representations of historical eventsUnlike other areas of biological science, evolutionary biology is a historical discipline.
As such, it shares much with a number of other fields that take a historical approach to
understanding the world, including, for example, world history (see O’Hara, 1988), histori-
cal and comparative linguistics (where representations resembling ladder cladograms are
used; e.g., Ringe, Warnow, & Taylor, 2002), historical geology, paleontology, genealogy,
archeology, anthropology, and historical geography. Linear depictions of historical events
20 L. R. Novick, C. K. Shade, K. M. Catley ⁄ Topics in Cognitive Science (2010)

are simplistic because they suggest a single, straight-line path from a starting point to an
ending point. History, of any type, rarely proceeds in such a fashion. Although it is unlikely
that all historical events can be represented by strictly hierarchical branching diagrams as
can evolutionary (and, perhaps, linguistic) history, the more general point should hold: Rep-
resentations that have a richer or more varied topological structure are likely to privilege
more complex, and therefore more accurate (or at least more nuanced), understandings of
the concepts being represented. Our results concerning differences in interpretation for lin-
ear versus branching representations of evolutionary history provide one example of this
general hypothesis. We challenge other cognitive scientists to collaborate with researchers
in the historical disciplines noted earlier (e.g., world history, linguistics, geology) to extend
these findings to those fields.
4.6.2. The science of diagram designOur results support an emerging pattern of findings indicating that the science of diagram
design needs to take into account perceptual and other biases that viewers bring to the task
of interpreting diagrams (e.g., Zacks & Tversky, 1999), biases that may not be easily over-
come by simply instructing viewers concerning the representational conventions of the dia-
gram in question (e.g., Catley, Novick, & Funk, unpblished data; Corter et al., 2008;
Novick, Catley, & Funk, unpublished data). A set of discrete elements connected along a
line, for example, suggests to viewers a process of replacement of one entity by that which
comes next in the sequence.
The Gestalt principle of good continuation, to take another example, leads viewers to
interpret a continuous line as a single entity (e.g., Kellman, 2000). If the representational
convention requires viewers to assign different interpretations to different parts of a continu-
ous line, as for ladder cladograms, comprehension and reasoning suffer (Novick & Catley,
2007, unpublished data). In the present study, this perceptual principle led subjects to get
the wrong answer for the very simple task of counting how many lines extend from a partic-
ular point on the diagram.
Another constraint that viewers bring to the task of interpreting arrangements of
visual elements, discussed by Corter et al. (2008), is reading order for written language.
Absent a natural starting point in a diagram, viewers tend to scan the elements in the
same order in which they read a page of text (Corter et al., 2008; Taylor & Tversky,
1992). Corter et al. found that processing information-system diagrams according to
reading order rather than the pattern of connectivity among elements led to systematic
errors of interpretation. In research in progress, we have found similar results for the
ladder cladogram format, which is quite different from the type of diagram studied by
Corter et al.
In sum, good diagram design requires creating representations and associated conventions
that work with rather than against viewers’ ‘‘natural’’ ways of processing arrangements of
visual elements. We challenge researchers in the field of diagram design to identify addi-
tional cognitive and perceptual processing factors that underlie diagram interpretation, with
the ultimate goal of providing a coherent classification of such domain-general constraints
on good design.
L. R. Novick, C. K. Shade, K. M. Catley ⁄ Topics in Cognitive Science (2010) 21

Note
1. The second author’s honors thesis made additional distinctions among subjects’
responses that received a quality score of 0. Given the focus of the present article, all
such codes except anagenesis were administratively recoded as other by the first
author. The original coding was done such that (a) all codes, even those that earned a
quality score of 0, were ranked according to their level of sophistication and (b) if
more than one code applied to a subject’s response, the highest ranked code was
assigned. Because the anagenesis code was near the bottom of the rank ordering, all
responses that had received a 0-credit code above anagenesis in the rank ordering had
to be checked to determine whether that code applied before reassigning the response
to the other category. The first author did this blind to condition, using the coding
guide definition and the previously-agreed-upon anagenesis responses as models.
Acknowledgments
We thank Dan Funk at Vanderbilt University for allowing us to collect data from the stu-
dents enrolled in his evolution classes across two semesters. We thank Amy Garza, Marissa
Mencio, and Emily Schreiber for help in collecting the data and Amy Garza for help with
coding the data. Much of the data presented here were collected and reported by the second
author for her undergraduate honors thesis at Vanderbilt University. Some of the data
collection as well as the preparation of this manuscript were supported in part by the
Institute of Education Sciences, U.S. Department of Education, through grant
R305A080621 to Vanderbilt University. The opinions expressed are those of the authors
and do not represent views of the Institute or the U.S. Department of Education.
References
Baum, D. A., Smith, S. D., & Donovan, S. S. (2005). The tree-thinking challenge. Science, 310, 979–980.
Bishop, B. A., & Anderson, C. W. (1990). Student conceptions of natural selection and its role in evolution.
Journal of Research in Science Teaching, 27, 415–427.
Catley, K. M. (2006). Darwin’s missing link: A new paradigm for evolution education. Science Education, 90,
767–783.
Catley, K. M., & Novick, L. R. (2008). Seeing the wood for the trees: An analysis of evolutionary diagrams in
biology textbooks. BioScience, 58, 976–987.
Catley, K. M., Novick, L. R., & Shade, C. K. (in press). Interpreting evolutionary diagrams: when topology and
process conflict. Journal of Research in Science Teaching.
Chiras, D. D. (2002). Human biology: Health, homeostasis, and the environment (4th ed.). Sudbury, MA: Jones
and Bartlett.
Clark, C. A. (2001). Evolution for John Doe: Pictures, the public, and the Scopes trial debate. The Journal ofAmerican History, 87, 1275–1303.
22 L. R. Novick, C. K. Shade, K. M. Catley ⁄ Topics in Cognitive Science (2010)
Corter, J. E., Nickerson, J. V., Tversky, B., Zahner, D., & Rho, Y. J. (2008). Using diagrams to design informa-
tion systems. In B. C. Love, K. McRae, & V. M. Sloutsky (Eds.), Proceedings of the thirtieth annual confer-ence of the Cognitive Science Society (pp. 2259–2264). Austin, TX: Cognitive Science Society.
Evander, R. L. (1989). Phylogeny of the family Equidae. In D. R. Prothero & R. M. Schoch (Eds.), The evolutionof Perissodactyls (pp. 109–127). New York: Oxford University Press.
Evans, E. M. (2001). Cognitive and contextual factors in the emergence of diverse belief systems: Creation
versus evolution. Cognitive Psychology, 42, 217–266.
Foley, R. (1987). Hominid species and stone-tool assemblages: How are they related? Antiquity, 61, 380–392.
Goldsmith, D.W. (2003). Presenting cladistic thinking to biology majors and general science students. TheAmerican Biology Teacher, 65, 679–682.
Gould, S. J. (1995). Ladders and cones: Constraining evolution by canonical icons. In R. B. Silver (Ed.), Hiddenhistories of science (pp. 37–67). New York: NYREV.
Hegarty, M., Carpenter, P. A., & Just, M. A. (1991). Diagrams in the comprehension of scientific texts. In
R. Barr, M. L. Kamil, P. Mosenthal, & P. D. Pearson (Eds.), Handbook of reading research (Vol. 2, pp. 641–
668). New York: Longman.
Hurley, S. M., & Novick, L. R. (in press). Solving problems using matrix, network, and hierarchy diagrams: The
consequences of violating construction conventions. The Quarterly Journal of Experimental Psychology.
Johnson, G. B. (1998). Biology: Visualizing life. Austin, TX: Holt, Rinehart and Winston.
Johnson, G. B., & Raven, P. H. (2001). Biology: Principles & explorations. Austin, TX: Holt, Rinehart and
Winston.
Kellman, P. J. (2000). An update on Gestalt psychology. In B. Landau, J. Sabini, J. Jonides, & E. Newport
(Eds.), Perception, cognition, and language: Essays in honor of Henry and Lila Gleitman. Cambridge, MA:
MIT Press.
Lynch, M. (1990). The externalized retina: Selection and mathematization in the visual documentation of objects
in the life sciences. In M. Lynch & S. Woolgar (Eds.), Representation in scientific practice (pp. 153–186).
Cambridge, MA: MIT Press.
McKim, R. H. (1980). Thinking visually: A strategy manual for problem solving. Belmont, CA: Wadsworth.
Novick, L. R. (2001). Spatial diagrams: Key instruments in the toolbox for thought. In D. L. Medin (Ed.), Thepsychology of learning and motivation (Vol. 40, pp. 279–325). San Diego, CA: Academic Press.
Novick, L. R. (2006a). The importance of both diagrammatic conventions and domain-specific knowledge for
diagram literacy in science: The hierarchy as an illustrative case. In D. Barker-Plummer, R. Cox, &
N. Swoboda (Eds.), Diagrammatic representation and inference (Diagrams 2006), LNAI 4045 (pp. 1–11).
Berlin: Springer-Verlag.
Novick, L. R. (2006b). Understanding spatial diagram structure: An analysis of hierarchies, matrices, and
networks. The Quarterly Journal of Experimental Psychology, 59, 1826–1856.
Novick, L. R., & Catley, K. M. (2007). Understanding phylogenies in biology: The influence of a Gestalt
perceptual principle. Journal of Experimental Psychology: Applied, 13, 197–223.
Novick, L. R., & Hurley, S. M. (2001). To matrix, network, or hierarchy: That is the question. CognitivePsychology, 42, 158–216.
O’Hara, R. J. (1988). Homage to Clio, or, toward an historical philosophy for evolutionary biology. SystematicZoology, 37, 142–155.
Ringe, D., Warnow, T., & Taylor, A. (2002). Indo-European and computational cladistics. Transactions of thePhilological Society, 100, 59–129.
Shtulman, A. (2006). Qualitative difference between naı̈ve and scientific theories of evolution. CognitivePsychology, 52, 170–194.
Taylor, H. A., & Tversky, B. (1992). Descriptions and depictions of environments. Memory & Cognition, 20,
483–496.
van Tuijl, H. F. J. M. (1980). Perceptual interpretation of complex line patterns. Journal of ExperimentalPsychology: Human Perception and Performance, 6, 197–221.
L. R. Novick, C. K. Shade, K. M. Catley ⁄ Topics in Cognitive Science (2010) 23

Tversky, B., Zacks, J., Lee, P. U., & Heiser, J. (2000). Lines, blobs, crosses and arrows. In M. Anderson,
P. Cheng, & V. Haarslev (Eds.), Theory and application of diagrams (pp. 221–230). Edinburgh: Springer.
Zacks, J., & Tversky, B. (1999). Bars and lines: A study of graphic communication. Memory & Cognition, 27,
1073–1079.
Appendix: Questions asked about each set of diagrams
Hominid diagrams: Questions discussed in the text are marked with an asterisk.
*1. Which taxon—H. habilis or H. sapiens—is the closest evolutionary relation to
H. erectus?
What evidence supports your answer?
*2. The diagram splits at the point indicated by the dashed circle. How do you interpret
this split?
*3. A. robustus and A. africanus ⁄ bosei are joined together. What does this tell you about
the evolutionary relationship between these two taxa? [A. africanus was used for the
textbook diagram and A. bosei was used for the cladograms because those are the
corresponding taxa across diagrams.]
4. What is the evolutionary relationship between A. afarensis and all the rest of the taxa?
Horse diagrams: Questions discussed in the text are marked with an asterisk.
*1. Which taxon—Equus or Miohippus—is the closest evolutionary relation to
Merychippus?
What evidence supports your answer?
*2. Notice that multiple lines extend up from the location marked by the dotted circle on
the diagram.
a. How many lines extend up from this location? ________
b. What is the relationship among these lines?
*3. The lines leading from Merychippus, Z, and Pliohippus all meet at a common place.
What does this tell you about the relationship among these three taxa?
*4. Scientists have recently discovered that Miohippus had a novel shaped bone in its
middle ear. Is Eohippus or Pliohippus more likely to also have had this bone in its
middle ear?
What evidence supports your answer?
[The next question was asked about the textbook diagram only.]
5. Near the bottom of the diagram is an arrow. How do you interpret the indicated part
of this diagram?
24 L. R. Novick, C. K. Shade, K. M. Catley ⁄ Topics in Cognitive Science (2010)