linkage analysis and genome mapping
TRANSCRIPT

Linkage analysisRajpal Choudhary
161103004
M.Sc. Biotechnology
Linkage
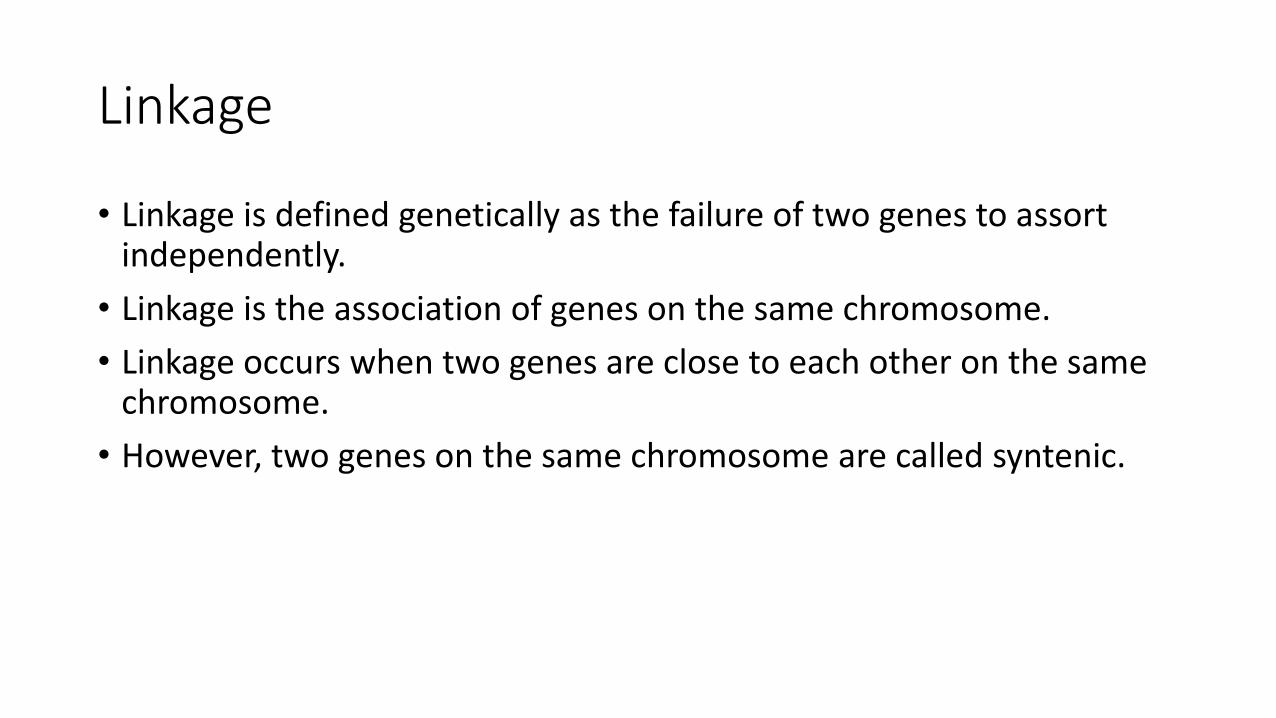
• Linkage is defined genetically as the failure of two genes to assort independently.
• Linkage is the association of genes on the same chromosome.
• Linkage occurs when two genes are close to each other on the same chromosome.
• However, two genes on the same chromosome are called syntenic.

• Linked genes are syntenic, but syntenic genes are not always linked. Genes far apart on the same chromosome assort independently: they are not linked.
• Linkage is based on the frequency of crossing over between the two genes. Crossing over occurs in prophase of meiosis I, where homologous chromosomes break at identical locations and re-join with each other.
• A linkage group is a group of genes which is known to be linked. A chromosome can be called as linkage group.

Process of Recombination
• From an evolutionary point of view, the purpose of sex is to re-shuffle the combinations of alleles so the offspring receive a different set of alleles than their parents had.
• Natural selection then causes offspring with good combinations to survive and reproduce, while offspring with bad combinations don’t pass them on.
• Genes are on chromosomes. Meiosis is a mechanism for re-shuffling the chromosomes: each gamete gets a mixture of paternal and maternal chromosomes.
• However, chromosomes are long and contain many genes. To get individual genes re-shuffled, there needs to be a mechanism of recombining genes that are on the same chromosome. This mechanism is called “crossing over.

• Crossing over occurs in prophase of meiosis 1, when the homologous chromosomes synapse, which means to pair closely with each other. DNA strands from the two chromosomes are matched with each other.
• During synapsis, an enzyme, recombinase, attaches to each chromosome at several randomly chosen points. The recombinase breaks both DNA molecules at the same point, and re-attaches them to opposite partners.
• The result of crossing over can be seen in the microscope as prophase continues, as X shaped structures linking the homologues.
• The genetic consequence of crossing over is that each chromosome that goes into a gamete is a combination of maternal and paternal chromosomes.

Recombination Process

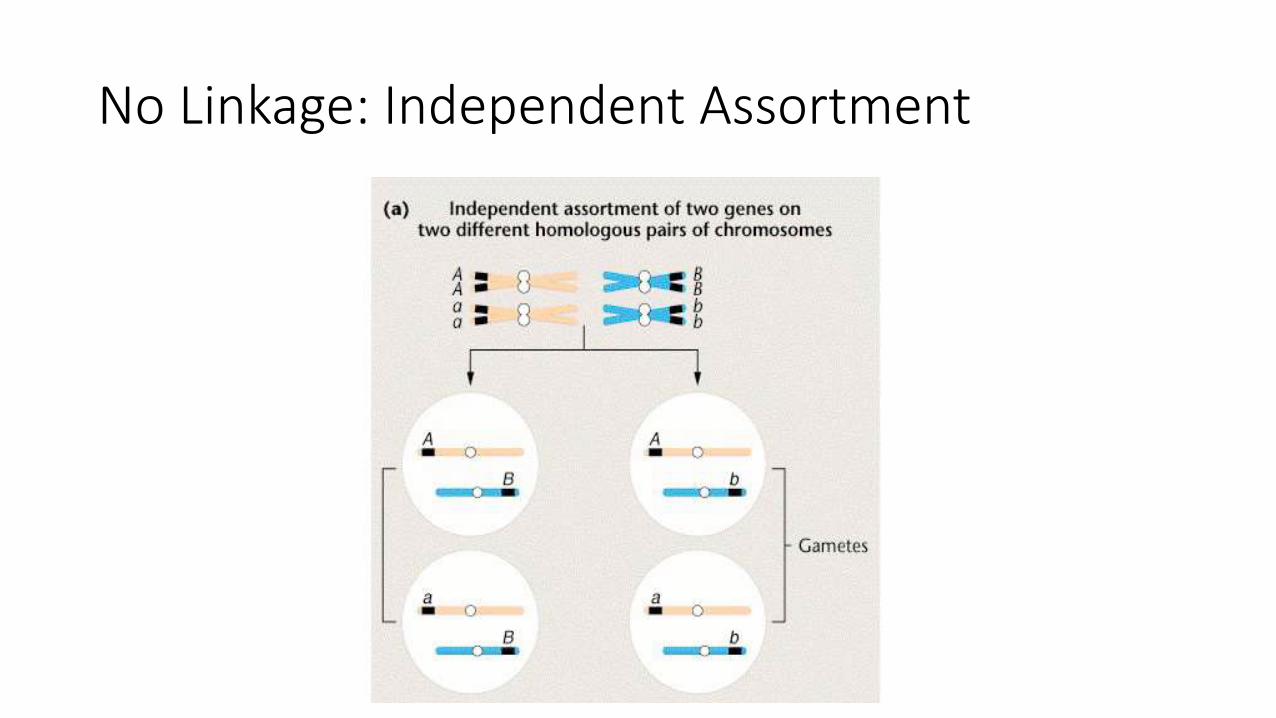
No Linkage: Independent Assortment

Linkage without Recombination

Linkage with Recombination

MAPPING TECHNIQUES
• Linkage analysis is the basis of genetic mapping.
• The offspring usually co-inherit either A with B or a with b, and, in this case, the law of independent assortment is not valid.
• Thus to test for linkage between the genes for two traits, certain types of mattings are examined and observe whether or not the pattern of the combinations of traits exhibited by the offspring follows the law of independent assortment.
• If not, the gene pairs for those traits must be linked, that is they must be on the same chromosome pair.

• Only mattings involving an individual who is heterozygous for both traits (genotype AaBb) reveal deviations from independent assortment and thus reveal linkage.
• Moreover, the most obvious deviations occur in the test cross, a mating between a double heterozygote and a doubly recessive homozygote (genotype aabb).


• Genetic mapping is based on the use of genetic techniques to construct maps showing the positions of genes and other sequence features on a genome.
• Genetic techniques include cross-breeding experiments or, Case of humans, the examination of family histories (pedigrees).

Linkage analysis techniques
• Recombination fraction
• LOD score
• Haldane mapping function

Recombination Frequency
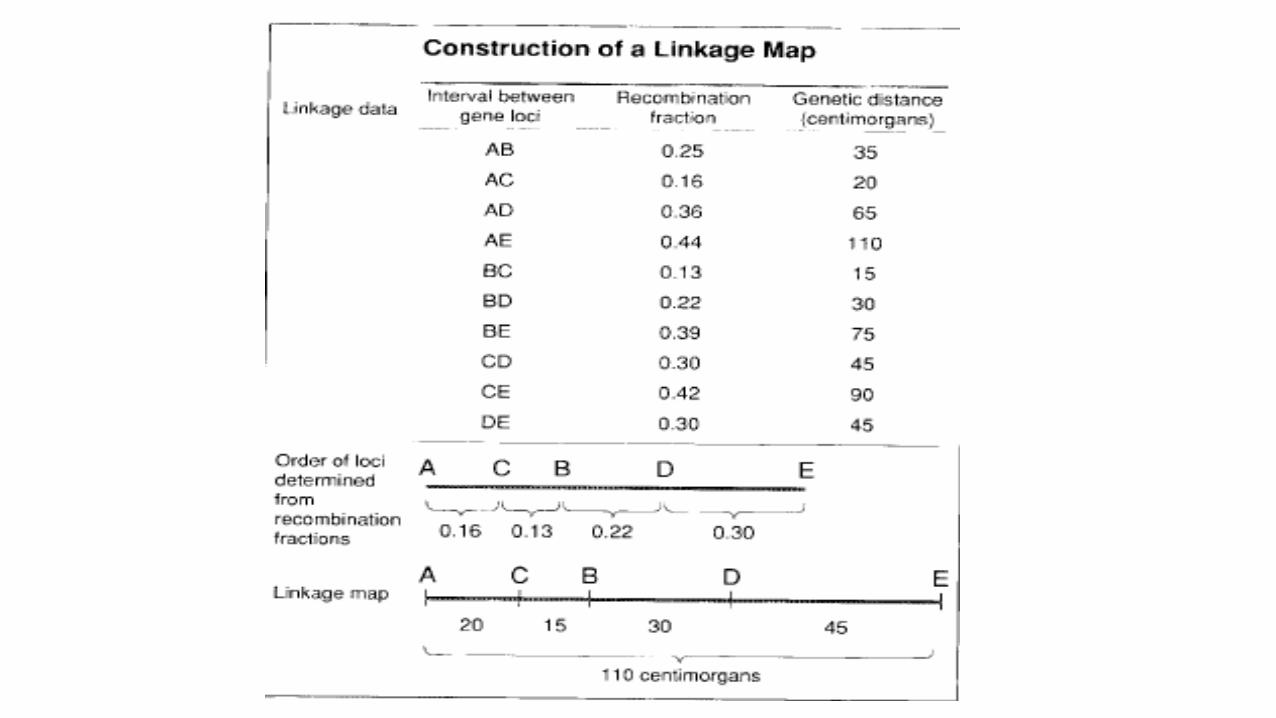
• Recombination fraction is a measure of the distance between two loci.
• Two loci that show 1% recombination are defined as being 1 centimorgan (cM) apart on a genetic map.
• 1 map unit = 1 cM (centimorgan)
• Two genes that undergo independent assortment have recombination frequency of 50 percent and are located on nonhomologous chromosomes or far apart on the same chromosome = unlinked
• Genes with recombination frequencies less than 50 are on the same chromosome = linked

Calculation of Recombination Frequency
The percentage of recombinant progeny produced in a cross is called the recombination frequency, which is calculated as follows:

Recombination Frequency

LOD SCORE
• The LOD score is calculated as follows:
• LOD = Z = Log10 probability of birth sequence with a given linkage/ probability of birth sequence with no linkage
• By convention, a LOD score greater than 3.0 is considered evidence for linkage.
• On the other hand, a LOD score less than -2.0 is considered evidence to exclude linkage.

Mapping function
• The genetic distance between locus A and locus B is defined as the average number of crossovers occurring in the interval AB.
• Mapping function is use to translate recombination fractions into genetic distances.
• In 1919 the British geneticist J, B. S. Haldane proposed such Mapping function Haldane defined the genetic distance, x, between two loci as the average number of crossovers per meiosis in the interval between the two loci.

Haldane’s mapping function
• Assumptions: crossovers occurred at random along the chromosome and that the probability of a crossover at one position along the chromosome was independent of the probability of a crossover at another position.
• Using these assumptions, he derived the following relationship between
• Ø, the recombination fraction and
• x ,the genetic distance (in morgans):
• Ø=1/2(1-e-2x) or equivalently,
• X=-1/2ln(1-2Ø)

• Genetic distance between two loci increases, the recombination fraction approaches a limiting value of 0.5.
• Cytological observations of meiosis indicate that the average number of crossovers undergone by the chromosome pairs of a germ-line cell during meiosis is 33.
• Therefore, the average genetic length of a human chromosome is about 1.4 morgans, or about 140 centimorgans.

LIMITATIONS
• A map generated by genetic techniques is rarely sufficient for directing the sequencing phase of a genome project. This is for two reasons:
• The resolution of a genetic map depends on the number of crossovers that have been scored.
• Genes that are several tens of kb apart may appear at the same position on the genetic map.
• Genetic maps have limited accuracy .
• Presence of recombination hotspots means that crossovers are more likely to occur at some points rather than at others.
• physical mapping techniques has been developed to address this problem.

Thank you