liquid-phase mass-transfer coefficients of mellapak
TRANSCRIPT
Accepted Manuscript
Title: Liquid-phase mass-transfer coefficients of Mellapakstructured packings under desorption of oxygen from primaryalcohols
Authors: F.J. Rejl, J. Haidl, L. Valenz, A. Marchi, T. Moucha,R. Petrıcek, E. Brunazzi
PII: S0263-8762(17)30455-0DOI: http://dx.doi.org/10.1016/j.cherd.2017.09.002Reference: CHERD 2806
To appear in:
Received date: 14-2-2017Revised date: 31-7-2017Accepted date: 1-9-2017
Please cite this article as: Rejl, F.J., Haidl, J., Valenz, L., Marchi, A., Moucha,T., Petrıcek, R., Brunazzi, E., Liquid-phase mass-transfer coefficients of Mellapakstructured packings under desorption of oxygen from primary alcohols.ChemicalEngineering Research and Design http://dx.doi.org/10.1016/j.cherd.2017.09.002
This is a PDF file of an unedited manuscript that has been accepted for publication.As a service to our customers we are providing this early version of the manuscript.The manuscript will undergo copyediting, typesetting, and review of the resulting proofbefore it is published in its final form. Please note that during the production processerrors may be discovered which could affect the content, and all legal disclaimers thatapply to the journal pertain.
Liquid-phase mass-transfer coefficients of Mellapak structured packings under
desorption of oxygen from primary alcohols
F.J. Rejl1,a, J. Haidla, L. Valenza, A. Marchib, T. Mouchaa, R. Petříčeka, E. Brunazzib
a) University of Chemistry and Technology Prague,
Technická 5, 166 28 Praha 6, Czech Republic
Tel.: +420 220 44 3299
corresponding author
e-mail: [email protected]
b) Universita di Pisa
Highlights
Liquid-side mass-transfer coefficient for organic systems on structured packings
Common correlation for alcohols, water and several sizes of packing
Dependence on the flow rate found similar for organic and aqueous systems
Indirect dependence of kL on the square root of the surface tension
Abstract
Volumetric mass-transfer coefficient in the liquid phase, kLa, for Mellapak 250.Y, 350.Y and 500.Y
structured packings has been measured by standard method of desorption of oxygen into nitrogen from
pure methanol, ethanol and n-propanol in the column of i.d. of 150 mm. Although utilization of organic
solvents for absorption experiments provides valuable behavior interlink between properties of aqueous
absorption systems and ordinary (organic) systems under distillation conditions, studies of such kind are
not published in the open literature.
The behavior of the kLa data on alcohol systems do not differ significantly from that found for aqueous
system, the kLa values rise with the liquid superficial powered to ~ 0.5 - 0.78. For one solvent the kLa are
almost identical for all three packings under the same superficial velocity. According to the expectations
the kLa values under the same superficial liquid flow rate are highest for the solvent with the lowest
viscosity and the highest diffusivity of oxygen, methanol, and decrease in the order ethanol, n-propanol
and water.
The kL data for all three packings, alcohols and also for water has been successfully correlated by
dimensionless correlation 𝑆ℎ = 0.207 ∙ 𝑅𝑒0.798𝐹𝑟−0.563𝑊𝑒0.511𝑆𝑐0.528 with mean relative deviation of
12 %.
Keywords: absorption, mass transfer, mass-transfer coefficient, structured packing
1 Introduction
As an important step for more reliable design of packed absorption and distillation columns we see
adoption of the rate-based approach for their modeling. Utilization of the rate-based modeling demands
reliable and accurate knowledge of its parameters, volumetric mass-transfer coefficients. These
coefficients can be predicted from various models which also describe their dependence on the process
conditions. To make sure that these predictions are reliable and the models are generally true, they
should be based or verified against experimental data obtained by standard procedures under as broad
as possible conditions, namely also under distillation ones.
Evaluation of the volumetric mass-transfer coefficients, kLa, kGa, under distillation conditions by the
novel “profile method” [1], [2], [3] provided very reasonable results in terms of gas-phase ones, but
results in dependence of kLa values on liquid flow rate of kLa~uL1, which is steeper than that found
during absorption experiments, where kLa~uL0.62-0.9. The significant difference in the properties of the
distillation mixtures and mostly aqueous systems used for the absorption experiments was suspected as
a possible cause of the difference.
This paper refers on kLa data obtained for Mellapak 250.Y, 350.Y and 500.Y structured packings by
desorption of oxygen into nitrogen from oxygen saturated methanol, ethanol and n-propanol at 20°C.
The alcohols have been chosen as the constituents of the distillation mixtures used for the profile
method experiments. They also differ significantly in viscosity and oxygen diffusivity and therefore cover
broad spectra of the physical properties. Although only Mellapak 250.Y has been used for the mirrored
distillation experiments, usage of the other packings broadens the experimental portfolio by
geometrically similar packings of different size.
2 Literature review
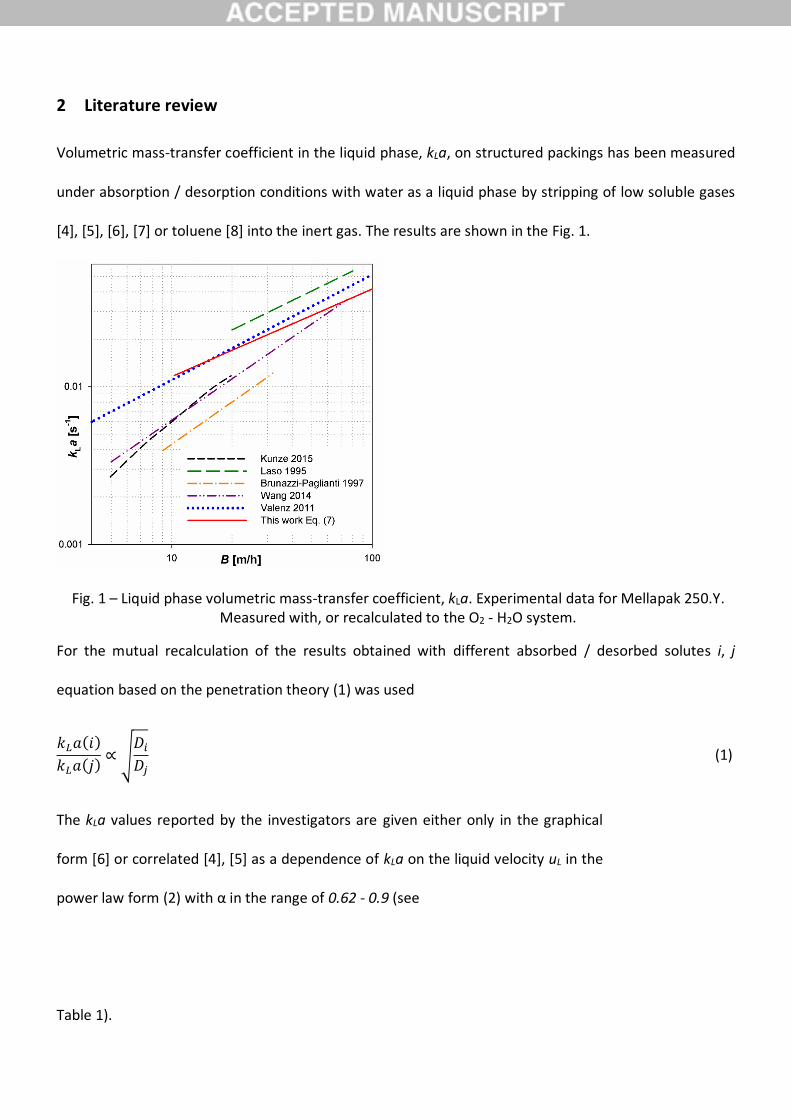
Volumetric mass-transfer coefficient in the liquid phase, kLa, on structured packings has been measured
under absorption / desorption conditions with water as a liquid phase by stripping of low soluble gases
[4], [5], [6], [7] or toluene [8] into the inert gas. The results are shown in the Fig. 1.
Fig. 1 – Liquid phase volumetric mass-transfer coefficient, kLa. Experimental data for Mellapak 250.Y. Measured with, or recalculated to the O2 - H2O system.
For the mutual recalculation of the results obtained with different absorbed / desorbed solutes i, j
equation based on the penetration theory (1) was used
𝑘𝐿𝑎(𝑖)
𝑘𝐿𝑎(𝑗)∝ √
𝐷𝑖
𝐷𝑗 (1)
The kLa values reported by the investigators are given either only in the graphical
form [6] or correlated [4], [5] as a dependence of kLa on the liquid velocity uL in the
power law form (2) with α in the range of 0.62 - 0.9 (see
Table 1).
𝑘𝐿𝑎 ∝ 𝑢𝐿𝐶0 (2)
Table 1: kLa values and their trend with liquid velocity for metal Mellapak 250.Y and
oxygen stripping from water
C0 in the
equation (2)
kLa [1/s] for B = 20 m/h
Laso (1995) oxygen stripping 0.62 0.0229
Brunazzi (1997) CO2 stripping 0.90 0.0080 (bed height = 0.84m)
Valenz (2011) oxygen stripping 0.668 0.0175
Wang (2014) toluene stripping 0.875 0.0114*
* - recalculated to O2-H2O system according to Eq. (1)
Some authors performed kLa measurements using aqueous systems with modified physical properties
[9] or with packings of different geometry [8] what enabled more elaborated dimensional or
dimensionless correlation of the data. While dependence of kLa on the gas velocity up to the loading
point was found negligible [7], significant dependence of the kLa on the total packed bed height has
been reported for random [10] as well as structured [7] packings. Large difference in experimentally
obtained kLa values can be observed and the recent urge for the measurement and evaluation method
standardization [11], [12], [13] is therefore comprehendible.
Many mass-transfer models for packed columns have been developed on the basis of the experimental
data and theoretical considerations; summary of the models developed until 2005 can be found in [14]
and recent actualization on the limited topic of the liquid side mass-transfer coefficient models on
structured packings in [15]. The kLa data calculated out of several models [16], [7], [17], [18], [19], [8] for
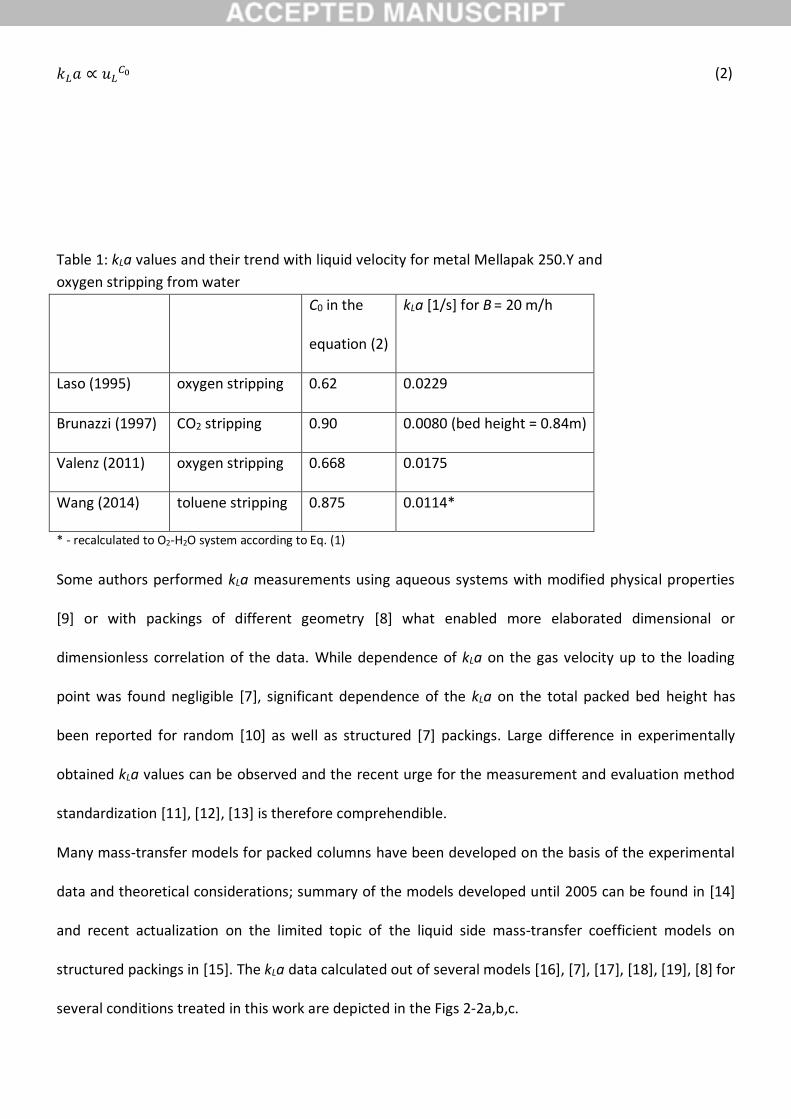
several conditions treated in this work are depicted in the Figs 2-2a,b,c.
Fig. 2 – Liquid phase volumetric mass-transfer coefficient, kLa. Prediction of the literature models. (a) Mellapak 250.Y (H2O-O2). (b) Mellapak 250.Y (MeOH-O2). (c) Mellapak 500.Y (MeOH-O2)
The kLa data predicted by the models for water (Fig. 2a) exhibit similar scatter as the experimental data
(Fig. 1). The scatter increases when non-aqueous system (Fig. 2b) and different packing (Fig. 2c) is
introduced, demonstrating unsatisfactory knowledge of the kL dependence on the physical properties of
the liquid and size of the packing.
The data obtained with the water-inert gas system serve often as an experimental base for development
of mass-transfer models which are usually assumed to be valid also for distillation conditions. However,
water is a substance with high surface tension, far from the properties of the organic systems treated by
distillation. There can be anticipated that the organic liquid phase in distillation experiments behaves
significantly differently in terms of the liquid phase mass-transfer than aqueous systems under the
desorption conditions.
Only few papers report on absorption/desorption from/into organic liquids in any packed device [20],
[21]. Desorption experiments with organic liquid phase have been performed recently at our workplace
using the wetted-wall column [22], however, although the device was often taken as a basis for
development of mass-transfer correlations for structured packings, the effect of the liquid side
hydrodynamics on the liquid-side mass-transfer coefficient is completely different.
There is currently no study dealing with absorption/desorption from/into organic liquids for structured
packings published in the open literature. This article aims to fill this gap.
3 Theoretical background
The data for absorption of different gases into the liquid on the packing has been many times
successfully correlated using penetration theory based on the imagination of unsteady diffusion of the
solute into the liquid behaving like a semi-infinite slab for the period of exposure time τ after which the
liquid is well mixed. The corresponding mass-transfer coefficient, kL, is obtained through time averaging
of the molar flux as
𝑘𝐿 = √4𝐷
𝜋𝜏 (3)
As can be seen, the penetration theory doesn’t directly describe either the influence of the liquid flow
rate or the physical properties of the liquid on the mass-transfer rate. Their possible effect can be
anticipated to be hidden in the value of the exposure time which can be assumed to be dependent on
the liquid film hydrodynamics. The lack of prediction tools for determination of the exposure time on
the basis of viscosity and surface tension can be attributed to relatively low number of experiments
performed with different solvents.
Forces acting on the liquid film flowing down the column on the packing and forming its velocity profile
and thickness are the inertial, gravitational, viscous and surface ones. The hydrodynamics of the film is
therefore described by the values of Reynolds, Froude and Weber numbers, Re, Fr, We. The relation of
the hydrodynamics to the mass-transfer is usually expressed by introduction of the Sherwood a Schmidt
numbers, Sh, Sc. The final correlation can take dimensionless form
𝑆ℎ = 𝐶1𝑅𝑒𝐶2𝐹𝑟𝐶3𝑊𝑒𝐶4𝑆𝑐𝐶5 (4)
4 Experimental
Experimental set-up
Experiments have been carried out in the PVC-U column with of an i.d. of 150 mm (see Fig. 3). The
packing was stainless steel Mellapak 250.Y, 350.Y and 500.Y with height of the element equal 0.21 m
provided by Sulzer in the year 2000 and equipped with plain sheet extra wall-wipers designed at the
workplace (see Fig. 4)1. The liquid phase flowing in the closed circuit has been pumped from the main
tank into the column by centrifugial pump P1 through the set of turbine flowmeters F1, F2 and
distributed over the packing by pipe-type distributor with 25 openings (1415 openings/m2). The liquid
flowing from the packing has been collected in the liquid collector / chimney gas-distributor and flew
back to the main tank by means of gravity. The nitrogen from the cylinder has been fed under the gas-
distributor. Its flow was controlled by control valves.
When tap water was the liquid phase, the batch of 300-400 l was maintained at constant temperature of
20 °C and saturated with oxygen in the agitated 500 l stainless steel tank H1.
In the case of alcohols the main storage tank was a 30 l PVC-U vessel H2 submerged in the H1 tank filled
with water. The water served as a supportive heat transfer medium and also as a safety measure for the
case of a major leak from the vessel. The alcohols used were of p.a. grade. The vessel was also
connected to the saturation loop made of i.d. 25mm glass tube with a total length of about 3 m in which
the liquid was cooled down and saturated with oxygen. The flow of the liquid was driven by centrifugal
1 The extra wall-wipers were made from the 0.1 mm thick stainless steel band with the total height of 40 mm. The lower half was cut to form downward pointing triangles. The tips of the triangles were manually bended into the packing element. The extra wall-wipers were placed just under the lower original ones.
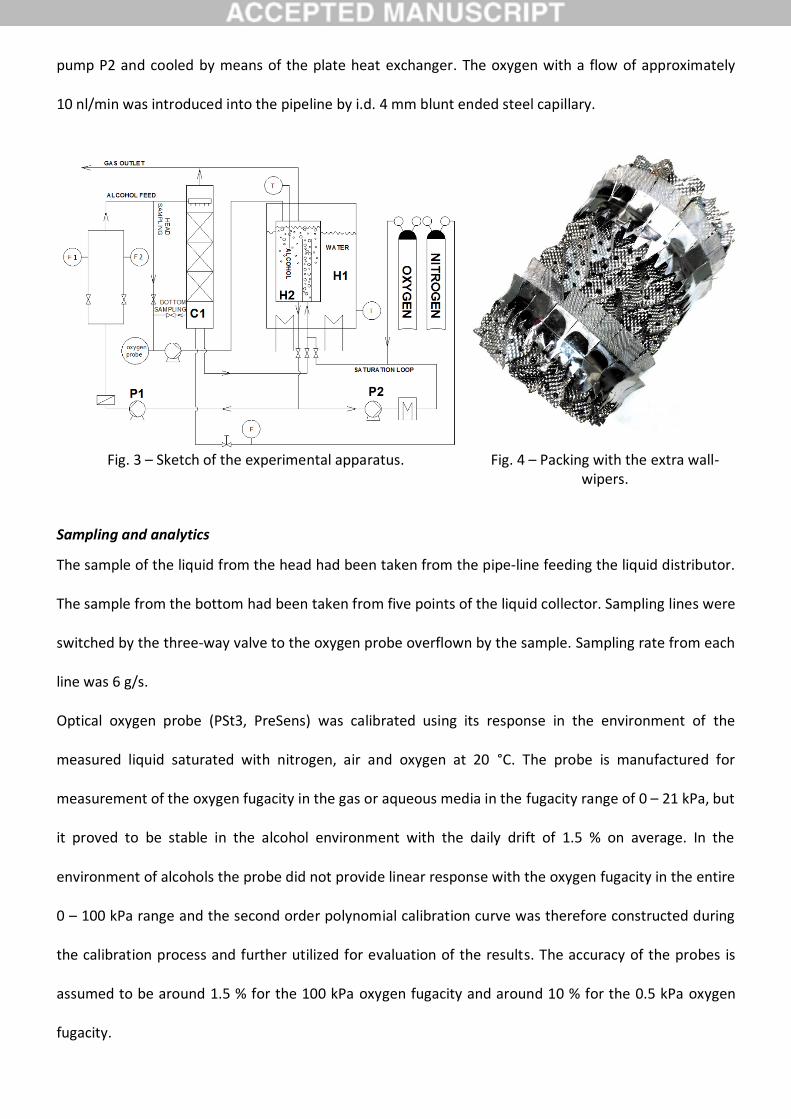
pump P2 and cooled by means of the plate heat exchanger. The oxygen with a flow of approximately
10 nl/min was introduced into the pipeline by i.d. 4 mm blunt ended steel capillary.
Fig. 3 – Sketch of the experimental apparatus. Fig. 4 – Packing with the extra wall-wipers.
Sampling and analytics
The sample of the liquid from the head had been taken from the pipe-line feeding the liquid distributor.
The sample from the bottom had been taken from five points of the liquid collector. Sampling lines were
switched by the three-way valve to the oxygen probe overflown by the sample. Sampling rate from each
line was 6 g/s.
Optical oxygen probe (PSt3, PreSens) was calibrated using its response in the environment of the
measured liquid saturated with nitrogen, air and oxygen at 20 °C. The probe is manufactured for
measurement of the oxygen fugacity in the gas or aqueous media in the fugacity range of 0 – 21 kPa, but
it proved to be stable in the alcohol environment with the daily drift of 1.5 % on average. In the
environment of alcohols the probe did not provide linear response with the oxygen fugacity in the entire
0 – 100 kPa range and the second order polynomial calibration curve was therefore constructed during
the calibration process and further utilized for evaluation of the results. The accuracy of the probes is
assumed to be around 1.5 % for the 100 kPa oxygen fugacity and around 10 % for the 0.5 kPa oxygen
fugacity.
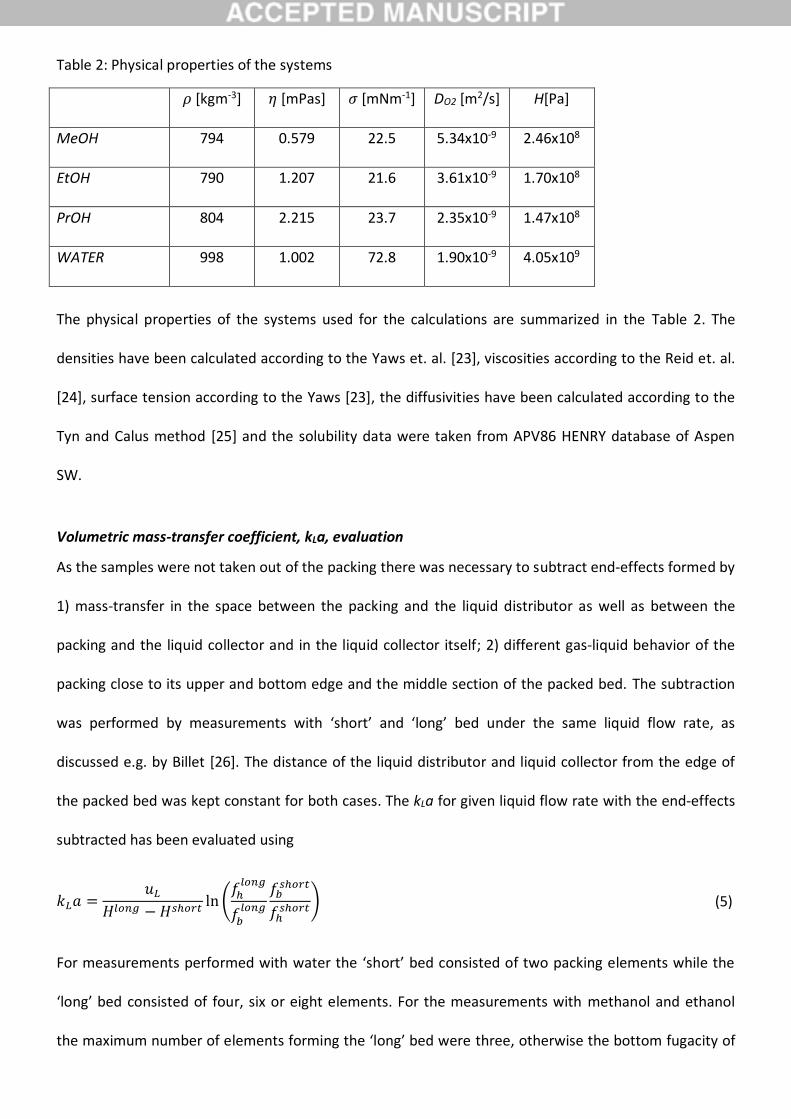
Table 2: Physical properties of the systems
𝜌 [kgm-3] 𝜂 [mPas] 𝜎 [mNm-1] DO2 [m2/s] H[Pa]
MeOH 794 0.579 22.5 5.34x10⁻⁹ 2.46x10⁸
EtOH 790 1.207 21.6 3.61x10⁻⁹ 1.70x10⁸
PrOH 804 2.215 23.7 2.35x10⁻⁹ 1.47x10⁸
WATER 998 1.002 72.8 1.90x10⁻⁹ 4.05x10⁹
The physical properties of the systems used for the calculations are summarized in the Table 2. The
densities have been calculated according to the Yaws et. al. [23], viscosities according to the Reid et. al.
[24], surface tension according to the Yaws [23], the diffusivities have been calculated according to the
Tyn and Calus method [25] and the solubility data were taken from APV86 HENRY database of Aspen
SW.
Volumetric mass-transfer coefficient, kLa, evaluation
As the samples were not taken out of the packing there was necessary to subtract end-effects formed by
1) mass-transfer in the space between the packing and the liquid distributor as well as between the
packing and the liquid collector and in the liquid collector itself; 2) different gas-liquid behavior of the
packing close to its upper and bottom edge and the middle section of the packed bed. The subtraction
was performed by measurements with ‘short’ and ‘long’ bed under the same liquid flow rate, as
discussed e.g. by Billet [26]. The distance of the liquid distributor and liquid collector from the edge of
the packed bed was kept constant for both cases. The kLa for given liquid flow rate with the end-effects
subtracted has been evaluated using
𝑘𝐿𝑎 =𝑢𝐿
𝐻𝑙𝑜𝑛𝑔 −𝐻𝑠ℎ𝑜𝑟𝑡ln (
𝑓ℎ𝑙𝑜𝑛𝑔
𝑓𝑏𝑙𝑜𝑛𝑔
𝑓𝑏𝑠ℎ𝑜𝑟𝑡
𝑓ℎ𝑠ℎ𝑜𝑟𝑡) (5)
For measurements performed with water the ‘short’ bed consisted of two packing elements while the
‘long’ bed consisted of four, six or eight elements. For the measurements with methanol and ethanol
the maximum number of elements forming the ‘long’ bed were three, otherwise the bottom fugacity of
oxygen in the liquid was below that the probe was able to determine with reasonable accuracy. For
measurements with all three alcohols the ‘short bed’ therefore consisted of only a single element (H =
0.21 m) in order to keep possibility to check agreement of the results obtained with at least two heights
of the ‘long’ bed (two elements: H = 0.42 m, three elements: H = 0.63 m) and to keep procedure for all
alcohols constant. The kLa data evaluated from the measurements with the ‘long’ bed consisting of two
elements (together with the data measured with single element ‘short’ bed) are further denoted as “2-
1” while the data evaluated from the measurements with three elements ‘long’ bed (together with the
data measured with single element ‘short’ bed) are denoted “3-1”. Intense mass-transfer in the liquid
collector and mass transfer in subtracted part of the packing was also found sufficient for saturation of
the nitrogen with alcohol vapors.
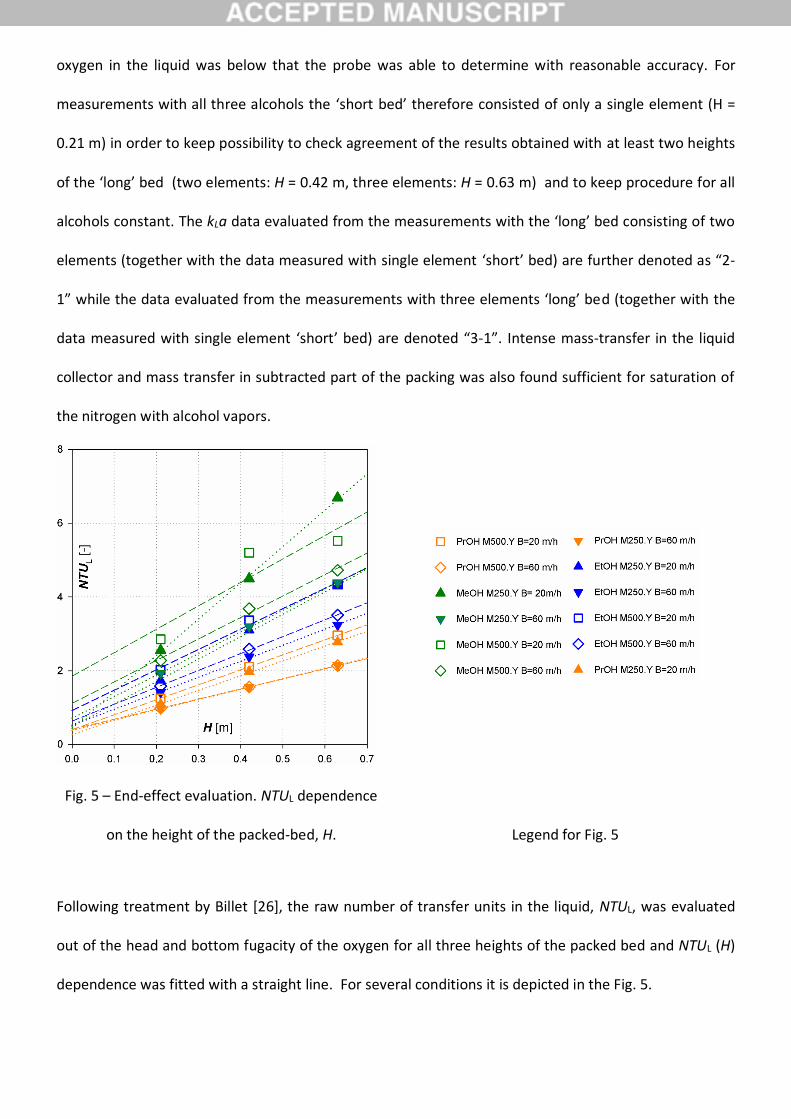
Fig. 5 – End-effect evaluation. NTUL dependence
on the height of the packed-bed, H. Legend for Fig. 5
Following treatment by Billet [26], the raw number of transfer units in the liquid, NTUL, was evaluated
out of the head and bottom fugacity of the oxygen for all three heights of the packed bed and NTUL (H)
dependence was fitted with a straight line. For several conditions it is depicted in the Fig. 5.
𝑁𝑇𝑈L = ln𝑓ℎ𝑓𝑏
Eq. (6)
With exception of the outlying data for Mellapak 500.Y and B=60 m/h one can observe that 1) the
dependences NTUL (H) is linear; 2) these dependences intercept the vertical axis in the limited range
(around value of NTUL = 1).
This suggests that 1) all the external and internal end-effects affecting the measurements with ‘long’
bed configuration are completely developed already for the ‘short’ bed, and can be therefore subtracted
according to (5); 2) the end-effects are of similar magnitude for all conditions.
5 Results
The PVC-U i.d. 150 mm column was a new experimental set-up and therefore the measurement method
has been first thoroughly verified by the experiments with water on Mellapak 250.Y packing. A
significant dependence of the obtained kLa on the packed bed height as well as noticeable wall flow
have been observed. Both phenomena have been suppressed by installation of additional plain sheet
wall wiper on each packing element – after its installation the dependence of kLa on the height of the
packed bed almost vanished and kLa values nearly matched those found for the i.d. 300 mm column (Fig.
6a).
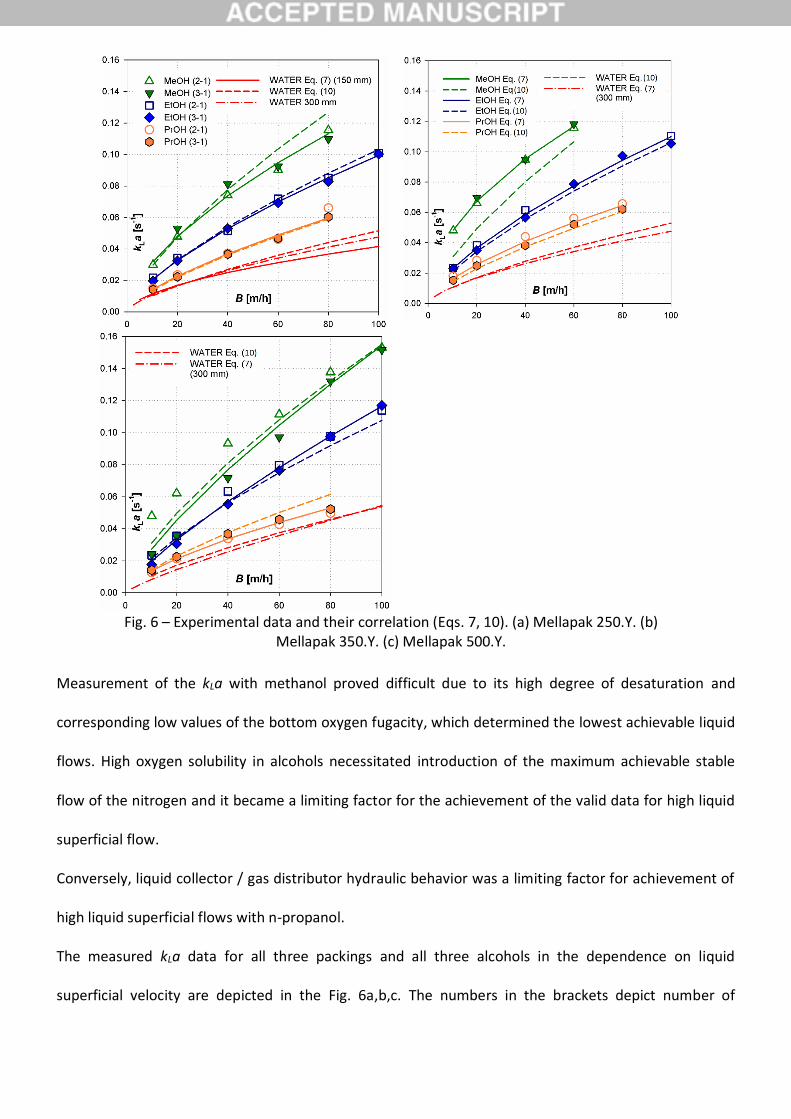
Fig. 6 – Experimental data and their correlation (Eqs. 7, 10). (a) Mellapak 250.Y. (b) Mellapak 350.Y. (c) Mellapak 500.Y.
Measurement of the kLa with methanol proved difficult due to its high degree of desaturation and
corresponding low values of the bottom oxygen fugacity, which determined the lowest achievable liquid
flows. High oxygen solubility in alcohols necessitated introduction of the maximum achievable stable
flow of the nitrogen and it became a limiting factor for the achievement of the valid data for high liquid
superficial flow.
Conversely, liquid collector / gas distributor hydraulic behavior was a limiting factor for achievement of
high liquid superficial flows with n-propanol.
The measured kLa data for all three packings and all three alcohols in the dependence on liquid
superficial velocity are depicted in the Fig. 6a,b,c. The numbers in the brackets depict number of

elements for ‘long’ and ‘short’ bed. Out of the 97 obtained experimental kLa values 5 were discarded as
outlaying. The data have been correlated with average R.S.D. of 8% by the equation
𝑘𝐿𝑎 = 𝐶1𝐵𝐶2 (7)
with optimized constants provided in the Table 3.
Table 3: Constants of the Eq. (7)
Mellapak 250.Y Mellapak 350.Y Mellapak 500.Y
C1 C2 C1 C2 C1 C2
MeOH 0.00754 0.618 0.00151 0.499 0.00463 0.761
EtOH 0.00416 0.689 0.00472 0.684 0.00319 0.781
PrOH 0.00286 0.693 0.00355 0.662 0.00298 0.656
WATER 0.00320 0.557 0.00243 0.720 0.00124 0.821
The kLa values measured for “2-1” and “3-1” configurations are almost identical for the most
experimental conditions, proving successful subtraction of the end-effects. The behavior also suggest
sufficient stripping gas saturation with alcohol vapors before entering the measurement section and
maintenance of the sufficiently low oxygen concentration in the stripping gas in the frame of the bed.
Only exception are the data for the methanol and Mellapak 500.Y packing (Fig. 6c).
The kLa values for the same liquid superficial velocity and the same alcohol do not increase
systematically with packing geometrical area. Such behavior has been observed for water [5] as well.
Assuming increasing effective interfacial area with the geometrical one this finding implies decreasing
values of the mass-transfer coefficient, kL. This in turn can be explained by decreasing liquid interstitial
velocity on the individual packing sheet as the same liquid flow needs to be distributed on the higher
number of sheets for the packing with higher geometrical area.
Mass-transfer coefficient, kL, evaluation
The data processing consisted of extraction of the mass-transfer coefficient kL from kLa data
𝑘𝐿 =𝑘𝐿𝑎
𝑎𝐶𝐻 (8)
The effective area for the conditions of kLa measurement (physical absorption) is not known and its
closest experimentally achievable approximation was assumed to be the effective area, aCH, obtained for
the same packing types by the chemisorption of CO2 into aqueous solution of sodium hydroxide [5]. The
values were calculated according to (9) with constants from the Table 2, the data are graphically
presented in the Fig. 7.
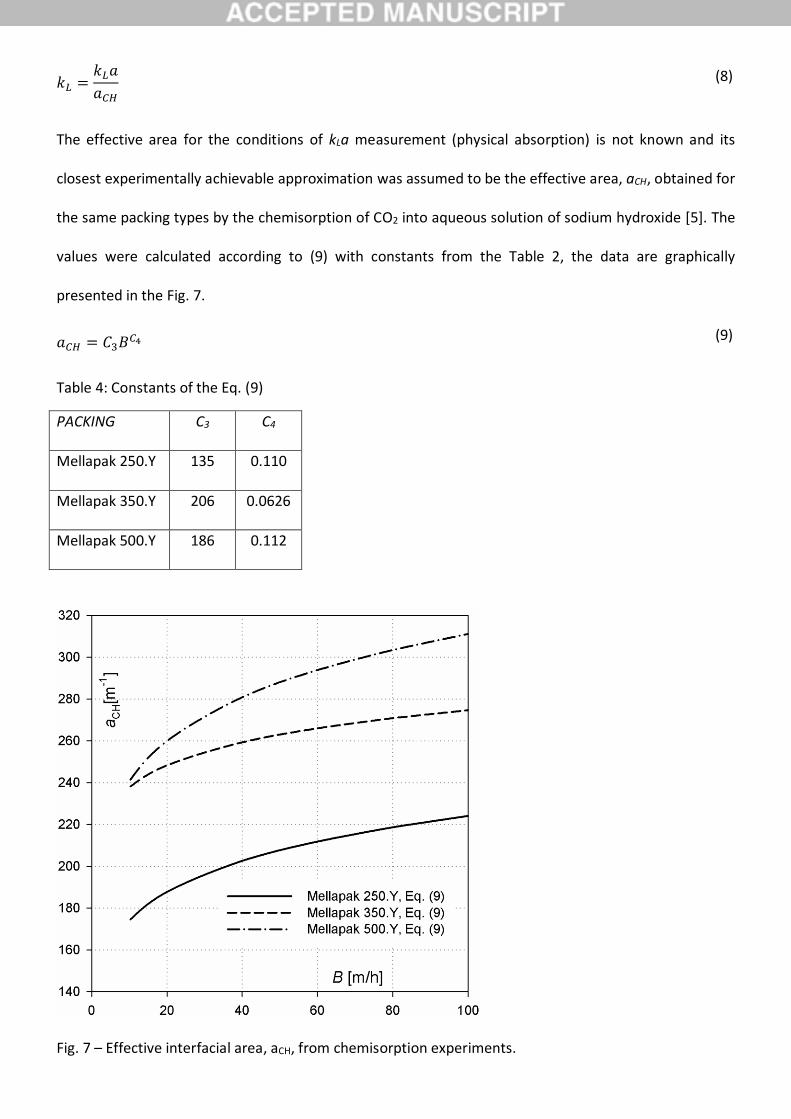
𝑎𝐶𝐻 = 𝐶3𝐵𝐶4 (9)
Table 4: Constants of the Eq. (9)
PACKING C3 C4
Mellapak 250.Y 135 0.110
Mellapak 350.Y 206 0.0626
Mellapak 500.Y 186 0.112
Fig. 7 – Effective interfacial area, aCH, from chemisorption experiments.
Usage of chemisorption area, aCH, for extraction of the kL from kLa data mostly proved to provide better
match of developed correlations to the experimental data than usage of geometrical area, aG.
Mass-transfer coefficient, kL, dimensionless correlation
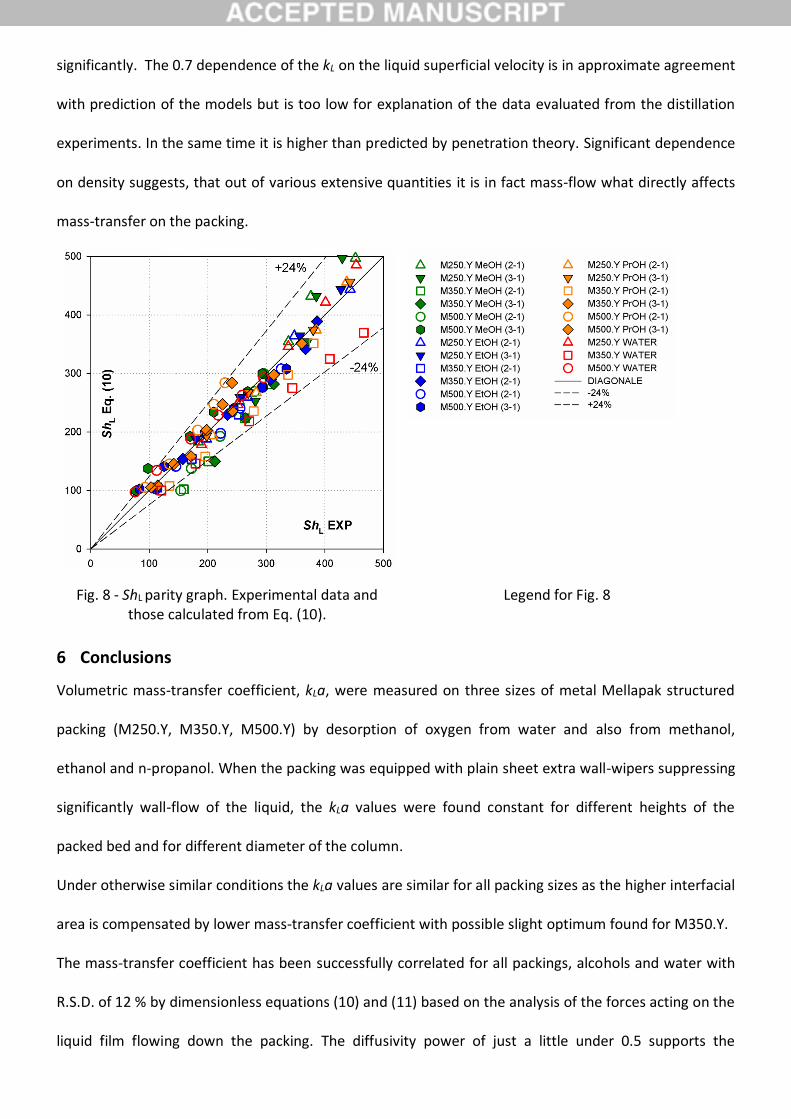
The kL data for all alcohols, water and for all packings have been correlated in the dimensionless form
𝑆ℎ𝐿 = 0.207 ∙ 𝑅𝑒0.798𝐹𝑟−0.563𝑊𝑒0.511𝑆𝑐0.528 (10)
with R.S.D. of 12.1%, its success in data fit is shown in the Fig. 8. The similar absolute value of the
powers at Froude and Weber numbers suggests that the effect of the inertia forces connected with
these numbers cancels and the numbers can be combined into the Eötvös (Bond) number. After the
optimization the correlation results in
𝑆ℎ𝐿 = 0.586 ∙ 𝑅𝑒0.695𝐸𝑜0.505𝑆𝑐0.468 (11)
with only minor increase in R.S.D. to the value of 12.6%.
The dependence of kL on individual physical quantities as predicted by the Eq. (10) in the form of simple
power-law dependence
𝑘𝐿 ∝ 𝑞𝑢𝑎𝑛𝑡𝑖𝑡𝑦𝑝𝑜𝑤𝑒𝑟 (12)
is shown in the Table 5.
Table 5: Dependence of kL on physical quantities according to the Eq. (10).
Quantity uL 𝜌 a 𝜂 g 𝜎 D
Power 0.694 0.781 -0.872 -0.27 0.563 -0.511 0.472
The correlation Eq. (10) predicts dependence of the mass-transfer coefficient on the diffusivity with
power of 0.472 and 0.538, respectively, close to the prediction of the penetration theory (which predicts
0.5). The correlation predicts the same magnitude but opposite effect of the gravity acceleration and
the surface tension and relatively small effect of the viscosity. An increase in the packing area has
significant negative effect on the value of the mass-transfer coefficient. This corresponds with the fact
that the kLa values for the packings of different sizes (i.e. of geometrical areas) do not change
significantly. The 0.7 dependence of the kL on the liquid superficial velocity is in approximate agreement
with prediction of the models but is too low for explanation of the data evaluated from the distillation
experiments. In the same time it is higher than predicted by penetration theory. Significant dependence
on density suggests, that out of various extensive quantities it is in fact mass-flow what directly affects
mass-transfer on the packing.
Fig. 8 - ShL parity graph. Experimental data and those calculated from Eq. (10).
Legend for Fig. 8
6 Conclusions
Volumetric mass-transfer coefficient, kLa, were measured on three sizes of metal Mellapak structured
packing (M250.Y, M350.Y, M500.Y) by desorption of oxygen from water and also from methanol,
ethanol and n-propanol. When the packing was equipped with plain sheet extra wall-wipers suppressing
significantly wall-flow of the liquid, the kLa values were found constant for different heights of the
packed bed and for different diameter of the column.
Under otherwise similar conditions the kLa values are similar for all packing sizes as the higher interfacial
area is compensated by lower mass-transfer coefficient with possible slight optimum found for M350.Y.
The mass-transfer coefficient has been successfully correlated for all packings, alcohols and water with
R.S.D. of 12 % by dimensionless equations (10) and (11) based on the analysis of the forces acting on the
liquid film flowing down the packing. The diffusivity power of just a little under 0.5 supports the
penetration theory model for mass-transfer description. The inertial and gravitational forces were found
supportive for the mass transfer while the viscous and surface forces were found to be suppressive for
the process. On the basis of the correlations the kL values rise approximately with 0.7 power of the
liquid load. The 0.7 power dependence of the kL on the liquid superficial velocity is close to the
prediction of many mass-transfer models but doesn’t bring any new clue for explanation for the kLa
behavior evaluated from the distillation experiments.
7 Acknowledgement:
Authors are grateful to the Czech Science Foundation for supporting the project through Grant 13-
01251S and to the financial support from specific university research (MSMT No 20/2016).
Workplace is grateful to Sulzer Ltd. for providing of packing samples.
8 List of symbols
a interfacial area of the packing, (m2/m3)
aG geometrical area of the packing, (m2/m3)
aCH effective area measured by chemisorption experiments, (m2/m3)
B liquid superficial velocity, (m/h)
Ci multiplication constant or power of a quantity
c molar concentration of a solute in the liquid, (mol/m3)
D Diffusivity, (m2/s)
f fugacity of the oxygen in the liquid, (Pa)
g gravity acceleration, g = 9.81 m/s2
H height of the packed bed, (m)
H Henry constant, (Pa)
kL liquid phase mass-transfer coefficient, (m/s)
kGa volumetric gas phase mass-transfer coefficient, (1/s)
NTUL number of transfer units in liquid, 𝑁𝑇𝑈L = ln𝑓ℎ
𝑓𝑏

kLa volumetric liquid phase mass-transfer coefficient, (1/s)
uL liquid superficial veloctity, (m/s)
Greek symbols
α power of a quantity
ν kinematic viscosity, (m2/s)
𝜂 dynamic viscosity, (Pa·s)
ρ density, (kg/m3)
σ surface tension, (N/m)
τ exposure time, (s)
Subscripts
b bottom
h head
s superficial
i interstitial
i,j individual solutes
Superscripts
long long bed
short short bed
Dimensionless numbers
𝐸𝑜 =𝜌𝑔
𝑎𝐶𝐻2𝜎
liquid phase Eötvös (Bond) number
𝐹𝑟 =𝑢𝐿2𝑎𝐶𝐻𝑔
liquid phase Froude number
𝑅𝑒 =𝑢𝐿𝜌
𝜂𝑎𝐶𝐻 liquid phase Reynolds number
𝑆𝑐 =𝜈
𝐷 liquid phase Schmidt number
𝑆ℎ =𝑘𝐿
𝐷𝑎𝐶𝐻 liquid phase Sherwood number
𝑊𝑒 =𝜌𝑢𝐿
2
𝑎𝐶𝐻𝜎 liquid phase Weber number
Abbreviations
i.d. inner diameter
M250.Y Mellapak 250.Y
M350.Y Mellapak 350.Y
M500.Y Mellapak 500.Y
EtOH ethanol
MeOH methanol
PrOH n-propanol
R.S.D relative standard deviation
References
[1] V. Linek, T. Moucha, E. Prokopová, J.F. Rejl, Simultaneous Determination of Vapour- and Liquid-Side Volumetric Mass Transfer Coefficients in Distillation Column, Chem. Eng. Res. Des. 83 (2005) 979–986. doi:10.1205/cherd.03311.
[2] J.F. Rejl, V. Linek, T. Moucha, E. Prokopová, L. Valenz, F. Hovorka, Vapour- and liquid-side volumetric mass transfer coefficients measured in distillation column. Comparison with data calculated from absorption correlations, Chem. Eng. Sci. 61 (2006) 6096–6108. doi:10.1016/j.ces.2006.06.003.
[3] F.J. Rejl, L. Valenz, V. Linek, “Profile Method” for the Measurement of kLa and kVa in Distillation Columns. Validation of Rate-Based Distillation Models Using Concentration Profiles Measured along the Column, Ind. Eng. Chem. Res. 49 (2010) 4383–4398. doi:10.1021/ie901690m.
[4] M. Laso, M.H. Debrito, P. Bomio, U. Vonstockar, Liquid-Side Mass-Transfer Characteristics of a Structured Packing, Chem. Eng. J. Biochem. Eng. J. 58 (1995) 251–258.
[5] L. Valenz, F.J. Rejl, J. Šíma, V. Linek, Absorption mass-transfer characteristics of mellapak packings series, Ind. Eng. Chem. Res. 50 (2011) 12134–12142. doi:10.1021/ie200577k.
[6] A.-K. Kunze, P. Lutze, M. Kopatschek, J.F. Maćkowiak, J. Maćkowiak, M. Grünewald, A. Górak, Mass transfer measurements in absorption and desorption: Determination of mass transfer parameters, Chem. Eng. Res. Des. 1 (2015) 440–452. doi:10.1016/j.cherd.2015.08.025.
[7] E. Brunazzi, and Alessandro Paglianti*, A. Paglianti, Liquid-Film Mass-Transfer Coefficient in a
Column Equipped with Structured Packings, Ind. Eng. Chem. Res. 36 (1997) 3792–3799. doi:10.1021/ie970045h.
[8] C. Wang, M. Perry, F. Seibert, G. Rochelle, Packing characterization for post combustion CO2 capture: Mass transfer model development, Energy Procedia. 63 (2014) 1727–1744. doi:10.1016/j.egypro.2014.11.180.
[9] R.J. Mangers, A.B. Ponter, Effect of Viscosity on Liquid Film Resistance to Mass Transfer in a Packed Column, Ind. Eng. Chem. Process Des. Dev. 19 (1980) 530–537.
[10] R.J. Mangers, A.B. Ponter, Liquid-Phase Resistance to Mass Transfer in a Laboratory Absorption Column Packed with Glass and Polytetrafluoroethylene Rings Part I . The Effects of Flowrate Sequence , Repacking , Packing Depth and Initial Liquid Distribution The experimental apparatus, 19 (1980) 139–146.
[11] a. Hoffmann, J.F. Maćkowiak, a. Górak, M. Haas, J.-M. Löning, T. Runowski, K. Hallenberger, Standardization of Mass Transfer Measurements, Chem. Eng. Res. Des. 85 (2007) 40–49. doi:10.1205/cherd06134.
[12] J.F. Rejl, V. Linek, T. Moucha, L. Valenz, Methods standardization in the measurement of mass-transfer characteristics in packed absorption columns, Chem. Eng. Res. Des. 87 (2009) 695–704. doi:10.1016/j.cherd.2008.09.009.
[13] A.K. Kunze, P. Lutze, H. Schoenmakers, S. Müller, M. Kopatschek, J. MaćOwiak, J. MaćOwiak, A. Górak, M. Grünewald, Die notwendigkeit einer standardisierung von stofftransportmessungen in der Ab- und desorption, Chemie-Ingenieur-Technik. 84 (2012) 1931–1938. doi:10.1002/cite.201200045.
[14] G.Q. Wang, X.G. Yuan, K.T. Tu, Review of mass-transfer correlation for packed columns, Ind. Eng. Chem. Res. 44 (2005) 8715–8729.
[15] Ž. Olujić, a. F. Seibert, Predicting the Liquid Phase Mass Transfer Resistance of Structured Packings, Chem. Biochem. Eng. Q. 28 (2014) 409–424. doi:10.15255/CABEQ.2014.1934.
[16] J.A. Rocha, J.L. Bravo, J.R. Fair, Distillation-Columns Containing Structured Packings - a Comprehensive Model for Their Performance. 2. Mass-Transfer ModelModels, Ind. Eng. Chem. Res. 35 (1996) 1660–1667.
[17] Ž.. Olujić, M.. Behrens, L.. Colli, A.. Paglianti, Predicting the Efficiency of Corrugated Sheet Structured Packings with Large Specific Surface Area, Chem. Biochem. Eng. Q. 18 (2004) 89–96. doi:10.15255/CABEQ.2014.19344.
[18] Ž. Olujić, T. Rietfort, H. Jansen, B. Kaibel, E. Zich, G. Frey, G. Ruffert, T. Zielke, Experimental Characterization and Modeling of High Performance Structured Packings †, (2012).
[19] B. Hanley, C.-C. Chen, New Mass-Transfer Correlations for Packed Towers, AIChE J. 58 (2012) 132–152.
[20] K. ONDA, H. TAKEUCHI, Y. OKUMOTO, Mass Transfer Coefficients Between Gas and Liquid Phases in Packed Columns, J. Chem. Eng. Japan. 1 (1968) 56–62. doi:10.1252/jcej.1.56.
[21] F. Yoshida, T. Koyanagi, Liquid phase mass transfer rates and effective interfacial area in packed absorption columns, Ind. Eng. Chem. 50 (1958) 365–374. http://pubs.acs.org/doi/abs/10.1021/ie50579a038.
[22] J. Haidl, F.J. Rejl, L. Valenz, M. Kordač, T. Moucha, L. Labík, M. Schultes, Absorption in wetted-wall column with phase properties close to distillation conditions, Chem. Eng. Sci. 144 (2016) 126–134. doi:10.1016/j.ces.2015.12.027.
[23] C.L. Yaws, Chem. Eng. (1976). [24] R.C. Reid, J.M. Prausnitz, B.E. Poling, The Properties of Gases and Liquids, 4th ed., MacGraw Hill,
New York, 1987. [25] M.T. Tyn, W.F. Calus, Diffusion coefficients in dilute binary liquid mixtures, J. Chem. Eng. Data. 20
(1975) 106–109. doi:10.1021/je60064a006. [26] R. Billet, Packed Towers in Processing and Enviromental Technology, VCH Verlagsgesellshaft mbH,
Weinheim, VCH Publishers, Inc., Weinheim, New York, 1995.
