lithogeochemical and stratigraphic controls on gold ... · hydrothermal evolution of the hoyle pond...
TRANSCRIPT

0361-0128/08/3776/1341-23 1341
IntroductionTHE HOYLE POND mine is located 15 km east of downtownTimmins and 3 km north of the Pamour mine in the Porcu-pine gold camp of the Archean Abitibi subprovince of the Su-perior province, northern Ontario (Fig. 1). The discovery holewas drilled by Texas Gulf in 1980, and the mine has been inconstant production since 1985. The mineralization is associ-ated with fault-fill and extensional quartz-carbonate veinsalong second-order shear zones and faults spatially related tothe Porcupine-Destor deformation zone. It is hosted by ul-tramafic and mafic metavolcanic rocks of the Tisdale assem-blage (2710–2704 Ma: Ayer et al., 2005), which is subdividedin the mine into three volcanic packages, namely, the north,the central and the south volcanic packages (NVP, CVP and
SVP, respectively; Fig. 2). Prior to 1994, most of the ore wasmined from the Hoyle Pond zone (13–14 and 16 veins) inmafic rocks of the north volcanic package. Subsequently, in1994, with the discovery of the 1060 zone, the A-vein zone,and the 7-veins zone, the main focus of production switchedto the south volcanic package. Currently, production comespredominantly from the A vein and the 1060 fault zone,which extend vertically to depths of greater than 1,000 m.
This paper describes the geology (stratigraphy, structuralgeology, alteration, and mineralization) of the Hoyle Pond de-posit and identifies critical host-rock chemical and physicalfactors that contributed to the localization of gold mineraliza-tion. The geology of the Hoyle Pond deposit is compared toother deposits in the Timmins Porcupine camp, and these re-sults are integrated into a model describing the structural andhydrothermal evolution of the Hoyle Pond mine.
Lithogeochemical and Stratigraphic Controls on Gold Mineralization within theMetavolcanic Rocks of the Hoyle Pond Mine, Timmins, Ontario
ETIENNE DINEL,† ANTHONY D. FOWLER,Department of Earth Sciences, University of Ottawa, 140 Louis Pasteur St., Ottawa, Canada K1N 6N5,
and Ottawa Carleton Geoscience Centre
JOHN AYER, Ontario Geological Survey, Precambrian Science Division, 933 Ramsey Lake Rd, Sudbury, Ontario, Canada P3E 6B5
ALASTAIR STILL, KEN TYLEE, AND ERIK BARR
Porcupine Joint Venture, Hoyle Pond Mine, 1 Gold Mine Road, P.O. Box 70, Timmins, Ontario, Canada P0N 1G0
AbstractThe Hoyle Pond gold deposit is hosted in complexly deformed mafic-ultramafic volcanic rocks of the Hersey
Lake and Central Formations (Tisdale assemblage) in the Porcupine gold camp, located approximately 15 kmnortheast of Timmins in the Abitibi greenstone belt. The deposit is hosted within a homoclinal sequence ofsouth-facing stacked volcanic flows of high Mg tholeiitic basalt, basaltic komatiite and komatiite flows, and in-terbedded high Mg tholeiitic basalt and Fe-rich tholeiitic basalts. The bulk of the gold mineralization was em-placed at lithologic contacts along late shear zones associated with isoclinal folding and thrusting. The miner-alization is characterized by micron- to centimeter-sized flakes of free gold or veinlets in quartz-carbonate(dolomite and ferroan dolomite) shear and extension vein arrays. At the mine scale a broad carbonate alterationis evident. Two alteration zones surrounding the veins were mapped at the meter scale: an inner sericite alter-ation zone composed of sericite (muscovite), fuchsite (Cr muscovite), quartz, arsenopyrite, pyrite, ferroan-dolomite, dolomite, and graphite plus tourmaline, and an outer zone of albite alteration consisting of albite,quartz, ferroan dolomite, and dolomite.
Geochemical analyses of 355 samples show that the REE, Zr, Al2O3, TiO2, and Y were largely immobile dur-ing alteration and mineralization. CO2, K2O, Na2O, Cr2O3, Rb, As, B, SiO2, and CaO, and locally Fe2O3, FeO,and MgO, were mobile during alteration and mineralization. The chromium enrichment is not primary and isinterpreted to have been caused by remobilization from ultramafic rocks during mineralization. In addition, anintense graphite alteration, originally derived from organic matter, probably from sedimentary rocks, and nowassociated with mineralization, is present in zones that were porous and permeable at the time of mineraliza-tion. In common with other mesozonal orogenic gold deposits, gold was likely transported as a thio complex.The Cr enrichment in the wall rock indicates that Cr was mobile, most likely as Cr6+. Because species such asCr6+ are transported under oxidizing conditions and carbon and Au-HS species are transported under reducedconditions, we suggest that more than one fluid was involved in the mineralization and/or alteration. Mixingbetween reducing and oxidizing fluids is thought to have reduced Cr6+ to Cr3+, oxidized the organic matter toform graphite, oxidized sulfur to form sulfides, and precipitated Au. This is consistent with the observed para-genesis. Reducing fluids rich in boron, arsenic, carbon, and Au may have been generated from sedimentaryrocks (Porcupine assemblage?) at depth and expelled during orogenesis into syndeformation structures withinoverlying volcanic rocks where they mixed with oxidizing fluids containing Cr, K2O, SiO2, Na2O, and CaO.
† Corresponding author: e-mail, [email protected]
©2008 Society of Economic Geologists, Inc.Economic Geology, v. 103, pp. 1341–1363

Methodology
Mapping
Four levels in the mine were mapped for the project. Thetwo main levels, the 440-m and the 720-m levels, were inves-tigated to define the stratigraphy of the mine (Fig. 2) and toverify the continuity of the stratigraphy vertically. Two otherlevels were investigated: to understand the origin of the 1060fault zone (the 880-m level 1060 crosscut) and to determinethe control on emplacement of the mineralization in thenorth volcanic package (the 400-m level; Hoyle Pond mine 3level).
Sampling, sample preparation, and laboratory analysis
Three hundred and fifty-five samples were analyzed forwhole-rock geochemistry (major oxides and trace elements)from the 3 level (400-m level, 16 vein zone), the 440-m level(950 zone and 16 vein zone), the 720-m level (1060 zone), the880-m level (1060 zone), and drill core. Analytical data andlocations are given in Dinel (2007).
Major and trace elements were analyzed by XRF and ICP-MS, respectively, at the University of Ottawa, Ottawa, On-tario, and the Ontario Geoscience Laboratories, Sudbury,Ontario. Ferrous iron was determined by the modified Wil-son (1960) technique (Whipple, 1974). The error in the major
1342 DINEL ET AL.
0361-0128/98/000/000-00 $6.00 1342
KB Kenogamissi batholith
RLB Round Lake batholith
LAB Lake Abitibi batholith
BRS Blake River Syncline
RLBRLB
KBKB
PDDZPDDZ
CLLDZCLLDZ
Kap
uska
sing
Stru
ctur
eZ
one
Kap
uska
sing
Stru
ctur
eZ
one
Shining TreeShining Tree
MatachewanMatachewan
GowgandaGowganda
MathesonMatheson
CochraneCochrane
KirklandLake
KirklandLake
LarderLake
LarderLake
TimminsTimmins
0 25 50
kilometresN
Proterozoic cover
Granitic plutons
Timiskaming assemblage(2676-2670 Ma)
Porcupine assemblage(2690-2685 Ma)
Tisdale assemblage(2710-2704 Ma)
Upper Blake River assemblage(2701-2696 Ma)
Lower Blake River assemblage(2704-2701 Ma)
Kidd-Munro assemblage(2719-2710 Ma) PDDZ Porcupine-Destor
deformation zoneCLLDZ Larder Lake-deformation zone
CadillacStoughton-Roquemaure assemblage
(2723-2720 Ma)
Deloro assemblage(2730-2724 Ma)
Pacaud assemblage(2750-2735 Ma)
Major fault
StudyareaStudyarea
PDDZPDDZ
BRS
FIG. 1. Geologic map of the Abitibi greenstone belt, illustrating the nine volcano-sedimentary rock assemblages as de-fined by Ayer et al. (2005). The Hoyle Pond gold mine is located in the Tisdale assemblage of the Abitibi South volcanic zoneand the mine area is outlined by dashed line box.

oxides is less than 0.5 percent of the reported value and fortrace elements, less than 10 percent. The error was calculatedwith a confidence interval of 95 percent, using the method ofKretz (1985) on lab standards and on three blind samples an-alyzed five times in repetition. Two blank samples were ana-lyzed to identify contaminants.
Analyses of alteration minerals were done using the elec-tron microprobe at Carleton University, Ottawa, Ontario.Carbon isotopes were measured by Vario EL III (Elementar,Germany) and DeltaPlus IRMS (ThermoFinnigan, Germany)at the University of Ottawa to determine the relative and ab-solute concentration of 13C. Organic matter in graphite wasextracted from the powdered rock samples by NaOH hy-drolization and was analyzed using a spectrophotometerwhich measures the absorption of light in the ultravioletwavelength range.
Regional Geologic SettingThe Archean bedrock geology of the Timmins gold camp
consists of four distinct supracrustal units identified as theDeloro, Tisdale, Porcupine, and Timiskaming assemblages.These assemblages are cut by different suites of intrusions(Fig. 3A), which are defined by their geochronologic age (U-Pb TIMS), tectonic affinity, and geochemical signatures. TheTisdale and Porcupine assemblages are the only assemblagespresent at Hoyle Pond and are described below.
Tisdale assemblage
The Tisdale assemblage is mainly composed of mafictholeiitic volcanic rocks, intercalated with ultramafic and fel-sic volcanic rocks, and of felsic calc-alkaline volcanic rocks
(Fig. 3A) ranging in age from 2710 to 2704 Ma (Ayer et al.,2005). South of the Porcupine-Destor deformation zone, theTisdale assemblage unconformably overlies the Deloro as-semblage. The maximum apparent thickness of the Tisdaleassemblage is 3,440 m as measured in the northeastern partof Tisdale Township between the axis of the North Tisdale an-ticline and its upper contact with the Krist Formation (Bris-bin, 1997). Previous authors interpret the base of the Tisdaleassemblage to be within the Porcupine Destor deformationzone (Pyke, 1982). However, field mapping by Dinel and oth-ers (Vaillancourt et al., 2001; Bateman et al., 2005) show thatthe location of the Porcupine-Destor deformation zone is nei-ther restricted to the base of the Tisdale assemblage nor is ita discrete fault surface. Instead it is a large (100–500 m) cor-ridor of deformation overprinting the unconformity. The Tis-dale assemblage (formerly a group) is subdivided into five for-mations (Dunbar, 1948, Jones, 1948; Ferguson et al., 1968),two of which, the Central and Vipond Formations, host themajority of the economic deposits. The formations are brieflydescribed below in ascending stratigraphic order.
Hersey Lake Formation: The Hersey Lake Formation con-sists mainly of high Mg tholeiitic basaltic pillowed flows,basaltic komatiitic, and komatiitic flows. It has an apparentthickness of ~600 m (Brisbin, 1997).
The ultramafic flows are classified as basaltic komatiite andkomatiite based on the geochemical criteria of Arndt (1975),with MgO contents of 10 to 18 and >18 wt percent. They haveflat REE patterns with chondrite ratios <7. In the field, theultramafic flows of the Hersey Lake Formation can be distin-guished from the mafic flows by their color index and charac-teristic polygonal jointing. Komatiites are dark gray, on fresh
LITHOGEOCHEMICAL & STRATIGRAPHIC CONTROLS ON Au MINERALIZATION, HOYLE POND MINE, TIMMINS, ON 1343
0361-0128/98/000/000-00 $6.00 1343
Shear zone, withsense of shear
NVP
CVP
SVP
North VolcanicPackageCentral VolcanicPackageSouth VolcanicPackage
Grey zone
Cross section
S0 in pillow(bulge givingfacing direction)
Fold axis andplunge
Anticline/synclinefold
S3S4
Cleavages
Reverse fault
S0 in (arrowgiving facingdirection)
950 Vein terminology
Porphyry
Quartz-carbonatevein
Komatiite
Basaltic-komatiite
High-Mg tholeiiticbasaltFe-rich tholeiiticbasalt
Sedimentaryrocks
Graphitic shear
Diabase+ +
- - -- -- - -
Legend
NVP
CVP
SVP
A
UP
UP950
1314
16
B1S
1060fz
+
+
+
++
+++++
+
+
+
+
+
+
+
+
++
+
++
+
+
+
+
++
+
+
+
+
++
++
+
+
+
+
+
+
+
+
+
+
+
+
+
+
+
+
++
- - - - -
- - - - -- - - - -
- - - - -- - - - -
- - - - -- - - - -
- - - - -- - - - -
- - - - -- - - - -
- - - - -- - - - -
- - - - -- - - - -
- - - - -- - - - -
- - - - -- - - - -
- - - - -
- - - - -
- - - - -- - - - -
- - - - -- - - - -
- - - - -- - - - -
- - - - -- - - - -
- - - - -- - - - -
- - - - -
- - - - -
- - - - -- - - - -
- - - - -- - - - -
- - - - -- - - - -
- - - - -
- - - - -
- - - - -- - - - -
- - - - -- - - - -- - - - -
- - - - -
- - - - - - - - - -
- - - - -- - - - - - - - - -
- - - - -- - - - -
- - - - -
- - - - - - - - - -- - - - -
- - - - -- - - - -- - - - -
- - - - -
- - - - -- - - - -
- - - - -
- - - - -
- - - - -- - - - -
- - - - -
- - - - -- - - - -
- - - - -
- - - - -- - - - -
- - - - -
- - - - -- - - - -
- - - - -- - - - -
- - - - -- - - - -
- - - - -
- - - - -- - - - -
- - - - -
- - - - -- - - - -
- - - - -
- - - - -
- - - - -
- - - - -- - - - -
- - - - -- - - - -
- - - - -
- - - - -
- - - - -
- - - - -
- - - - -- - - - -
- - - - -- - - - -
- -- -
- -- -
- -- -- -- -
- -
70 70
~75
F4
F4
~75
F4
F4
NW
SE
6878
86
70
77
70
8170
78
76
88
7484
8771 75
88
747673
78
88
69
68
7060
200m
B1NB1
B3
FIG. 2. Simplified geologic map of the Hoyle Pond mine, compiled from the 440- and 720-m level maps. Certain veinsare labeled using the mine convention (e.g., “A” vein). Traverses across veins are indicated. Note that in the western portionof the south volcanic package, the graphitic unit cuts the stratigraphy.

1344 DINEL ET AL.
0361-0128/98/000/000-00 $6.00 1344
Timmins Stratigraphic ColumnA)
Unconformity
DeloroAssemblage Calc-alkaline
mafic to felsicvolcanic rock
TisdaleAssemblage
2723Ma
2730Ma
~2708Ma
~2703Ma
2707Ma
HerseyLake Fm
Central Fm
Vipond Fm
Gold Centre Fm
Unconformity
Unconformity
PorcupineAssemblage
Calc-alkalinevolcaniclasticand or pyroclastic
<2678Ma
<2669Ma
+
+
+ +
+
+
+
+
++
+++ +
+
+
+
++
++
++
+
+
+
+
+ + +
++
Three NationsFm
Basal polymicticconglomerateDome Fm
Interbedded siltstone,greywacke andconglomeratebase, interbeddedslate and greywackes
Greywacke, sandstone andConglomerate
Argillite, greywacke andsandstone
Unconformity
+
+
+
+
+
+
+
+
+
+
+
+
+
Interlayered Mgand Fe-tholeiite
UppervolcanicFm
MiddlevolcanicFm
Felsic volcanicrock andbanded Ironformation
Main Au mineralizationSyn-D4, Re-Os 2670 +- 7 Ma(Bateman et al., 2003)
Fe-tholeiiticvolcanic rock
Mg-tholeiiticvolcanic rock
Mg-tholeiiticvolcanic rockand komatiite
B.I.F
Hoyle Fm
Beatty Fm
Krist Fm
<2691Ma
>2687Ma
TimiskamingAssemblage
~2682Ma
Porphyry 2682-2690Ma
Sodic porphyry andalbitite dyke 2673-2676Ma
Hoyle Pond StratigraphicColumn
B)
+
+
+
+
+
+
++
+
+
+
+
+
++
+
++
+
+
+
N
Unconformity
S.V.P.
C.V.P.
N.V.P.
Porphyry2687Ma & 2684Ma
Interbeddedhigh-Mg tholeiitesandFe-rich tholeiites
Interbeddedbasaltic komatiitesandkomatiites
Interbeddedhigh-Mg tholeiitesandbasaltic komatiites
Thrust fault
Porcupineassemblage
PorcupineAssemblage
Mineralization
FIG. 3. A. Stratigraphic column of the Timmins area (modified from E. Barr, Porcupine Joint Venture internal report,2005). B. Stratigraphic column of the Hoyle Pond mine. C.V.P. = central volcanic package, N.V.P. = north volcanic pack-age, S.V.P. = south volcanic package. The mine rocks are within the Hersey Lake and Central Formations of the Tisdaleassemblage.

surfaces, and have an orange-brown color on weathered sur-faces. In addition, some komatiite flows have spinifex texturesand are altered to talc and carbonate and cut by serpentine-filled fractures. The tholeiitic mafic volcanic rocks within theHersey Lake Formation occur as massive and pillowed flowand differ from similar flows in the overlying Central Forma-tion by their association with ultramafic flows.
Central Formation: Pyke (1982) described the compositionof the mafic volcanic flows of the Central Formation as a con-tinuum from magnesium tholeiitic basalts through irontholeiitic basalts. The Central Formation is approximately 450m thick (Brisbin, 1997) and is mainly composed of mafic, lo-cally variolitic, massive, and pillowed flows with pillow topbreccias. Pillows have 1- to 5-cm-thick selvages and an aver-age size of 100 × 50 cm in plan view. The rocks of the Cen-tral Formation are in general high Mg basalts intercalatedwith beds of black argillite or siltstones with cherty clasts.
Vipond Formation: The Vipond Formation is characterizedby very distinctive high Fe tholeiitic variolitic pillowed maficand intermediate volcanic flows (Dinel et al., 2008) and byvariolitic hyaloclastic mafic flows intercalated with massivemafic flows and carbonaceous argillite.
Gold Centre Formation: The Gold Centre Formation is theuppermost formation of the Tisdale assemblage. It is domi-nated by green, fine- to medium-grained, massive, leucoxene-bearing mafic flows (likely tholeiitic basalts) and calc-alkalinemafic to felsic volcanic rocks (Brisbin, 1997).
Porcupine assemblage
The Porcupine assemblage ranges in age from 2690 to 2685Ma and unconformably overlies the Tisdale assemblage in theTimmins area (Ayer et al., 2005). It is composed of siltstone,mudstone, and sandstones with local polymictic conglomer-ate, in conformable contact with calc-alkaline felsic volcanicrocks of the Krist Formation at the base of the assemblage(Fig. 3A). The turbidites have Bouma sequence subdivisionsindicating distal deposition from turbidity currents in ashelflike environment (Born, 1995). It is a very extensive as-semblage, occurring north of the Porcupine-Destor deforma-tion zone from Bristol Township, 20 km west of Timmins, toMatheson, over a distance of approximately 80 km.
Major regional structures
The Porcupine-Timmins gold camp is deformed by at leastsix deformation events (D1–D6: Bleeker, 1999; Bateman et al.,2005). The first two events, D1 and D2, are not observed atHoyle Pond and will not be discussed further. D3 is repre-sented by east-west–trending isoclinal folds with a steeplydipping axial planar S3 foliation parallel to lithologic contacts.D3 is either syn- or postdeposition of the Timiskaming assem-blage (Bateman et al., 2005). D4 produced a steeply dippingfoliation, S4, oriented ~060o to 070o, ~15o counterclockwise toS3. S4 is axial planar to isoclinal F4 folds, which correspond tothe northern margin of the 1060 fault zone in Hoyle Pond.The intersection lineation of S3 (E-W) with S4 (ENE-WSW)appears to be subparallel to the plunge of ore zones at theHollinger-McIntyre deposit (Melnik-Proud, 1992) and HoylePond mine. The D5 event is represented by a moderately dip-ping crenulation cleavage, S5, with two general strikes of 045o
and 335o. S5 is axial planar to asymmetric Z and S folds. D6
structures are observed on vertical surfaces as a subhorizon-tal crenulation, S6 cleavage, axial planar to millimeter- tometer-scale subhorizontal folds (Dinel, 2001).
The major shear zone in the Timmins area, the Porcupine-Destor deformation zone is a high-strain corridor with in-tense foliations, characterized by tight to isoclinal F4 folds.The Hollinger-McIntyre and Dome mines occur on struc-tures that are subparallel splays of the Porcupine-Destor de-formation zone.
Mine Geology and Volcanic GeochemistryThe volcanic belt is bounded on all sides by metasedimen-
tary rocks of the Porcupine assemblage (Rye, 1987; Fig. 2).The volcanic rocks at the mine are thrust bounded to thenorth by south-facing graywackes and siltstones of the Porcu-pine assemblage and to the south by discordance (either afault or unconformity) at their contact with south-facing silt-stones and graywacke, also of the Porcupine assemblage(2690–2685 Ma: Ayer et al., 2005). The volcanic rocks are in-truded by quartz-feldspar porphyries and quartz porphyries(Fig. 2).
The volcano-sedimentary rocks in the Hoyle Pond areawere subjected to greenschist facies regional metamorphism(e.g., Thompson, 2005). Throughout the area, undeformedand deformed volcanic rocks are composed of an albite-chlo-rite mineral assemblage, the pores spaces (clast intersticesand vesicles) of which have been filled with calcite, minorquartz, and chlorite.
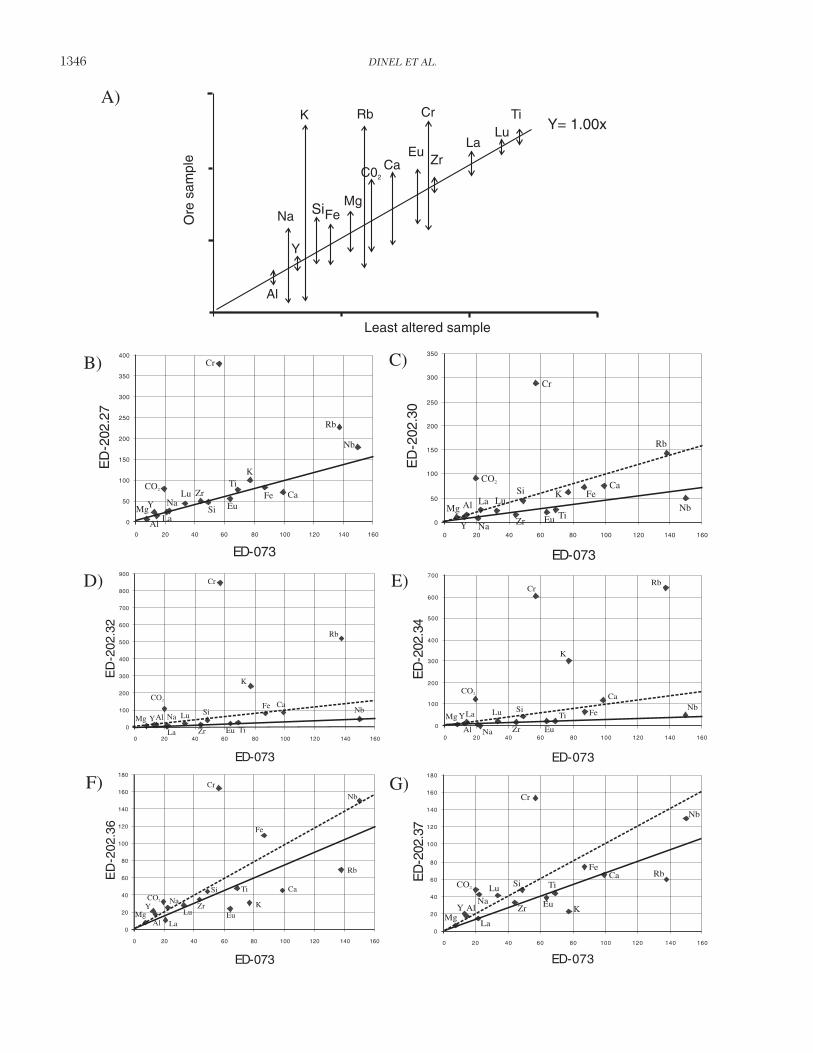
The volcanic geochemistry of units exposed in the mine wasdetermined by meter-scale sampling. The elements Al, Ti,HREE, Zr, and Y, and to a lesser extent LREE, were inter-preted to be “immobile” (see Fig. 4A), consistent with previ-ous work by Kerrich et al. (1999) and Wyman (2003). Chon-drite-normalized plots (Sun and McDonough, 1989) andvarious trace element ratio plots were used to help discrimi-nate rock types and to compare the stratigraphy of the HoylePond with formations within the Tisdale assemblage.
North volcanic package
The north volcanic package consists of interbedded maficand ultramafic volcanic rocks (Fig. 2). The mafic rocks aredominated by pillowed flows, pillow breccias, and locally mas-sive coherent flows (Fig. 5A). The pillows vary in size from 50cm to 1.5 m. They are generally undeformed and south facingoutside of shear zones, consistent with the facing direction ofthe Porcupine metasedimentary rocks bounding the minestratigraphy to the north and south (cf. Rye, 1987). They arecharacterized by a pale apple-green color and a very finegrained groundmass. On level 3 of the mine, variolitic pillowflows and pillow breccias were observed. Variolitic pillows ex-hibit leucocratic millimeter-scale (2–5 mm) globular bodieswhich are aligned and form bands along pillow margins. Inthin section the varioles appear as very fine, 2- to 5-mmspherulites that have diffuse edges that blend with thegroundmass. They are albitized and contain patches of titan-ite. Pervasively albitized rocks have fanlike albite in mi-crolithons with spherulitic extinction. Fragments in the pillowbreccia are amoeboidal and vary in size from 5 to 25 cm withmillimeter-size varioles that are concentrated in sinuousbands and are truncated by the pillow selvages (Fig. 5B). The
LITHOGEOCHEMICAL & STRATIGRAPHIC CONTROLS ON Au MINERALIZATION, HOYLE POND MINE, TIMMINS, ON 1345
0361-0128/98/000/000-00 $6.00 1345
1346 DINEL ET AL.
0361-0128/98/000/000-00 $6.00 1346
0
50
100
150
200
250
300
350
400
0 20 40 60 80 100 120 140 160
ED-073
ED
-202
.27
Rb
Nb
Cr
CaFe
KTi
EuSi
ZrLuNa
LaAl
YMg
CO2
B)
Least altered sample
A)
Y= 1.00x
Ore
sam
ple
Ti
Zr
Mg
Al
CrRbK
Eu
C02
Ca
Na Fe
LaLu
Si
Y
0
100
200
300
400
500
600
700
800
900
0 20 40 60 80 100 120 140 160
ED-073
ED
-202
.32
Rb
Cr
CaFe
K
TiEu
Si
Zr
LuNa
La
AlYMgNb
CO2
D)
0
20
40
60
80
100
120
140
160
180
0 20 40 60 80 100 120 140 160
ED-073
ED
-202
.36
Rb
Cr
Ca
Fe
K
Ti
Eu
Si
ZrLu
Na
LaAl
YMg
Nb
CO2
F)
0
50
100
150
200
250
300
350
0 20 40 60 80 100 120 140 160
ED-073
ED
-202
.30
Rb
Cr
CaFeK
TiEu
Si
Zr
Lu
Na
LaAl
Y
Mg Nb
CO2
C)
0
100
200
300
400
500
600
700
0 20 40 60 80 100 120 140 160
ED-073
ED
-202
.34
RbCr
Ca
Fe
K
Ti
Eu
Si
Zr
Lu
Na
La
Al
YMgNb
CO2
E)
0
20
40
60
80
100
120
140
160
180
0 20 40 60 80 100 120 140 160
ED-073
ED
-202
.37
Rb
Cr
CaFe
K
Ti
Eu
Si
Zr
Lu
Na
La
AlYMg
Nb
CO2
G)

mafic rocks are composed of chlorite, albite, carbonate, hy-drothermal quartz, and sericite, and some opaque minerals(chiefly graphite, minor iron oxides, pyrite, and traces of chal-copyrite). Locally, sericite is concentrated along cleavagedomains.
The ultramafic rocks are dark gray to black aphanitic rockswith coarser grained dolomite porphyroblasts and a soapy-soft cleavage. They locally contain minor chlorite, some dis-seminated quartz crystals, and iron oxides.
On the Jensen cation diagram, high Mg tholeiitic basalts aredisplaced toward aluminum and into the calc-alkaline field(Fig. 6A) due to the mobility of MgO and FeO (i.e., a loss ofFeO and MgO relative to Al2O3). The mafic rocks plot mostlyin the high Mg tholeiitic field of the Jensen cation plot withsome samples appearing in the calc-alkaline basaltic field(Fig. 6A). Although Fe and Mg were mobile, the geochemi-cal signature of the high Mg tholeiite can be identified bytheir generally flat, slightly concave REE patterns (Fig. 6B).The HREE (Gd, Dy, Er, Yb, Lu) are in general slightly moreenriched than the LREE (La, Ce, Nd, Sm). The LREE haveflat to shallow negative slope (La-Sm) varying from 3 to 14times chondrite; the HREE have a gently positive slope vary-ing from 12 to 20 times chondrite. The La/Lu and Ce/Ybchondrite-normalized ratios range from 0.2 to 0.8 and 0.3 to0.8, respectively. Although most samples have negative Euanomalies, others have positive Eu anomalies. The positiveEu anomalies may represent the deposition of Eu-bearingcarbonate minerals from relatively Eu rich fluids (Michardand Albarède, 1986).
In contrast, the REE concentrations of basaltic komatiites(Fig. 6B) are less than 10 times chondrite and show convexREE patterns with enriched HREE compared to LREE. Thenormalized LREE abundances vary from 5.5 to 7.5 times chon-drite, and the normalized HREE abundances vary from 8.0 to9.5 times chondrite. Eu anomalies vary from slightly positive toslightly negative. The La/Lu and Ce/Yb chondrite-normalizedratios range from 0.4 to 0.8 and 0.5 to 0.8, respectively.
Central volcanic package
The Central volcanic package (CVP; Fig. 2) consists of a se-quence of interbedded komatiite (typically >18 wt % MgO)and basaltic komatiites (12–18 wt % MgO; Fig. 7A) approxi-mately 200 m in apparent thickness. The contacts between
the basaltic komatiites and komatiites are gradational and arecommonly overprinted by strong carbonate alteration(dolomite to ferroan dolomite) and deformation, which re-sulted in the generation of an intense fabric and associatedquartz-carbonate stringer zones.
The basaltic komatiites are carbonatized fine- to medium-grained dark green to black chlorite schists with minor talc.The mineral assemblage is dominated by chlorite, talc,dolomite, hydrothermal quartz, iron-titanium oxides, coarse-grained (1–2 mm) carbonate porphyroblasts and locally Crmicas, actinolite, and trace pyrite.
The komatiites are talc-chlorite schist or talc schist. Theircolor varies from dark gray-black to cream gray-beige due tocarbonatization. The mineral assemblage is dominantly talc,chlorite, dolomite, hydrothermal quartz, iron-titanium oxides,and locally serpentine. In some thin sections, the Fe-Ti oxidecrystals form ringlike structures typical of relict olivine andare interpreted to represent the remnants of olivine cumulatezones (Fig. 5C).
With one exception, all samples of the central volcanicpackage have REE concentrations less than 10 times chon-drite (Fig. 7B). The HREE patterns have less curvature thanthe LREE and a slight decrease in concentration from Dy toLu. Some samples have slight positive Eu anomalies, whereasthe majority have small negative Eu anomalies. There is acontinuum in REE concentrations from komatiites to basaltickomatiites. The komatiites have normalized LREE abun-dances from 1.5 to 3.5 times chondrite and normalizedHREE abundances from 3.0 to 5.5 times chondrite. TheLa/Lu and Ce/Yb chondrite-normalized ratios range from 0.3to 1.0 and 0.3 to 1.2, respectively. The basaltic komatiites havenormalized LREE of 4.0 to 8.0 times chondrite and normal-ized HREE abundances from 6.5 to 10 times chondrite. TheLa/Lu and Ce/Yb chondrite-normalized ratios range from 0.4to 0.8 and 0.5 to 0.9, respectively.
South volcanic package
The south volcanic package rocks (Fig. 2) are strongly car-bonatized basalts and possess a more pervasive foliation thanrocks of the north and central volcanic packages. They occuras, pale to dark green ~10- to 40-m-thick massive to pillowedflows with local flow top breccias, which were deformed tocoarse-grained chloritic schist. Their mineralogy consists of
LITHOGEOCHEMICAL & STRATIGRAPHIC CONTROLS ON Au MINERALIZATION, HOYLE POND MINE, TIMMINS, ON 1347
0361-0128/98/000/000-00 $6.00 1347
FIG. 4. A. Schematic isocon diagram (Grant, 1986) of an altered sample on the south volcanic package 720-m level 1060fault zone, demonstrating the mobility of some trace elements (ppm) and major oxides (wt %). B. Scaled isocon plot of sam-ple ED-202.27 compared to the least altered sample ED-073. Sample ED-202.27 is located 4 m away from the B3 vein, astockwork zone. C. Scaled isocon plot of sample ED-202.30 compared to the least altered sample ED-073. Sample ED-202.30 is located 1 m away from the B3 vein. D. Scaled isocon plot of sample ED-202.32 compared to the least altered sam-ple ED-073. E. Scaled isocon plot of sample ED-202.34 compared to the least altered sample ED-073. Samples ED-202.32and ED-202.34 are located in the stockwork zone of the B3 vein. Note the strong increase in Cr, K2O, and Rb concentra-tion. F. Scaled isocon plot of sample ED-202.36 compared to the least altered sample ED-073. G. Scaled isocon plot of sam-ple ED-202.37 compared to the least altered sample ED-073. Samples ED-202.36 and ED-202.37 are located 13 and 14 m,respectively, away from the B3 vein. Note the concentration decrease in Cr, K2O, and Rb and concentration increase inNa2O. The solid line in the diagrams connects the immobile elements. If the trace elements define a straight line of slopeequal to one, they have not been perturbed. In highly altered samples, the trace elements would scatter. However, if theydefine a straight line of slope less than one, the trace element concentrations are diluted. The dashed line is a reference linewith a slope of 1. Note that the units are in wt percent for major oxides and ppm for trace elements multiplied by a factor.Al = Al2O3 wt %, Mg = MgO wt % × 1, Ti = TiO2 wt % × 100, Zr = ppm × 1, Na = Na2O wt % × 10, K = K2O wt % ×100, Ca = CaO wt % × 10, Rb = ppm × 10, Eu = ppm × 100, Cr = ppm × 1, Y = ppm × 1, La = ppm × 10, Lu = ppm ×100, Lu = ppm × 100, Fe = FeO wt % × 10, Nb = ppm × 100, Si = SiO2 wt % × 1.

chlorite, quartz, titanite, sericite, carbonate (calcite, dolomite,and ferroan dolomite), K feldspar, pyrite, iron-titanium ox-ides, and locally, graphite.
The composition of the carbonate mineral differs in the Fe-rich tholeiitic basalts, where it is more enriched in Fe (ferroandolomite). In addition, the high Mg and Mg tholeiitic basaltsshow slight modal increase in pyrite and chalcopyrite. Con-tacts between the three units are sharp and marked by quartz
veining, Cr mica, and sericite alteration (Fig. 5D). They arepale to dark green and occur as medium- to coarse-grainedchlorite schist. The pillows and breccia clasts in the 1060 faultzone are stretched vertically, parallel to the S3-S4 intersectionlineation.
The three compositional groups are observed in the Jensencation plot (Fig. 7C), chondrite-normalized REE plot (Fig.7D), and plot of Zr/Al2O3 vs. TiO2/Al2O3 (Fig. 7E). The Fe-rich
1348 DINEL ET AL.
0361-0128/98/000/000-00 $6.00 1348
20cm
A) B)
15cm
8cm
C)
4mm
Fe rich tholeiitic basaltsHigh Mg tholeiitic basalts
D)
FIG. 5. A. North volcanic package high Mg tholeiitic basalts pillowflow (3 level), looking east, with younging direction to the south. B.North volcanic package high Mg tholeiites as (1) variolitic pillow flowand (2) pillow breccias with flow banding. C. Komatiitic flow altered totalc and iron-titanium oxides that rim relict cumulate crystals of olivine(fov ~4 mm). D. Underground photo of the contact between the Fe-rich tholeiitic basalts (right) and high Mg tholeiitic basalts (left). Five-to 10-cm quartz-carbonate veins with sericite-fuchsite alteration haloare at the contact between the two rock types.

tholeiitic basalts are characterized by their relatively highREE concentrations and concave LREE to HREE pattern,with HREE slightly more enriched than LREE. The normal-ized LREE abundances vary from 15 to 30 times chondrite,and the normalized HREE abundances vary from 20 to 30times chondrite (Fig. 7D). The La/Lu and Ce/Yb ratios rangefrom 0.4 to 0.8 and 0.5 to 0 0.9, respectively. The REE con-centration of Mg tholeiitic basalts have slopes similar to thoseof the Fe-rich tholeiitic basalts and high Mg tholeiitic basaltsbut have intermediate REE concentrations. The LREE con-centrations vary from 6.0 to 11 times chondrite and theHREE concentrations vary from 8.0 to 15 times chondrite(Fig. 7D). The La/Lu and Ce/Yb ratios range from 0.4 to 0.9and 0.5 to 0.9, respectively. The Mg tholeiites plot in the samelocation as other Mg basalts observed in the north volcanic
package in the Jensen diagram. The REE patterns of the highMg tholeiitic basalts are similar to those of the other twobasalt types, but they are characterized by lower REE abun-dances with normalized LREE abundances that vary from 2.2to 4.7 times chondrite and normalized HREE abundance thatvary from 7.0 to 11 times chondrite (Fig. 7D). The La/Lu andCe/Yb ratios range from 0.3 to 0.7 and 0.3 to 0.7, respectively.
The Hoyle Pond volcanic rocks are geochemicaly similar tothe Hersey Lake and Central Formations (Fig. 3B). Theyhave similar immobile element chemistry, specificallyTiO2/Al2O3 and Zr/Al2O3 ratios indicating that the south vol-canic package has very similar geochemistry to the CentralFormation (Fig. 8A-D), whereas the north and central vol-canic packages correlate with the Hersey Lake Formation(Fig. 9A-D).
Other lithologic units
Younger quartz-feldspar porphyries and quartz porphyriessericite schist cut the south volcanic package. The quartz por-phyries are 2- to 4-m-thick, 200-m-long, sericitized and foli-ated sill composed of ~5 vol percent quartz phenocrysts withrare fuchsitic clasts. The quartz porphyries are intersected bydominant S3 fabric and folded by D4. In thin section, thequartz phenocrysts have an embayed dissolution texture typi-cal of felsic extrusions or shallow intrusions. It has a U-Pb zir-con age of 2687.6 ± 2.2 Ma (Ayer et al., 2005).
The quartz-feldspar porphyries cut across stratigraphy.They are moderately foliated by S4 and they have very weakto no metamorphic halos. They are composed of 30 to 40 volpercent albite phenocrysts (5 mm to 1.5 cm) and ~5 vol per-cent quartz phenocrysts varying in size from 2 to 5 mm withina matrix composed of very fine grained quartz, albite, andmuscovite. They have a trachytic texture defined by an align-ment of feldspar phenocrysts. Zircons extracted from a sam-ple from the 620-m level returned a U-Pb crystallization ageof 2684.4 ± 1.9 Ma, but the sample also contains inherited zir-con with an age of 2695.1 ± 3.3 Ma (Ayer et al., 2005).
The quartz-feldspar porphyry and the quartz porphyry havevery similar compositions. The two porphyries have identicalchondrite-normalized REE patterns, with LREE (18–25times chondrite) to IREE negative slope and IREE to HREEflat pattern (1 times chondrite; Fig. 7F).
Structure
The mine stratigraphy consists of a south-facing homoclinalsequence of stacked volcanic rocks, previously interpreted tobe an anticlinal fold cored by ultramafic volcanic rocks. Thevolcanic rocks are foliated by a dominant S3 fabric (Fig. 10A)parallel to bedding that strikes generally eastward. Whencompared to the deformation history in the rest of the Porcu-pine gold camp, the Hoyle Pond mine main fabric (S3) is com-parable to what Bateman et al. (2005) describes as S2. If cor-rect, the S3 fabric of Bateman et al. (2005) is not observed atthe mine (see Table 1) and is restricted to the Porcupine-Destor deformation zone. S3 of this study is refolded at themine scale by D4. The S4 fabric trends ~070 o and is axial pla-nar to isoclinal F4 folds (Fig. 2) in the 1060 fault zone and toZ-shaped F4 folds, northwest of the 1060 fault zone (see Figs.2, 10B). The timing of the D3 event in this study is con-strained between 2687.6 ± 2.2 and 2684.4 ± 1.9 Ma, based on
LITHOGEOCHEMICAL & STRATIGRAPHIC CONTROLS ON Au MINERALIZATION, HOYLE POND MINE, TIMMINS, ON 1349
0361-0128/98/000/000-00 $6.00 1349
A)
B)
1
10
100
La Ce Pr Nd PmSm Eu Gd Tb Dy Ho Er Tm Yb Lu
Roc
k/C
hond
rites
100
1
10
La Eu Lu
Ti + Fe
Al Mg
Komatiite
BasalticKomatiite
And.
Dac.
Rhy.
High Fe-tholeiites
High Mg-tholeiites
FIG. 6. A. Jensen cation plot (Jensen, 1976) of the north volcanic packagevolcanic rocks which plot in the field of high Mg tholeiitic basalts and basaltickomatiites. B. Chondrite-normalized REE pattern of the north volcanicpackage high Mg tholeiitic basalts and basaltic komatiites. The inset showsthe approximate range of the normalized REE abundance of the high Mgtholeiitic basalts (gray) and basaltic komatiites (black).

1350 DINEL ET AL.
0361-0128/98/000/000-00 $6.00 1350
1
10
100
La Ce Pr Nd PmSm Eu Gd Tb Dy Ho Er Tm Yb Lu
Roc
k/C
hond
rite
B)
1
10
100
La Ce Pr NdPmSmEu Gd Tb Dy Ho Er TmYb Lu
Roc
k/
Cho
ndrit
e
10
1
100
La Eu Lu
1
10
100
La Ce Pr Nd PmSm Eu Gd Tb Dy Ho Er Tm Yb Lu
Roc
k/
RC
hond
rite
1
10
100
La Eu Lu
0 2 4 6 80.01
0.03
0.05
0.07
0.09
TiO
2/A
l 2O
3
Zr/Al2O3
Fe-rich tholeiites
Mg-tholeiites
High Mg-tholeiites
E) F)
A)
C) D)
Ti + Fe
Al Mg
Komatiite
Basaltickomatiite
HighMg-tholeiites
HighFe-tholeiites
And.
Dac.Rhy.
Ti + Fe
Al Mg
Fe-rich Tholeiites
Mg-Tholeiites
High Mg-tholeiites
Calc-Alkaline suite
Tholeiitic
Suite
And.Dac.
Rhy.
FIG. 7. A. Jensen cation plot (Jensen, 1976) of the central volcanic package volcanic rocks, komatiites, and basaltic ko-matiites. B. Chondrite-normalized REE pattern of the central volcanic package volcanic rocks, komatiites, and basaltic ko-matiites. The inset shows the approximate range of the normalized REE abundance of the komatiites (gray) and basaltic ko-matiites (black). C. Jensen cation plot (Jensen, 1976) of the south volcanic package volcanic rocks, Fe-rich tholeiitic basalts,Mg tholeiitic basalts, and high Mg tholeiitic basalts. D. Chondrite-normalized REE pattern of the south volcanic packagevolcanic rocks, Fe-rich tholeiitic basalts, Mg tholeiitic basalts, and high Mg tholeiitic basalts. The inset shows the approxi-mate range of the normalized REE abundance of the Fe-rich tholeiitic basalts (pale-gray), Mg tholeiitic basalts (gray), andhigh Mg tholeiitic basalts (black). E. TiO2/Al2O3 vs. Zr/Al2O3, differentiating the three volcanic rock types, Fe-rich tholeiiticbasalts, Mg tholeiitic basalts, and high Mg tholeiitic basalts of the south volcanic package. F. Chondrite-normalized REE pat-tern of the felsic intrusive quartz-feldspar (squares) and quartz (diamonds) porphyry.

a crosscutting relationship of S3 and S4 with the quartz-feldspar porphyries and quartz porphyries. The quartz por-phyries are pre-D3 and are foliated by S3; the quartz-feldsparporphyries are post-D3 and pre-D4, because they lack thepenetrative S3 fabric, yet possess the S4 fabric. The loci ofmineralization in the 1060 fault zone are coincident with thecontacts of the various lithologic units on the limbs of the iso-clinal F4 folds. The 1060 shear zone is a corridor of intensedeformation, where S4, oriented ~070o, is very penetrativeand acted as a shear foliation.
Vein descriptions
Both extensional and fault-fill veins are observed at HoylePond. The extensional veins are straight to S shaped, cutacross the S3 and S4 foliations at high angles, and have a gen-eral sinistral rotation. They are generally massive and com-posed of white to grayish quartz, with local pyrite along the
wall rock-vein contact. Locally, some extension veins have ablack appearance due to graphite and tourmaline-filled frac-tures. The fault-fill veins are generally oriented ~070o andhave a more diverse mineralogy consisting of massive white togray quartz, with interstitial tourmaline and/or stylolitic chlo-rite and, locally, muscovite or Cr muscovite. Other fault-fillveins are mainly composed of massive white quartz and arecommonly associated with variable concentrations of graphitein the wall-rock selvages. In the north volcanic package, thefault-fill veins (e.g., 16 vein) are parallel to S3; however, in thesouth volcanic package, the fault-fill veins are parallel to S4.
Gold mineralization
Fault-fill and extensional veins contain free gold flakesranging from micron to 2-cm size found along stylolites in theveins or randomly distributed in massive veins as millimeterto centimeter gold veinlets.
LITHOGEOCHEMICAL & STRATIGRAPHIC CONTROLS ON Au MINERALIZATION, HOYLE POND MINE, TIMMINS, ON 1351
0361-0128/98/000/000-00 $6.00 1351
Hoyle Pond
Hersey Lake Form.
0 100 200 3000.0
0.2
0.4
0.6
0.8
TiO
(wt%
)2
V (ppm)
TiO
2/A
l 2O
3
Zr/Al2O3
0 1 2 3 4 5 6 7 80.00
0.01
0.02
0.03
0.04
0.05
0.06
0.07
0.08
TiO
2/A
l 2O3
Zr/Al2O3
0 1 2 3 4 5 6 7 80.00
0.01
0.02
0.03
0.04
0.05
0.06
0.07
0.08
TiO
(wt%
)2
V (ppm)0 100 200 300
0.0
0.1
0.2
0.3
0.4
0.5
0.6
0.7
0.8C)
A) B)
D)
FIG. 8. Comparison of immobile element concentrations in the north volcanic package (triangle) and central volcanicpackage (diamonds) at the Hoyle Pond mine (A) and (B) to samples of the Hersey Lake Formation of the Tisdale assemblage(C) and (D). A. TiO2/Al2O3 vs. Zr/Al2O3 plot of the north and central volcanic packages. B. TiO2 vs. V plot of the north andcentral volcanic packages. C. TiO2/Al2O3 vs. Zr/Al2O3 plot of the Hersey Lake Formation. D. TiO2 vs. V plot of the HerseyLake Formation. A geochemical database was provided by the Porcupine Joint Venture (Goldcorp). The database containsmore than 1,000 analyses from samples collected in the Porcupine gold camp. Approximately 200 analyses out of the 1,000characterize the geochemistry of the Hersey Lake Formation of the Tisdale assemblage.

AlterationMapping and sampling of alteration was conducted along
three traverses that intersect the B1N, B1, and B3 veins onthe 720-m level. The alteration mineral formation appears tohave been synchronous with vein development and gold min-eralization as indicated by alteration halos which envelop butdo not intersect the veins. Three alteration zones were iden-tified, mapped, and sampled: an inner sericite zone sur-rounding the veins, an outer albite zone, and a graphitic al-teration zone (gray zone). The alteration minerals are sericite,fuchsite (Cr muscovite), K-feldspar, albite, carbonates,graphite, chlorite, tourmaline, pyrite, and arsenopyrite. Ingeneral, carbonate alteration is pervasive and observedthroughout the mine. The intensity of carbonate, sericite, and“fuchsite” alteration increases locally and is best developed inthe 1060 fault zone in the vicinity of veins.
The sequence of deformation, alteration and mineralizationevents is shown in Figure 11A and B. The albite and carbon-ate porphyroblasts present in microlithons are dissected by acleavage defined by muscovite and Cr muscovite, with minorquartz and graphite (Fig. 12A), thus demonstrating the exis-tence of early albite and carbonate alteration. Graphite alter-ation is visible in fault-fill and extension veins, in former wall-rock interstices (Fig. 12B), within flow top breccias andhyaloclastite, and along stylolites and cleavages. Tourmaline ispresent in stylolites and in the fault-fill veins and extensionalveins as coarse euhedral grains. Needles of arsenopyrite occurin the veins and in their wall rocks, which also contain pyriteat vein contacts.
Isocon diagrams show that dilution of immobile elementsoccurred due to flooding by hydrothermal minerals (Fig. 4C-G; shifting the isocon). K2O, Na2O, Cr2O3, Rb, CO2, CaO,
1352 DINEL ET AL.
0361-0128/98/000/000-00 $6.00 1352
0 1 2 3 4 5 6 70.01
0.03
0.05
0.07
0.09
TiO
2/A
l 2O3
Zr/Al2O3
100 200 300 400 5000
1
2
TiO
(wt%
)2
V (ppm)
Hoyle Pond
Central Formation
TiO
2/A
l 2O
3
Zr/Al2O3
0 1 2 3 4 5 6 70.01
0.02
0.03
0.04
0.05
0.06
0.07
0.08
0.09
0.10
TiO
(wt%
)2
V (ppm)100 200 300 400 5000
1
2C)
A) B)
D)
FIG. 9. Trace element comparison of the south volcanic package at the Hoyle Pond mine (A) and (B) with the CentralFormation of the Tisdale assemblage (C) and (D). A. TiO2/Al2O3 vs. Zr/Al2O3 plot of the south volcanic package. B. TiO2 vs.V plot of the south volcanic package. C. TiO2/Al2O3 vs. Zr/Al2O3 plot of the Central Formation. D. TiO2 vs. V plot of the Cen-tral Formation. A geochemical database was provided by the Porcupine Joint Venture. The database contains more than1,000 analyses from samples collected in the Porcupine gold camp. Approximately 150 analyses out of the 1,000 character-ize the geochemistry of the Central Formation of the Tisdale assemblage.

Eu, FeO, MgO, and to a minor extent La (LREE), were allmobile to varying degrees.
Sericite alteration zone
The sericite alteration zone consists of muscovite, Cr mus-covite, calcite, dolomite, and ferroan dolomite and graphite,
plus microcrystalline alkali feldspar, local acicular arsenopy-rite and anhedral to euhedral pyrite. Typically, the sericitezones extend 4 to 6 m from the veins and range in color frompale gray, to light beige, to light yellow, and possess a weak tostrong pale gray sericitic cleavage (S3 and/or S4). The extentof the alteration appears to be dependent on the host-rock
LITHOGEOCHEMICAL & STRATIGRAPHIC CONTROLS ON Au MINERALIZATION, HOYLE POND MINE, TIMMINS, ON 1353
0361-0128/98/000/000-00 $6.00 1353
A)B)
Komatiite
Basaltic-komatiite
High-Mg tholeiitic basalt
Fe-rich tholeiitic basalt
Sedimentaryrocks
- - -- -- - -
Diabase+ +
440m
720m
NW
200m
Surface
SE
--- - - - - -- -
- - - - - - - -- -
- - - - - - - -- -
- - - - - - - -- -
- - - - - - - -- -
- - - - - - - -- -
- - - - - - - -- -
- - - - - - - -- -
- - - - - - - -- -
- - - - - - - -- -
- - - - - - - -- -
- - - - - - - -- -
- - - - - - - -- -
- - - - - - - -- -
- - - - - - - -- -
- - - - - - - -- -
- - - - - - - -- -
- - - - - - - -- -
- - - - - - - -- -
- - - - - - - -- -
- - - - - - - -- -
- - - - - - - -- -
- - - - - - - -- -
- - - - - - - -- -
- - - - - - - -- -
- - - - - - - -- -
- - - - - - - -- -
- - - - - - - -- -
- - - - - - - -- -
200m+++
+++++++++++++++
A
B1N
B1S B3
16
1
2
3
NEqual Area(Schmidt)
N = 60
Poles to S4
Poles to S3
1
2
3
NEqual Area(Schmidt)
N = 155
NEqual Area(Schmidt)
N = 8
Poles to S5
NEqual Area(Schmidt)
N = 18
Poles to S6
A)
FIG. 10. A. Lower hemisphere equal area projections of poles to S3, S4, S5, and S6, measured on the 400- (3 level),440-, 720-, and 880-m level at the Hoyle Pond mine. B. Vertical section of Hoyle Pond mine along a northwest-southeastsection with projection of F4 folds to and above surface.

1354 DINEL ET AL.
0361-0128/98/000/000-00 $6.00 1354
TAB
LE
1. C
ompa
riso
n of
the
Chr
onol
ogy
of D
efor
mat
ion
Eve
nts
in th
e Po
rcup
ine
Gol
d C
amp
from
Diff
eren
t Aut
hors
Rhy
s (2
003b
)B
atem
an e
t al.
(200
5)D
inel
et a
l. (t
his
stud
y)
Age
(M
a)L
ithol
ogic
uni
tsD
efor
mat
ion
even
tsA
ge (
Ma)
Lith
olog
ic u
nits
Def
orm
atio
n ev
ents
Def
orm
atio
n ev
ents
2730
–272
5D
epos
ition
of t
he
2730
–272
3D
epos
ition
of t
he
Del
oro
asse
mbl
age
Del
oro
asse
mbl
age
2708
–270
0D
epos
ition
of t
he
2708
–270
3D
epos
ition
of t
he
Tisd
ale
asse
mbl
age
Tisd
ale
asse
mbl
age
2700
–~26
90D
1a: n
orth
wes
t-tr
endi
ng fo
lds,
D
1: ex
tens
iona
l-upl
ift e
vent
, no
D1
: no
fabr
ic o
bser
ved
no fo
liatio
n de
velo
ped
or p
rese
rved
folia
tion
asso
ciat
ed; T
isda
le-
at th
e m
ine
Porc
upin
e un
conf
orm
ity
~269
1–~2
680
Dep
ositi
on o
f 26
91–~
2682
Dep
ositi
on o
f D
2: is
oclin
al fo
lds
(e.g
. Nor
th
D2:
no fa
bric
obs
erve
d at
the
the
Porc
upin
e th
e Po
rcup
ine
Tisd
ale
antic
line,
Por
cupi
ne
min
e (b
ased
on
Rhy
s, 2
003a
, as
sem
blag
eas
sem
blag
esy
nclin
e) a
nd la
te th
rust
eve
nt
inte
rnal
com
pany
rep
ort)
1
(Tis
dale
thru
st o
ver
Porc
upin
e);
earl
y di
p-sl
ip fa
ultin
g in
the
Des
tor-
Porc
upin
e de
form
atio
n zo
ne
~268
0–~2
675
D1b
: wes
t-no
rthw
est-
tren
ding
D
3: ea
st-w
est i
socl
inal
fold
s w
ith
isoc
linal
fold
s la
ckin
g ax
ial p
lana
r ax
ial p
lana
r cl
eava
ge p
aral
lel t
o cl
eava
ge, m
odifi
catio
n of
D1a
fold
sbe
ddin
g, p
ossi
ble
late
gol
d m
iner
-al
izat
ion
(268
7 >
D3
>268
4), l
ate
D3
thru
st, T
isda
le o
n Po
rcup
ine
~267
5–~2
672
Des
tor-
Porc
upin
e fa
ult s
yste
m,
2678
–266
9D
epos
ition
of t
he
D3:
fold
ing
(e.g
. Sou
th T
isda
le
earl
y fa
ultin
g, >
10 k
m s
inis
tral
Ti
mis
kam
ing
antic
line)
and
axi
al p
lana
r cl
eava
ge
stri
ke-s
lip d
ispl
acem
ent,
nort
h as
sem
blag
e an
d S 3
dom
inan
t pen
etra
tive
fabr
ic in
si
de d
own
albi
tite
dike
at t
he
Tim
min
s (o
rien
ted
281º
) po
st-6
77M
a,
McI
ntyr
e m
ine
resu
lt of
obl
ique
-slip
mov
emen
t (~
2672
Ma)
alon
g m
ajor
def
orm
atio
n zo
nes;
gol
d m
iner
lizat
ion
asso
ciat
ed w
ith D
3
~267
4–~2
672
Dep
ositi
on o
f the
>
2669
For
mat
ion
of th
e D
ome
faul
t; D
4: D
4: pe
netr
ativ
e S 4
fabr
ic o
rien
ted
Tim
iska
min
g is
oclin
al fo
ldin
g a
nd S
4ax
ial p
lana
r 07
0º, a
xial
pla
nar
to is
oclin
al fo
lds
asse
mbl
age
and
clea
vage
ori
ente
d 07
0º, r
estr
icte
d to
an
d go
ld m
iner
aliz
atio
n as
soci
ated
al
bitit
e di
keth
e Ti
mis
kam
ing
sync
line,
dip
-slip
w
ith D
4
mov
emen
t ass
ocia
ted
with
D4
faul
ts
and
gold
min
eral
izat
ion
~267
2–(?
)D
2+
regi
onal
met
amor
phis
m,
D5:
cons
tric
tiona
l str
ain,
obs
erve
d D
5: no
rthe
ast c
renu
latio
n cl
eava
ge
pene
trat
ive
S 2; e
ast-
sout
heas
t w
est o
f Por
cupi
ne s
yncl
ine,
form
ing
asso
ciat
ed w
ith s
mal
l-cal
e Z
fold
s cl
eava
ge, l
ate
gold
min
eral
izat
ion
very
str
etch
ed p
illow
s, p
rom
inen
t an
d co
njug
ate
kink
s; D
6: su
b-w
here
the
Des
tor-
Porc
upin
e fa
ult
hori
zont
al c
renu
latio
n cl
eava
ge
defle
cts;
D6:
flat-
lyin
g cr
enul
atio
n ax
ial p
lana
r to
bro
ad o
pen
fold
cl
eava
ge(v
ertic
al d
ispl
acem
ent a
long
S4)
D3:
spac
ed S
3fo
liatio
n ea
st-
D7:
nort
h-no
rthe
ast-
stri
king
kin
k so
uthe
ast c
leav
age,
con
tinua
tion
and
chev
ron
fold
s, s
teep
ly d
ippi
ng
of s
inis
tral
dis
plac
emen
t; D
4: la
te
axia
l pla
nar
clea
vage
retr
ogra
de d
efor
mat
ion,
nor
th-
nort
heas
t cre
nula
tion
clea
vage
and
co
njug
ate
kink
s; D
5: sh
allo
w
sout
hwes
t-di
ppin
g cr
enul
atio
n cl
eava
ge
1 R
hys
(200
3b),
Stru
ctur
al s
tyle
and
set
ting
of g
old
depo
sits
, Hol
linge
r-M
cInt
yre
to P
amou
r, Po
rcup
ine
min
ing
cam
p: A
Fie
ld tr
ip g
uide
for
Pla
cer
Dom
e ex
plor
atio
n se
min
ar, O
ctob
er 1
, 200
3, 4
5 p.

composition, as the most significant enrichment in mobile el-ements is in high Mg tholeiitic basalts. K2O, Rb, As, and Sconcentrations increase adjacent to veins (Fig. 13B, C). Theenrichment in Rb is identical to that of K2O (Fig. 4D, E) andreflects a substitution of K by Rb in the crystal lattice ofsericite and alkali feldspars. Sericitic alteration and element
enrichment and depletion also can be observed at lithologiccontacts where no veins are present.
Chromium enrichment
Chromium content increases in close proximity to veins andis found in muscovite and Cr micas (Table 2), replacing Al in
LITHOGEOCHEMICAL & STRATIGRAPHIC CONTROLS ON Au MINERALIZATION, HOYLE POND MINE, TIMMINS, ON 1355
0361-0128/98/000/000-00 $6.00 1355
B)
Time (Ma)
Qtz-carb veining ?
Thrusting
Dolomite-Ferroan-dolomite
Albite
Gold
Pyrite-Arsenopyrite?
Tourmaline
Graphite
Qtz-carb veining
Dolomite-Ferroan-dolomite
Albite
Gold
Pyrite-Arsenopyrite
Tourmaline
Sericite+Fuchsite
Graphite
2687.6Ma 2684.4Ma 2672.8Ma
D4D3
Sericite+Fuchsite?
A)
Time (Ma)
26842687
D1 D2 D3
Graphite
Ankerite-Dolomite-Calcite
Sericite +Fuchsite
Gold mineralization
D4
26722724 2710 2704 2690 2685 2676
D5 D6
Deloro Tisdale2730
Porcupine Timiskaming
Tourmaline
Pyrite
Chalcopyrite
Burial MetamorphismChloritization andCarbonatization
Local mineralization/DeformationMetamorphism
HP QFPsHP Q sP
2670
McIntyre pre-min.Albitite dyke
Arsenopyrite
Albitization
FIG. 11. A. Paragenetic sequence of deformation, alteration, and mineralization vs. time in the Porcupine gold campbased on Bateman et al. (2005) and field observation at the Hoyle Pond mine. B. Paragenetic alteration sequence at theHoyle Pond mine.

the octahedral site of the crystal lattice (Deer et al., 1992).Chromium contents in tholeiitic basalts of the area are gen-erally 150 to 250 ppm, similar to oceanic crust (Faure, 1998).In proximity to the quartz-carbonate gold bearing veins,chromium concentrations increase by a factor of 6 to reachlevels of 1,200 ppm. We note that the nickel concentrationand the Mg number do not follow the chromium trend, indi-cating that the chromium enrichment is not a primary ig-neous feature. Moreover the isocon diagrams (Fig. 4D, E)clearly show Cr enrichment. Moritz and Crocket (1991) andMcCuaig and Kerrich (1998) also noted fuchsite-rich quartzveins at the Dome mine in Timmins and suggested that Crcould be mobile.
Albite alteration zone
These zones envelop the sericite alteration and are best ob-served in thin section. The albitized rock consists of a fine-grained apple-green groundmass with albite porphyroblastsand spherulitic secondary albite overgrowing chlorite (Fig.12C). Chondrite-normalized patterns (e.g., Fig. 6B) of al-bitized rocks have negative Eu anomalies that are likely dueto the loss of Ca and Eu in the transformation of Ca plagio-clase to albite (e.g., Fowler and Doig, 1983). The Na enrich-ment decreases approaching the vein and is replaced by an in-crease in K2O as sericite alteration. The albite alterationzones can be difficult to identify due to the number of over-lapping alteration halos around veins and the fact that miner-alization is dominated by sericitic alteration.
Graphitic alteration (“gray zone”)
Gray zone alteration trends roughly 070o and commonlycuts across the stratigraphy (Fig. 2) parallel to the sericite andalbite alteration zones. The gray zones extend for several hun-dred meters along strike and range from 0.5 to 20 m in thick-ness. This alteration is commonly centered and does not in-tersect the quartz-carbonate veins. It is associated with coarsebrecciation and a modal increase in graphite, pyrite (includ-ing globular pyrite), calcite, dolomite, and ferroan dolomite.Drilling shows that the gray zones form anastamosing three-dimensional networks surrounding lenses of less altered rock(Rye, 1987). They are commonly spatially associated with Au-rich quartz veins. In the 1060 fault zone, the graphite enrich-ment is found in the vicinity of veins and correlates with thezone of intensive shear mapped by D. Rhys (unpub. reportfor Porcupine Joint Venture, 2003, 36 p.).
Previous workers (Downes et al., 1984; Rye, 1987) havesuggested that the graphite was formed from organic carbon.Downes et al. (1984) reported gas chromatograph analyses ofsamples, which showed peaks corresponding to C-H bonds aswell as toluene and xylene structures; this indicated the pres-ence of highly condensed aromatic polymers. Hodges (1982)showed that 22 percent of reduced carbonaceous material atOwl Creek is organic. For this study, we collected samplesfrom the graphitic shear on the 440-m level and the graphiticalteration enveloping the 16 vein on the 440-m level, and an-alyzed them for 13C concentration. The δ13C values are in therange of –24 to –27 per mil. The abundance of isotopicallylight carbon could indicate an organic source or fractionationof either mantle or atmospheric C. Ultraviolet absorptionspectra of the graphite showed a strong absorption peak at
1356 DINEL ET AL.
0361-0128/98/000/000-00 $6.00 1356
B)
C)
4mm
4mm
4mm
Graphite
A)
FIG. 12. A. Spherulitic textures in albitized microlithons cut by S4 cleav-age containing muscovite, Cr muscovite, and Fe dolomite, crossed polars B.Graphite alteration in zone of increased porosity in a brecciated clast, naturallight. C. Secondary spherulitic albite overprinting earlier chlorite (black),crossed polars.

LITHOGEOCHEMICAL & STRATIGRAPHIC CONTROLS ON Au MINERALIZATION, HOYLE POND MINE, TIMMINS, ON 1357
0361-0128/98/000/000-00 $6.00 1357
Tra
vers
eB
-B'(
720m
l)
0
1000
2000
3000
4000
5000
6000
04ED-203.01
04ED-203.02
04ED-203.03
04ED-203.04
04ED-203.05
04ED-203.06
04ED-203.07
04ED-203.08
04ED-203.09
04ED-203.10
04ED-203.11
04ED-203.12
04ED-203.13
04ED-203.14
04ED-203.15
04ED-203.16
04ED-203.17
04ED-203.18
04ED-203.19
04ED-203.20
04ED-203.21
04ED-203.22
04ED-203.23
04ED-203.24
04ED-203.25
04ED-203.26
04ED-203.27
04ED-203.28
04ED-203.29
04ED-203.30
04ED-203.31
04ED-203.32
04ED-203.33
SiO
2*1
0
Cr
CaO
*100
K2O
*100
0
Na2
O*1
000
Eu
*100
0
CO
2*1
00
S*1
000
As
Au
*100
0
V*1
0
#316
ve
incr
oss
sect
ion
(3le
ve
l)
0
500
1000
1500
2000
2500
3000
3500
4000
04ED-242.10
04ED-242.09
04ED-242.08
04ED-242.07
04ED-242.06
04ED-242.05
04ED-242.04
04ED-242.03
04ED-242.02
04ED-242.01
04ED-241.01
04ED-241.02
04ED-241.03
04ED-241.04
04ED-241.05
04ED-241.06
04ED-241.07
04ED-241.08
04ED-241.09
04ED-241.10
04ED-241.11
04ED-241.12
04ED-241.13
04ED-241.14
04ED-241.15
04ED-241.16
04ED-241.17
04ED-241.18
04ED-241.19
04ED-241.20
04ED-241.21
04ED-241.22
04ED-241.23
04ED-241.24
04ED-241.25
04ED-241.26
04ED-241.27
04ED-241.28
04ED-241.29
04ED-241.30
SiO
2*1
0
Cr
CaO
*100
K2O
*100
0
Na2
O*1
000
Eu*
1000
CO
2
S*5
000
Fe-r
ich
thol
.H
igh-
Mg
thol
B3
Tra
vers
eC
-C'(
720m
l)
0
500
1000
1500
2000
2500
3000
3500
4000
4500
5000
04ED-204.01
04ED-204.02
04ED-204.03
04ED-204.04
04ED-204.05
04ED-204.06
04ED-204.07
04ED-204.08
04ED-204.09
04ED-204.10
04ED-204.11
04ED-204.12
04ED-204.13
04ED-204.14
04ED-204.15
04ED-204.16
04ED-204.17
04ED-204.18
04ED-204.19
04ED-204.20
04ED-204.21
04ED-204.22
04ED-204.23
04ED-204.24
04ED205.01
04ED205.02
04ED205.03
04ED205.04
04ED205.05
04ED205.06
04ED205.07
04ED205.08
04ED205.09
04ED205.10
04ED205.11
04ED205.12
04ED205.13
04ED205.14
SiO
2*1
0
Cr
CaO
*100
K2O
*100
0
Na2
O*1
000
Eu
*100
0
CO
2*1
00
S*1
000
As
Au
*100
0
V*1
0
B1N
B1S
Fe-r
ich
thol
.H
i-M
gth
ol.
Fe-r
ich
t.Fe
-ric
ht.
Tra
vers
eA
-A'(
720m
l)
0
500
1000
1500
2000
2500
3000
3500
4000
4500
04ED-202.01
04ED-202.02
04ED-202.03
04ED-202.04
04ED-202.05
04ED-202.06
04ED-202.07
04ED-202.08
04ED-202.09
04ED-202.10
04ED-202.11
04ED-202.12
04ED-202.13
04ED-202.14
04ED-202.15
04ED-202.16
04ED-202.17
04ED-202.18
04ED-202.19
04ED-202.20
04ED-202.21
04ED-202.22
04ED-202.23
04ED-202.24
04ED-202.25
04ED-202.26
04ED-202.27
04ED-202.28
04ED-202.29
04ED-202.30
04ED-202.31
04ED-202.32
04ED-202.33
04ED-202.34
04ED-202.35
04ED-202.36
04ED-202.37
04ED-202.38
SiO
2*1
0
Cr
CaO
*100
K2O
*100
0
Na2
O*1
000
Eu
*100
0
CO
2*1
00
S*1
000
As
Au*
3000
V*1
0
B3
Hig
h-M
gth
ol.
Hig
h-M
gth
ol.
Fe-r
ich
thol
.
Hig
h-M
gth
ol.(
1)H
igh-
Mg
thol
.(2)
6m(n
otsa
mpl
ed)
C)
A)
B)
D)
FIG
.13.
Sca
led
enri
chm
ent a
nd d
eple
tion
plot
of t
race
and
maj
or e
lem
ents
alo
ng th
ree
trav
erse
s (A
-A',
B-B
', C
-C')
on th
e 72
0-m
leve
l. T
he tr
aver
ses
cut a
cros
s th
est
ratig
raph
y fo
lded
by
F4
alon
g th
e 10
60 fa
ult z
one.
A fo
urth
trav
erse
cut
s ac
ross
the
3 le
vel (
16 v
ein)
. Sam
ples
alo
ng th
e fo
ur tr
aver
ses
wer
e ta
ken
at 1
-m in
terv
als.
SiO
2
= w
t % ×
10, C
r =
ppm
, CaO
= w
t % ×
100,
K2O
= w
t % ×
1,00
0, N
a 2O
= w
t % ×
1,00
0, E
u =
ppm
×1,
000,
CO
2=
wt %
×10
0, S
= w
t % ×
1,00
0, A
s =
ppm
, Au
= pp
m ×
1,00
0, a
nd V
= p
pm ×
10.

1358 DINEL ET AL.
0361-0128/98/000/000-00 $6.00 1358
TABLE 2. Electron Microprobe Data for Carbonate and Cr Muscovite (major oxide expressed in wt %)
Carbonate
Sample no. 203-17-1 203-17-3 203-17-6 203-17-7 204-07-1 204-07-3 204-07-4 70-1 70-2 70-4 77-1-2 204.05-2-1
CaO 28.75 28.95 28.56 27.5 56.33 57.87 55.65 56.34 57.97 57.53 57.46 57.11FeO 17.36 17.62 18.75 17.19 0.99 0.92 0.88 0.38 0.02 0.09 0.96 1.13MnO 0.35 0.46 0.42 0.4 1.02 0.92 0.99 1.72 0.07 0.09 0.53 0.68MgO 10.33 10.15 8.88 9.75 0.41 0.41 0.37 0.23 n.d. n.d. 0.37 0.39SrO 0.01 0.02 n.d. n.d. 0.04 n.d. n.d. n.d. n.d. n.d. n.d. n.d.BaO n.d. 0.1 n.d. 0.1 0.07 0.08 0.01 0.05 n.d. n.d. n.d. 0.02CR2O3 0.03 0.02 0.02 0.02 0.02 0.03 0.03 0.03 0.03 0.03 0.03 0.03Total 56.83 57.32 56.63 54.96 58.88 60.23 57.93 58.75 58.09 57.74 59.35 59.36
Cr muscovite
Sample no. 115-01-1 115-01-2 115-01-3 115-01-4 115-01-5 115-02-1 115-02-2 115-03-1 115-04-1 115-04-1 115-04-2 115-04-3
SiO2 48.49 48.07 48.42 47.76 48.34 48.17 48.42 48.28 48 48.75 48.04 48.66Al2O3 32.59 32.78 32.99 33.46 30.91 31.85 32.39 32.25 32.77 32.88 32.58 31.88TiO2 0.36 0.34 0.4 0.38 0.34 0.37 0.43 0.22 0.34 0.37 0.32 0.35Cr2O3 1.19 1.18 0.52 1.45 2.77 1.92 1.71 1.97 1.54 1.59 0.98 1.77V2O3 0.09 0.09 0.12 0.08 0.11 0.09 0.09 0.06 0.07 0.09 0.1 0.09FeO 0.9 0.77 0.96 0.86 0.92 0.99 1 0.97 0.92 1.02 1.23 1.17MgO 1.63 1.48 1.48 1.29 1.55 1.6 1.51 1.52 1.45 1.5 1.54 1.61MnO 0.02 0.03 0.02 n.d. n.d. n.d. n.d. 0.03 n.d. n.d. n.d. 0.03K2O 10.82 10.78 10.74 10.67 10.77 10.8 10.85 10.55 10.83 9.81 10.68 10.82CaO n.d. n.d. n.d. 0.02 0.02 n.d. 0.01 0.01 0.01 n.d. 0.05 0.03Na2O 0.29 0.32 0.28 0.37 0.29 0.24 0.29 0.35 0.4 0.29 0.38 0.3BaO 0.19 0.26 0.2 0.33 0.23 0.23 0.19 0.29 0.26 0.26 0.22 0.26Cl 0.01 0.01 n.d. n.d. n.d. n.d. n.d. n.d. n.d. n.d. n.d. n.d.F n.d. n.d. 0.15 0.11 0.17 0.1 0.07 0.09 0.1 0.11 0.11 0.09Total 96.58 96.11 96.28 96.78 96.42 96.36 96.96 96.59 96.69 96.67 96.23 97.06
Sample no. 115-04-4 119-01-1 119-01-2 119-01-3 119-02-0 119-02-3 119-03-1 119-03-2 119-03-3 119-04-1 119-04-2 119-04-3
SiO2 48.18 47.93 48.19 48.01 48.02 48.01 47.76 48.3 47.62 47.78 47.37 48.31Al2O3 33.2 34.79 34.91 35.52 33.34 33.7 34.08 32.89 32.3 35.8 34.78 35.97TiO2 0.32 0.18 0.15 0.11 0.25 0.3 0.22 0.26 0.23 0.09 0.21 0.15Cr2O3 0.93 1.17 1.11 1.01 1.33 1.22 1.91 1.99 2.29 0.33 0.87 0.9V2O3 0.09 0.12 0.1 0.12 0.1 0.13 0.07 0.1 0.06 0.11 0.08 0.1FeO 0.78 0.6 0.55 0.44 0.86 0.82 0.58 0.74 0.75 0.39 0.63 0.43MgO 1.43 0.95 0.93 0.68 1.26 1.39 0.97 1.31 1.2 0.8 0.99 0.69MnO n.d. n.d. 0.04 0.01 0.04 n.d. 0.01 n.d. n.d. n.d. 0.03 n.d.K2O 10.72 10.02 10.24 10.04 10.46 10.19 10.38 10.19 10.08 10.03 9.82 9.18CaO n.d. 0.01 0.03 0.01 0.09 n.d. n.d. 0.01 0.06 0.09 0.46 0.03Na2O 0.34 0.51 0.38 0.53 0.49 0.41 0.5 0.4 0.48 0.49 0.6 0.58BaO 0.29 0.14 0.13 0.16 0.28 0.19 0.17 0.12 0.19 0.11 0.12 0.14Cl n.d. n.d. n.d. n.d. n.d. 0.01 0.01 0.03 0.01 0.01 0.01 0.02F 0.06 0.08 0.07 0.11 0.08 0.06 0.09 0.13 0.12 0.25 0.02 0.07Total 96.34 96.5 96.83 96.75 96.6 96.43 96.75 96.47 95.39 96.28 95.99 96.57
Sample no. 116A-1-1 116A-1-2 116A-2-1 116A-2-2
SiO2 48.79 48.55 49.61 48.49Al2O3 31.73 31.1 31.51 33.26TiO2 0.25 0.39 0.41 0.18Cr2O3 1.41 1.49 1.4 1.03V2O3 0.07 0.05 0.03 0.07FeO 0.67 0.83 0.71 0.64MgO 1.56 1.9 1.89 1.25MnO n.d. 0.03 n.d. n.d.K2O 10.45 10.57 10.78 10.57CaO n.d. n.d. n.d. 0.03Na2O 0.25 0.23 0.23 0.22BaO 0.17 0.12 0.07 0.13Cl n.d. n.d. n.d. n.d.F 0.08 0.14 0.14 0.21Total 95.43 95.4 96.78 96.08

280 nm (Fig. 14), indicating the presence of lignoid mole-cules (Farmer and Morrison, 1960; Sapek et al., 1980).
The graphite in the graphitic shear has a similar chemicalsignature to that of the gray zone.
Carbonate alteration
The carbonate alteration is developed beyond the minearea. Two types of carbonate alteration are observed, an earlyone consisting of deformed calcite crystals in amygdules andpillow selvages and a later one consisting of porphyroblasts ofdolomite and ferroan dolomite. Figure 13 documents a sig-nificant enrichment in CO2 in the Mg-rich rocks of the 1060fault zone in comparison to the Fe-rich tholeiitic basalts.
Silica alteration
Silica alteration is observed in thin section as stringers andpatches of anhedral quartz and resulted in the dilution of im-mobile elements (Fig. 4C). This alteration is less evident inthe Fe-rich tholeiitic basalts than in the Mg-rich volcanicrocks.
To explore the geochemical data more fully, a principalcomponents analysis was carried out (Dinel, 2007). Analysisof mobile element shows that K2O, Cr, and SiO2 covary as ex-pected for the sericite alteration zones. Similar covariance inCaO and Na2O defines the albite alterations zones. A princi-pal components analysis of immobile element concentrationsconfirms the classification of the rocks into Fe-rich and highMg groupings.
DiscussionThe vein systems at Hoyle Pond (e.g., 1060 fault zone)
were emplaced at contacts between different rock units.Similarly in the Hollinger and McIntyre system, Melnik-Proud (1992) and Brisbin (1997) observed that a majority ofveins were located at flow contacts. This raises the possibilitythat units with high primary porosity, such as interstices inflow breccias, could have been preferred hosts for hydrother-mal mineralization. Alternatively porosity may have been de-veloped at contacts during faulting or shearing as a result of
the competency contrast between adjacent units. The alter-ation patterns observed at the Hoyle Pond mine are consis-tent with those at the Hollinger-McIntyre deposit (Melnik-Proud, 1992; Brisbin, 1997) and in many other Archean golddeposits (Robert, 2001). At Hoyle Pond, the Au mineraliza-tion is hosted in D3 and D4 structures, indicating the exis-tence of pre- and post-Timiskaming assemblage Au mineral-ization. We have no evidence to constrain the end of D4, butF4 folds and associated fabric (S4) are found within Timiskam-ing sedimentary units with a maximum depositional age of2670 Ma (Ayer et al., 2005).
Regionally, Au-bearing quartz veins in the Timmins areaare parallel to a prominent 070o fabric, which may suggestthat the two are related. At Hoyle Pond, this fabric does notintersect Au-bearing quartz veins and the boudinage of theveins is interpreted to have formed as part of the shear-vein-ing process associated with D4. Across the Timmins area it isdifficult to decipher the timing of the various generations offabrics because they do not have a constant dip, hence fabricshaving the same strike but opposing dips in adjacent outcropsmay have been interpreted as the result of different deforma-tion events. These structural complications are an ongoingproblem that still needs to be resolved.
The dominant foliation (S3) formed during north-southcompression, after the deposition of the Tisdale and Porcu-pine assemblages. S2 and S3 have an average orientation of075/84 and 281/84, respectively, in the Timmins area (Bate-man et al., 2005). At Hoyle Pond, S3 is subparallel to litho-logic contacts and interpreted to be axial planar to F3 isoclinalfolds. The thrust fault observed at the northern contact of thenorth volcanic package formed late during D3. Mineralizationalso began during D3 as a result of the migration of fluidsalong the D3 thrust fault, which resulted in the formation ofextensional veins normal to S3 and fault-fill veins subparallelto S3 (e.g., 13, 14, 15, 16 veins). However, it is also possiblethat mineralization in the north volcanic package could haveformed during D4 and filled older D3 structures. D4 resultedin localized isoclinal folding and in the formation of a perva-sive 070o S4 foliation containing the majority of the gold-bear-ing veins in the 1060 fault zone. These fault-fill and exten-sional veins (e.g., B1, B1N, B1S, B3, UP, etc.) likely formedby flexural shear along the limbs of isoclinal F4 folds (Fig. 2).Figure 10B illustrates the relationships of F4 first-order foldswith mineralization.
Mineralization in the Hollinger-McIntyre deposits also wassyn-D4 and it overprints an albitite dike dated at 2672.8 ±1.1Ma (U/Pb zircon: Ayer et al., 2005). We speculate that miner-alization at the Hoyle Pond mine was coeval with that of theHollinger-McIntyre system. We suggest that sedimentaryrocks buried during D3 folding and thrusting were heated andfluids expelled from these rocks migrated along permeableD3 structures (Fig. 14). These processes were likely repeatedduring the D4 event.
Gold mineralization is interpreted to have been coeval withwall-rock alteration. The gold-bearing veins are surroundedby muscovite and Cr muscovite alteration, which in turn issurrounded by albite alteration. The so-called “gray zone” al-teration described by Downes et al. (1984) is caused by fillingof pores by graphite. The gray zone is centered on the gold-bearing veins, does not intersect the veins, and is interpreted
LITHOGEOCHEMICAL & STRATIGRAPHIC CONTROLS ON Au MINERALIZATION, HOYLE POND MINE, TIMMINS, ON 1359
0361-0128/98/000/000-00 $6.00 1359
0
0,02
0,04
0,06
0,08
0,1
0,12
0 100 200 300 400 500 600 700 800
Wavelength (nm)
Ab
sorp
tion
FIG. 14. A. Ultraviolet absorption spectrophotometry (which measuresthe absorption of light) plot for graphitic material samples of the graphiticshear on the 440-m level and the gray zone alteration on the 720-m level.The structure of the molecules determines the degree and wavelength ofthe absorption.
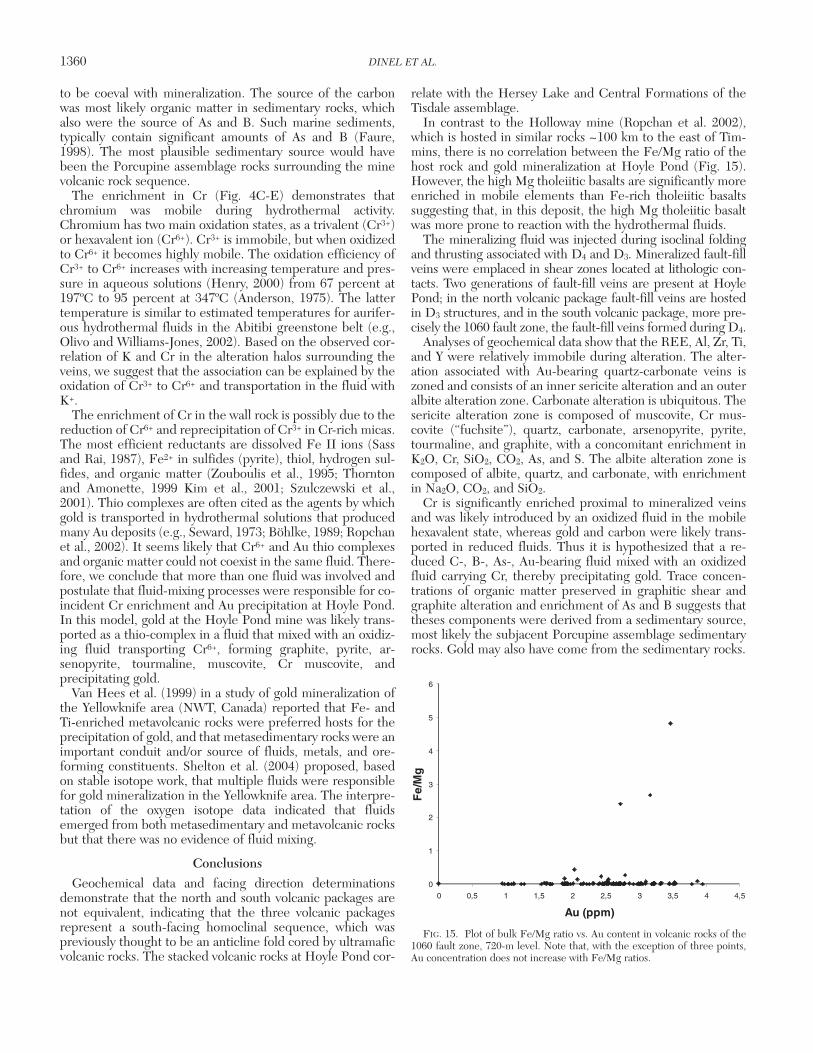
to be coeval with mineralization. The source of the carbonwas most likely organic matter in sedimentary rocks, whichalso were the source of As and B. Such marine sediments,typically contain significant amounts of As and B (Faure,1998). The most plausible sedimentary source would havebeen the Porcupine assemblage rocks surrounding the minevolcanic rock sequence.
The enrichment in Cr (Fig. 4C-E) demonstrates thatchromium was mobile during hydrothermal activity.Chromium has two main oxidation states, as a trivalent (Cr3+)or hexavalent ion (Cr6+). Cr3+ is immobile, but when oxidizedto Cr6+ it becomes highly mobile. The oxidation efficiency ofCr3+ to Cr6+ increases with increasing temperature and pres-sure in aqueous solutions (Henry, 2000) from 67 percent at197ºC to 95 percent at 347ºC (Anderson, 1975). The lattertemperature is similar to estimated temperatures for aurifer-ous hydrothermal fluids in the Abitibi greenstone belt (e.g.,Olivo and Williams-Jones, 2002). Based on the observed cor-relation of K and Cr in the alteration halos surrounding theveins, we suggest that the association can be explained by theoxidation of Cr3+ to Cr6+ and transportation in the fluid withK+.
The enrichment of Cr in the wall rock is possibly due to thereduction of Cr6+ and reprecipitation of Cr3+ in Cr-rich micas.The most efficient reductants are dissolved Fe II ions (Sassand Rai, 1987), Fe2+ in sulfides (pyrite), thiol, hydrogen sul-fides, and organic matter (Zouboulis et al., 1995; Thorntonand Amonette, 1999 Kim et al., 2001; Szulczewski et al.,2001). Thio complexes are often cited as the agents by whichgold is transported in hydrothermal solutions that producedmany Au deposits (e.g., Seward, 1973; Böhlke, 1989; Ropchanet al., 2002). It seems likely that Cr6+ and Au thio complexesand organic matter could not coexist in the same fluid. There-fore, we conclude that more than one fluid was involved andpostulate that fluid-mixing processes were responsible for co-incident Cr enrichment and Au precipitation at Hoyle Pond.In this model, gold at the Hoyle Pond mine was likely trans-ported as a thio-complex in a fluid that mixed with an oxidiz-ing fluid transporting Cr6+, forming graphite, pyrite, ar-senopyrite, tourmaline, muscovite, Cr muscovite, andprecipitating gold.
Van Hees et al. (1999) in a study of gold mineralization ofthe Yellowknife area (NWT, Canada) reported that Fe- andTi-enriched metavolcanic rocks were preferred hosts for theprecipitation of gold, and that metasedimentary rocks were animportant conduit and/or source of fluids, metals, and ore-forming constituents. Shelton et al. (2004) proposed, basedon stable isotope work, that multiple fluids were responsiblefor gold mineralization in the Yellowknife area. The interpre-tation of the oxygen isotope data indicated that fluidsemerged from both metasedimentary and metavolcanic rocksbut that there was no evidence of fluid mixing.
ConclusionsGeochemical data and facing direction determinations
demonstrate that the north and south volcanic packages arenot equivalent, indicating that the three volcanic packagesrepresent a south-facing homoclinal sequence, which waspreviously thought to be an anticline fold cored by ultramaficvolcanic rocks. The stacked volcanic rocks at Hoyle Pond cor-
relate with the Hersey Lake and Central Formations of theTisdale assemblage.
In contrast to the Holloway mine (Ropchan et al. 2002),which is hosted in similar rocks ~100 km to the east of Tim-mins, there is no correlation between the Fe/Mg ratio of thehost rock and gold mineralization at Hoyle Pond (Fig. 15).However, the high Mg tholeiitic basalts are significantly moreenriched in mobile elements than Fe-rich tholeiitic basaltssuggesting that, in this deposit, the high Mg tholeiitic basaltwas more prone to reaction with the hydrothermal fluids.
The mineralizing fluid was injected during isoclinal foldingand thrusting associated with D4 and D3. Mineralized fault-fillveins were emplaced in shear zones located at lithologic con-tacts. Two generations of fault-fill veins are present at HoylePond; in the north volcanic package fault-fill veins are hostedin D3 structures, and in the south volcanic package, more pre-cisely the 1060 fault zone, the fault-fill veins formed during D4.
Analyses of geochemical data show that the REE, Al, Zr, Ti,and Y were relatively immobile during alteration. The alter-ation associated with Au-bearing quartz-carbonate veins iszoned and consists of an inner sericite alteration and an outeralbite alteration zone. Carbonate alteration is ubiquitous. Thesericite alteration zone is composed of muscovite, Cr mus-covite (“fuchsite”), quartz, carbonate, arsenopyrite, pyrite,tourmaline, and graphite, with a concomitant enrichment inK2O, Cr, SiO2, CO2, As, and S. The albite alteration zone iscomposed of albite, quartz, and carbonate, with enrichmentin Na2O, CO2, and SiO2.
Cr is significantly enriched proximal to mineralized veinsand was likely introduced by an oxidized fluid in the mobilehexavalent state, whereas gold and carbon were likely trans-ported in reduced fluids. Thus it is hypothesized that a re-duced C-, B-, As-, Au-bearing fluid mixed with an oxidizedfluid carrying Cr, thereby precipitating gold. Trace concen-trations of organic matter preserved in graphitic shear andgraphite alteration and enrichment of As and B suggests thattheses components were derived from a sedimentary source,most likely the subjacent Porcupine assemblage sedimentaryrocks. Gold may also have come from the sedimentary rocks.
1360 DINEL ET AL.
0361-0128/98/000/000-00 $6.00 1360
0
1
2
3
4
5
6
0 0,5 1 1,5 2 2,5 3 3,5 4 4,5
Au (ppm)
Fe/
Mg
FIG. 15. Plot of bulk Fe/Mg ratio vs. Au content in volcanic rocks of the1060 fault zone, 720-m level. Note that, with the exception of three points,Au concentration does not increase with Fe/Mg ratios.

We postulate that the Porcupine assemblage sedimentaryrocks were transported to depth by burial, folding, and thrust-ing, and fluids were expelled and migrated along D3 and D4
structures (thrust faults; Fig. 16). These reduced fluids werefocused into porous and permeable volcanic rocks and mixedwith locally derived oxidized Cr-bearing fluids to precipitategold. Circulation of hydrothermal fluids was reinitiated dur-ing D4. Alternatively, the bulk of the mineralization is syn-D4
and was locally injected in previously formed D3 structures.
AcknowledgmentsWe thank David Rhys for constructive discussions (on out-
crops) on the structural evolution of the Hoyle Pond depositsand the Timmins Gold camp. We also acknowledge a fruitfuldiscussion with Howard Poulsen. ED is grateful to KeithBenn for numerous discussions on Archean tectonics. Wethank him, Benoit Dubé, Norman Duke, Damien Gaboury,
and, in particular, Bruno Lafrance for their insightful reviewsthat considerably improved the focus and clarity of the man-uscript. Ian Clark provided discussion on oxidation reactionsin aqueous environments and Henri Dinel on organic geo-chemistry. The geologic staff of the Porcupine Joint Ventureis thanked for providing maps, drill log, training, under-ground assistance, and their knowledge of the mine.
The Ontario Geological Survey is thanked for providing nu-merous geochemical analyses. We thank Tito Scaiano and hisgroup in the chemistry department at the University of Ot-tawa for help with the ultraviolet absorption measurementand also Glenn Facey of the chemistry department for theNMR analysis. Peter Jones (Earth Sciences Dept., CarletonUniversity) provided electron microprobe analysis and RonHartree (Earth Sciences Dept., University of Ottawa) pro-vided the XRF analysis. The G.G. Hatch Stable Isotope Lab-oratory (University of Ottawa) provided the carbon isotope
LITHOGEOCHEMICAL & STRATIGRAPHIC CONTROLS ON Au MINERALIZATION, HOYLE POND MINE, TIMMINS, ON 1361
0361-0128/98/000/000-00 $6.00 1361
S N~5km
~10km
250 Co
300 Co
350 Co
CHx-AU(HS) +B + As
CHx-AU(HS) +B + As
CHx-AU(HS) +B + As
Cr VI + K+ Na
+
+
Brittle-Ductilezone
Head frame
350 Co
300 Co
FIG. 16. A schematic illustration of the structure in the Hoyle Pond area (not to scale), during D3 and D4 indicating pos-sible geothermal gradients and flow lines for hydrothermal fluids containing Au, B, and As, as well as sites of deposition ofmetals as well as Cr, K, and Na in the brittle-ductile transition zone.

analysis. Benoit-Michel Saumur provided able field assistanceduring the summer of 2004.
The research was financed by a cooperative research devel-opment grant from the Porcupine Joint Venture and the Nat-ural Science and Engineering Research Council to ADF forwhich we are grateful.
REFERENCESAnderson, J.R., 1975, Structure of metallic catalyst: New York, Academic
Press, 469 p.Arndt, N.D., 1975, Ultramafic rocks of Munro Township and their volcanic
setting: Unpublished Ph.D. thesis, Toronto, Ontario, University of Toronto,192 p.
Ayer, J.A., Thurston, P.C., Bateman, R., Dubé, B., Gibson, H.L., Hamilton,M.A., Hathway, B., Hocker, S.M., Houlé, M.G., Hudak, G., Ispolatov, V.O.,Lafrance, B., Lesher, C.M., MacDonald, P.J., Péloquin, A.S., Piercey, S.J.,Reed, L.E., and Thompson, P.H., 2005, Overview of results from theGreenstone Architecture Project: Discover Abitibi Initiative: Ontario Geo-logical Survey Open File Report 6154, 175 p.
Bateman, R., Ayer, J.A., Barr, E., Dubé, B., and Hamilton, M.A., 2005, TheTimmins-Porcupine gold camp, northern Ontario: the anatomy of anArchean greenstone belt and its gold mineralization: Discover Abitibi Ini-tiative: Ontario Geological Survey Open File Report 6158, 90 p.
Bleeker, W., 1999, Structure, stratigraphy and primary setting of the KiddCreek volcanogenic massive sulfide deposit: A semiquantitative recon-struction: ECONOMIC GEOLOGY MONOGRAPH 10, p. 71–122.
Bohlke, J.K., 1989, Comparison of metasomatic reactions between a com-mon CO2-rich vein fluid and diverse wall rocks: Intensive variables, masstransfers, and Au mineralization at Alleghany, California: ECONOMIC GE-OLOGY, v. 84, p. 291–327.
Born, P., 1995, A sedimentary basin analysis of the Abitibi greenstone belt inthe Timmins area, northern Ontario, Canada: Unpublished Ph.D. thesis,Ottawa, Carleton University, 489 p.
Brisbin, D.I., 1997, The geological setting of gold deposits in the Porcupinegold camp, Timmins, Ontario: Unpublished Ph.D. thesis, Kingston, ON,Queen’s University, 523 p.
Deer, W.A., Howie, R.A., and Zussman, J., 1992, An introduciton to the rock-forming minerals, 2nd ed.: New York, Longman Scientific and Technical,696 p.
Dinel, E., 2001, Structural investigation of the Echo Bay and internationalproperties, Timmins, Ontario: Unpublished B.Sc. thesis, Ottawa, Ontario,University of Ottawa, 20 p.
——2007, A litho-geochemical, alteration and structural investigation of theHoyle Pond gold mine, Timmins, Ontario: Controls on mineralizationwithin meta-volcanic rocks: Unpublished Ph.D. thesis, Ottawa, Ontario,University of Ottawa, 248 p.
Dinel, E., Saumur, B.M., and Fowler, A.D., 2008, Spherulitic aphyric pillowlobe metatholeiitic dacite lava of the Timmins area, Ontario, Canada: Anew Archean facies formed from superheated melts: ECONOMIC GEOLOGY,v. 103, p. 1365–1378.
Downes, M.J., Hodges, D.J., and Derweduwen, J., 1984, A free carbon- andcarbonate-bearing alteration zone associated with the Hoyle Pond gold oc-currence, Ontario, Canada, in Foster, R.P., ed., Gold ‘82: The geology, geo-chemistry and genesis of gold deposits: Rotterdam, A. A. Balkema, p.435–448.
Dunbar, R.D., 1948, Structural relations of the Porcupine ore deposits, inWilson, M.E., ed., Structural geology of Canadian ore deposits: Montreal,Quebec, Canadian Institute of Mining and Metallurgy Symposium, JubileeVolume, p. 442–456.
Farmer, B.C., and Morrison, R.I., 1960, Chemical and infrared on phramitespeat and its humic acid: Science Proceeding Royal Dublin Society, SeriesA1, p. 85–104.
Faure, G., 1998, Principles and applications of geochemistry, 2nd ed.: Pren-tice Hall, 600 p.
Ferguson, S.A., Buffman, B.S.W., Carter, O.F., Griffis, A.T., Holmes, T.C.,Hurst, M.E., Jones, W.A., Lane, H.C., and Longley, C.S., 1968, Geology ofore deposits of Tisdale Township, District of Cochrane. Timmins: OntarioDepartment of Mines Geological Report 58, 117 p.
Fowler, A.D., and Doig, R., 1983, The significance of Europium anomaliesin the REE spectra of granites and pegmatites, Mont Laurier, Québec:Geochimica et Cosmochimica Acta, v. 47, p. 1131–1137.
Grant, G.A., 1986, The isocon diagram—a simple solution to Gresen’s equa-tions for metasomatic alteration: ECONOMIC GEOLOGY, v. 82, pp. 1976–1982.
Henry, S., 2000, Influence de la vapeur d’eau sur l’oxydation à haute tem-pérature du chrome et de quelques aciers inoxydables férritiques stabilisés:Unpublished Ph.D. thesis, Grenoble, France, Institut national polytech-nique de Grenoble, 190 p.
Hodges, D.J., 1982, Alteration associated with gold mineralization near theOwl Creek deposit: Unpublished B.Sc. thesis, Waterloo, ON, University ofWaterloo, 39 p.
Jensen, L.S., 1976, A new cation plot for classifying subalkalic volcanic rocks:Ontario Department of Mines Miscellaneous Paper 66, 22 p.
Jones, W.A., 1948, Hollinger mine: Montreal, Canadian Institute of Miningand Metallurgy Special Volume 1, p. 464–481.
Kim, C., Zhou, Q., and Deng, B., 2001, Chromium(VI) reduction by hydro-gen sulfide in aqueous media: Stoichiometry and kinetics: EnvironmentalScience and Technology, v. 35, p. 2219–2225.
Kerrich R., Wyman, D., and Hollings, P., 1999, Trace elements systematics ofMg-, to Fe-tholeiitic basal suites of the Superior province: Implications forArchean mantle reservoirs and greenstone belt genesis: Lithos, v. 46, p.163–187.
Kretz, R., 1985, Calculation and illustration of uncertainty in geochemicalanalysis: Journal of Geological Education, v. 33, p. 40–44.
McCuaig, T.C, and Kerrich, R., 1998, P-T-t-deformation-fluid characteristicsof lode gold deposits: Evidence from alteration systematics: Ore GeologyReviews, v. 12, p. 381–453.
Melnik-Proud, N., 1992, The geology and ore controls in and around theMcIntyre mine at Timmins, Ontario, Canada: Unpublished Ph.D. thesis,Kingston, ON, Queen’s University, 353 p.
Michard, A., and Albarède, F., 1986, The REE content of some hydrother-mal fluids: Chemical Geology, v. 55, p 51–65.
Moritz, R.P., and Crocket, J.H., 1991, Hydrothermal wall-rock alteration andformation of the gold-bearing quartz-fuchsite vein at the Dome mine, Tim-mins area, Ontario, Canada: ECONOMIC GEOLOGY, v. 86, p. 620–643.
Olivo, G.M., and Williams-Jones, A.E., 2002, Genesis of the auriferous Cquartz-tourmaline vein of the Siscoe mine, Val d’Or district, Abitibi sub-province, Canada: Structural, mineralogical, and fluid inclusion constraints:ECONOMIC GEOLOGY, v. 97, p. 929–947.
Pyke, D.R., 1982, Geology of the Timmins area, District of Cochrane: On-tario Geological Survey Report 219, 141 p.
Robert, F., 2001, Syenite-associated disseminated gold deposits in the Abitibigreenstone belt, Canada: Mineralium Deposita, v. 36, p. 503–516.
Ropchan J.R., Fowler A.D., Benn K., Ayer J., Berger B., Dahn, R., Labine,R., and Amelin, Y., 2002, Host rock and structural controls on the natureand timing of gold mineralization at the Holloway mine, Abitibi sub-province, Ontario: ECONOMIC GEOLOGY, v. 97, p. 291–309.
Rye, K.A., 1987, Geology and geochemistry of the Hoyle Pond gold deposit,Timmins, Ontario: Unpublished M.Sc. thesis, London, University of West-ern Ontario, 220 p.
Sapek, B., Sapek, A., and Okruzko, H., 1980, Optical properties of alkalinesoil extracts as a test characterizing humic substances from peat soils: In-ternational Peat Society Meeting, 6th, Duluth, Minnesota, August 1980,Proceedings, 735 p.
Sass, B.M., and Rai, D., 1987, Solubility of amorphous chromium(III)-iron(III) hydroxide solid solutions: Inorganic Chemistry, v. 26, p. 2228–2232.
Seward, T.M., 1973, Thio complexes of gold and the transport of gold in hy-drothermal ore solutions: Geochimica et Cosmochimica Acta, v. 37,p.379–399.
Shelton, K.L., McMenamy, T.A., Van Hees, E.H.P., and Falck, H., 2004, De-ciphering the complex fluid history of a greenstone-hosted gold deposit:Fluid inclusion and stable isotope studies of the Giant Mine, Yellowknife,Northwest Territories, Canada, v. 99, p 1643–1663.
Sun, S.S., and McDonough, W.F., 1989, Chemical and isotopic systematicsand oceanic basalts: Implications for mantle composition and processes, inSaunders, A.D., and Norry, M.J., eds., Magmatism in the ocean basins:London, Geological Society of London, p. 315–345.
Szulczewski, M.D., Helmke, P.A., and Bleam, W.F., 2001, XANES spec-troscopy studies of Cr (VI) reduction by thiol in organosulphur compoundsand humic substances: Environmental Science Technology, v. 35, p.1134–1141.
Thompson, P.H., 2005, A new metamorphic framework for gold explo-ration in the Timmins-Kirkland Lake area, western Abitibi greenstone
1362 DINEL ET AL.
0361-0128/98/000/000-00 $6.00 1362

belt: Discover Abitibi Initiative: Ontario Geological Survey Open File Re-port 6162, 104 p.
Thornton, E.C., and Amonette, J.E., 1999, Hydrogen sulfide gas treatmentof Cr.(VI)-contaminated sediment samples from a plating-waste disposalsite—implications for in-situ remediation: Environmental Science Tech-nology, v. 33, p. 4096–4101.
Vaillancourt, C., Pickett, C.L., and Dinel, E., 2001, Precambrian geology;Timmins, West-Bristol, and Ogden Townships: Ontario Geological SurveyReport P3436.
Van Hees, E.H.P., Shelton, K.L., McMenamy, T.A., Ross, L.M., Cousens,B.L., Falck, H., Robb, M.E., and Canam, T.W., 1999; Metasedimentary in-fluence on metavolcanic-rock-hosted greenstone gold deposits: Geochem-istry of the Giant mine, Yellowknife, Northwest Territories, Canada: Geol-ogy, v. 27, p. 71–74.
Whipple, E.R., 1974, A study of Wilson’s determination of ferrous iron sili-cates: Chemical Geology, v. 14, p. 119–134.
Wilson, A.D., 1960, The micro-determination of ferrous iron in minerals bya volumetric and calorimetric method: Analyst, v. 85, p. 823–827.
Wyman, D.A., 2003, Upper mantle processes beneath the 2.7 Ga Abitibi belt,Canada: A trace element perspective: Precambrian Research, v. 127, p.143–165.
Zouboulis, A.I., Kydros, K.A., and Matis, K.A., 1995, Removal of hexavalentchromium anions from solutions by pyrite fines: Water Resource, v. 29, p.1755–1760.
LITHOGEOCHEMICAL & STRATIGRAPHIC CONTROLS ON Au MINERALIZATION, HOYLE POND MINE, TIMMINS, ON 1363
0361-0128/98/000/000-00 $6.00 1363

0361-0128/98/000/000-00 $6.00 1364