lloyd's register integrated fatigue design assessment …
TRANSCRIPT

LLOYD'S REGISTER INTEGRATED FATIGUE DESIGNASSESSMENT SYSTEM
Abstract
This paper describes the multi-level fatigue designassessment procedure developed by Lloyd's Registerto estimate the fatigue strength of ship structuraldetails. The method used to determine a
representative fatigue strength capability for shipstructural details, and the supporting fatigue testingprogramme of large ship structure are reviewed. Thetraditional maximum lifetime load approach toestimate the fatigue demand is discussed, and thespectral analysis procedure adopted in the subjectprocedure is described. Examples of distribution offatigue damage around the hull envelope are given toillustrate the influence of the load components, andthe wave environment.
1. INTRODUCTION
The objectives of Ship Classification are to developand implement Rules and Regulations, which in
conjunction with proper care and operation on thepart of the shipowner and operator, will provide anappropriate standard of structural strength during theservice life of the ship. On the provision of anadequate level of maintenance associated withregular structural surveys and appropriate repairprocedures for incidental structural damages,Classification Society Rules are intended tosafeguard the structural integrity of the hull structurefor a service life period of at least 20 years.Computational structural analysis methods combinedwith service experience of large and complex shipstructures have shown that success or failure in astructural sense, is directly affected by theperformance of structural details. The failure ofstructural details is generally associated with twointerrelated cumulative damage processes, namely,fatigue and corrosion, Violette (1994). As early as1913, Lloyd's Register expressed its concern on thefatigue mode of failure of ship structural details in a
Ab. No. 021
Franck L. M. Violette, DUT., M.ENG.
Advanced Studies & Rule Development GroupTechnical Planning & Development Department
Lloyd's Register of Shipping - Ship Division71, Fenchurch Street
London, EC3M 4BS, United Kingdom
paper presented to the Royal Institution of NavalArchitects, Lloyd's Register (1913). Over the lastdecade, fatigue failures of structural details and theirpotential consequences have attracted an increasedattention amongst the shipping industry. In view of thehigher percentages of high tensile steel being used,the application of sophisticated techniques to peormstructural and fabrication optimisation, and theimplementation of strict environmental regulations, theoccurrence of fatigue cracking cannot be consideredany longer as a mere fact of life. Since fatigue crackscan be possible points of initiatión for the failure of thecargo containment barrier, and/or significant structuralfailures, it is essential that fatigue performance begiven a more detailed consideration at the design,and construction stages as well as during the ship'soperational life.
In 1989, Lloyd's Register (LR) initiated a long termresearch and development programme with the aimto develop and implement an integrated fatiguedesign assessment procedure for ship structuraldetails. In June 1994, ShipRight FDA (FatigueDesign Assessment), a multi-level integrated fatiguedesign procedure has been released to world-wideLR plan approval offices and to shipyards. This paperreviews the main components of the research project,and outlines the level 2 ShipRight FDA integratedfatigue design assessment procedure. Some of themore salient aspects of the procedure are illustratedwith examples from the fatigue analysis of thelongitudinal members of a double hull tanker.
2. SHIP STRUCTURAL DETAIL FATIGUE DESIGN
2.1 GeneraI
Whilst for at least the past two decades, ClassificationSocieties have carried out fatigue calculations fordamaged or novel ship structural components,procedures or criteria for the design against fatiguehave not been explicitly or rationally considered in
1/17
TECHgßsc UN1VERSITJ.Taboratorum 'oor
Mekelweg 2, 2628 CD Oftlei: 015 768 Fax: 015 7a

Classification Society's Rules until recently, except forspecific ship types such as LNG ships. However,implicit fatigue requirements are incorporated formany structural components through the use ofpermissible stress levels determined from theapplication of simpUfied fatigue damage assessmenttechniques combined with service experience data. Infact, fatigue has been given due considerations at allstages of the Classification process through implicitrequirements or procedures as follows
During the plan approval process, in addition tothe use of permissible stress levels, the surveyorapplies particular attention to the design of criticalstructural details by using a set of experiencebased detail design recommendations compiledover the years. This s carried out in close co-operation with the ship designers in order toachieve the best solution in terms of both thefatigue performance and fabrication;
During the construction stage, the field surveyorassigns particular attention to the critical areaswhich have been identified during the planapproval process, in order to ensure thatsatisfactory levels of workmanship, alignment andfit up are achieved;
And, finally, during the life of the ship, the scopeand extent of the periodical surveys give dueattention to the critical structural details, and thedetection of any onset of cracking. Should afatigue crack be detected, remedial action istaken to prevent its reoccurrence, and the surveydata is transferred to the LR damage database foranalysis. Noteworthy defects or increase in
fatigue failure trends of structural components arecommunicated to plan approval surveyors, andRule development engineers, and an implicitfatigue criteria such as a permissible stress level,or a detail design recommendation may beformulated for inclusion in the Rules.
2.2 Limitations of an Experience Based
Procedure
However, it should be recognised that with newgeneration ships such as double hull tankers, thevalue of service experience may not be directlyapplicable. Whilst many of the new oil tankerstructural details can be related to existing hullconfigurations, the increased proportion of hightensile steels, the extent of structural optimisation, aswell as changes in the loading patterns could changethe significance of an experience based procedure,Ferguson & Violette (1991). Significant changes interms of ship structural design and construction, andthe introduction of strict environmental regulationshave called for the development of rational directcalculation fatigue design procedures where thefollowing aspects which are of particular concernneed to be addressed:
The extrapolation of ship structural concepts maynot be directly applicable to new designs, and theservice experience of double hull tanker structuraldetails, especially large double hull tankers, islimited;
Recent experience with high tensile steel used onsecond generation single skin VLCC structureshas shown that when a significant degree ofstructural optimisation has been carried out onthe primary web structures, the additional loadscreated on the secondary members may increasethe risk of fatigue damage;
With double hull tankers, cargo leakage as aresult of fatigue cracking would result in seriousdifficulties to clean and/or ventilate the double hullspaces due to their cellular arrangement.Moreover, leakage of cargo oil, or inert gas intothe ballast spaces would place the ship in ahazardous situation with potential risks ofexplosion, loss of life, and environmental disaster;
The ship structural performance and life could beseverely influenced by the ballast tank coatingperformance. The initiation of fatigue cracks in theballast spaces may precede coating breakdown.If undetected, or if no remedial action has beentaken, the localised coating breakdown in way ofa detail stress concentration will create a severelocalised corrosion cell, which in turn willaccelerate the fatigue crack propagation process,Violette (1994);
The quality of the workmanship, and theconstruction tolerances may influence the fatigueperformance of ship structural details. Fatiguecracking as a result of poor detail design may bedifficult to cure without significant and expensivestructural modifications.
3. ShipRight FDA FATIGUE DESIGN
ASSESSMENT
lt can be appreciated that the evaluation of fatigueperformance of ship structural details is a complexprocess, and that fatigue failures may have dramaticconsequences. To attain and maintain a satisfactoryfatigue performance, a realistic fatigue procedureshould give due consideration to the following stagesin the life of a structural detail
The conceptual design of ship structural details;
The analysis of the fatigue performance by adirect calculation method giving due considerationto the cumulative nature of the fatigue damageprocess, and accounting for fabrication andworkmanship factors;
Ab. No. 021 2/17

The verification of the structural detailsworkmanship, alignment and fit-up tolerances,through adequate survey procedures and defectsacceptance criteria during the ship construction;
The in-service survey procedures, and themonitoring of the critical structural detail itemsduring the ship lifetime.
For this purpose, ShipRight FDA (1994) has beendeveloped as a multi-level fatigue design assessmentprocedure (Level 1,2 and 3) to address each of therequirements highlighted above. The procedure is atotal approach to the prevention of fatigue failuresencompassing the design, construction and in-serviceperformance of ship structural details. lt s supportedby the ShipRight CM (1994) Construction Monitoringprocedure. and the ShipRight HCM (1994) HullCondition Monitoring procedure. The main features ofthe multi-level FDA procedure are reviewed in thefollowing sections.
LEVEL 1: STRUCTURAL DETAIL DESIGN
GUIDE
The primary purpose of the Structural Detail DesignGuide is to promote good detail design at an earlystage of the design process, and to provide guidancefor improvement of detail design. The Guide has beencompiled from the world-wide detail design and the in-service expertise of plan approval, newbuilding andfield surveyors. Therefore, it is based on a vastexperience based knowledge database consideringaspects such as design and analysis, constructiontolerances and fabrication issues, and in-serviceperformance. In addition, extensive analytical, andFinite Element Analyses (FEA) have been performedfor each recommended structural details to confirmand optimise the structural configuration to maximiseits fatigue performance. A typical Structural DetailDesign Guide datasheet is shown in Figure 1. Atpresent, the Structural Detail Design Guide addressesdouble hull tanker, and bulk carrier critical areas. Thedevelopment of the Guide is considered to be acontinuous process with regular updates to reflecttrends in service experience, design and constructionpractice as well as to incorporate results from theongoing FDA and FEA studies, and LR fatigue testingprogramme.
SHIP STRUCTURAL DETAIL FATIGUE
STRENGTH
For design purposes, the S-N curve approach to theestimation of the fatigue strength capability is
considered to be the most common and convenientapproach. However, the assignment of a S-N curve toa ship structural detail will invariably involve a certainamount of engineering judgement. To ensure that theFDA procedure could be applied consistently, it wasconsidered essential to automate the S-N curve
selection process. This task is performed by the FDAS-N Curve Expert procedure.
5.1 NominaI and Reference S-N Curve
The traditional nominal stress S-N curve approach sexpressed as a function of the nominal stress rangeAS for a given typical structural detail as follows:
(1)
Traditional nominal stress S-N curves are widelyavailable from design codes such as BS5400 (1980),UK.Den (1983), Eurocode (1985), 11W proposal(1982), etc. In general, these standard are applicableto a limited set of typical standard details. In view ofthe large variety of ship structural details in terms ofboth geometry and loading, the application ofstandard detail S-N curves has shown to be a difficultprocess. Comparative fatigue studies correlated withservice experience and/or full scale measurementshave shown that standard S-N curves may yieldfatigue lives significantly different from the recordedvalues.
A more explicit method to apply the standard S-Ncurves to ship structural details is to derive,, thegeometrical Stress Concentration Factor (SCF) of thestandard detail geometry, as well as the SCF of theship structural detail, in order to obtain a morerepresentative S-N curve. The S-N curve maytherefore be rewritten as follows
shipN
1\ K,d
=
j,fl'
ASK,d '
The disadvantages of this approach is thatgeometrical information on the standard S-N Curvestructural detail is often limited, and FEA withcompatible mesh size for both the standard structuraldetail, and the ship structural detail is required todetermine the SCF's. Moreover, it should be borne inmind that standard S-N curves tend to represent thelower limit of fatigue capability of the standard detaili.e. geometrical and scantling configuration leading tothe worst fatigue strength within the scope ofapplication of the detail. For example, the transitionbetween BS5400 (1980) Class F and F2 is dictatedonly by the attachment length (150 mm), and theedge distance (10 mm), and no reference is made, forexample, for the influence of the plate thicknesses.
To enable a more representative estimation of thefatigue strength for ship structural detail within the
Ab. No. 021 3/17
( 2)

Fig. I Structural Detail Design Guide Typical Datasheet
Lloyd's Register - ShipRight Strategic Research & Development Page 5
rLOCATION: Connection of side and longitudinal bulkhead longirudinais
to transverse webs in double side tanksEXAÍVWLE No. 1: Asymmetrical face/higher tensile steel side longTh.idinal to
transverse web flat-bar stifferters
GROUPNo. i
CRITICAL AREAS DETAll. DESIGN IMPROVEMENT
SHELLPLATING ______________
-
BULKHEAD
x
NOTE
SOIT
SOFT//EEL
TOE [1 SOFTÁMD OR SR4CKETS
DETAIL
è4AX1 (M
S)-A1A1ETRIC4LTOE
h-MAX 15
L2.Od
U U
liLi U
4cRmcALAREAS
B,ac*etÁ.th,nwm
o.J
75 4X 0.5)
4
--MAX15I
ThIckness Flat Sa,Thickness 12Omm
-4-MAX15
Thickness
I
=6/18
djd180-300
Area of stiffeneraccordancewithRule requirements
CONSIDERATION ITEMS FOR IMPROVEMENT
Critical Location: Asymmetrical face / higher tensile steel side longitudinal face bar connections at the heeland the toe of the web stiffeners. Connections between the base line and O.8D above thebase line.
Fatigue Mechanism: Soft toe and heel detail or symmetrical soft toe brackets to reduce peak stresses underfatigue loading from dynamic seaway loads and ship motions.
Building Tolerances: Ensure alignment of the web stiffener, the back bracket and the web of the sidelongitudinal.
Welding Requirements: Fillet welding having mínimum weld factor of 0.44 (Web stiffeners to face bars of sidelongitudinals. Back brackets to face bars of side longitudinals).A wrap around weld, free of undercut or notches, around the plate thickness.
FIGUREi
DETAIL DESIGN GUIDELINES FOR DOUBLE HULLTANIR STRUCTURAL DETAILS
FIGURE

framework of a design procedure, it was considered Ka = Kg(R,tid7.la,d,c,th)Kje)K,i(ö)K,(e) (5)that:
The nominal stress should remain the referencestress used for FDA purposes, as it is aconvenient stress measure for engineers involvedin structural design assessments;
And, a large library of S-N curves based onactual ship structural detail geometries should bemade available.
To satisfy these requirements, the hot spot stressapproach was reformatted as follows
Thus,
=
N = IÇ(Ka AX)"
N=nl, ShI
Based on FEA of standard structural details, and theavailable S-N curves data, a reference S-N curvedefined by K1, has been evaluated. The referenceS-N curve represent the fatigue strength of thewelded material including the fillet weld geometricalstress concentration. The geometrical SCF of the shipstructural detail then becomes the driving parameterto estimate the fatigue strength, and its derivation isreviewed in the following Section. For referencepurposes, the S-N curves derived by the FDA S-NCurve Expert procedure are assigned a value whichrepresent the stress range magnitude of the mean S-N curve at stress cycles.
5.2 Geometrical Stress Concentration Factor
Based on systematic linear elastic FEA of shipstructural details, parametric formulations of thegeometrical SCF's have been derived. The FEmodelling standard adopted to determine the SCF's isbased on a FE mesh of t x t in way of stressconcentration areas, where t is the thickness of theplate containing the crack initiation site. The SCF hasbeen determined using the centroidal stress normal tothe expected crack plane for the element adjacent tothe theoretical intersection edge. Taking into accountthat the weld factor for the connections underinvestigation is of the order of 0.44t, the SCF stressgradient pick up point is at a minimum distance of0.06t from the weld toe. A typical FE mesh for a softtoe - soft heel web stiffener connectìon to the flangeof a longitudinal member is shown in Figure 2.
The parametric SCF formulation is defined as acombination of influence functions defined as followsfor the end connection geometry shown in Figure 3.
(4)
A-A
tiA-A
nCrltical Locationth
(3)Fig. 3. Stress Concentration Factor Parameters.
The axial loading SCF has been chosen as thereference SCF for the computation of the structuraldetail fatigue strength capability by the FDA S-NCurve Expert. To account for the influence of theSCF's for modes of loading other than axial, loadingmode bias factors are introduced in the computationof the total nominal stress applied to the detail. Theloading mode bias factor for loading componen.t i isdefined as follows
KK =-
B,
Ka(6)
To illustrate the SCF parametric formulation, Figure 4shows the variation of Ka for a soft toe flat bar
stiffener connection with d = loo mm,t1/t2 =1.07th =I5mm,Kw(0)K,,,(S)Ke(e)=l.
Ab. No. 021 5/17
100 150 200 250 300 350SoftToe Radius -mm
Fig. 4. Ka versus Soft Toe Radius
ASh.
K
ç '' h,
K1.350
1.325
1.300
1.275
1.250

Figure 5. illustrates the variation
flat bar stiffener connection
R=I5Omm, th=l5mm,Kw(0)K,,,(Et)Ke(e) = i
K1.350
1.300
1.250
1.200
1.150
1.100
1.00
Fig. 5. K versus t1 ¡t. Ratio
lt can be appreciated that the FDA S-N Curve Expertapproach permits to determine more realistic S-Ncurves for ship structural details, since the S-N curveis a direct function of the SCF, and thus the detailgeometrical parameters.
5.3 Fatigue Testing of Ship Structure Models
To increase the confidence level in fatigue strengthpredictions and to gain a better understanding of thefatigue crack initiation and propagation process inship structural details, Lloyd's Register initiated aprogramme of fatigue testing of large ship structuremodels in 1992. The Krylov Shipbuilding ResearchInstitute in Russia was commissioned to carry outthese tests. There are many benefits associated withperforming large scale fatigue tests of realistic shipstructures which may be summarised as follows
Shipbuilding workmanship standards are used tofabricate the models;
Realistic ship loads are applied to the modelsresulting in a more realistic stress field , stressconcentration levels, and cyclic stress patterns inway of the critical locations;
The kinematics of crack propagation at thepotential crack initiation sites provide valuableinformation with regard to the relative severity ofeach potential crack initiation sites, theirpropagation rates, and the potential consequenceswhen applied to real ship structures;
The assessment of the redundancy level of thestructural system, and the load redistribution
of K for a soft toewith il = 200 mm,
= 300 mm, and
mechanisms which may affect the crackpropagation rates at certain crack initiation sites.
Extensive post analysis using FEA can beperformed to confirm the strain / stressmeasurements, to extend the results to the fullscale structure, and to optimise the structuralconfiguration with respect to fatigue strength;
And, finally, experimental data combined with FEApermits the calibration of the parametricformulations of the SCF's associated with thereference S-N curve which have beenimplemented in the FDA S-N Curve Expert.
To date, the ongoing experimental researchprogramme has addressed the following shipstructural details
1/4 scale models of VLCC hopper weldedconnections to double side and double bottom;
1/4 scale models of VLCC hopper flangedconnections to double side and double bottom;
1/3 scale models of VLCC longitudinal conneconsto web fiat bar stiffener with various endconnections, and steel yield strength.
Photo 1-2 show the large scale ship structuresmodels under testing conditiqns. io to 106 loadcycles are applied to the models which areinstrumented with uniaxial and rosettes strain gaugesto monitor the field and the hot spot stresses.Acoustic monitoring has also been used to determinethe spatial location of the onset of cracking wellbefore the crack could be detected by visualinspection. The crack propagation rates have beenrecorded in order to monitor the crack growth in thestructural components, and enable further analysis tobe performed using fracture mechanics methods.
6. LONG TERM STRESS RANGE SPECTRUM
MODEL
Since the wave environment generates complexloading patterns, it can be appreciated that theprediction of the long term stress spectrum for marinestructures remains a complex problem. Due to thecumulative nature of the fatigue damage process, it isessential that an adequate procedure be used topredict the long term stress range distribution. Figure6. illustrates the distribution of fatigue damage forthree typical long term stress range spectrum definedanalytically as Weibull functions with shape factors of0.8, 1.0, and 1.2. lt is shown that most of the fatiguedamage is produced by the small to medium stressranges i.e. the low to medium seastates, by virtue oftheir associated number of stress cycles ( iO5 to 108
Ab. No. 021 6/17
1.25 1.50 1 75tl/t2 Ratio

oo-cQ-
Nooû-
N-

Fig. 2 Typical Fine Mesh FE Model for Soft Toe Soft Heel Longitudinal End Connection
l. LL L I T.1I ILL L .L L I _[_ J 11.11 i L L -
L L_LL . L LLLLLLL.LL .. -L_[:LLH
..........JL .:...
. :JL U .-. U..........: LI t i t I Il t
f Li 1l(lM:.c&: .. 1 1 t 1.1 LI_t
I . IllllLj i_l I I Lt 'I
L ro:r rr :itif. .. (t11llIllLL _L LL_1LU_
L .J LL.1_l_. ELL - ..L.LLLLLLJJ LJ._i ILl l.i ULLI.rJ.LLL.t .i.L i i.._..IL_[.LJJ.L.LHI!iH...LLLLLLLLLL _L I _L LL L LLLL Lr a
Long Term Weibull 0.80- - - Long Term Weibull 1.20
Fatigue Damage - Weibull 1.00
Long Term Weibull 1.00Fatigue Damage - Weibull 0.80
- - - Fatigue Damage - Weibull 1.20
Fig. 6. Typical Long Term Stress Spectrum and Fatigue Damage Distributions
stress cycles). Therefore, in order to achieve areliable prediction the structural detail fatigue life, the
Ab. No. 021
mathematical model used to predict the long termstress distribution should give due attention to this
8/17
--
/-- I
1E+00 1E+01 1E+02 1E+03 1E+04 1E+05 1E06 1E+07 1E+08
Number of Stress Cycles
5.00E-03
4.00E-03
cl)o)
- 3.00E-03 Eoa)
- 2.00E-03 o)
u-
1.00E-03
0.00E+00
225.00
200.00
175.00
150.00
125.00C)
100.00
g 75.00cl)
50.00
25.00
0.00
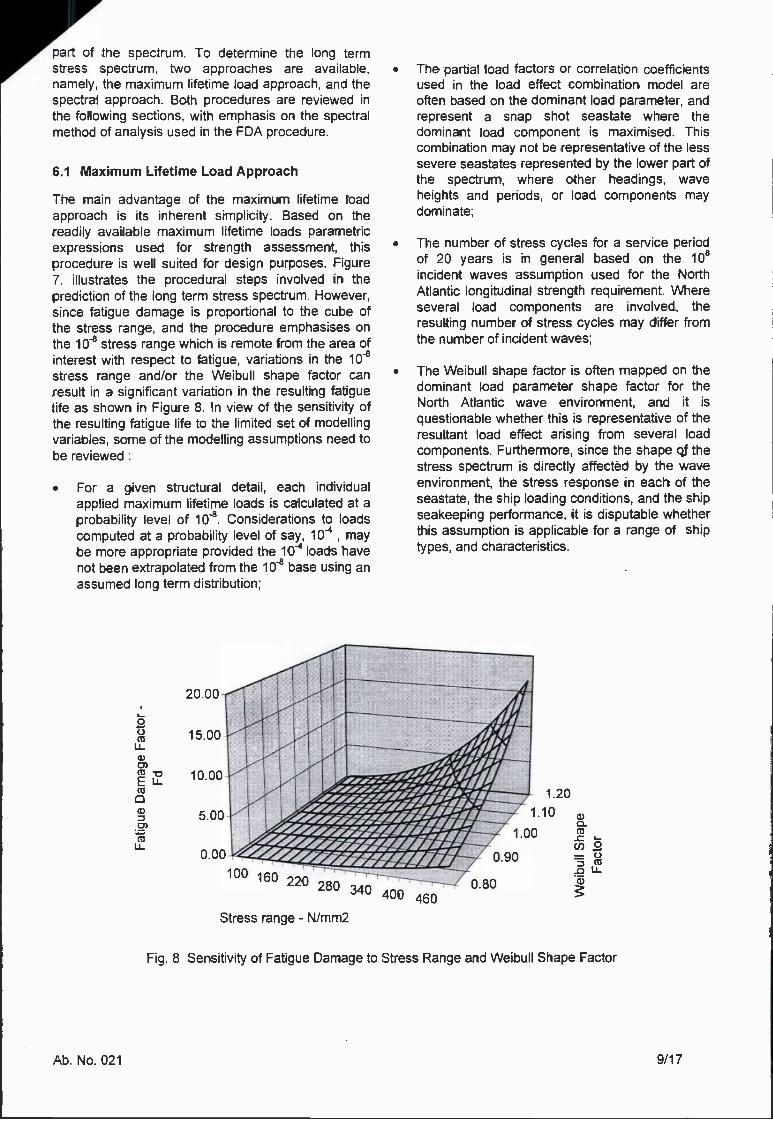
part of the spectrum. To determine the long termstress spectrum, two approaches are available,namely, the maximum lifetime load approach, and thespectral approach. Both procedures are reviewed inthe following sections, with emphasis on the spectralmethod of analysis used in the FDA procedure.
6.1 Maximum Lifetime Load Approach
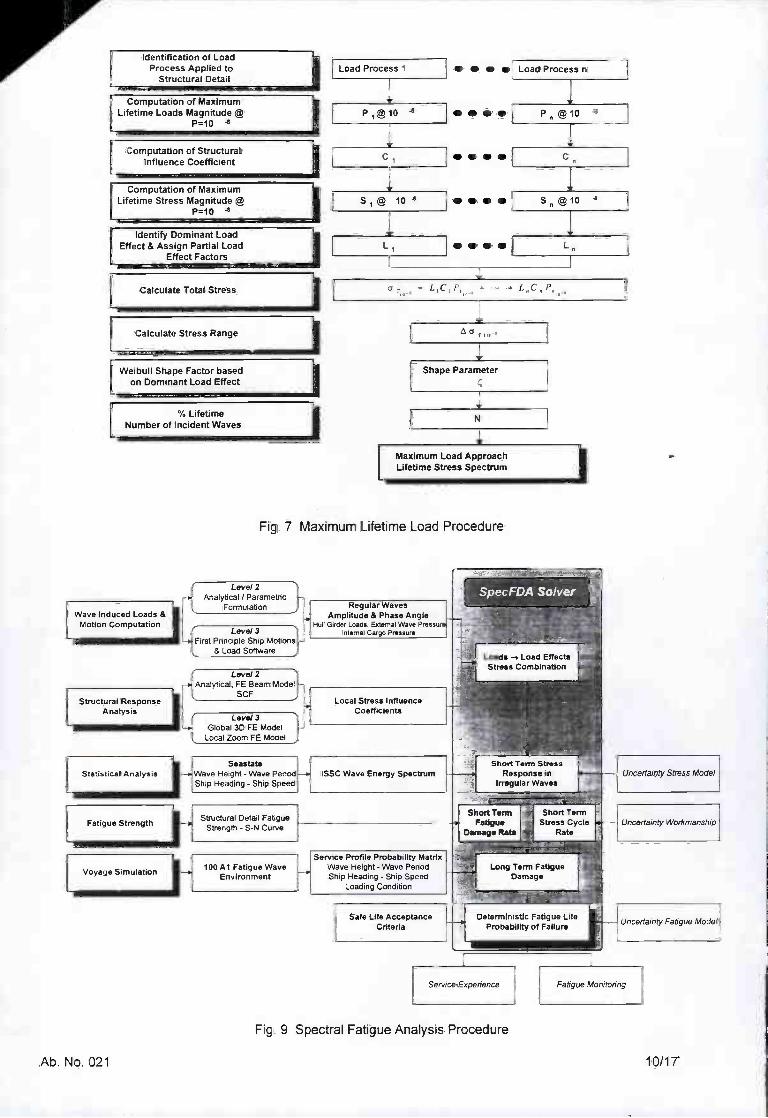
The main advantage of the maximum lifetime loadapproach is its inherent simplicity. Based on thereadily available maximum lifetime loads parametricexpressions used for strength assessment, thisprocedure is well suited for design purposes. Figure7. illustrates the procedural steps involved in theprediction of the long term stress spectrum. However,since fatigue damage is proportional to the cube ofthe stress range, and the procedure emphasises onthe 108 stress range which is remote from the area ofinterest with respect to fatigue, variations in the 108
stress range and/or the Weibull shape factor canresult in a significant variation in the resulting fatiguelife as shown in Figure 8. In view of the sensitivity ofthe resulting fatigue life to the limited set of modellingvariables, some of the modelling assumptions need tobe reviewed:
For a given structural detail, each individualapplied maximum lifetime loads is calculated at aprobability level of 108. Considerations to loadscomputed at a probability level of say, 10 , maybe more appropriate provided the iO4 loads havenot been extrapolated from the 108 base using an
assumed long term distribution;
20.00
10.00
5.00
PiJ11100 in
220 280 ----' 0.80400 460
Stress range - N/mm2
The partial load factors or correlation coefficientsused in the load effect combination model areoften based on the dominant load parameter. andrepresent a snap shot seastate where thedominant load component is maximised. Thiscombination may not be representative of the lesssevere seastates represented by the lower part ofthe spectrum, where other headings, waveheights and periods, or load components maydominate;
The number of stress cycles for a service periodof 20 years is in general based on the 10incident waves assumption used for the NorthAtlantic longitudinal strength requirement. Whereseveral load components are involved, theresulting number of stress cycles may differ fromthe number of incident waves;
The Weibull shape factor is often mapped on thedominant load parameter shape factor for theNorth Atlantic wave environment, and it is
questionable whether this is representative of theresultant load effect arising from several loadcomponents. Furthermore, since the shape of thestress spectrum is directly affected by the waveenvironment, the stress response in each of theseastate, the ship loading conditions, and the shipseakeeping performance, ¡t is disputable whetherthis assumption is applicable for a range of shiptypes, and characteristics.
wC-
_Ccn2oDLLw
Fig. 8 Sensitivity of Fatigue Damage to Stress Range and Weibull Shape Factor
Ab. No. 021 9/17
0.00 0.90
Identification of LoadProcess Applied to
Structural Detail IComputation of Maximum
Lifetime Loads MagnitudeP=lo - I
Computation of StructuralInfluence Coefficient I
Computation of MaximumLifetime Stress Magnitude
P=iO - IIdentify Dominant Load
Effect & Assign Partial LoadEffect Factors I
Weibull Shape Factor basedon Dominant Load Effect I
% LifetimeNumber of Incident Waves I
Wave Induced Loads &Motion Computation
Structural ResponseAnalysts
Statistical Analysis
Fatigue Strength
Voyage Simulation
Levei2 "Analytical / Parametric
Formulation
Level 3- First Principle Ship Motions
& Load Software
Level 2- Analytical, FE Bean, Model
SCF
Levei3e Global 3D FE ModelLocal Zoom FE Model
SeastateWave Height - Wave PeriodShip Heading - Ship Speed
Structural Detail FatigueStrength - S-N Curve
loo Al Fatigue WaveEnvironment
Load Process I
I-
Pr@10
cl
VS1@ 10-e
V
L
= LIC'? +."
Shape Parameter
SpecFDA SoWer
Short Term StressResponse in
Irregular Waves
Deterministic Fatigue LifeProbability of Failure
Regular WavesAmplitude & Phase Angle
Hull Girder Loads, External Wave PressurInternal Cargo Pressure
Local Stress InfluenceCoefficients
SSC Wave Energy Spectrum
Service Profile Probability MatrixWave Height - Wave PeriodShip Heading - Ship Speed
Loading Condition
Safe Life AcceptanceCriteria
N
V
Pn@10 '
C
l IO
L
V
Loads - Load EffectsStress Combination
Short TermFatigue
Damage Rat.
Service Experience
4
Fatigue Monitoring
Uncertainty Stress Model
Uncertainty Workmanship
Uncertainty Fatigue Model
Maximum Load ApproachLifetime Stress Spectrum I
Fig. 7 Maximum Lifetime Load Procedure
Fig. 9 Spectral Fatigue Analysis Procedure
Ab. No. 021 10/17
. Load Process n....
LCalculate Total Stress
ICalculate Stress Range
I

lt can be appreciated that this procedure is subject toa number of assumptions, and modellingsimplifications. To achieve reliable fatigue lifeestimates, calibration using service experience datahas been shown to be essential. Whilst this procedurecannot be rejected as a design tool to obtainefficiently an estimate of the fatigue strength, thesensitivity of the fatigue process, and the dependenceof the required calibration on the service experiencebase make this procedure difficult to apply in a
consistent manner. Furthermore, reduced confidencelevels are introduced when the structuralconfiguration or the loading patterns depart from theservice experience base used for calibration.
6.2 FDA Spectral Analysis Procedure
To enhance the level of confidence in thedetermination of the long term stress spectrum, andaddress the issues of the maximum lifetime loadapproach highlighted above, the FDA procedure usesa first principles approach based on the spectralmethod of analysis. Two levels of analysis have beendeveloped using the same theory, but different levelof mathematical modelling. Level 2 is used for designpurposes and uses simplified mathematical models.Leve! 3 uses sophisticated mathematical models, andis aimed at confirmation of the fatigue performance ofnovel structural details. The procedural steps of Level2 and Level 3 are illustrated in Figure 9
The application of the level 2 procedure to longitudinalmembers of a double hull tanker can be summarisedin the following steps
6.2.1 Computation of Wave Induced LoadsThe wave induced primary load componentsconsidered are
External hydrodynamic wave pressure;
Hull girder vertical wave bending moment;
Hull girder horizontal wave bending moment;
Water ballast/cargo inertia pressure.
The amplitude and phase angle of the above loadcomponents are calculated in regular waves for thefollowing ranges of wave parameters for eachsignificant loading conditions as shown in Table 1.
Table i
Ab. No. 021
FDA Level 2 computation of the wave induced loadsis based on a parametric formulation of the ship sixdegrees of motions, and the global and local loads.Using the basic concept of the single degree offreedom vibration model, and the systematic analysisof the computation of the ship motions and loads ofover 250 representative hull forms, the ResponseAmplitude Operator (RAO) for the motions and loadshas been decomposed into a series of influencefunctions based on the work by KSRI (1992)
RAO(V, x,w) = f (V, , [a, ] )f(V, x. [a1 ]_) ( '
For example, for the vertical bending moment, theRAO can be further decomposed to isolate theinfluence parameters as follows:
RAO(V,,w)= fa'80(L,B,T,Fn,Cw,CB,k,j(h)
fa(X)fa (x) L)f (x)(8)
The amplitude function f180(.) determines the
maximum response amplitude which for the verticalbending moment occurs at 180°. The amplitudefunction fa(X)describes the ratio the response tothe maximum response amplitude at 180° for a givenship to wave angle as shown in Figure 10. Theamplitude function f (x) describes the position of the
maximum response amplitude on the wave frequencyaxis as shown in Figure 11.
1.00
0.80
0.60
0.40
0.20
Parameter - Range Increment
7. 0-360° 20°0.2-1.2rad/s 0.O4rad/s
V 0-Vs 25%VsLoading Conditions Fully loaded
Ballast
0.00
o 30 60 90 120 150 180
Ship to Wave Heading - Degrees
Fig. 10. Vertical Bending Moment fa(X)
The function f, () describes the RAO basic shapeas a function of the wave frequency, response naturalfrequency, the ship length, and the function f (x).
L (x) is the function describing the longitudinal
distribution of the bending moment.
Expressions in a similar format have been derived forthe horizontal, and torsional bending moments, theship motion six degrees of freedom, and the externalhydrodynamic wave pressure RAO's. Since the phase
11/17
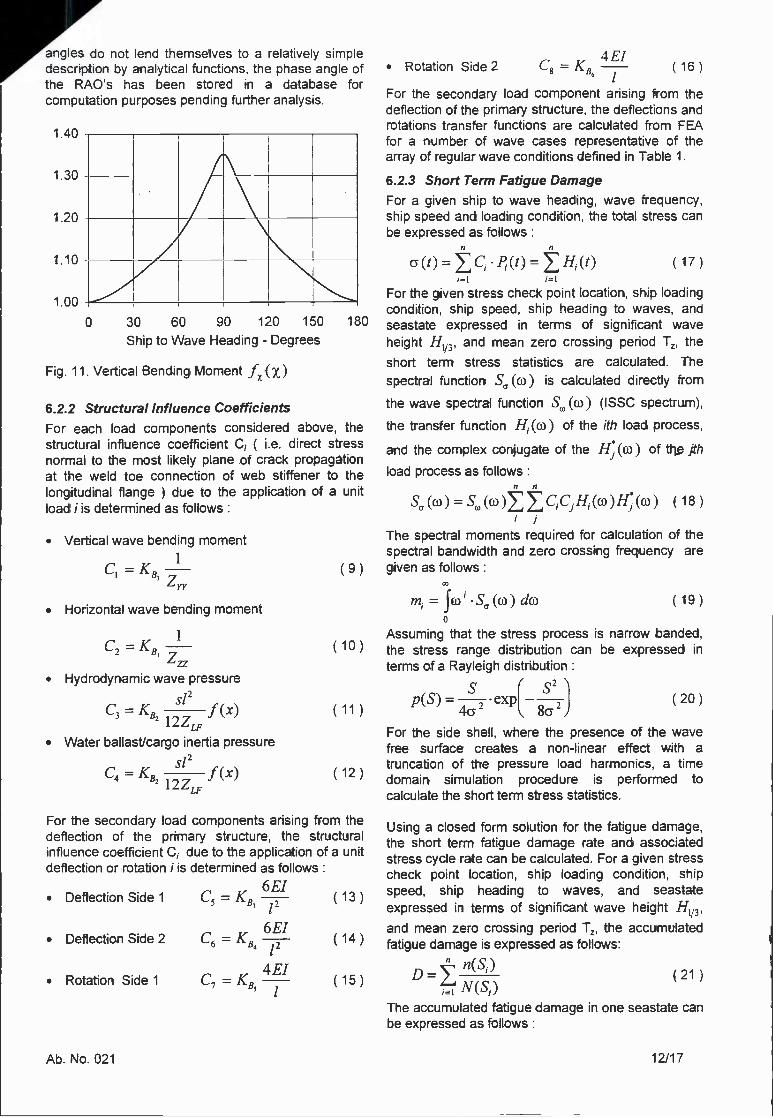
angles do not lend themselves to a relatively simpledescription by analytical functions, the phase angle ofthe RAOs has been stored in a database forcomputation purposes pending further analysis.
1.40
1,30
1.20
1.10
1.00
0 30 60 90 120 150 180
Ship to Wave Heading - Degrees
Fig. 11. Vertical Bending Moment f(x)
6.2.2 Structura! Influence CoefficientsFor each load components considered above, thestructural influence coefficient C, ( i.e. direct stressnormal to the most likely plane of crack propagationat the weld toe connection of web stiffener to thelongitudinal flange ) due to the application of a unitload ¡ is determined as follows
. Vertical wave bending moment
C1 = K8 (9)
. Horizontal wave bending moment
C2 = K13zzz
I
Hydrodynamic wave pressure
C = K812ZLF
f(x)
Water ballasticargo inertia pressure
C4 = K812ZLF
f(x)
C5=KB
6E1C6 = K8
12
4 EIC7=K8
= S (w) dw
Assuming that the stress process is narrow banded,(10) the stress range distribution can be expressed ¡n
terms of a Rayleigh distribution
s s2
4: 2exp
8 -)(20)
For the side shell, where the presence of the wavefree surface creates a non-linear effect with atruncation of the pressure load harmonics, a timedomain simulation procedure is performed tocalculate the short term stress statistics.
(12)
For the secondary load components arising from thedeflection of the primary structure, the structuralinfluence coefficient C due to the application of a unitdeflection or rotation i is determined as follows
Deflection Side 1
Deflection Side 2
Rotation Side 1
4E1Rotation Side 2 Ç = K1
/(16)
For the secondary load component arising from thedeflection of the primary structure, the deflections androtations transfer functions are calculated from FEAfor a number of wave cases representative of thearray of regular wave conditions defined in Table 1.
6.2.3 Short Term Fatigue DamageFor a given ship to wave heading, wave frequency.ship speed and loading condition, the total stress canbe expressed as follows
n
(17)
For the given stress check point location, ship loadingcondition, ship speed, ship heading to waves, andseastate expressed in terms of significant waveheight H113, and mean zero crossing period T, theshort term stress statistics are calculated. The
spectral function S (w) is calculated directly from
the wave spectral function S(w) (ISSC spectrum),
the transfer function H1 (w) of the ith load process,
and the complex conjugate of the H(co) of th jth
load process as follows:
S(w)=S(w)C,C1H,(w)H(w) (18)
The spectral moments required for calculation of thespectral bandwidth and zero crossing frequency aregiven as follows
Ab. No. 021 12/17
(19)
Using a closed form solution for the fatigue damage,the short term fatigue damage rate and associatedstress cycle rate can be calculated. For a given stresscheck point location, ship loading condition, shipspeed, ship heading to waves, and seastateexpressed ¡n terms of significant wave height H113,
and mean zero crossing period T, the accumulatedfatigue damage ¡s expressed as follows:
D='' (21)N(S,)
The accumulated fatigue damage in one seastate canbe expressed as follows
D=
= Tu and
K
+ i 1m,Uo =-:
The deterministic fatigue damage accumulated in agiven seastate can be obtained from the followingexpressions
TB " QD= (25)
(22)
For a narrow banded process, the accumulatedfatigue damage in one seastate may be rewritten asfollows:
B"n
KJS"p(S) dS t(m,m1,S0,B) (23)I)
j..i(m,m1 ,S0, B)(2J)" "F
Since the stress process is not a strictly narrowbanded process, a rainflow correction factor X(m,c)is introduced to remove the conservatism due to thenarrow band assumption, Wirshing (1977). Theexpected number of stress cycles is obtained from thestress process zero crossing frequency as follows
(24)
m+1 (26)2
For each seastate, the short-term fatigue damageaccumulation rate, and stress cycle rate arecomputed to enable the computation of the long termfatigue damage.
6.2.4 Voyage SimulationSince fatigue damage is a cumulative process, andthe long term stress range distribution is a function ofthe long term wave environment, it is essential thatdue consideration is given to the derivation of arealistic wave environment. Using a concept similar to100 Al longitudinal strength standard based on theNorth Atlantic wave environment, the 100 Al fatiguewave environment standard has been formulated. lt iscomputed systematically for a combination of tradingroutes for the ship type, and ship characteristicssubject to the FDA investigation. The trading routesare a direct function of the ship type, and they havebeen determined from statistical analysis of world-wide trading pattern. The Global Wave Statistics data,BMT (1986), is used to determine a service profilematrix giving the probabilities of occurrence of theseastates defined in terms of significant wave height,mean wave period, loading condition, ship to waveheading and service speed.
6.2.5 Computation of Long Term Fatigue DamageThe total lifetime accumulated fatigue damage Dt overa specified service period Ts is computed from the
Q= X(n ).i(m,m ,B,S0)o(2-.h)"o'
probability matrix of occurrence of the short termseatates as follows'
T,. B"QDt= (27)
K
where Q, = P,P,PkP/, j kl and ¡s the. .k ,1
stress level parameter for a given seastate i,j,k,l
6.2.6 Fatigue Acceptance CriteriaThe fatigue life results are given in two formats asfollows
The conventional deterministic fatigue life formatcalculated with an S-N curve with an associatedprobability of survival of 97,5%, and a fatiguedamage factor of 1,0 for 20 years;
The probabilistic format based on a simple log-norma? format for multiplicative limit state functionsyields a probability of failure and a safety index fora given number of service years Wirshing (1987).
7. DOUBLE HULL VLCC FDA APPLICATION
To illustrate typical distributions of fatigue damage,FDA computations have been performed foF anidealised double hull VLCC ship with uniform typicalend connection design i.e. flat bar web stiffener200x12 around the envelope.
7.1 Influence of Loading Components
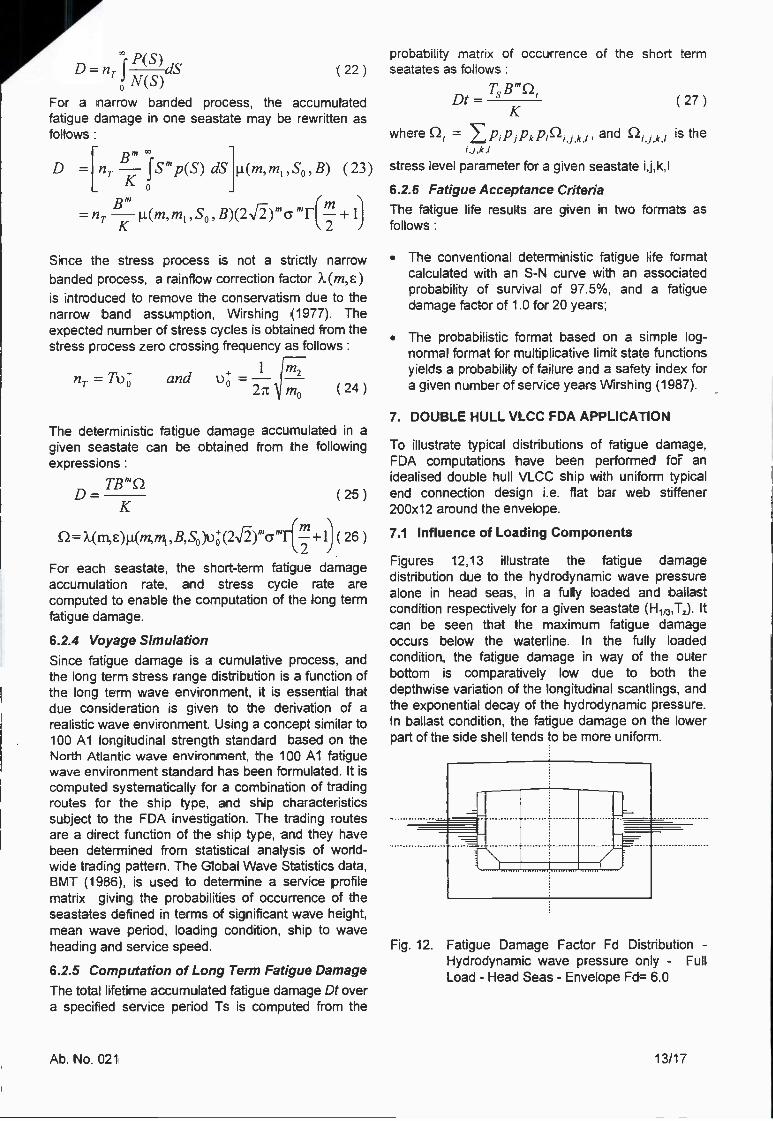
Figures 12,13 illustrate the fatigue damagedistribution due to the hydrodynamic wave pressurealone in head seas, in a fully loaded and ballastcondition respectively for a given seastate (H113,T). ltcan be seen that the maximum fatigue damageoccurs below the waterline. In the fully loadedcondition, the fatigue damage in way of the outerbottom is comparatively low due to both thedepthwise variation of the longitudinal scantlings, andthe exponential decay of the hydrodynamic pressure.In ballast condition, the fatigue damage on the lowerpart of the side shell tends to be more uniform.
N /
Fig. 12. Fatigue Damage Factor Fd Distribution -
Hydrodynamic wave pressure only - FullLoad - Head Seas - Envelope Fd= 6.0
Ab. No. 021 13/17
= nr K

J-''I'll
Fig. 13. Fatigue Damage Factor Ed Distribution -Hydrodynamic wave pressure only - Ballast- Head Seas - Envelope Fd10.0
Figure 14. illustrates the fatigue damage distributionin beam seas. lt is shown that on the weather side ofthe ship, the fatigue damage is significantly largerthan on the lee side. The influence of the rollingmotion is also noticeable with the maximum fatiguedamage zone extending over the waterline.
IÏ I!
Fig. 14. Fatigue Damage Factor Fd Distribution -
Hydrodynamic wave pressure only - FullyLoaded - Beam Seas - Envelope Fd=20.0
Figure 15. illustrates a typical distribution of fatiguedamage due to the wave induced hull girder verticalbending moment.
Fig. 15 Fatigue Damage Factor Fd DistributionVertical Bending Moment- Fully LoadedHead Seas - Envelope Fd13.0
Figure 16 illustrates a typical distribution of fatiguedamage due to the wave induced hull girderhorizontal bending moment . The difference in fatiguedamage on the side shell s due to the variation of S-N curves due to the difference in the SCF arising fromthe ratio of the flange thickness to flat bar thickness.
Ab. No. 021
!I. ïFig. 16 Fatigue Damage Factor Ed Distribution -
Horizontal Bending Moment- Fully Loaded -Beam Seas - Envelope Fd=0.15
7.2 100 Al Fatigue Wave Environment
Figure 17 shows the probability distribution of thewave direction for the subject ship based on the 100Al fatigue wave environment for large crude oil
tankers. lt is shown that these distributions differ forthe fully loaded and ballast voyage. Due to a slightdominance of the wave direction, the fatigue darageis maximised on one side of the ship in the fullyloaded voyage, and the other side in the ballastvoyage.
240
20'180
.--Fully Loaded--- Ballasta Fully Loaded & Ballast
Fig. 17 Probability Distribution of Wave Direction
Figures 18,19 illustrate the distribution of fat!guedamage at midship and at a forward frame next to theforward bulkhead of tank No. 1 respectively. lt is
shown that the fatigue damage in way of the midshipsection is dominated by the vertical bending momentat the deck and bottom, whisit the side shell is subjectto higher fatigue loading in way of the fully loadedwaterline. For the forward section, due to the largeramplitude of wave pressure as a result of the relativemotion of the ship, and the reduction in the verticalbending moment amplitude, the side shell and outer
14/17
280
2603o414
340320
P4
40
60
111111 HhllilIllhli 11h11 Ill

bottom, especiaHy in way of the fully loaded waterlinearea is more prone to fatigue damage.
-n.
/=
Fig. 18 Fatigue Damage Factor Ed Distribution -
Midship Section -Envelope Fd=1.0
Fig. 19 Fatigue Damage Factor Fd Distribution -
Forward Section -Envelope Fd=1 .0
7.3 Alaska to Gulf of Mexico Wave Environment
o
340
320
300
280
260 iI 100
240
220
180-.-- Fully Loaded-- Ballaste-- Fully Loaded & Ballast
Fig. 20 Probability Distribution of Wave Direction
Figure 20 shows the probability distribution of thewave direction for the subject ship based the Alaskato Gulf of Mexico trading pattern . The distributionsfor the fully loaded and ballast voyage exhibit somedegree of symmetry about the quartering seas axis.
Due to the dominance of the quartering wavedirection, t is expected that the fatigue damage willbe higher due to the combined action of the verticaland horizontal bending moment, as well as the lateralmotions inducing higher hydrodynamic wavepressures.
IllIllIllIIlllIllll!I. II IlillIllhl lii
/
Fig. 21 Fatigue Damage Factor Ed Distribution -
Midship Section -Envelope Fd=1.0
Fig. 22 Fatigue Damage Factor Fd Distribution -
Forward Section - Envelope Fd1 .0
Figure 21,22 illustrate the distribution of fatiguedamage at midship and at a forward frame next to theforward bulkhead of tank No. 1 respectively. lt is
shown that due to the increased probability ofoccurrence quartering seas, the fatigue damage dueto the hydrodynamic pressure in way of the side shelland the outer bottom is increased. lt should bepointed out that this wave environment only applies toa small percentage of the total trading patternsencountered by this ship type, and is given tohighlight the significance of the wave environment tofatigue damage.
8. FATIGUE CONTROL PLAN AND
CONSTRUCTION MONITORING
Since fatigue performance of ship structural detailscan be influenced by the workmanship standard, thefit-up and the alignment of the structural components,t is essential that due attention is given during theconstruction stages to ensure that the structure will berepresentative of the assumptions used in the fatiguedesign assessment. To achieve this objective, a
Fatigue Control Plan ¡s developed at the plan
Ab. No. 021 15/17
11111111 llIlIIIIII 11111111111 lui

approval stage, and the items to be considered are asfollows
Identification of critical areas by the FEA StructuralDesign Assessment procedure (SDA), and theFDA procedure;
Marking of the critical areas and structural detailson the ship plan;
Definition of the construction tolerances for thecritical structural details in terms of weldingrequirements, fit-up and misalignment tolerances.The erection sequence of the blocks is also to bespecially considered iii order to minimisemisalignment, and locking of residual stressesduring assembly.
The fatigue control plan uses the fatigue liferesults computed by the FDA procedure to
determine the level of inspection duringconstruction.
During the newbuilding construction, the fieldsurveyor will draw particular attention to the criticalareas highlighted by the Plan Approval Office, and theFatigue Control Plan. Enhanced levels of visualinspection, and NDEINDT may be required atselected critical locations.
9. SUMMARY & CONCLUSIONS
Throughout the development of the ShipRight FDAprocedure, the objectives have been to provide aflexible, reliable and total approach to assess theproblem of fatigue damage of ship structural details.The main features of the first principle Fatigue DesignAssessment procedure have been reviewed. Theprocedure based on the structural spectral method ofanalysis has been implemented into a user friendlyWindow TM integrated software for design andassessment purposes. The disadvantages associatedwith the application of the traditional maximum loadapproach to the determination of the long term stressrange spectrum which have prompted thedevelopment of the subject procedure have beensummarised. Novel direct calculation features such asthe S-N Curve Expert, the computation of waveinduced loads by parametric expressions, the use of avoyage simulation procedure have been outlined, andtypical application examples have been given toillustrate the application of the procedure.
In summary, in order to attain and maintain a
satisfactory fatigue performance of ship structuraldetails, it is essential that a global approach givingdue consideration to the design, construction and ¡nservice stages of the life of structural details beapplied. This has been achieved by
ensuring an adequate level of detail design isperformed by providing the Structural DetailDesign Guide;
ensuring that adequate structural designconcepts and sound analysis techniques areused by providing a first principle fatigue designassessment tool supported by an ongoingresearch programme of theoretical andexperimental work;
ensuring that the workmanship, and constructionstandards are performed to a satisfactory level,and that the fatigue strength can be maintainedby the provision of enhanced survey procedures,and the application of a hull condition monitoringsystem.
10. REFERENCES
British Maritime Technology, Global Wave Statistics,1985.
BS 5400, Part 10, 1980. Code of Practice for Fatigue.Steel, Concrete and Composite Bridges. BritishStandard Institution.
ECCS - Technical Committee 6 - FatigueRecommendations for Fatigue Design of SteelStructures, 1985
Ferguson J.M., Violette F.L.M, Some Effects on ShipStructural Design created by the IncreasedApplication of Higher Tensile Steels, Proc. IMSDC 91,Kobe, Japan.
liS/lIW Doc. 700-82, Welding in the World, No 20.7/8,1982
KSRI, Load Spectra for Ship Structure FatigueEvaluations, Restricted, 1992
Lloyd's Register, Paper presented at the RoyalInstitution of Naval Architects, London, 1913
Lloyd's Register, ShipRight FDA - Structural DetailDesign Guide, 1994
Lloyd's Register, ShipRight FDA - Fatigue DesignAssessment - Procedures Manual, 1994
Lloyd's Register, ShipRight SDA - Structural DesignAssessment - Procedures Manual, 1994
Lloyd's Register, ShipRight HCM - Hull ConditionMonitoring - Procedures Manual, 1994
Lloyd's Register, ShipRight CM - ConstructionMonitoring - Procedures Manual, 1994
Ab. No. 021 16/17
Lloyd's Register, Comparative Fatigue DamageAnalysis of a 280,000 Dwt VLCC, September 1992 -Restricted
Offshore Installations : Guidance on Design andConstruction. New Fatigue Design Guidance for SteelWelded Joints in Offshore Structures. UK Den,August 1983.
Violette ELM, The Effect of Corrosion on StructuralDetail Design, Int. Conf. Marine Corrosion Prevention,Royal Institution of Naval Architects, London, Oct.1994
Wirshing P.H, Fatigue under wide band randomStresses using the rainflow method, Journal ofEngineering Materials and Technology, ASME, 1977
Wirshing P.H, Chen Y.N., Consideration of Probability- Based Fatigue Design for Marine Structures, Proc.Marine Structural reliability Symposium, Arlington, VA,1987.
11. NOMENCLATURE
IZU.'
zzzzYY
s¡
f(x)
K8,
C,
P,(t)H/i)n
p(S)aso
S, tSN(S)
n(S)
B
p/mm I,SO,B)
m
KE
T
Ab. No. 021
SecQnd moment of areaSection modulus about flangeHull girder section modulus about ZZHull girder section modulus about YYStiffener spacingEffective span
Bending moment shape function at
critical location x from span pointBias stress concentration factorloadcase iStructural influence coefficient of the ithload process P,(t)Load process iStress process ¡ complex formTotal number of load processes I shipmotions influence parametersStress range probability functionStandard deviation of the stress processS-N curve stress range at stresscyclesNominal stress,stress rangeNumber of allowable stress cycles atstress range S,Number of stress cycles with stressrange S for the given seastateExpected number of stress cycles in thegiven seastateModelling bias for the stress predictionmodelCorrection factor for multi-linear S-NcurveSlope of selected S-N curveIntercept of selected S-N curveSpectral bandwidthSeastate duration
Pk =p(kijl)
17/17
U Mean zero crossing frequency
P, = p(i jkl) probability ith loading condition
PI =p(i iki) probability jth ship to wave
heading
probability kth ship speed
p, = p(l ¿1k) probability Ith seastate (H1I3,TZ)
SCF ship structural detail50F standard detail
Knom Intercept nominal S-N curveKh, Intercept reference S-N curve
hv Hot spot stress rangem S-N curve inverse slopem' = m S-N Curve negative inverse slope