lo screening di popolilazione per il - over group provider ecm · lo screening di popolilazione per...
TRANSCRIPT

L i di l i ilLo screening di popolazione per il carcinoma della prostata
Nicola Nicolai
UrologiaUrologia
Fondazione IRCCS Istituto Nazionale Tumori Milano

Criteri per l’applicazione dello p ppscreening
Criteri Applicazione per CaPMalattia frequente e con prognosi Sì Primo tumore per incidenzaMalattia frequente e con prognosi severa
Sì. Primo tumore per incidenza, secondo per mortalità
Tests semplici di facile impiego in Sì PSATests semplici di facile impiego in grado di far porre diagnosi in fasi di malattia precoci e asintomatiche
Sì. PSA(DRE?)
Il trattamento della malattia in fasi più precoci comporta una riduzione della
Non (ancora) provato
morbilità e mortalità
Favorevole rapporto costo/beneficio: t d ll’ d i t tt ti
Non (ancora) provatocosto dell’esame, dei trattamenti, delle complicazioni
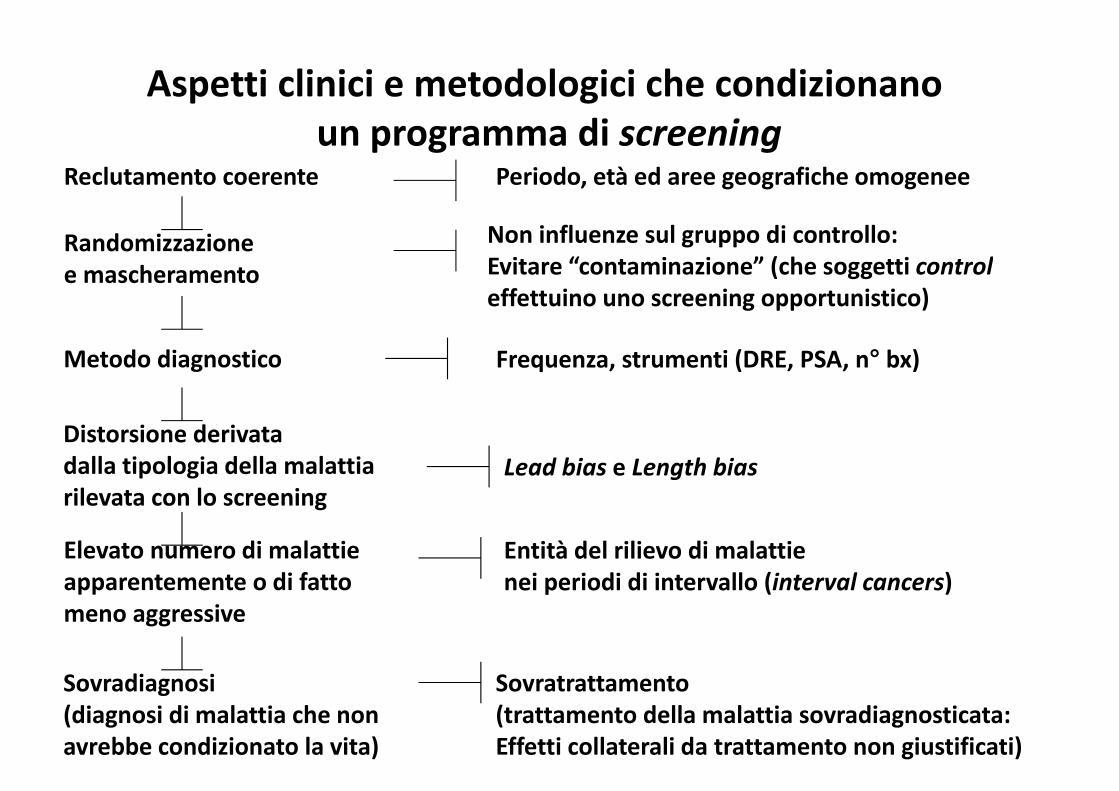
Aspetti clinici e metodologici che condizionanoAspetti clinici e metodologici che condizionano un programma di screening
Reclutamento coerente Periodo età ed aree geografiche omogeneeReclutamento coerente Periodo, età ed aree geografiche omogenee
Randomizzazione Non influenze sul gruppo di controllo:Evitare “contaminazione” (che soggetti controle mascheramento Evitare “contaminazione” (che soggetti controleffettuino uno screening opportunistico)
M d di i F i (DRE PSA ° b )
Distorsione derivata
Metodo diagnostico Frequenza, strumenti (DRE, PSA, n° bx)
Distorsione derivatadalla tipologia della malattia rilevata con lo screening
Lead bias e Length bias
Elevato numero di malattieapparentemente o di fatto meno aggressive
Entità del rilievo di malattie nei periodi di intervallo (interval cancers)
meno aggressive
Sovradiagnosi Sovratrattamento(diagnosi di malattia che nonavrebbe condizionato la vita)
(trattamento della malattia sovradiagnosticata:Effetti collaterali da trattamento non giustificati)
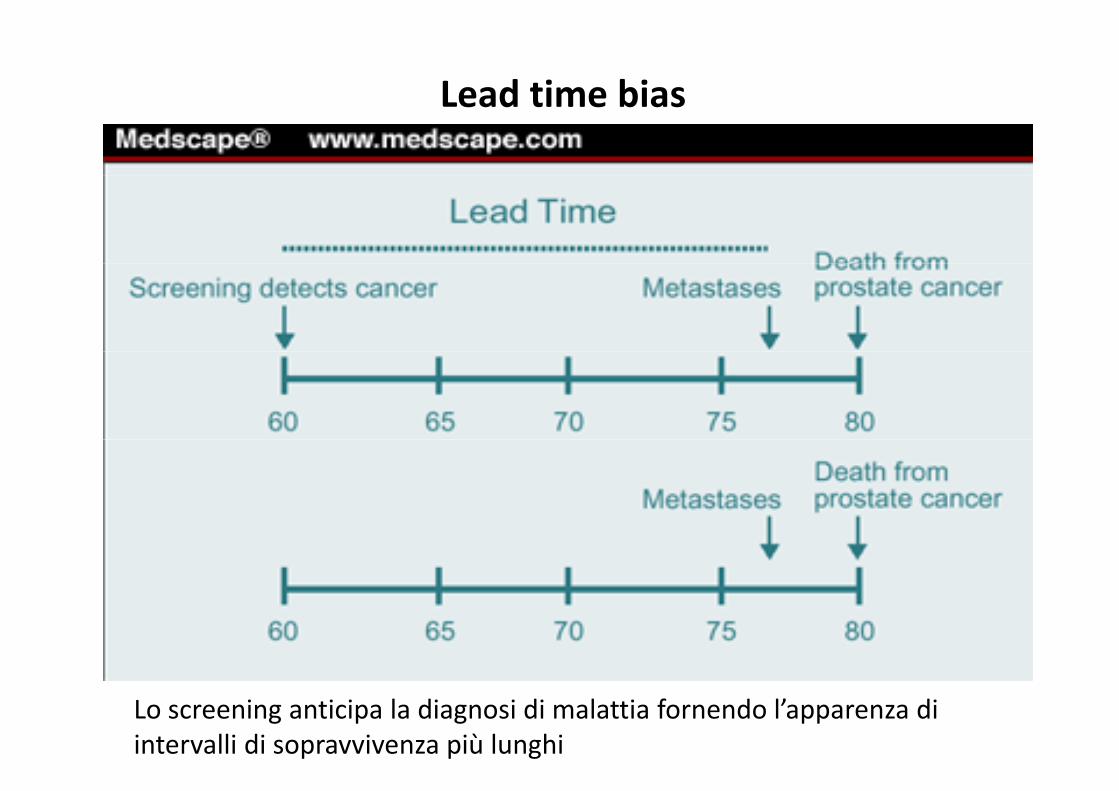
Lead time biasLead time bias
L i ti i l di i di l tti f d l’ diLo screening anticipa la diagnosi di malattia fornendo l’apparenza di intervalli di sopravvivenza più lunghi
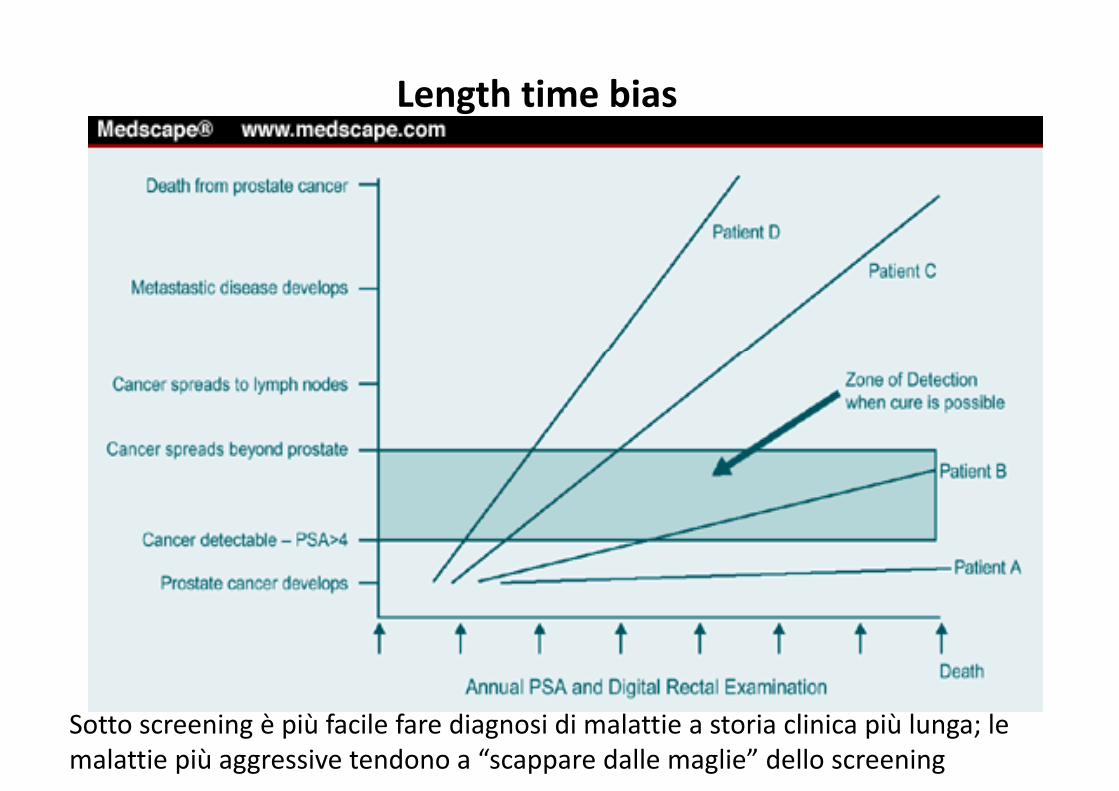
Length time biasLength time bias
Sotto screening è più facile fare diagnosi di malattie a storia clinica più lunga; le malattie più aggressive tendono a “scappare dalle maglie” dello screening


22 settembre 2012, h. 10.00 – 13.00
StudioScreening C P
Tipo, end point TotScreen/C
t l
Commenti
CaP ontrol
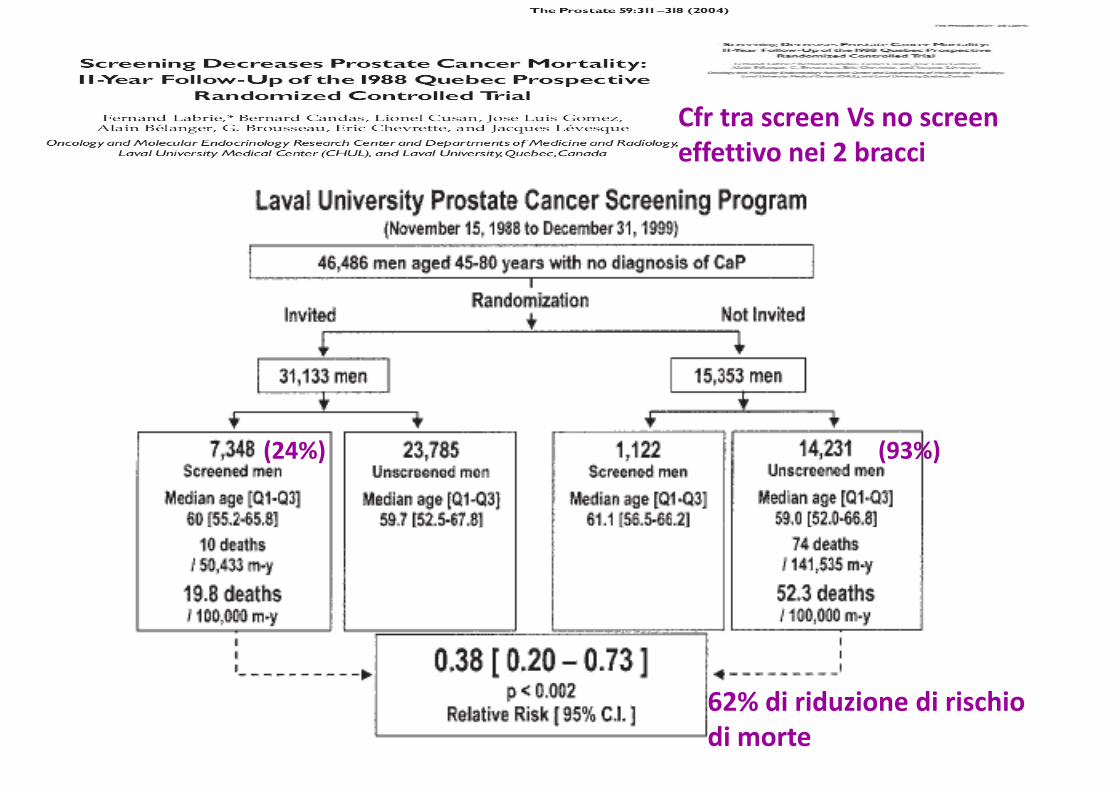
QuebecL b i t Al
R DSS 46486S 31133
Quebec city area (R 2:1)1 DRE PSA (TRUS)Labrie et Al.
Prostate 2004;59(3):311-8
S 31133 C15353
q 1 anno; DRE-PSA-(TRUS)Bx: sestanti ± mirate
NorkoppingSandblom et Al. Eur Urol
Non R non mascheratoDSS
9026S 1494 C7532
Norrköping (R 1:6)q 3 anni; DRE (MMG e Urol, poi solo MMG per 2 rounds) e PSA (dopo)2004;46:717-24 DSS MMG per 2 rounds) e PSA (dopo)Bx: sestanti
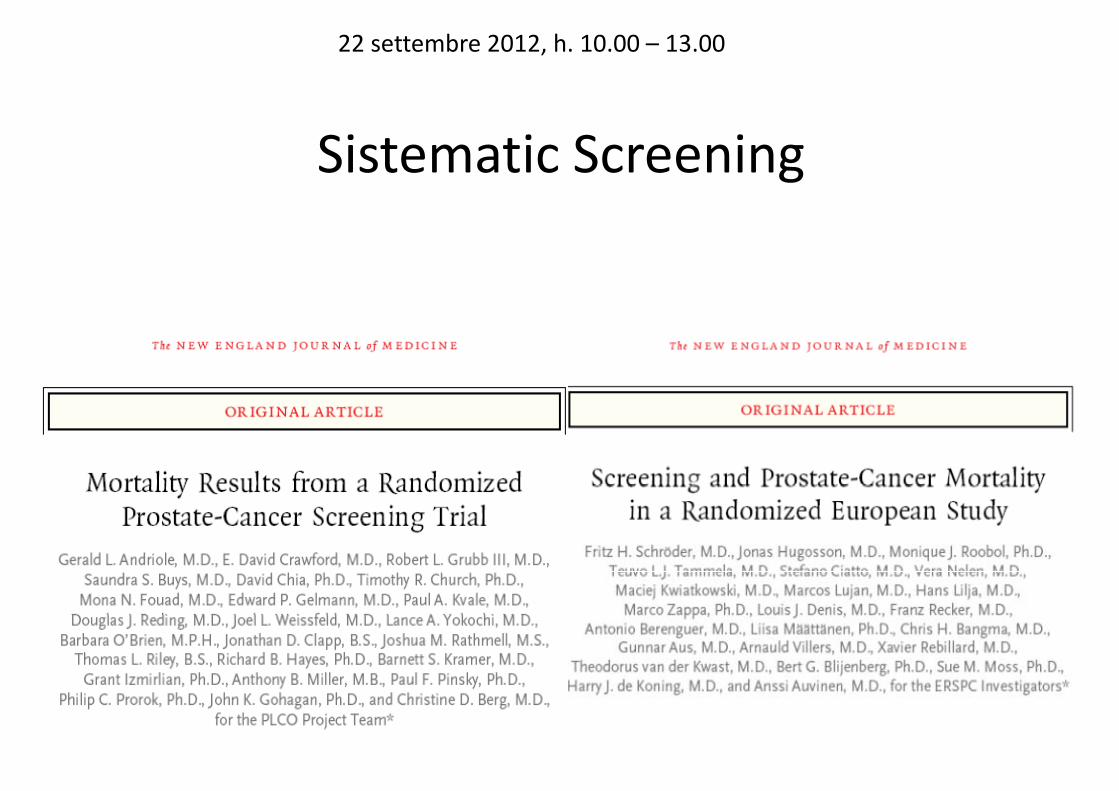
PCLO R 76693 10 t i USA (R 1 1)PCLOAndriole et Al. N Engl J Med 2009;360:1310-9
R mascheratoDSS
76693S 38343C 38350
10 centri USA (R 1:1)q 1 anno: PSA (per 6 a) + DRE (per 4 a)2009;360:1310-9. DSS 4 a)
ERSPCSchröder et Al. N
Rmascherato
162243S 72890
8 paesi europei (R 1:1)q 4 anni; PSASchröder et Al. N
Engl J Med 2009;360:1320‐8.
mascheratoDSS
S 72890C 89353
q 4 anni; PSABx: sestanti
22 settembre 2012, h. 10.00 – 13.00
Cfr tra screen Vs no screen effettivo nei 2 bracci
(24%) (93%)
62% di riduzione di rischio62% di riduzione di rischiodi morte
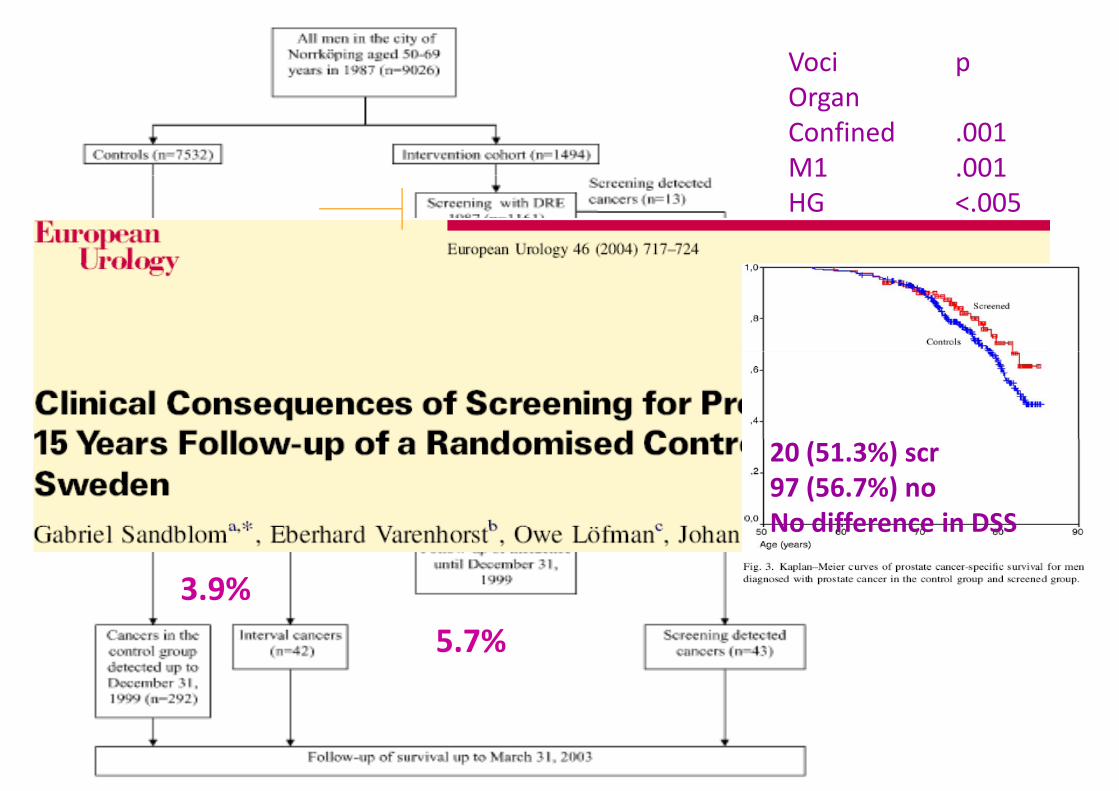
22 settembre 2012, h. 10.00 – 13.00Voci pOOrgan Confined .001M1 .001M1 .001HG <.005
20 (51.3%) scr97 (56.7%) noNo difference in DSSNo difference in DSS
3.9%
5.7%
22 settembre 2012, h. 10.00 – 13.00
Sistematic Screeningg

d l d dPLCO: 1993‐2001, 76,693 men randomly assigned at 10 U.S. study centersto receive either annual screening (PSA & DRE) or usual care (NEJM march 2009)
incidence of death per 10,000 person‐years: 2.0 (50 DOD) in the screening group Vs 1.7 (44 DOD) in the control group(44 DOD) in the control group (RR, 1.13; 95% CI, 0.75 to 1.70).
incidence per 10,000 person‐p , pyears: 116 (2820 ca) in the screening group Vs 95 (2322 ca) in the control group (RR, 1.22; 95% CI95% CI, 1.16 to 1.29);
Compliance: 85% for PSA; 86% for DRE. FU: 7 yrs.
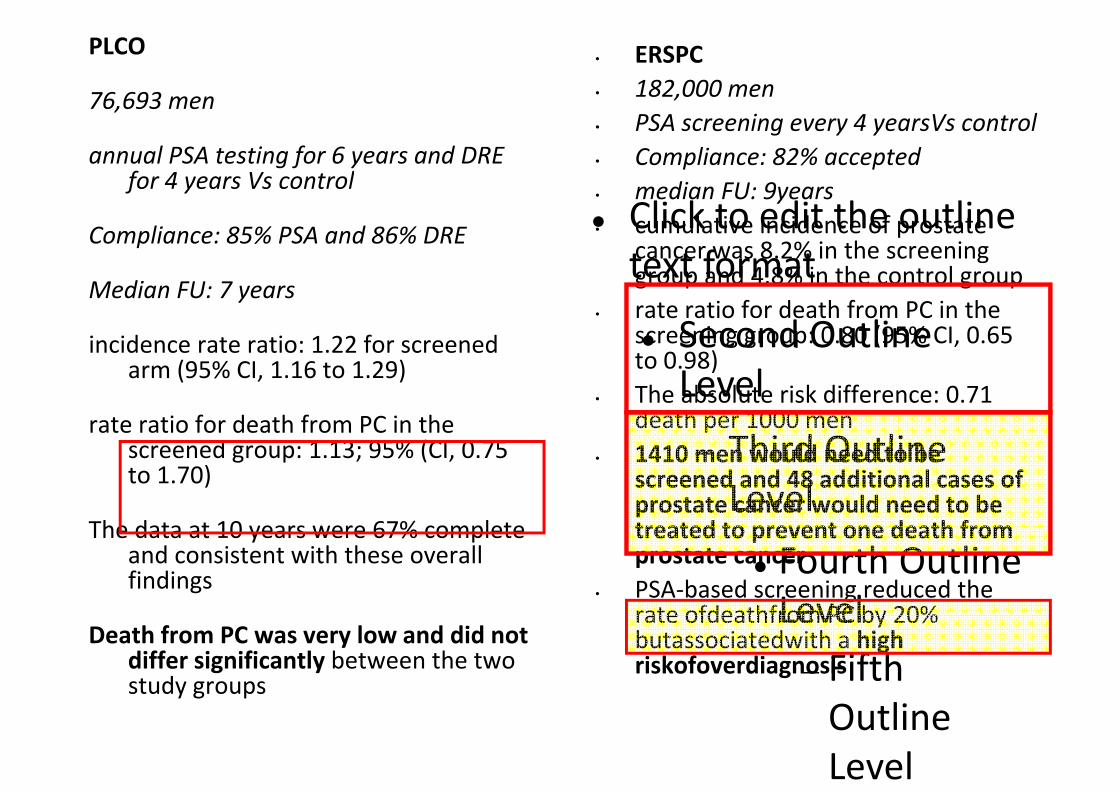
• ERSPC182 000 men
PLCO
• 182,000 men• PSA screening every 4 yearsVs control• Compliance: 82% accepted
76,693 men
annual PSA testing for 6 years and DRE f 4 V t l
Click to edit the outline text format
• median FU: 9years• cumulative incidence of prostate
cancer was 8.2% in the screening
for 4 years Vs control
Compliance: 85% PSA and 86% DREtext format
Second Outline
group and 4.8% in the control group• rate ratio for death from PC in the
screening group: 0.80 (95% CI, 0.65 )
Median FU: 7 years
incidence rate ratio: 1.22 for screened
Level
Thi d O tli
to 0.98) • The absolute risk difference: 0.71
death per 1000 men
incidence rate ratio: 1.22 for screened arm (95% CI, 1.16 to 1.29)
rate ratio for death from PC in the − Third Outline Level
• 1410 men would need to be screened and 48 additional cases of prostate cancer would need to be treated to prevent one death from
screened group: 1.13; 95% (CI, 0.75 to 1.70)
The data at 10 years were 67% completeFourth Outline Level
treated to prevent one death from prostate cancer
• PSA‐based screening reduced the rate ofdeathfrom PC by 20%
The data at 10 years were 67% complete and consistent with these overall findings
Level− Fifth
l
rate ofdeathfrom PC by 20% butassociatedwith a high riskofoverdiagnosis
Death from PC was very low and did not differ significantly between the two study groups
Outline Level
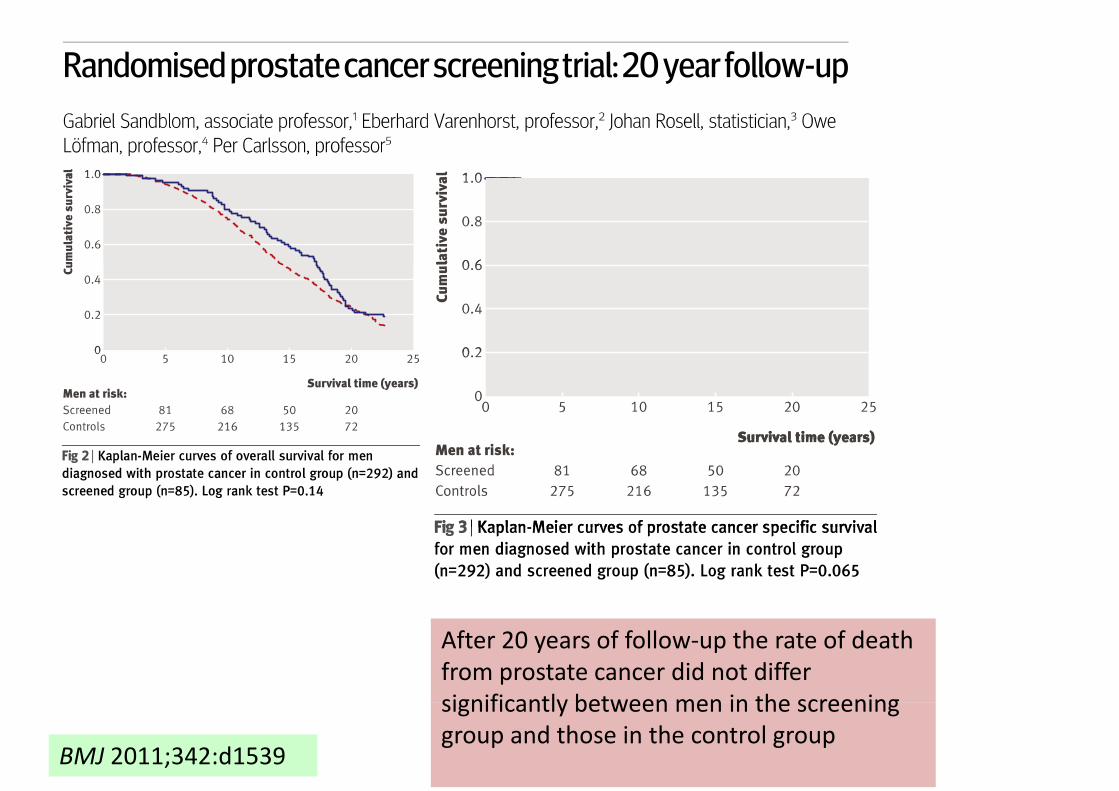
After 20 years of follow‐up the rate of death from prostate cancer did not differ significantly between men in the screening
BMJ 2011;342:d1539
significantly between men in the screening group and those in the control group

S i PSA/ f 6 DRE/ f 4
92% f ll d t 10
52% of contamination!Screening PSA/yr for 6 + DRE/yr for 4VsUsual Care
92% followed to 10 years 57% followed to 13 years
cumulative PCa mortality intervention arm: 3.7 x 10000 /person/years
control arm: 3.4 x 10000 person/yearsnon‐statistically significant difference s (RR = 1.09, 95% CI = 0.87 to 1.36)
Cancer Inst 2012;104:125–132
y g ( , )No statistically significant interactions for age (Pinteraction = .81)
pretrial PSA testing (Pinteraction = .52)
comorbidity

7408 i th i t ti (SA) rate ratio of PCa mortality 0∙85 (0∙70–1∙03) at 9 years 0∙78 (0∙66–0∙91) at 11 years,
7408 in the intervention group (SA)6107 in the control group (CA)
The rate ratio (SA/CA)1 91 (95% CI 1 83 1 99) t 9
( ) y0∙79 (0∙69–0∙91) at 13 yearsabsolute risk reduction at 13 yrs: 0∙11 per 1000 person‐years
1∙91 (95% CI 1∙83–1∙99) at 9 years, 1∙66 (1∙60–1∙73) at 11 years, 1∙57 (1∙51–1∙62) after 13 years.
or 1∙28 per 1000 men randomisedone PCa death averted per 781 men invited for screeningone per 27 additional prostate cancer detected
Rate ratio of PCa mortality in men screened was 0∙73 (95% CI 0∙61–0∙88), after adjustment for non‐) jparticipation
www.thelancet.com Published online August 7, 2014 http://dx.doi.org/10.1016/S0140‐
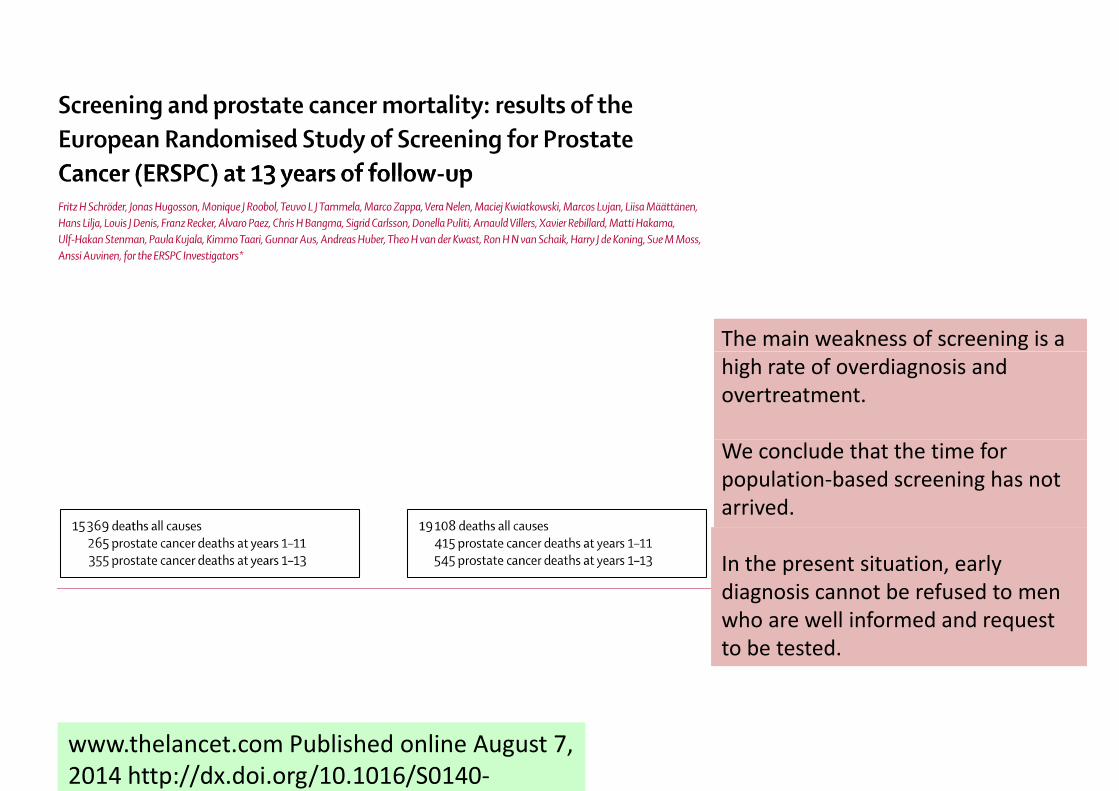
The main weakness of screening is a high rate of overdiagnosis and overtreatment.
We conclude that the time for population‐based screening has not arrived.
In the present situation, early diagnosis cannot be refused to men h ll i f d d twho are well informed and request
to be tested.
www.thelancet.com Published online August 7, 2014 http://dx.doi.org/10.1016/S0140‐
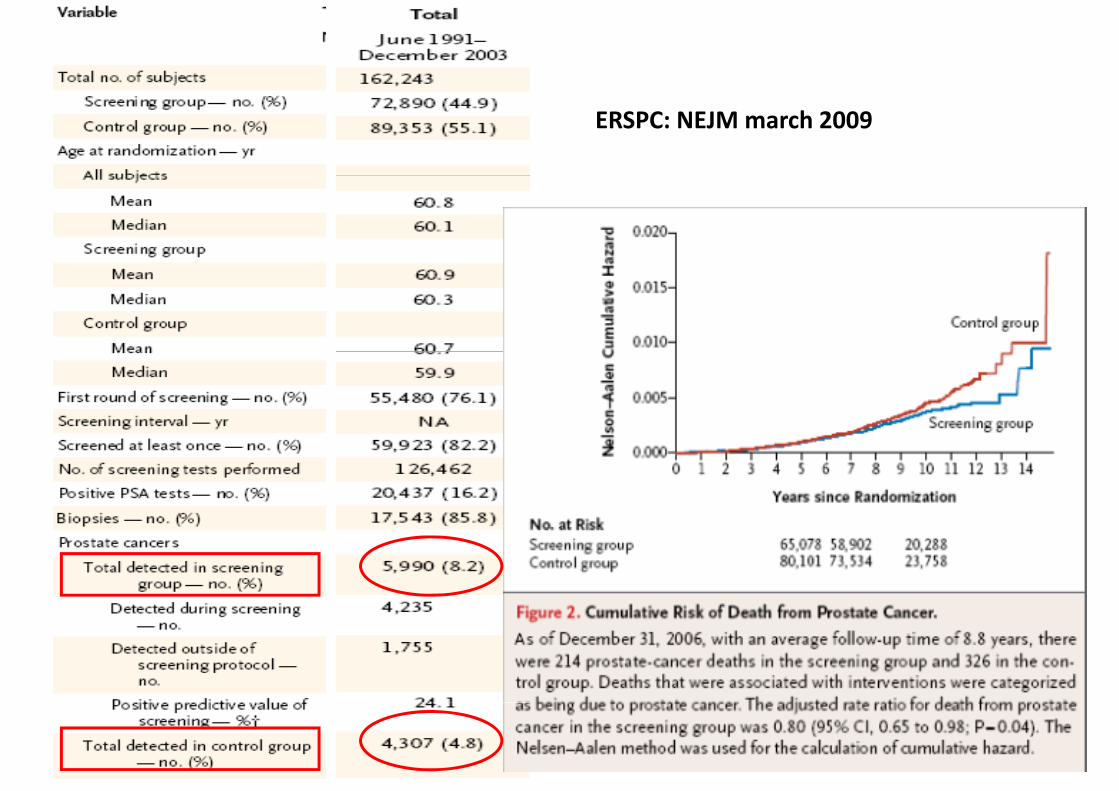
ERSPC: NEJM march 2009

Lo screening opportunisticoLo screening opportunistico
• Lo screening effettuato individualmenteÈ• È oramai talmente diffuso che surroga la condizione dello screening di massacondizione dello screening di massa

2011 2012
PSA/1000 PSA/1000abitanti PSA PSA/1000 abitanti abitanti PSA PSA/1000
abitanti
totale 28.730.886 6.340.326 221 28.871.641 6.205.532 215
età 45‐75 10.868.443 6.340.326 583 11.050.960 6.205.532 562
Courtesy Dott. Massimo Gion

Incidenza* del tumore della prostata in Italia e per area geograficanel tempo
10
12
8
10
rdizza
ti
6
8
a standa
4incidenz
2Tassi d
i
0 2 4 6 8 10 120
0 2 4 6 8 10 12
Anni* Tassi standardizzati per 100.000 persone/anno (popolazione standard europea), età 0‐99 anni

Incidenza del tumore della prostata in Europa e nel mondo l d d ( l d l )nel tempo ‐ tassi standardizzati (popolazione mondiale)
* Dati regionali
NORDCAN (www.ancr.nu)ECO (eco.iarc.fr)England: www.ons.gov.uk
CI5.iarc.frAustralia: www.aihw.gov.auNew Zealand: www.health.govt.nzUSA: seer.cancer.gov

Carcinoma prostaticoCarcinoma prostatico
U d ll i i diffFinland
Denmark
• Una delle maggiori differenze per sopravvivenza tra nazioni
Sweden
Norway
Iceland
Finland
• Incidenza aumentata• Sopravvivenza a 5 anni
UK Scotland
UK Northern Ireland
UK England
Ireland
(standardizzata per area ed età) migliorata dal 65%( ) l
Belgium
Austria
UK Wales
UK Scotland
(EUROCARE‐3, 1990‐94) al 76%
Switzerland
Netherlands
Germany
France
Portugal
Malta
Italy
Switzerland
Poland
Czech Republic
Spain
Slovenia
0 20 40 60 80 100
EUROCARE-4 POOL
Poland
5-year relative survival (%)

22 settembre 2012, h. 10.00 – 13.00
Carcinoma della prostata in ItaliaCarcinoma della prostata in ItaliaNUMERO DI CASI
ti i i id ti i l tianno morti casi incidenti casi prevalenti1990 5660 12600 365001999 6960 25900 935002005 9200 43000 1740002005 9200 43000 174000
Fonte: stime MIAMOD ISS RomaFonte: stime MIAMOD, ISS, Roma

22 settembre 2012, h. 10.00 – 13.00
NUMERO DI CASICa di Polmone e di Prostata in ItaliaCa di Polmone e di Prostata in Italia
(proiezioni al 2005)(p )tumore morti casi incidenti casi prevalenti
prostata 9200 44000 174000
polmone 22000 26000 55000polmone 22000 26000 55000
Fonte: stime MIAMOD ISS RomaFonte: stime MIAMOD, ISS, Roma
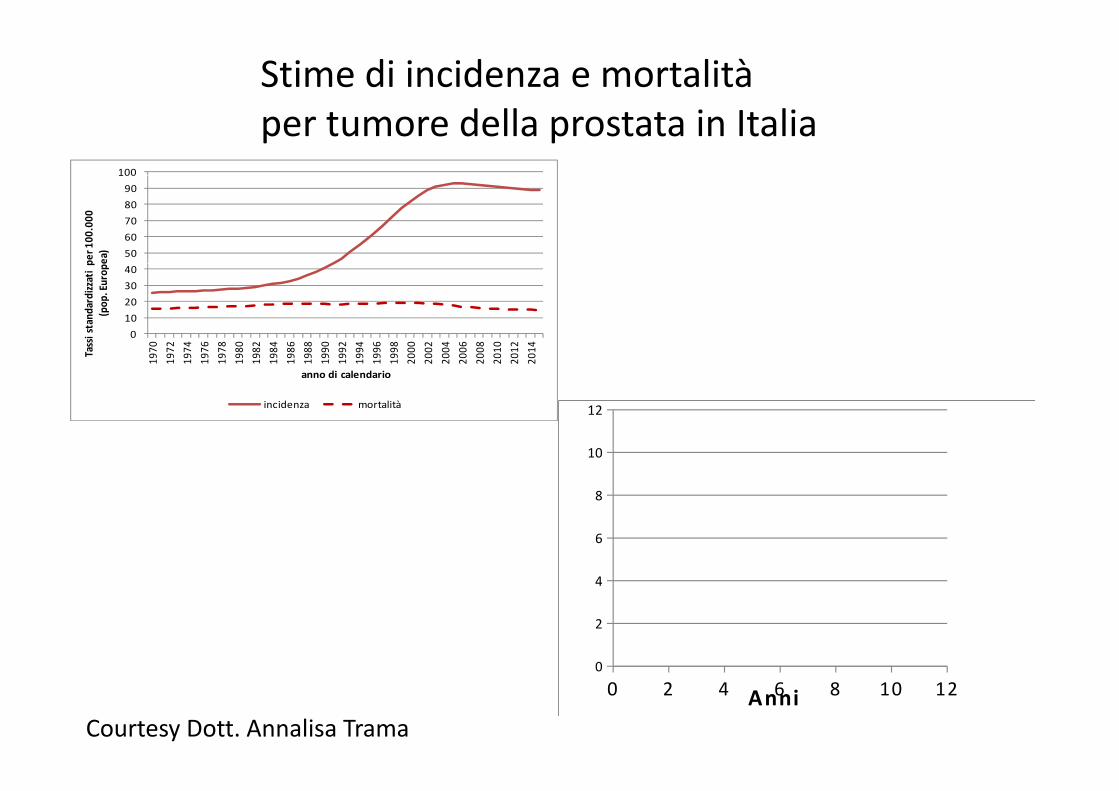
Stime di incidenza e mortalità per tumore della prostata in Italia
100
50
60
70
80
90
100
per 1
00.000
ea)
0
10
20
30
40
70 72 74 76 78 80 82 84 86 88 90 92 94 96 98 00 02 04 06 08 10 12 14assi standardizzati p
(pop
. Europ
e
197
197
197
197
197
198
198
198
198
198
199
199
199
199
199
200
200
200
200
200
201
201
201Ta
anno di calendario
incidenza mortalità 12
8
10
4
6
0 2 4 6 8 10 120
2
AnniAnniCourtesy Dott. Annalisa Trama

Il progetto “Prostate cancer survival patients in Italy”p g p y
Obi tti iObiettivi:
• descrivere le pratiche diagnostico‐terapeutiche il d ll ll l iper il tumore della prostata nella popolazione
italiana e nel tempo (1996‐1999 vs 2005‐2007)p ( )
li d i l di• analizzare ed interpretare la diversa sopravvivenza per tumore della prostata in p p palcune popolazioni residenti in diverse regioni italiane
Courtesy Dott. Annalisa Trama

Incidenza* del tumore della prostata in Italia e per area geograficanel tempo
10
12
8
10
rdizza
ti
6
8
a standa
4incidenz
2Tassi d
i
0 2 4 6 8 10 120
0 2 4 6 8 10 12
Anni* Tassi standardizzati per 100.000 persone/anno (popolazione standard europea), età 0‐99 anni
Courtesy Dott. Annalisa Trama

Analisi e Registri coinvolti
10
12
ard
izza
ti
6
8
za standa
2
4
i incidenz
0 2 4 6 8 10 120
Anni
assi d
i
Courtesy Dott. Annalisa Trama
22 settembre 2012, h. 10.00 – 13.00
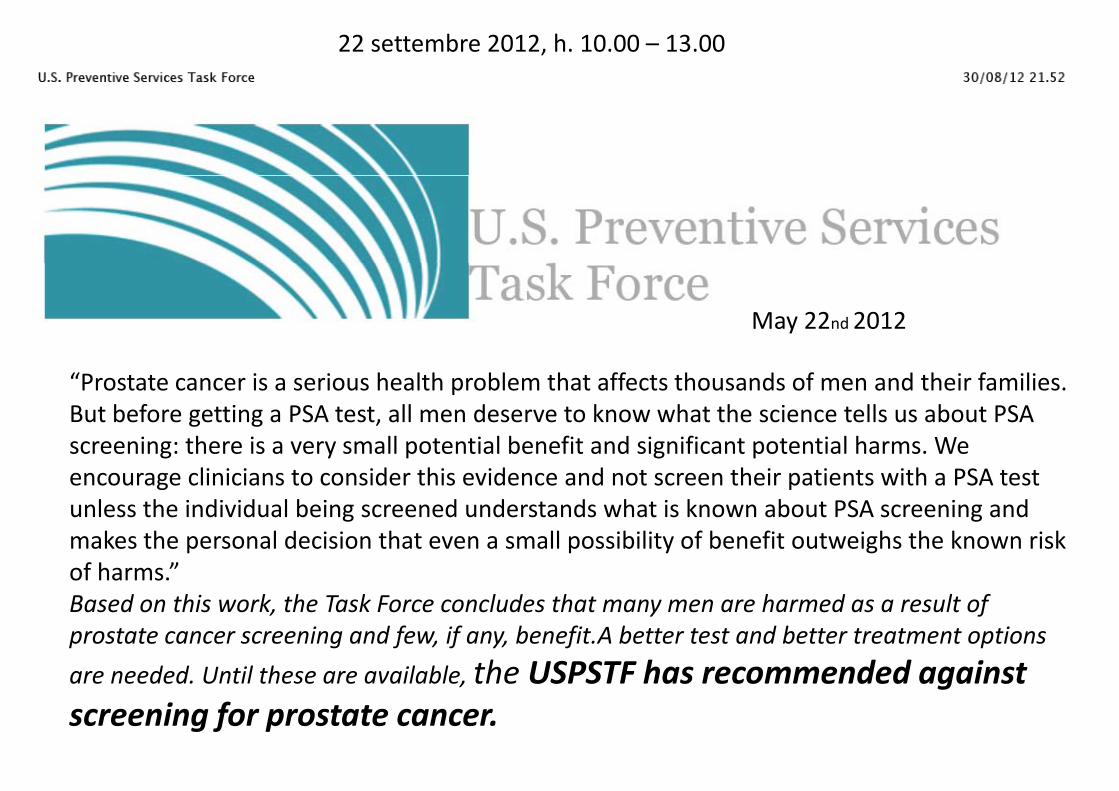
May 22nd 2012
“Prostate cancer is a serious health problem that affects thousands of men and their families. But before getting a PSA test, all men deserve to know what the science tells us about PSA
i th i ll t ti l b fit d i ifi t t ti l h Wscreening: there is a very small potential benefit and significant potential harms. We encourage clinicians to consider this evidence and not screen their patients with a PSA test unless the individual being screened understands what is known about PSA screening and makes the personal decision that even a small possibility of benefit outweighs the known risk of harms.” Based on this work, the Task Force concludes that many men are harmed as a result of , y fprostate cancer screening and few, if any, benefit.A better test and better treatment options
are needed. Until these are available, the USPSTF has recommended against i fscreening for prostate cancer.
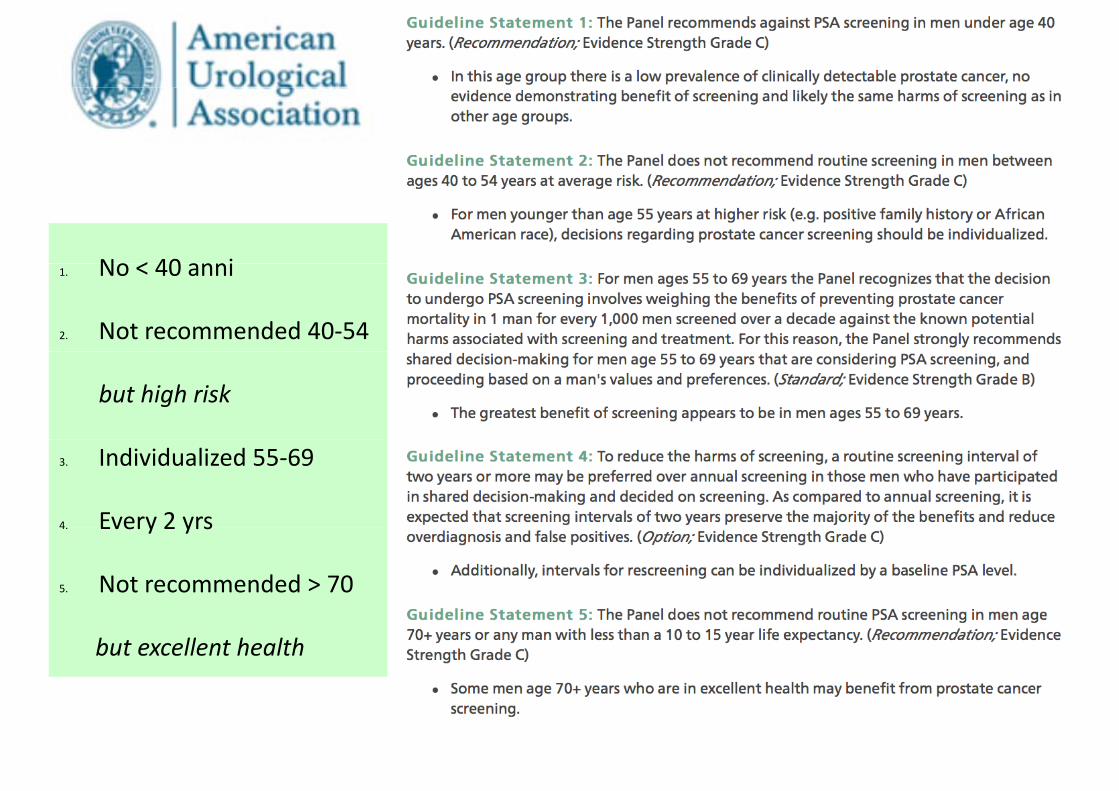
No < 40 anni1. No < 40 anni
2. Not recommended 40‐54
but high risk
3. Individualized 55‐69
4 Every 2 yrs4. Every 2 yrs
5. Not recommended > 70
but excellent health

There is currently no evidence for introducing widespread population‐based screening programmes for early PCa p p g p g y
detection in all men [8] (LE: 2).

22 settembre 2012, h. 10.00 – 13.00
S i PSAScreening e PSAChe fare di fronte ad una richiesta individuale di un
tt i t ti ?soggetto asintomatico?
F i di i hiFattori di rischio IndividuoMMG e specialista
Familiarità ed etàRisk Calculators
MotivazioneInformazione
S iScreening

Outline Level− Eighth Outline Level
22 settembre 2012, h. 10.00 – 13.00
Come comportarsi? Outline Level
Ninth Outline LevelFare clic difi li tili d l
Come comportarsi?• Medico • Pazienteper modificare gli stili del
testo dello schema
• Medico
• Considerare il paziente
• Paziente
• Approccio Click to edit the outline text format
Click to edit the outline text format– Morbilità e attesa di vita
C id i hi dideliberativo e
Second Outline Level
Third Outline Level
Second Outline Level
Third Outline Level
• Considerare rischio di malattia ad alto grado
e multidiscipli
− Third Outline Level
Fourth Outline l
− Third Outline Level
Fourth Outline l
g– Se il rischio è < 5%, valutare i rischi della procedura (es:
nareEnpowermeLevel
− Fifth Outline
Level
− Fifth Outline
rischi della procedura (es: rischio infezione severa (US) è
%
• Enpowerment del pz
Level− Sixth Outline
Level− Sixth Outline
tra 2 e 4%
• Considerare il rapporto tra• Decisione che rispettaLevel
− Seventh Level
− Seventh
Considerare il rapporto tra rischio di malattia a basso
d di l tti d lt
che rispetta la persona e