local economic development planning & management · local economic development planning &...
TRANSCRIPT

Local Economic Development Planning & Management
FIU Metropolitan Center
Instructors: Dr. Ned Murray, AICPKevin Greiner, MUP, JD
August 26, 2015
Metropolitan
Center
Course Objectives
Working Understanding of: Data Driven Economic Development Analysis
Core Analytical Competencies
Recent Trends & New Thinking
Core Strategies & Local Capacity Building
Planner’s Role in Economic Development
Provide Working Knowledge to Ask the Right Questions
Metropolitan
Center
Understanding Economic Development Goals
Regional & Local Economic Analysis
Creating Performance Based Economic Development Strategies
Building Local Management Capacity
Local Economic Development Competencies
Metropolitan
Center
Economic Development Goals:Basic Economic Development Goals
Improving Short and Long Term Business Competiveness
Increase Employment
Support Expansion of Existing Businesses
Support New Business Creation
Diversify Local Economy – Reduce Reliance on Limited Industry Segments
Expand Employment in New Industries
Metropolitan
Center
Economic Development Goals:Developing Sustainable Economies
Stable, Long Term Job and Wage Growth
Low Income Inequality
High Vertical Mobility – Opportunity to Move up the Income Ladder
Access to Higher-income Employment
Less Dependence on Population Increases and In-migration for Growth
Resistant to Sharp Economic Cycles
High Per Capita Regional GMP
Diverse, High Value-Added Industry Clusters in Nationally Growing Sectors
High Rates of Innovative Output: Advanced Products, Services, Technology Platforms and Business Processes
High Horizontal mobility – knowledge and skills apply across different industries and occupations
Metropolitan
Center
Economic Development Goals:Performance-Based Economic Development
Evaluation and benchmarking for measuring the performance of economic development agencies
Strategic planning to systemically identify the assets and liabilities of an area, determine opportunities for growth and provide local economic development organizations with a clear set of goals and objectives

Metropolitan
Center
Regional and Local Economic Analysis: Economic Base Analysis
Process
1. Define the Region
2. Review Regional Economic History
3. Identify Basic and Non-Basic Activity
4. Identify Industries with High Potential for Growth
5. Identify Local Strengths and Barriers to Growth
6. Assess Wider Economic Environment & Trends
7. Develop Strategic Responses
Metropolitan
Center
First step in undertaking any economic-base analysis is to define the region that constitutes the local economic base
Most important factor is that you’re interested in identifying the area that encompasses and includes all of the economic activities that have an impact on the community for which you are developing an economic plan
Will Provide the Basis for Benchmarking Against Other Regions – Crucial Economic Assessment Tool
Economic Base AnalysisStep 1: Define the Region
Metropolitan
Center
Step 2: Review Regional Economic History
An analysis done outside of a historical context will lack the insights necessary to make judgments about the prospects for growth and change in the future.
These factors could be physical, economic and social.
Metropolitan
Center
Step 3: Identify Basic and Non Basic Activity
Economic change strategies are primarily aimed toward basic (export) industries which are the sources of growth in a community (they create local wealth).
Non basic industries survive by “servicing” the basic industries

Metropolitan
Center
Step 4: Identify Industries with a High Potential for Growth or Change
In most cases, major changes in employment takes place as a result of expansion or contraction of existing industries and firms
More important to identify those firms within your community that are growing and those that are declining. (Note: see U.S. Economic Census and County Business Patterns websites)
Metropolitan
Center
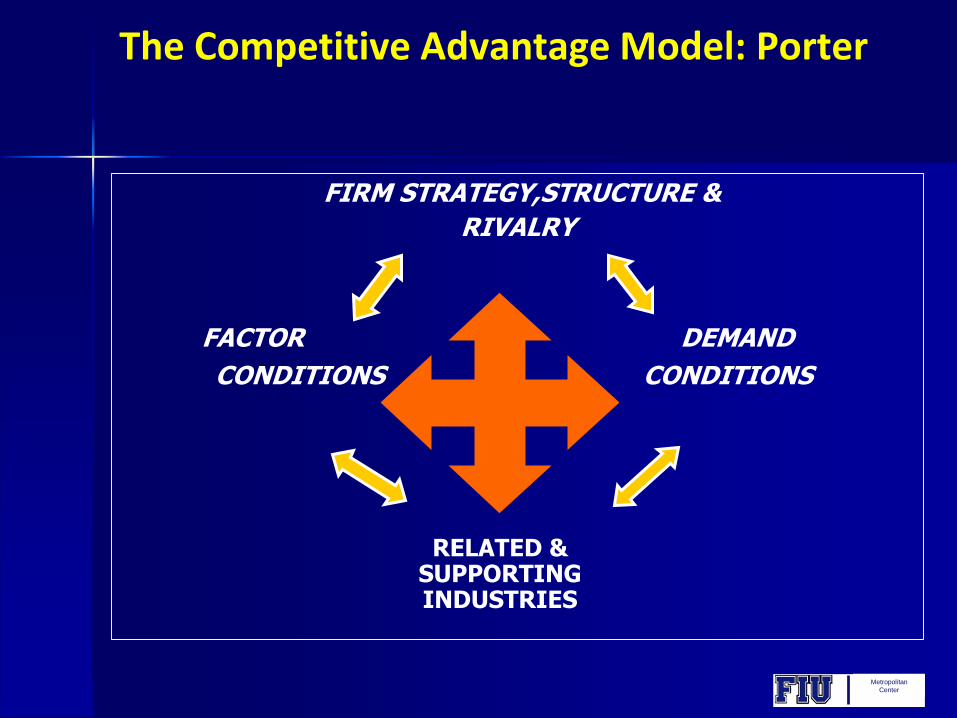
FIRM STRATEGY,STRUCTURE &
RIVALRY
FACTOR DEMAND
CONDITIONS CONDITIONS
The Competitive Advantage Model: Porter
RELATED & SUPPORTINGINDUSTRIES
Metropolitan
Center
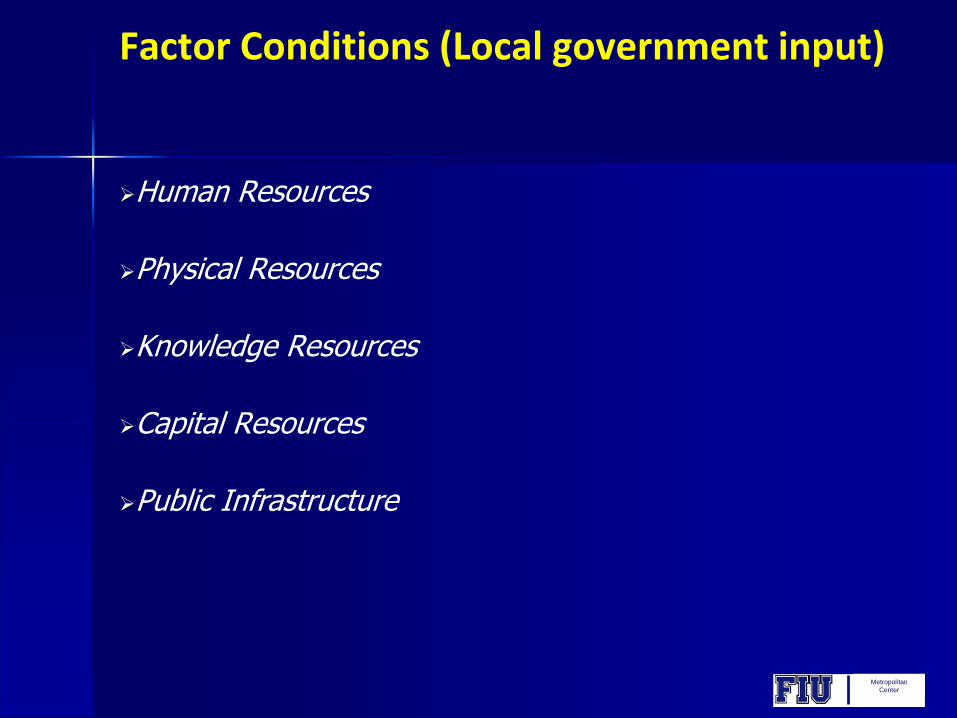
Factor Conditions (Local government input)
Human Resources
Physical Resources
Knowledge Resources
Capital Resources
Public Infrastructure
Metropolitan
Center
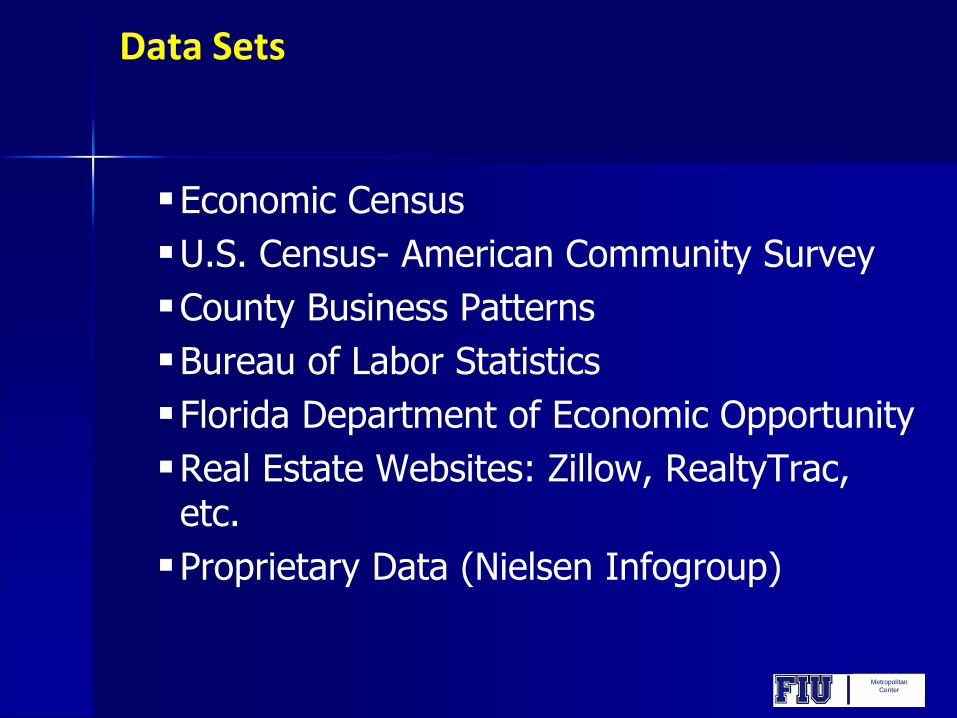
Data Sets
Economic Census
U.S. Census- American Community Survey
County Business Patterns
Bureau of Labor Statistics
Florida Department of Economic Opportunity
Real Estate Websites: Zillow, RealtyTrac, etc.
Proprietary Data (Nielsen Infogroup)
Metropolitan
Center
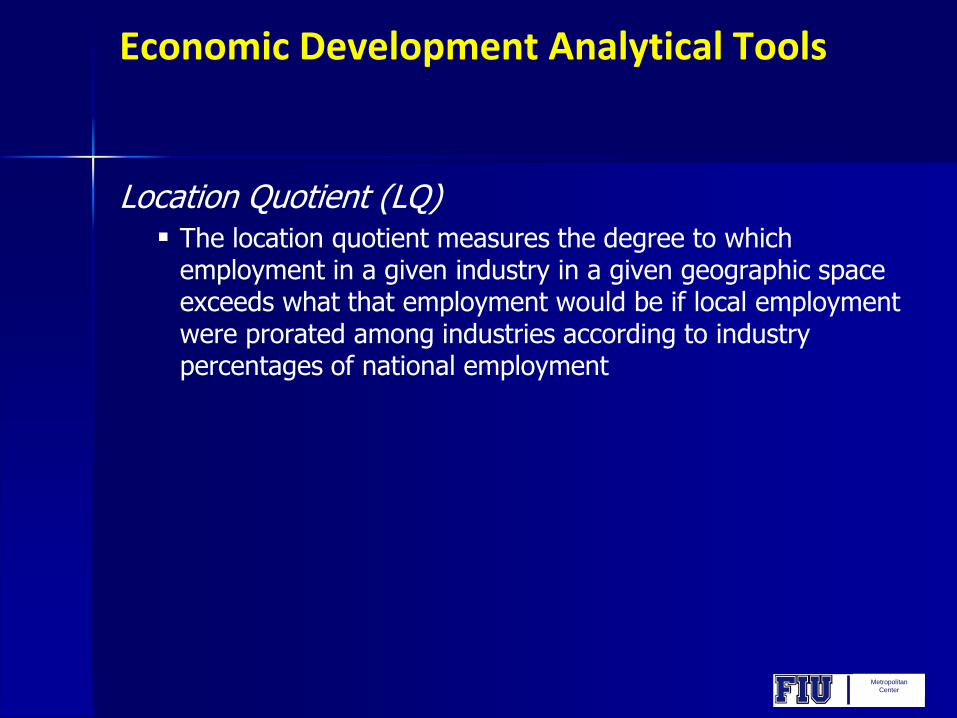
Economic Development Analytical Tools
Location Quotient (LQ) The location quotient measures the degree to which
employment in a given industry in a given geographic space exceeds what that employment would be if local employment were prorated among industries according to industry percentages of national employment
Metropolitan
Center
Economic Development Analytical Tools
Shift-Share Analysis: Technique used to Identify any Change in the Mix of
Employment in a Region (Shift) and to Compare that Pattern of Change with that of the National Economy (Share).
Metropolitan
Center
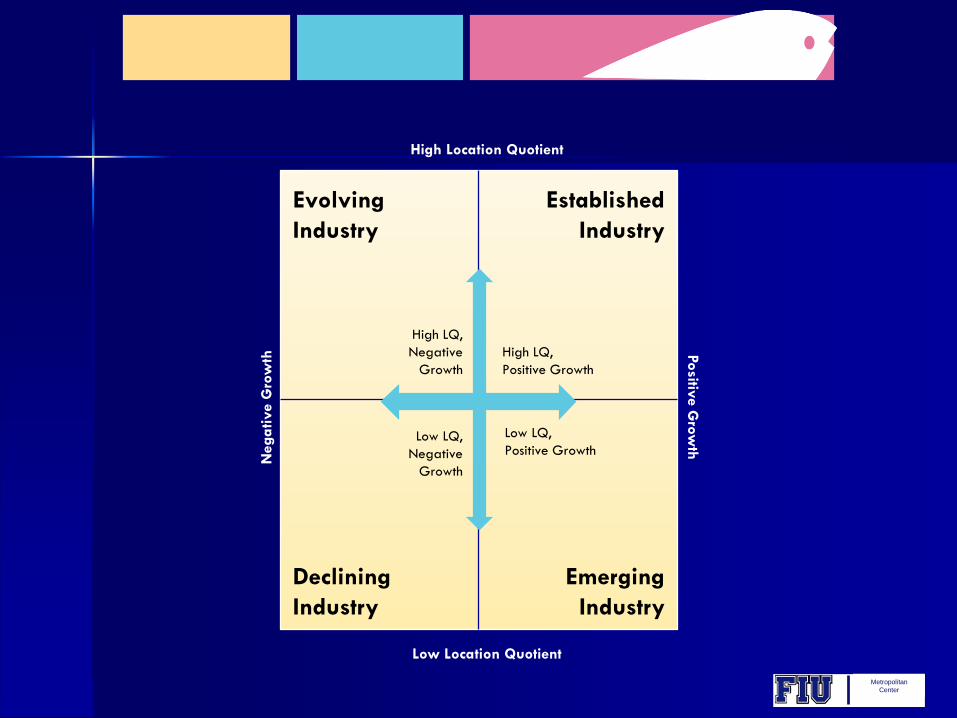
High Location Quotient
Low Location Quotient
Positiv
e G
row
thN
ega
tive G
row
th
Evolving
Industry
Established
Industry
Declining
Industry
Emerging
Industry
High LQ,
Negative
Growth
Low LQ,
Negative
Growth
High LQ,
Positive Growth
Low LQ,
Positive Growth
Metropolitan
Center
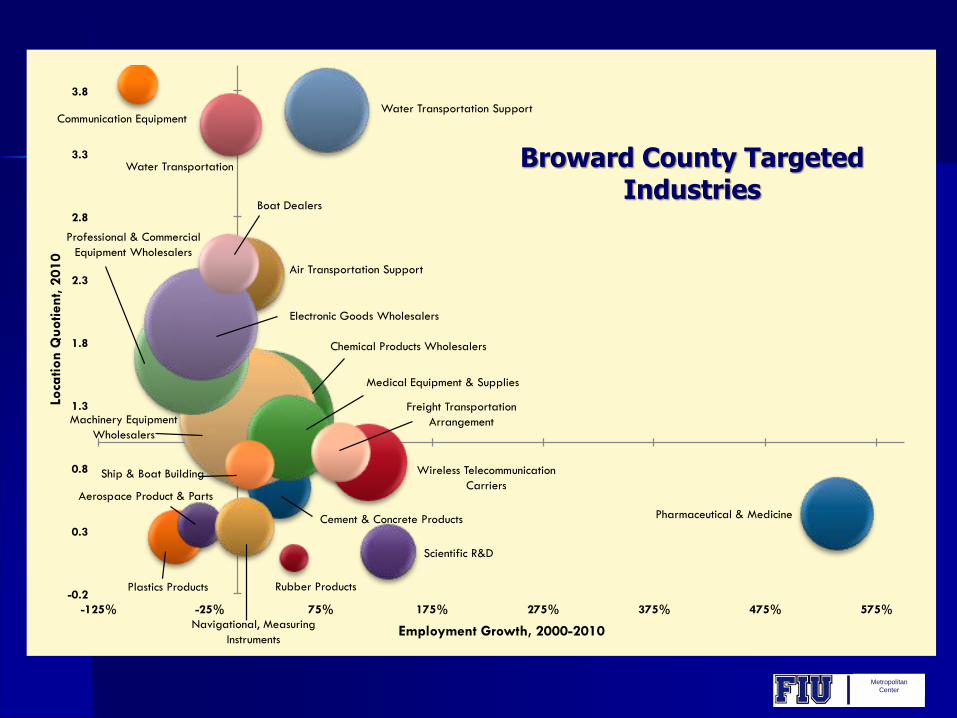
Chemical Products Wholesalers
Plastics Products Rubber Products
Cement & Concrete Products
Machinery Equipment
Wholesalers
Aerospace Product & Parts
Air Transportation Support
Communication Equipment
Wireless Telecommunication
Carriers
Pharmaceutical & Medicine
Medical Equipment & Supplies
Scientific R&D
Navigational, Measuring
Instruments
Ship & Boat Building
Water Transportation
Water Transportation Support
Professional & Commercial
Equipment Wholesalers
Electronic Goods Wholesalers
Freight Transportation
Arrangement
Boat Dealers
-0.2
0.3
0.8
1.3
1.8
2.3
2.8
3.3
3.8
-125% -25% 75% 175% 275% 375% 475% 575%
Loca
tion Q
uotient, 2
010
Employment Growth, 2000-2010
Broward County Targeted Industries
Metropolitan
Center
Assess the local economy’s strengths and weaknesses (SWOT analysis)
Important to identify any structural weaknesses that may make the region vulnerable and determine what can be done to ensure economic stability
Determine which aspects of the region (social political, and economic) promote or detract from the location or expansion of industry and trade in the community
Step 5: Identify Local Strengths and Barriers to Growth
Metropolitan
Center
Step 5: Identify Local Strengths and Barriers to Growth (Cont)
Understand Regional Economic Linkages that Affect Economic Growth - Relationships between the economic base and other aspects of the community, including:
Housing market
Land use
Public finance
Environmental quality
Transportation
Metropolitan
Center
Step 6: Assess Wider Economic Environment & Trends
What Key Trends are Impacting the Local Economy, and are Shaping Growth and Policy Responses?
Additional & New Economic Analytical Tools

Metropolitan
Center
Step 6: Assess Wider Economic Environment & Trends (Cont)
The Sources of Economic (Employment) Growth:
Small Firms Most Important Component Of New Job Creation
Firms Less Than 20 Employees = 53% Of All Jobs Created
Since 1992
Firms Less Than 50 Employees = 62% Of All Jobs Created
Since 1992
Firms Less Than 50 Employees = 43% Of All New US Jobs
Annually
Metropolitan
Center
Step 6: Assess Wider Economic Environment & Trends (Cont)
The Sources of Economic (Employment) Growth: US: 86% Of Establishments Less Than 20 Employees
Miami Metro: 91% Of All Establishments Less Than 20 Employees
Miami Metro: 96% Less Than 50 Employees
Including Non-employer Establishments: 99% Of All Business Establishments Less than 50 Employees
Miami Metro: Self-employment Grew 50% Since 2000 (US = 11%)
High-tech Occupations: Highest Rates Of Self-employment
Metropolitan
Center
Step 6: Assess Wider Economic Environment & Trends (Cont)
The Sources of Economic (Employment) Growth:
Dynamic Regional Business Formation Rate Miami Metro: Top 3 Metros Since 2004 For New Business
Creation
Miami Metro: 2012 Highest Entrepreneurial Index — 560 New Firms Per 100,000 Persons Per Month (US Avg = 300)
Miami Metro: 2013 — 430 New Businesses Created Per 100,000 Persons Per Month
Miami Metro: 2013 Index 1.5 Times The National Average
South Florida Recovery Has Been Led By Small Businesses Miami Metro: Establishments Employing Less Than 20 Accounted
For 94% Of All New Establishments Created Since The Bottom Of 2009

Metropolitan
Center
Step 6: Assess Wider Economic Environment & Trends (Cont)
Regional Industrial Composition

Metropolitan
Center
Step 6: Assess Wider Economic Environment & Trends (Cont)
The Sources of Economic (Employment) Growth:
Metropolitan
Center
Step 6: Assess Wider Economic Environment & Trends (Cont)
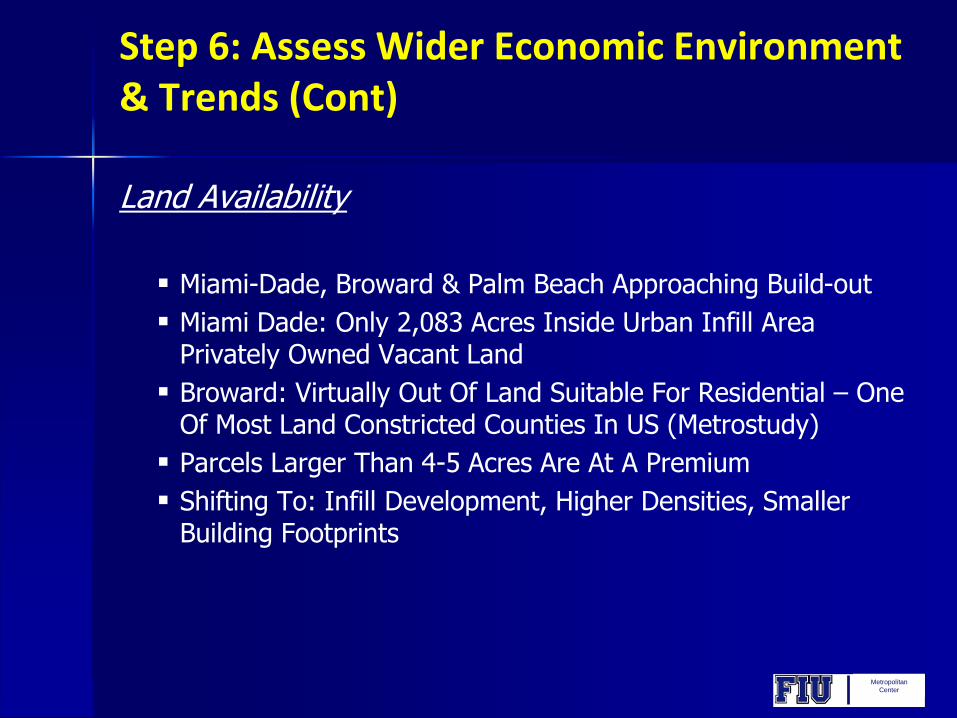
Land Availability
Miami-Dade, Broward & Palm Beach Approaching Build-out
Miami Dade: Only 2,083 Acres Inside Urban Infill Area Privately Owned Vacant Land
Broward: Virtually Out Of Land Suitable For Residential – One Of Most Land Constricted Counties In US (Metrostudy)
Parcels Larger Than 4-5 Acres Are At A Premium
Shifting To: Infill Development, Higher Densities, Smaller Building Footprints
Metropolitan
Center
Step 6: Assess Wider Economic Environment & Trends (Cont)
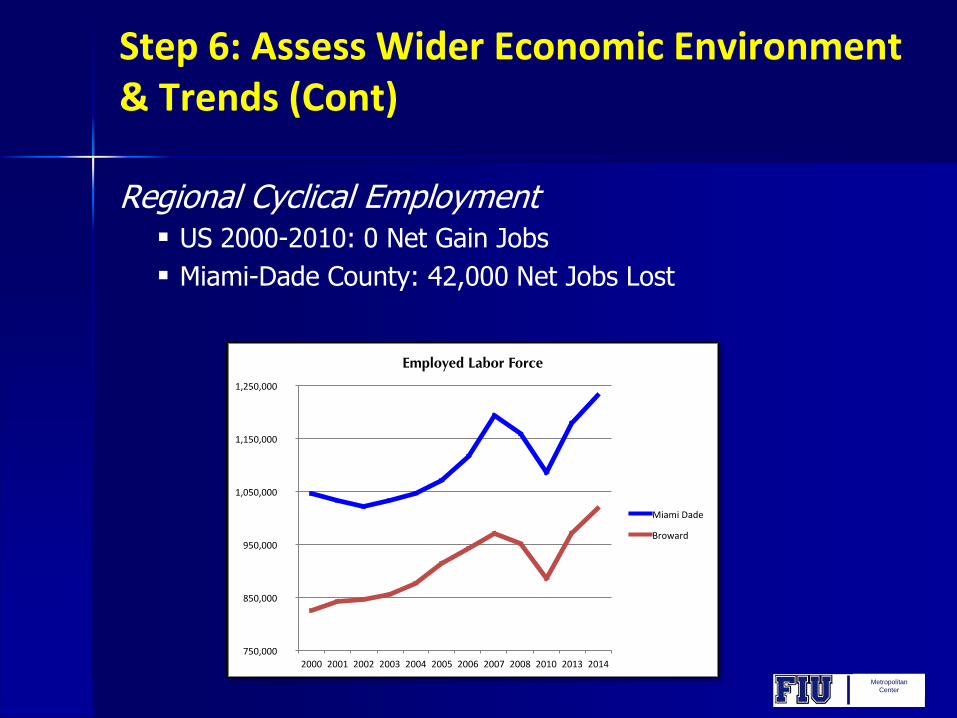
Regional Cyclical Employment US 2000-2010: 0 Net Gain Jobs
Miami-Dade County: 42,000 Net Jobs Lost

Metropolitan
Center
Step 6: Assess Wider Economic Environment & Trends (Cont)
HH Income Trends Broward Median HH Income = $51,694; 3% Below US Median
Miami Dade Median HH Income = $43,605 – 16% Below US
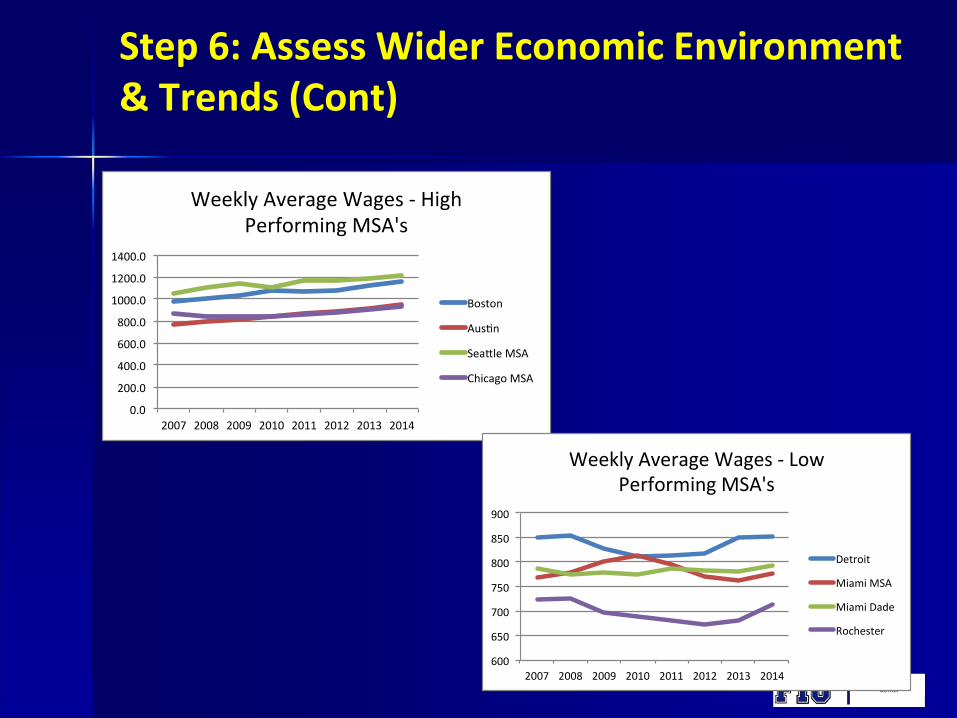
Metro: Below Average Wages And Incomes
Slowing Wage Growth Wages Lower Than Their National Averages.
Broward Wage Growth: +3% 2000-2007; Under 2% Since2009
At Or Less Than Current Annual Rate Of Inflation Since 2010
Evidence Of High Wage Job Shedding During Recession
Metropolitan
Center
Step 6: Assess Wider Economic Environment & Trends (Cont)
600
650
700
750
800
850
900
2007 2008 2009 2010 2011 2012 2013 2014
WeeklyAverageWages-LowPerformingMSA's
Detroit
MiamiMSA
MiamiDade
Rochester
Metropolitan
Center
Step 6: Assess Wider Economic Environment & Trends (Cont)
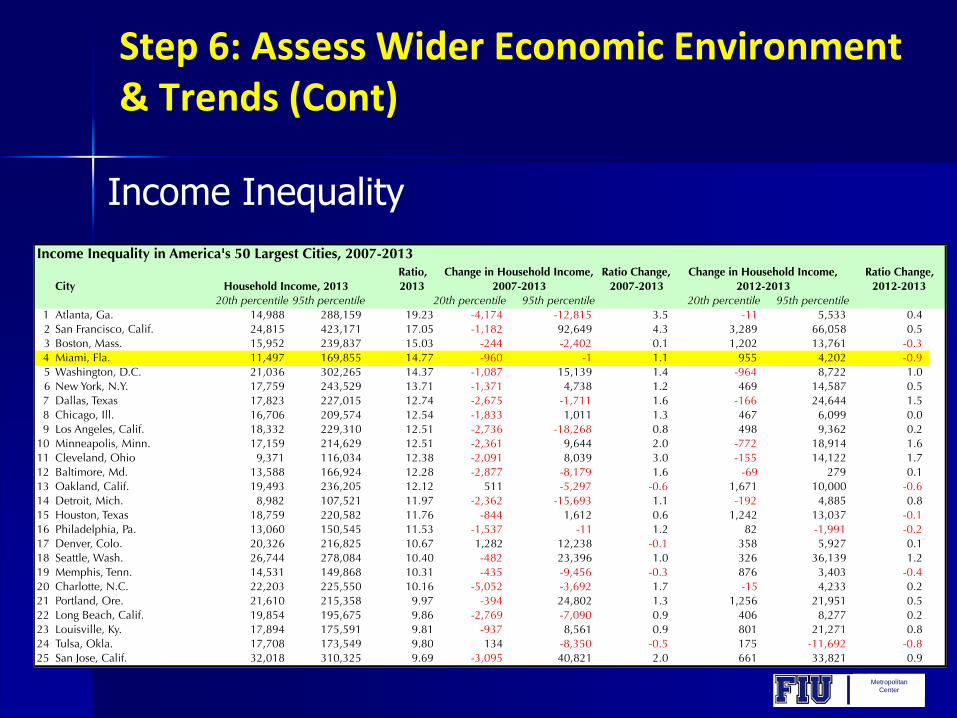
Income Inequality
Metropolitan
Center
Step 6: Assess Wider Economic Environment & Trends (Cont)
Understanding The New Economy: Globalization in its most current form still involves the flow of
capital and labor, but it is the flow of knowledge and information, creating a global net of ideas that is so dramatic and significant
Building Local Capacity/Competitiveness: Competitiveness within the context of the global economy
requires building local capacity within knowledge-based industries
Fundamental to entrepreneurial environments is an educated and trained workforce
Metropolitan
Center
Step 6: Assess Wider Economic Environment & Trends (Cont)
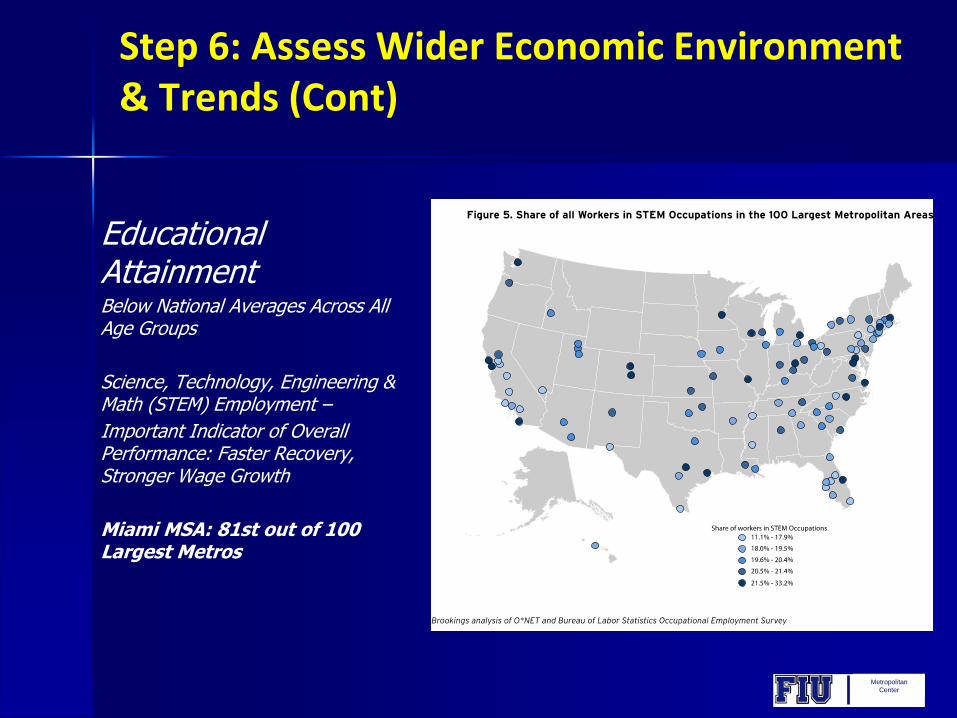
Educational AttainmentBelow National Averages Across All Age Groups
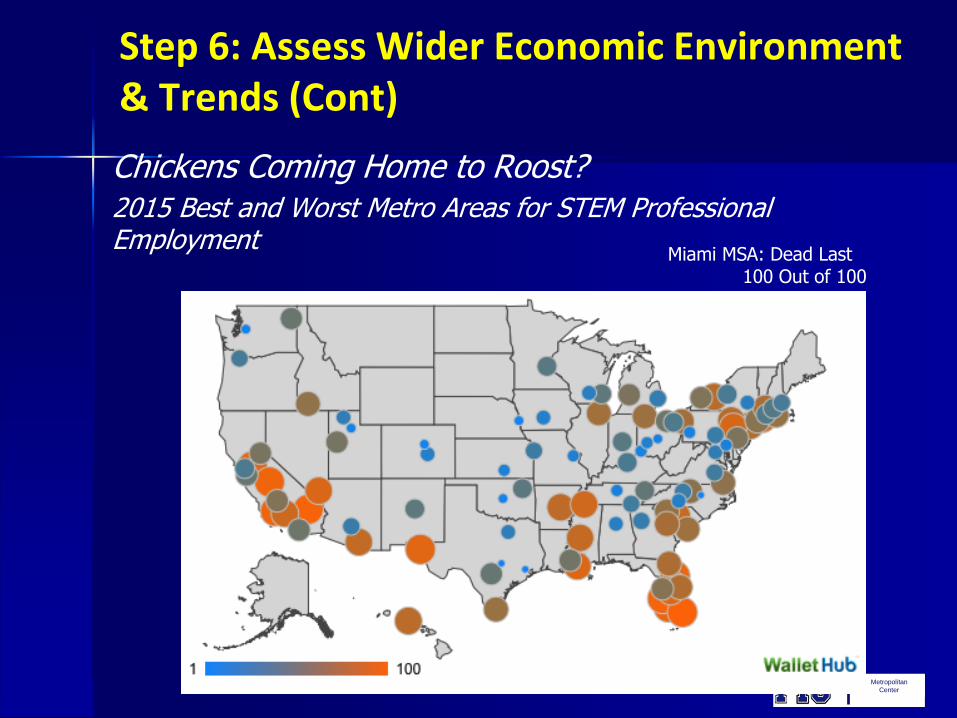
Science, Technology, Engineering & Math (STEM) Employment –
Important Indicator of Overall Performance: Faster Recovery, Stronger Wage Growth
Miami MSA: 81st out of 100 Largest Metros
Metropolitan
Center
Step 6: Assess Wider Economic Environment & Trends (Cont)
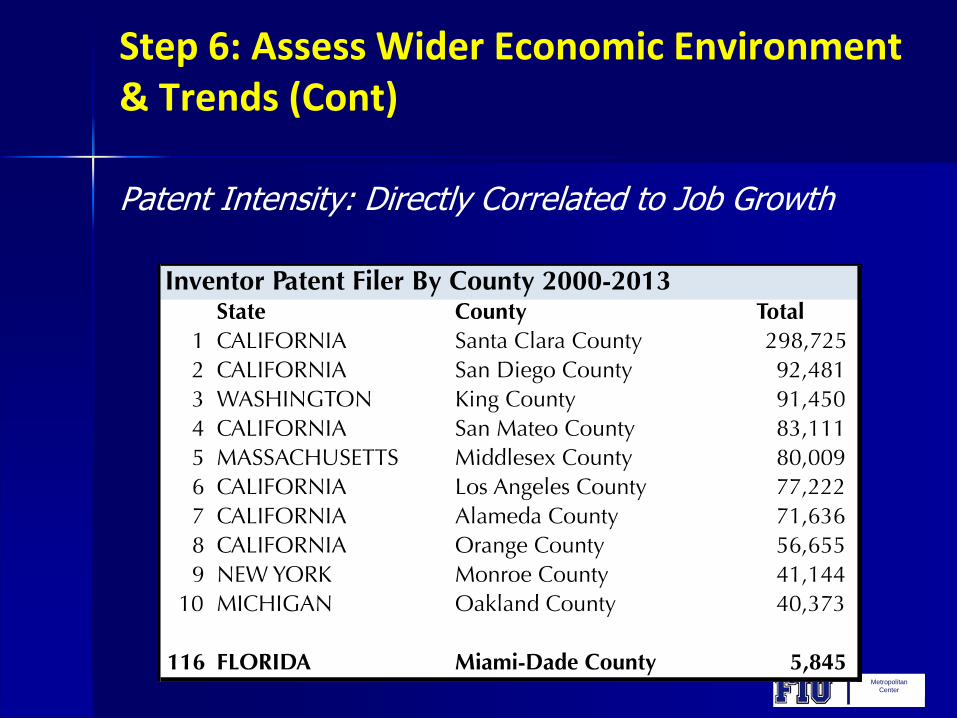
Patent Intensity: Directly Correlated to Job Growth
Metropolitan
Center
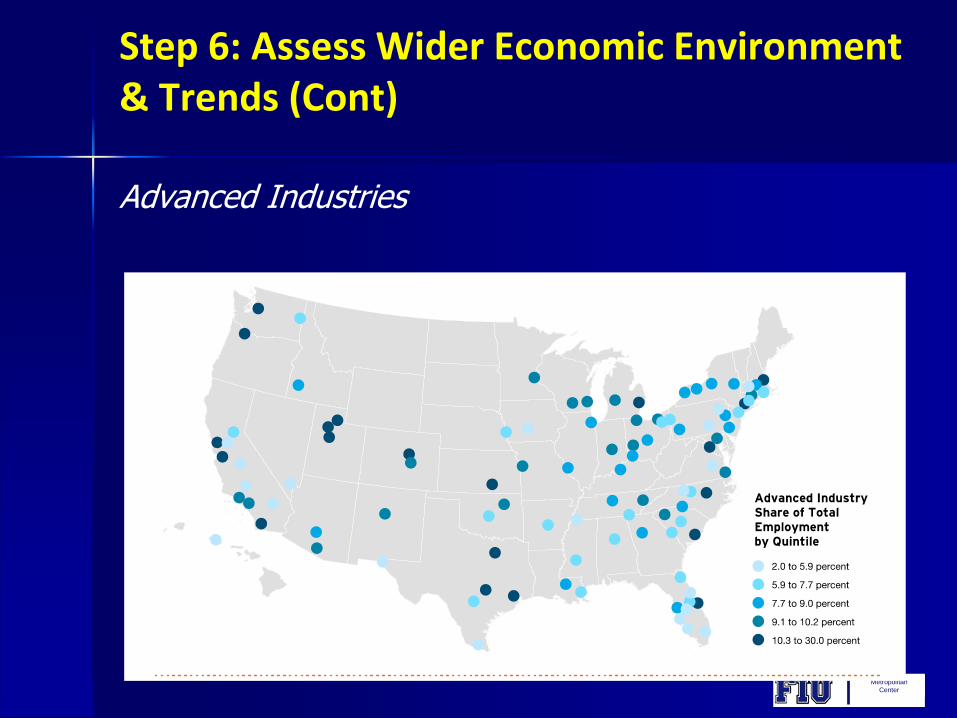
Step 6: Assess Wider Economic Environment & Trends (Cont)
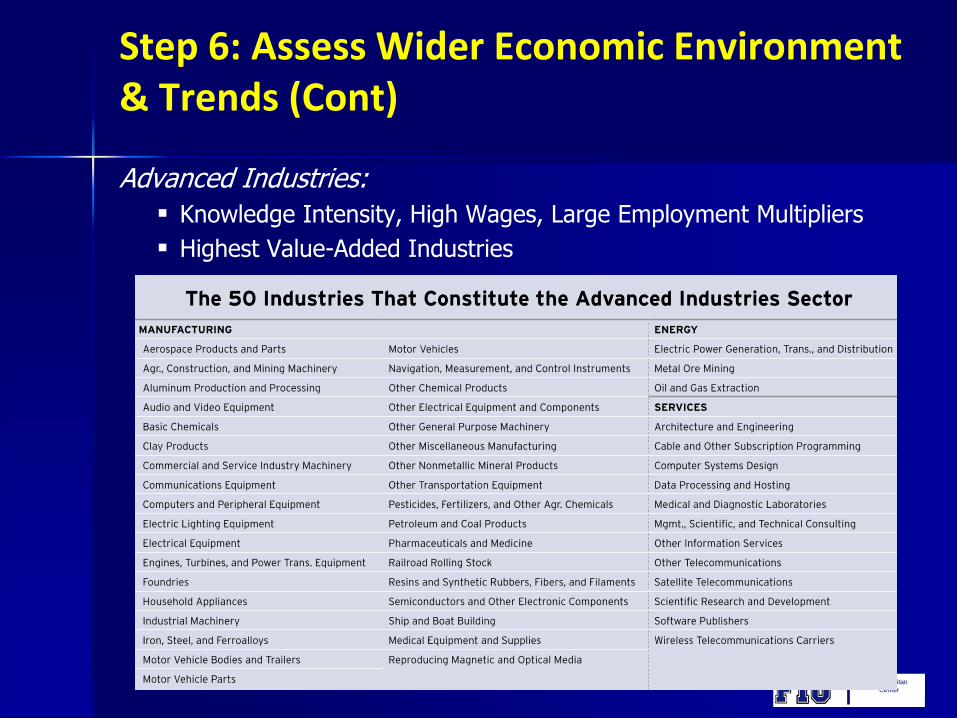
Advanced Industries:
Knowledge Intensity, High Wages, Large Employment Multipliers
Highest Value-Added Industries
Metropolitan
Center
Step 6: Assess Wider Economic Environment & Trends (Cont)
Advanced Industries
Metropolitan
Center
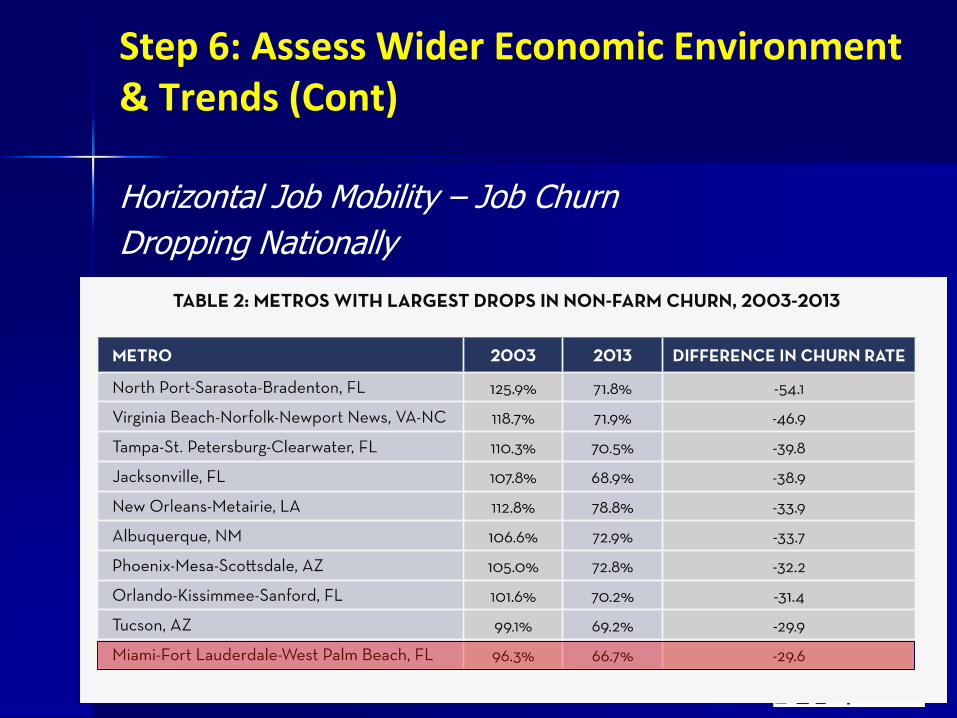
Step 6: Assess Wider Economic Environment & Trends (Cont)
Horizontal Job Mobility – Job Churn
Dropping Nationally
Metropolitan
Center
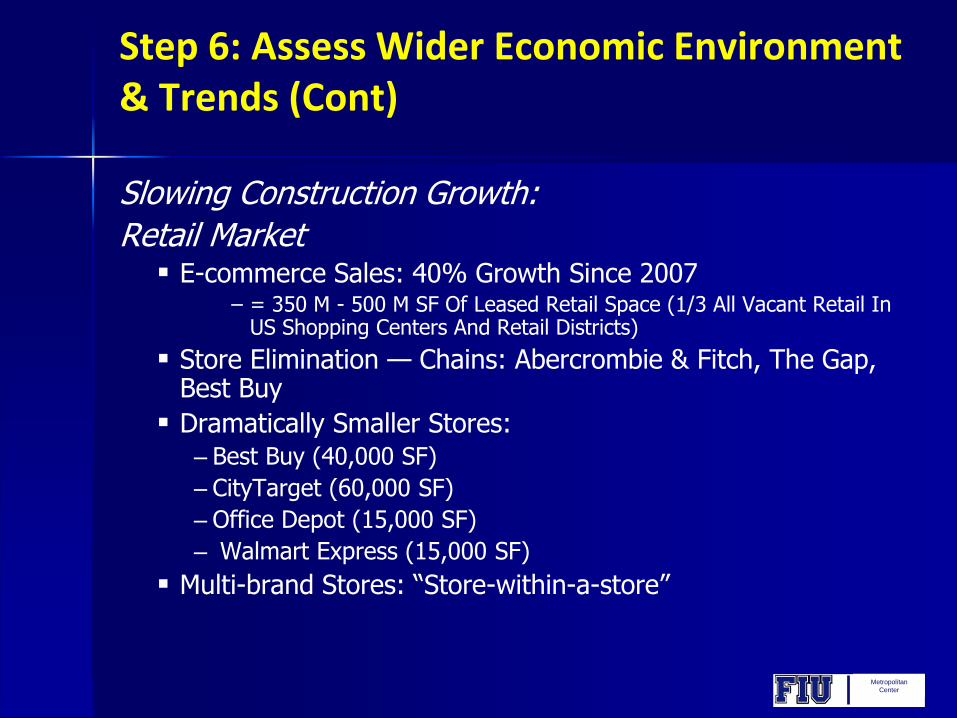
Step 6: Assess Wider Economic Environment & Trends (Cont)
Slowing Construction Growth:
Retail Market E-commerce Sales: 40% Growth Since 2007
– = 350 M - 500 M SF Of Leased Retail Space (1/3 All Vacant Retail In US Shopping Centers And Retail Districts)
Store Elimination — Chains: Abercrombie & Fitch, The Gap, Best Buy
Dramatically Smaller Stores: – Best Buy (40,000 SF)
– CityTarget (60,000 SF)
– Office Depot (15,000 SF)
– Walmart Express (15,000 SF)
Multi-brand Stores: “Store-within-a-store”
Metropolitan
Center
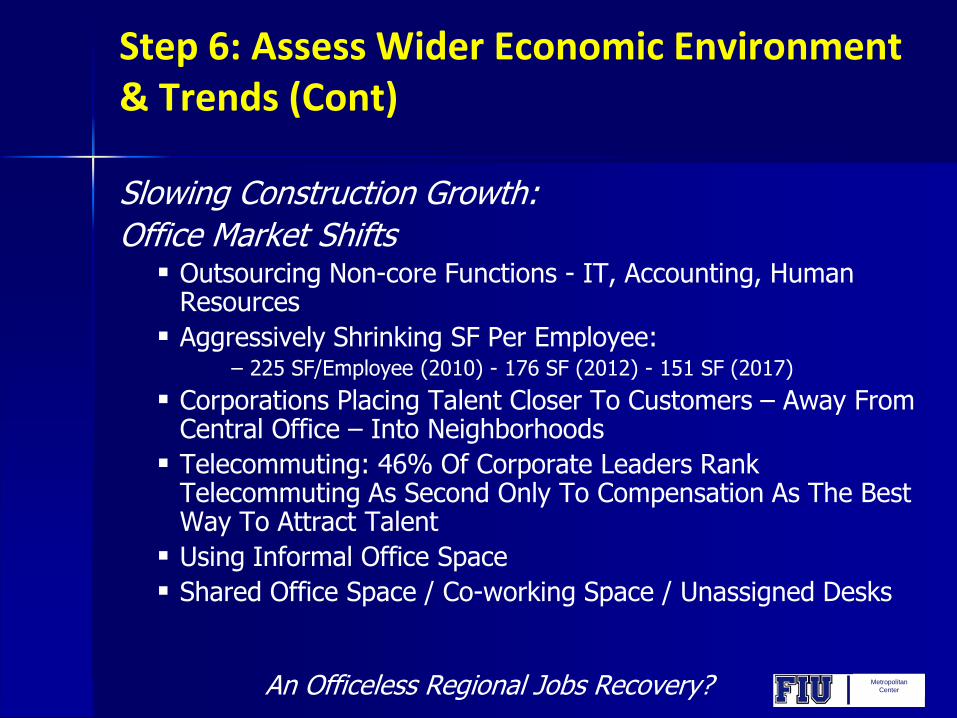
Step 6: Assess Wider Economic Environment & Trends (Cont)
Slowing Construction Growth:
Office Market Shifts Outsourcing Non-core Functions - IT, Accounting, Human
Resources
Aggressively Shrinking SF Per Employee: – 225 SF/Employee (2010) - 176 SF (2012) - 151 SF (2017)
Corporations Placing Talent Closer To Customers – Away From Central Office – Into Neighborhoods
Telecommuting: 46% Of Corporate Leaders RankTelecommuting As Second Only To Compensation As The Best Way To Attract Talent
Using Informal Office Space
Shared Office Space / Co-working Space / Unassigned Desks
An Officeless Regional Jobs Recovery?
Metropolitan
Center
Step 6: Assess Wider Economic Environment & Trends (Cont)
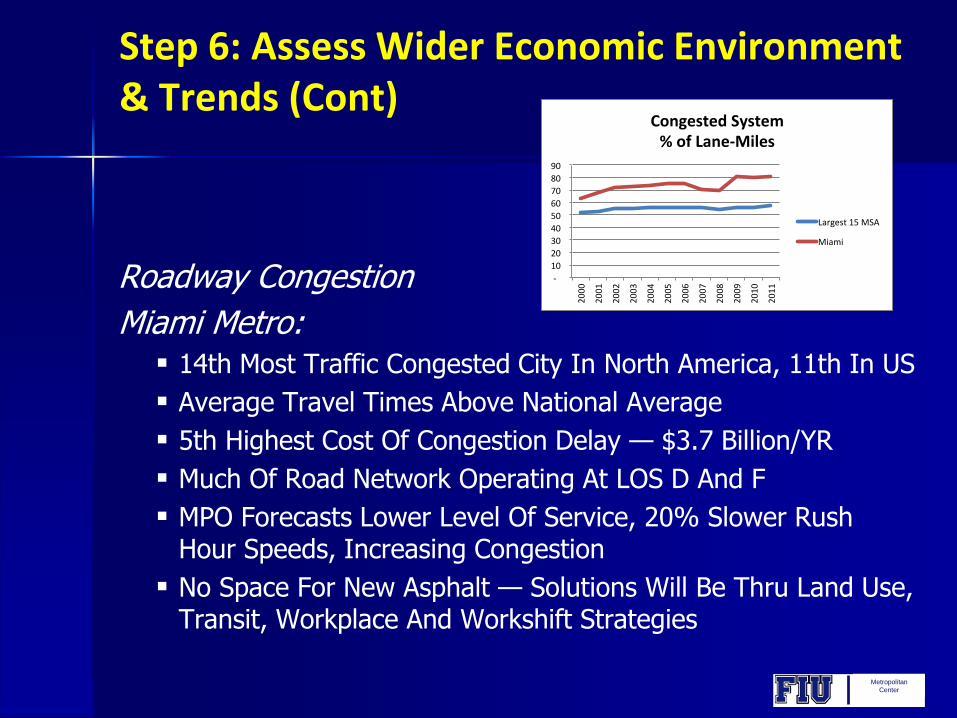
Roadway Congestion
Miami Metro: 14th Most Traffic Congested City In North America, 11th In US
Average Travel Times Above National Average
5th Highest Cost Of Congestion Delay — $3.7 Billion/YR
Much Of Road Network Operating At LOS D And F
MPO Forecasts Lower Level Of Service, 20% Slower RushHour Speeds, Increasing Congestion
No Space For New Asphalt — Solutions Will Be Thru Land Use, Transit, Workplace And Workshift Strategies
-
10
20
30
40
50
60
70
80
90
20
00
20
01
20
02
20
03
20
04
20
05
20
06
20
07
20
08
20
09
20
10
20
11
CongestedSystem%ofLane-Miles
Largest15MSA
Miami
Metropolitan
Center
Step 6: Assess Wider Economic Environment & Trends (Cont)
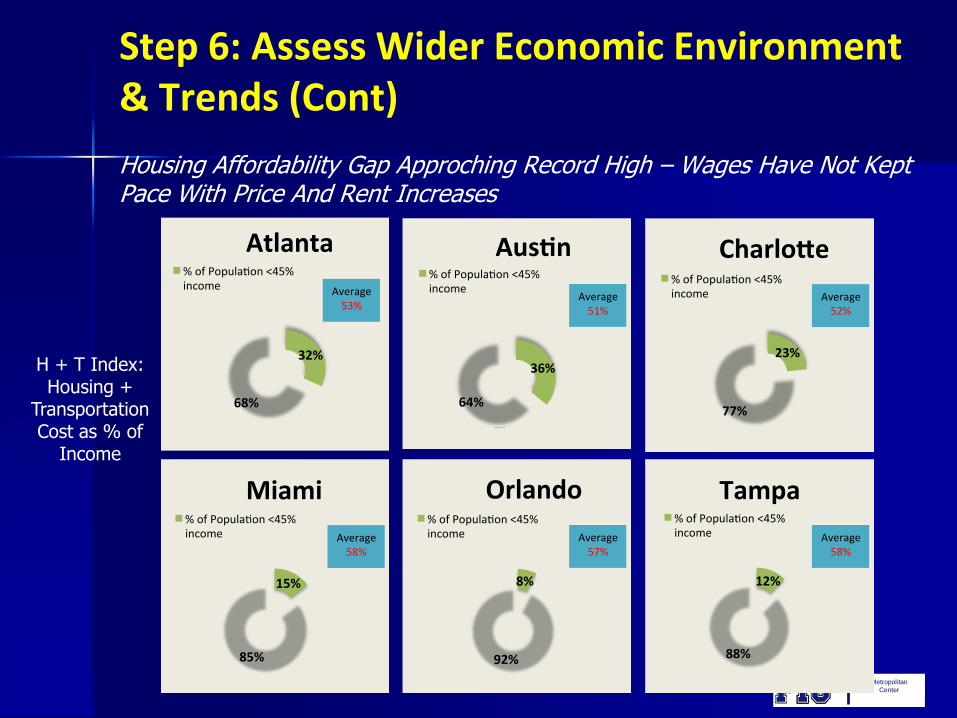
Housing Affordability Gap Approching Record High – Wages Have Not KeptPace With Price And Rent Increases
32%
68%
Atlanta%ofPopula on<45%income Average
53%
36%
64%
Aus n%ofPopula on<45%income
Average51%
23%
77%
Charlo e%ofPopula on<45%income Average
52%
15%
85%
Miami%ofPopula on<45%income Average
58%
8%
92%
Orlando%ofPopula on<45%income Average
57%
12%
88%
Tampa%ofPopula on<45%income Average
58%
H + T Index: Housing +
Transportation Cost as % of
Income
Metropolitan
Center
Step 6: Assess Wider Economic Environment & Trends (Cont)
Metropolitan
Center
Step 6: Assess Wider Economic Environment & Trends (Cont)
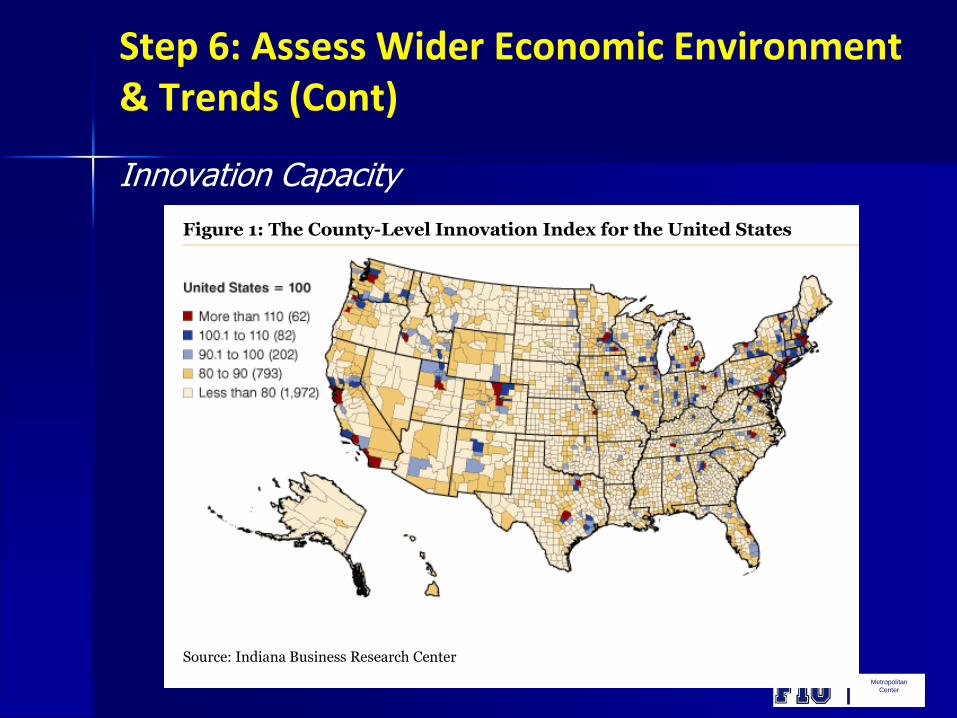
Innovation Capacity
Measuring Regional Capacity for Innovation
Innovation is a key ingredient in an economy’s ability to increase the standard of living for a region’s residents. Building on other
national and European research, a newly released Innovation Index (www.statsamerica.org/innovation) provides
policymakers and economic development practitioners with a unique web-based tool for exploring regional innovation
performance and comparing that with the United States, a state or other regions.
First Things First: What Is Innovation?
Our research focused on this definition: Innovation puts ideas into action with the result of increasing firms’ compensation and
profits. Innovation can result in the introduction of new or better goods and services and is manifest in adopting new
technologies and processes that increase productivity or lower costs. Adopting a new technology makes production more efficient.
Adopting new business models and organizational structures improve how firms meet consumer needs, process information or
make decisions. As a result, innovation reduces costs and increases profitability. Innovation can be incremental (e.g., reducing
breakage during shipping) or radical (e.g., using computers for business applications). On a more macro-level, innovation is
evident in an economy that is adaptable and that can readily move resources from lower value-added activities to higher value-
added activities.
Creating the Index
Combining multiple variables into a composite index provides a single, high-level snapshot to evaluate innovative capacity,
innovation outcomes and economic progress (see Figure 1). The indicators in the Innovation Index are derived from both
official government statistical agencies and several private, proprietary sources, including Economic Modeling Specialists,
Inc., Innovation Economy 360 and Moody’s economy.com.
Figure 1: The County-Level Innovation Index for the United States
Source: Indiana Business Research Center
The index includes both inputs and outputs together as a composite indicator of innovation capacity and output potential. Inputs
are those factors, influences or conditions that promote innovation. Inputs are divided into two sub-indexes: human capital and
economic dynamics.
Human Capital: These variables suggest the extent to which a county’s population and labor force are able to engage in
innovative activities. Counties with high levels of human capital are those with enhanced knowledge that can be measured by
high educational attainment, growth in younger age brackets of the workforce (signifying attractiveness to younger
generations of workers), and a sizeable number of innovation-related occupations and jobs relative to the overall labor force.
Economic Dynamics: These variables measure local business conditions and resources available to entrepreneurs and
businesses. Targeted resources such as research and development funds are input flows that encourage innovation close to
home, or that, if not present, can limit innovative activity.
Outputs are the direct outcomes and economic improvements that result from inputs. These are divided into two sub-indices:
productivity and employment, and economic well-being.
Productivity and Employment: These variables describe economic growth, regional desirability or direct outcomes of
innovative activity. Variables in this index suggest the extent to which local and regional economies are thriving and
attracting workers seeking particular jobs.
Economic Well-Being: Innovative economies improve economic well-being because residents earn more and have a
higher standard of living. Decreasing poverty rates, increasing employment, in-migration of new residents and improvements
A publication of the Indiana Business Research Center at IU's Kelley School of Business
1
2
3
Metropolitan
Center
Step 6: Assess Wider Economic Environment & Trends (Cont)
Chickens Coming Home to Roost?2015 Best and Worst Metro Areas for STEM Professional Employment
Miami MSA: Dead Last100 Out of 100
Metropolitan
Center
Step 7: Develop Strategic Responses
Basic Tools Marketing & Information – Accurate Information – Investor
Grade Market Information
Zoning
Infrastructure Improvements
Property Acquisition & Disposition
Incentives:
– Business Start-up
– Expansion
– Operating Incentives & Debt Service
– Worker Training
– Ancillary Incentives – Housing, etc.
Metropolitan
Center
Step 7: Develop Strategic Responses (Cont)
Incentives – Capital Investment & Infrastructure Support Sales Tax Refund for Business Machinery and Equipment Used in an
Enterprise
Sales Tax Refund for Building Materials Used in an Enterprise Zone
State of Florida Qualified Target Industry (QTI) Tax Refund
Qualified Defense and Space Contractor Tax Refund (QDSC)
Capital Investment Tax Credit (CITC)
High Impact Performance Incentive Grant (HIPI)
Economic Development Transportation Fund
Local Government Distressed Area Matching Grant Program (LDMG)
State of Florida Brownfield Program – Clean-up Grant
State of Florida Brownfield Program – Jobs Tax Credit
Small Business Grant Program
Impact & Development Fee Relief & Rebates
Capital Investment Tax Credits – New Markets Tax Credits
Metropolitan
Center
Step 7: Develop Strategic Responses (Cont)
Incentives – Employment Expansion Jobs Tax Credit
Incentives – Operating Cost Support & Debt Service Support Property Tax Rebates & Credits
Sales Tax Exemption For Electrical Energy
State of Florida Brownfield Program – Loan Guarantee Program
Energy Efficiency – Free Business Energy Evaluations & Financing Assistance
Police Security Audit & Security Services Grants
Low Interest Loans
Interest Rate Write-Downs
Loan Guarantees
Venture Capital Investment
Metropolitan
Center
Step 7: Develop Strategic Responses (Cont)
Incentives – Worker Training Quick Response Training Program (QRT)
Incumbent Worker Training Program (IWT)
Ancillary Incentives Relocation Expense Grants
Residential Improvement, Mortgage Support & Homebuyer Subsidies
Metropolitan
Center
Step 7: Develop Strategic Responses (Cont)
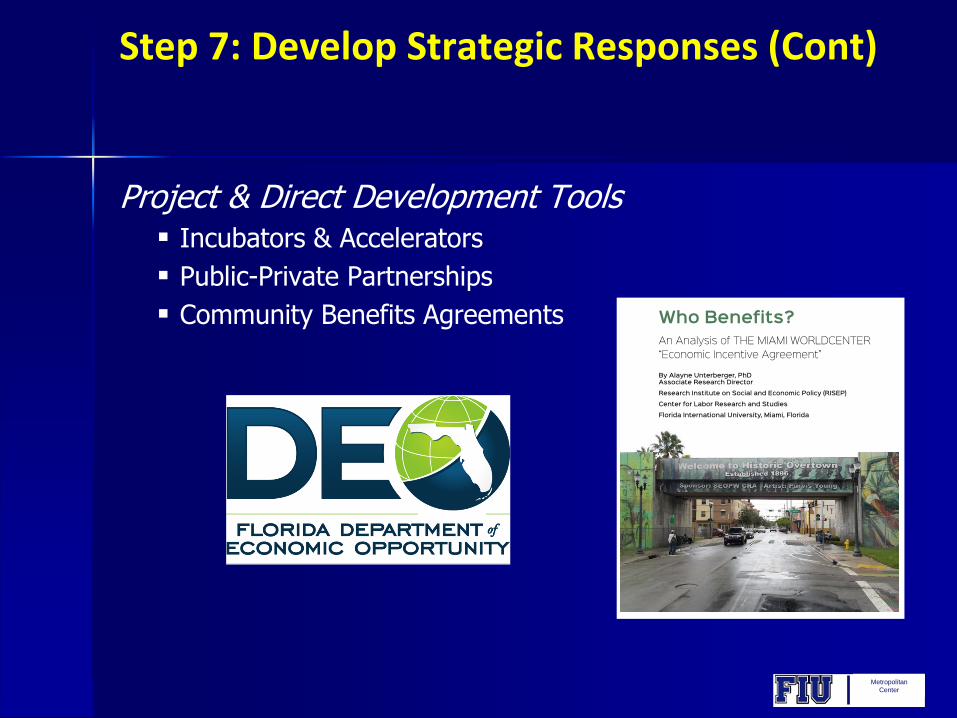
Project & Direct Development Tools Incubators & Accelerators
Public-Private Partnerships
Community Benefits Agreements

Metropolitan
Center
Step 7: Develop Strategic Responses (Cont)
Best Practices
Identifying and implementing local economic development programs and activities based on a clear understanding of a locality’s competitive advantages
Would ideally occur within the framework of a competitive entrepreneurial environment that has developed institutional capacity and support with respect to workforce development and inter-firm networks
Metropolitan
Center
Step 7: Develop Strategic Responses (Cont)
Best Practices The Hunt For The Great White Buffalo
– Singles & Doubles Drive Private Investment
– Large Projects Invite Large Risks
Incentives Specific to the Needs of Desired Industries orSpecific Problems
EASE OF USE
Geographic Targeting – Avoid Shotgun Approach
Stick To A Disciplined Minimum Investment Size
Let Users/Awardees Determine the Best use of Funds
Leverage Other Grants
Leverage Debt
Metropolitan
Center
Step 7: Develop Strategic Responses (Cont)
Best Practices
Small Business Development Strategies Creating New Employment & Business Formation
Opportunities Most Important Element Of CRA Structural Change
Most Often Missing Component Of CRA Action Agenda
Mentorship - Physical & Virtual Accelerators And Incubators Increasing
Emphasis on Growing Local Business– Attraction & Relocation Only Works Over Short Distances

Metropolitan
Center
Step 7: Develop Strategic Responses (Cont)
Partner For Success Business Mentoring
Accelerators & Incubators
Local Banks: Preferred Loans – Community Reinvestment ActPoints
SBA
Area Universities: Key Economic Development Building Block –Engine Of High Wage, High Skill Job Growth

Metropolitan
Center
Case Study:
Deerfield Beach, Florida
Metropolitan
Center
Case Study: Deerfield Beach, FL
5
Car, truck, or van -- carpooled 4,362 12.8% 81,530 9.8%
Public transportation (excluding taxicab) 818 2.4% 24,388 2.9%
Walked 656 1.9% 10,901 1.3%
Other means 508 1.5% 15,842 1.9%
Worked at home 778 2.3% 36,835 4.4% Source: U.S. Census ACS 2013 5-year estimates
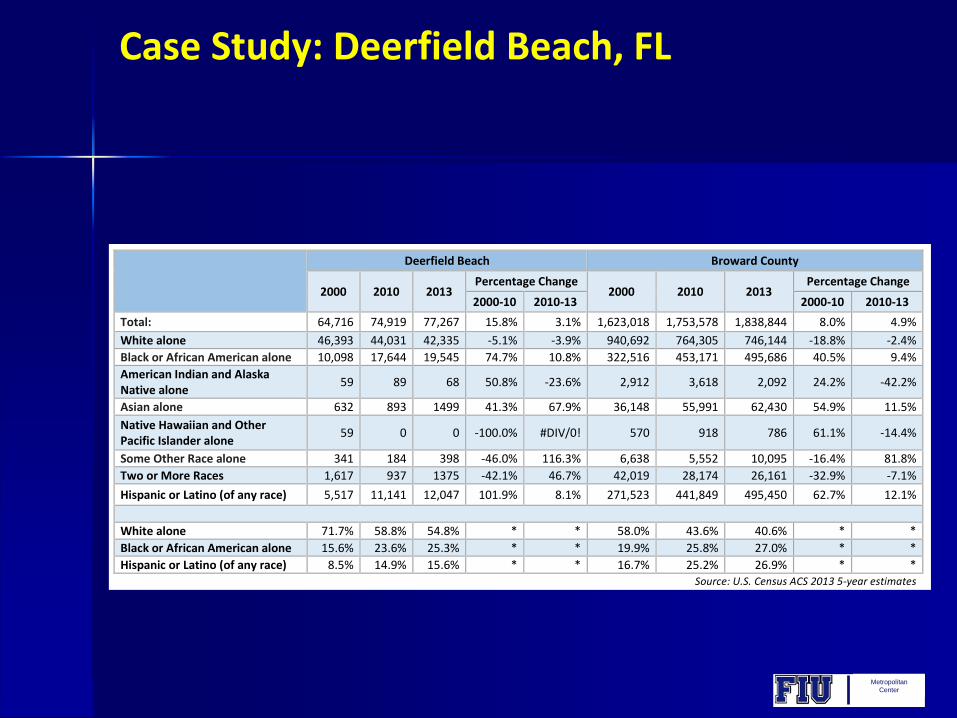
Race and Ethnicity
The racial and ethnic composition of the City of Deerfield Beach has been gradually changing since 2000. Following the Co un ty trend, the Ci t y’s
“White alone” population decreased for 71.8 percent of the population to 54.8 percent between 2000 and 2013. The percent of the City’s Black or
African American and Hispanic or Latino populations increased by 9.7 percent and 7.1 percent, respectively, during this time span.
Deerfield Beach Broward County
2000 2010 2013 Percentage Change
2000 2010 2013 Percentage Change
2000-10 2010-13 2000-10 2010-13
Total: 64,716 74,919 77,267 15.8% 3.1% 1,623,018 1,753,578 1,838,844 8.0% 4.9%
White alone 46,393 44,031 42,335 -5.1% -3.9% 940,692 764,305 746,144 -18.8% -2.4%
Black or African American alone 10,098 17,644 19,545 74.7% 10.8% 322,516 453,171 495,686 40.5% 9.4%
American Indian and Alaska Native alone
59 89 68 50.8% -23.6% 2,912 3,618 2,092 24.2% -42.2%
Asian alone 632 893 1499 41.3% 67.9% 36,148 55,991 62,430 54.9% 11.5%
Native Hawaiian and Other Pacific Islander alone
59 0 0 -100.0% #DIV/0! 570 918 786 61.1% -14.4%
Some Other Race alone 341 184 398 -46.0% 116.3% 6,638 5,552 10,095 -16.4% 81.8%
Two or More Races 1,617 937 1375 -42.1% 46.7% 42,019 28,174 26,161 -32.9% -7.1%
Hispanic or Latino (of any race) 5,517 11,141 12,047 101.9% 8.1% 271,523 441,849 495,450 62.7% 12.1%
White alone 71.7% 58.8% 54.8% * * 58.0% 43.6% 40.6% * *
Black or African American alone 15.6% 23.6% 25.3% * * 19.9% 25.8% 27.0% * *
Hispanic or Latino (of any race) 8.5% 14.9% 15.6% * * 16.7% 25.2% 26.9% * * Source: U.S. Census ACS 2013 5-year estimates
Metropolitan
Center
Case Study: Deerfield Beach, FL
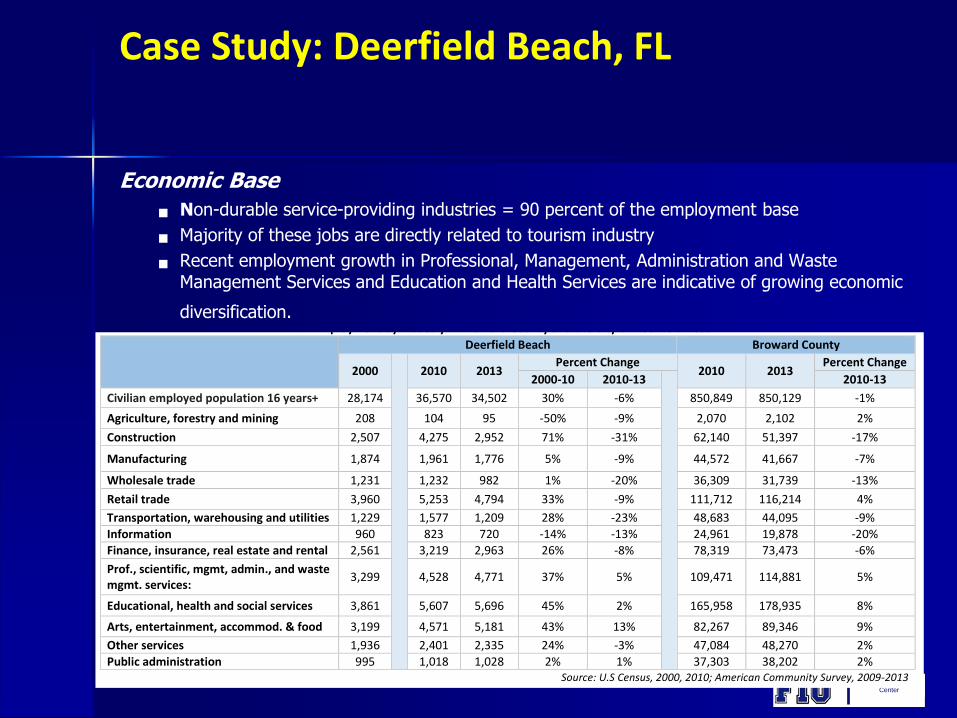
Economic Base
Non-durable service-providing industries = 90 percent of the employment base
Majority of these jobs are directly related to tourism industry
Recent employment growth in Professional, Management, Administration and Waste Management Services and Education and Health Services are indicative of growing economic
diversification.
7
The civilian workforce of Broward County and the City of Deerfield Beach was significantly impacted by the economic recession. However, in the
past year notable employment growth has occurred in a number of industries including Professional, Management, Administration and Waste
Management Services, Education and Health Services and Arts, Entertainment, and Accommodation and Food Services.
Employment by Industry in Broward County and the City of Deerfield Beach
Deerfield Beach Broward County
2000
2010 2013 Percent Change
2010 2013 Percent Change
2000-10 2010-13
2010-13
Civilian employed population 16 years+ 28,174 36,570 34,502 30% -6% 850,849 850,129 -1%
Agriculture, forestry and mining 208 104 95 -50% -9% 2,070 2,102 2%
Construction 2,507 4,275 2,952 71% -31% 62,140 51,397 -17%
Manufacturing 1,874 1,961 1,776 5% -9% 44,572 41,667 -7%
Wholesale trade 1,231 1,232 982 1% -20% 36,309 31,739 -13%
Retail trade 3,960 5,253 4,794 33% -9% 111,712 116,214 4%
Transportation, warehousing and utilities 1,229 1,577 1,209 28% -23% 48,683 44,095 -9%
Information 960 823 720 -14% -13% 24,961 19,878 -20%
Finance, insurance, real estate and rental 2,561 3,219 2,963 26% -8% 78,319 73,473 -6%
Prof., scientific, mgmt, admin., and waste mgmt. services:
3,299 4,528 4,771 37% 5% 109,471 114,881 5%
Educational, health and social services 3,861 5,607 5,696 45% 2% 165,958 178,935 8%
Arts, entertainment, accommod. & food 3,199 4,571 5,181 43% 13% 82,267 89,346 9%
Other services 1,936 2,401 2,335 24% -3% 47,084 48,270 2%
Public administration 995 1,018 1,028 2% 1% 37,303 38,202 2% Source: U.S Census, 2000, 2010; American Community Survey, 2009-2013
A current analysis of the major industry sectors and businesses in the City of Deerfield Beach according to the North American Industrial
Classification System (NAICS) shows a significant level of economic diversification in a range of industry sectors including Construction, Retail
Trade, Health Care and Social Assistance, and Professional, Scientific and Technical Services.
Metropolitan
Center
Case Study: Deerfield Beach, FL
Historic Dynamics
Local economy has yet to fully recover - City’s economy employs 37,879 persons which is just shy of its 2006 peak employment.
City’s median household income is 25 percent less than the County.
Adjusted for inflation (in 2015 dollars), median household income in Deerfield Beach declined 15 percent from 2009 to 2013 and is 18 percent less than in 2000.
While gaining population, City lost 143 households from 2009 to 2013 largely due to shrinking average household size and outmigration.
Metropolitan
Center
Case Study: Deerfield Beach, FL
The City has experienced rapid shifts in its household income structure. From 2009 to 2013 the largest loss of households by income were those earning $75,000 to $99,000 per year and those earning $35,000 to $49,999 per year.
City lost 956 households alone in these two middle and upper income segments.
The data indicates that even while the City added back jobs (to near its peak employment) the new jobs being created since 2009 are in a combination of lower wage sectors and are paying less than they were in 2009.

Metropolitan
Center
Case Study: Deerfield Beach, FL
Historic Dynamics – Business Establishment Formation Rate
Dramatic slowdown in number of business establishments and firms created within or locating to the City
From 2009 to 2013, only 27 net new business establishments were created
Slowdown in annual rate of net new business establishments shrank from annual average of 82 new establishments per year from 2000 to 2009 to only 27 per year from 2009 to 2013
Metropolitan
Center
Case Study: Deerfield Beach, FL
Establishment size structure Shifts Local economy added 98 establishments employing 1 to 4
persons
Added 15 more (net) employing more than 50 persons
During the same period net loss of 84 business establishments employing between 5 and 50 employees
While not conclusive, the data indicates that the Deerfield economy has grown significantly through expansion of its existing businesses and key new business locations, adding new employment without a significant increase in new business establishments
Metropolitan
Center
Case Study: Deerfield Beach, FL
Advanced Industry Sector High proportion of business firms and establishments in the
Advanced Industries Sector.
Home to 388 establishments and firms within the Advanced Industries Sector employing 4,178 workers, or just over 7 percent of the City’s jobs base.
The total employment of the local firms in the Sector and their parent companies is over 1.2 million workers.
The City’s Advanced Industries Sector generates over $1.1 billion in local sales, and if the parent companies of the local establishments are added generate over $569 billion in sales worldwide.
Metropolitan
Center
Case Study: Deerfield Beach, FL
19
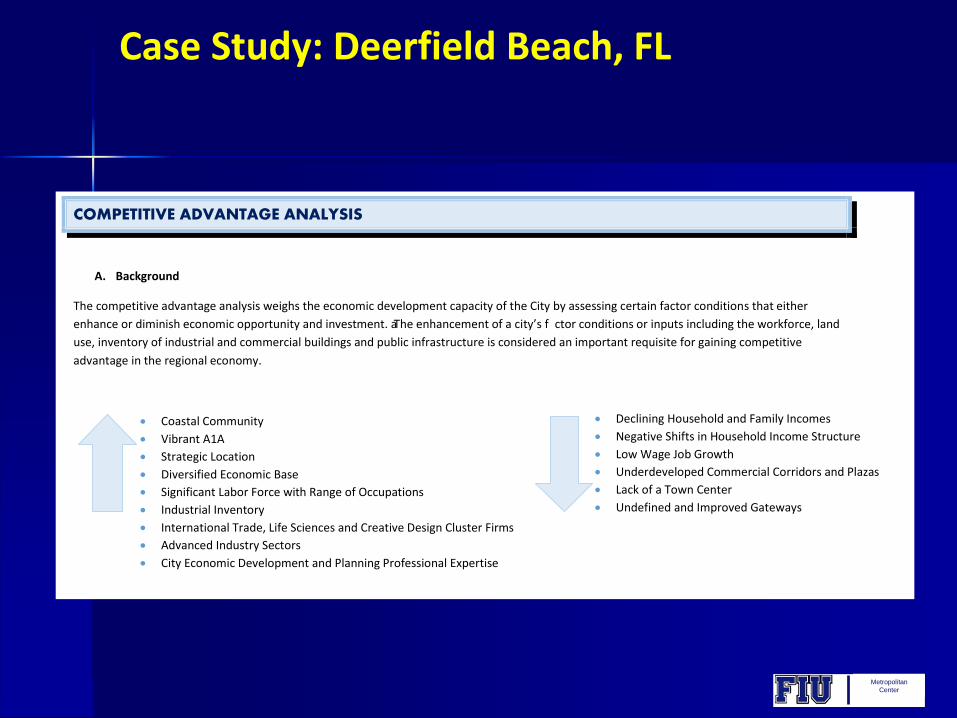
COMPETITIVE ADVANTAGE ANALYSIS
A. Background
The competitive advantage analysis weighs the economic development capacity of the City by assessing certain factor conditions that either
enhance or diminish economic opportunity and investment. The enhancement of a city’s fa ctor conditions or inputs including the workforce, land
use, inventory of industrial and commercial buildings and public infrastructure is considered an important requisite for gaining competitive
advantage in the regional economy.
Coastal Community
Vibrant A1A
Strategic Location
Diversified Economic Base
Significant Labor Force with Range of Occupations
Industrial Inventory
International Trade, Life Sciences and Creative Design Cluster Firms
Advanced Industry Sectors
City Economic Development and Planning Professional Expertise
Declining Household and Family Incomes
Negative Shifts in Household Income Structure
Low Wage Job Growth
Underdeveloped Commercial Corridors and Plazas
Lack of a Town Center
Undefined and Improved Gateways

Metropolitan
Center
Case Study: Deerfield Beach, FL
1.City Demographics: While the City’s educational attainment levels are below that of Broward County, there
has been significant improvement in recent years, i.e. 25+ year old population with bachelor’s degrees and overall college attainment levels.
2. Location: City strategically located in Broward County and centrally located inthe larger Tri-County
region Excellent highway access to its commercial and industrial corridors with two interchanges
on I-95 and direct access to the Florida Turnpike from SW 10th Street.
3. Economic Base: Employment growth in professional and business services, education and health services
and retail trade is directly related to the population growth during the past decade. City has established manufacturing sector with growth potential in several subsectors -
including international trade, life sciences and creative design. Manufacturing sector is comprised of over 25 different industry groups that account for
over 4,000 jobs City is well represented in several Broward County’s established industry clusters
including Life Sciences, Marine, International Trade & Logistics and Creative Design. The City is home to 388 establishments within the Advanced Industries Sector employing
approximately 4,178 workers.
19
COMPETITIVE ADVANTAGE ANALYSIS
A. Background
The competitive advantage analysis weighs the economic development capacity of the City by assessing certain factor conditions that either
enhance or diminish economic opportunity and investment. The enhancement of a city’s fa ctor conditions or inputs including the workforce, land
use, inventory of industrial and commercial buildings and public infrastructure is considered an important requisite for gaining competitive
advantage in the regional economy.
Coastal Community
Vibrant A1A
Strategic Location
Diversified Economic Base
Significant Labor Force with Range of Occupations
Industrial Inventory
International Trade, Life Sciences and Creative Design Cluster Firms
Advanced Industry Sectors
City Economic Development and Planning Professional Expertise
Declining Household and Family Incomes
Negative Shifts in Household Income Structure
Low Wage Job Growth
Underdeveloped Commercial Corridors and Plazas
Lack of a Town Center
Undefined and Improved Gateways
Metropolitan
Center
Case Study: Deerfield Beach, FL
4. Industrial and Commercial Inventory
The City has a significant inventory of both industrial (881.01 acres) and commercial (898.11 acres) land
Additional 41.42 acres is designated as office park
Industrial land accounts for 9.43 percent of the City’s land area
City has 355.60 vacant, undeveloped acres, of which, 126+ acres are industrial and 78+ acres commercial land uses.
5. Underdeveloped Commercial Corridors
City’s major commercial corridors have large stretches of Hillsboro Boulevard, Dixie Highway and Federal Highway corridor unremarkable and generally underdeveloped
Also, absent from the corridors are “gateway improvements” that can denote and distinguish the City’s key entrance points and give a sense of city ownership to these important roadways.
Metropolitan
Center
Case Study: Deerfield Beach, FL
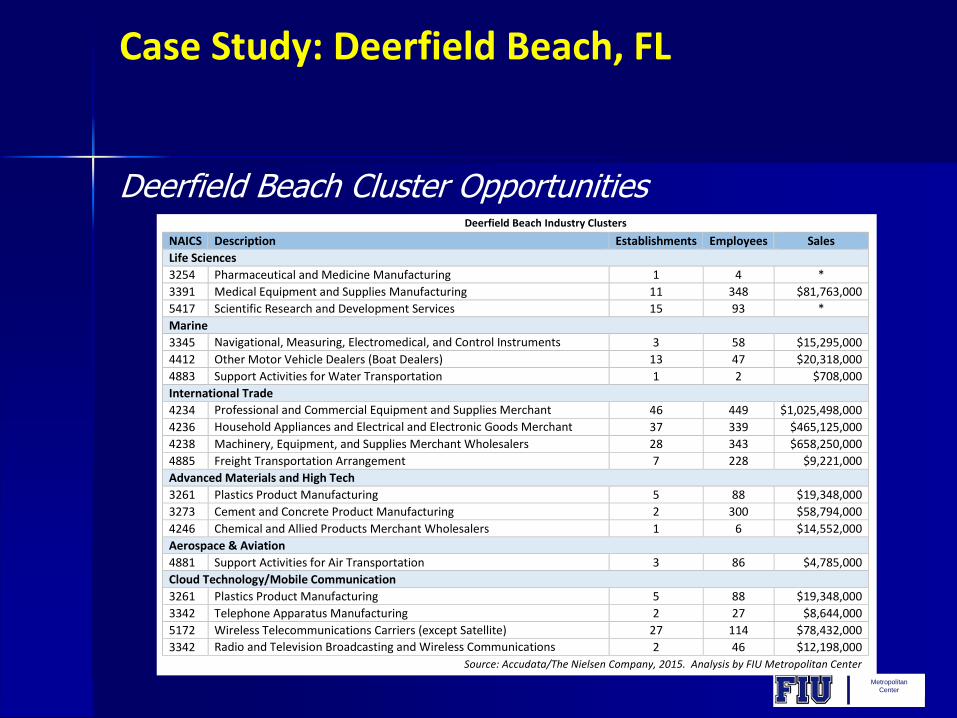
Deerfield Beach Cluster Opportunities
43
research and development services establishments in the City which employ 93 workers. The largest scientific research and development services establishments in the City include PSC (environmental & ecological services) located on SW 15th Street and Advanced Aquatic (lake management services) located on S. Military Trail.
Deerfield Beach Industry Clusters
NAICS Description Establishments Employees Sales
Life Sciences
3254 Pharmaceutical and Medicine Manufacturing 1 4 *
3391 Medical Equipment and Supplies Manufacturing 11 348 $81,763,000
5417 Scientific Research and Development Services 15 93 *
Marine
3345 Navigational, Measuring, Electromedical, and Control Instruments Manufacturing
3 58 $15,295,000
4412 Other Motor Vehicle Dealers (Boat Dealers) 13 47 $20,318,000
4883 Support Activities for Water Transportation 1 2 $708,000
International Trade
4234 Professional and Commercial Equipment and Supplies Merchant Wholesalers
46 449 $1,025,498,000
4236 Household Appliances and Electrical and Electronic Goods Merchant Wholesalers
37 339 $465,125,000
4238 Machinery, Equipment, and Supplies Merchant Wholesalers 28 343 $658,250,000
4885 Freight Transportation Arrangement 7 228 $9,221,000
Advanced Materials and High Tech
3261 Plastics Product Manufacturing 5 88 $19,348,000
3273 Cement and Concrete Product Manufacturing 2 300 $58,794,000
4246 Chemical and Allied Products Merchant Wholesalers 1 6 $14,552,000
Aerospace & Aviation
4881 Support Activities for Air Transportation 3 86 $4,785,000
Cloud Technology/Mobile Communication
3261 Plastics Product Manufacturing 5 88 $19,348,000
3342 Telephone Apparatus Manufacturing 2 27 $8,644,000
5172 Wireless Telecommunications Carriers (except Satellite) 27 114 $78,432,000
3342 Radio and Television Broadcasting and Wireless Communications Equipment Manufacturing
2 46 $12,198,000
Source: Accudata/The Nielsen Company, 2015. Analysis by FIU Metropolitan Center

Metropolitan
Center
Case Study: Deerfield Beach, FL
Deerfield Beach Cluster Opportunities
44
Creative Design
Creative design industries in the City of Deerfield Beach include four industry groups: 1) architectural and engineering services, 2) specialized
design services, 3) computer systems design and related services and 4) motion picture and video Industries. There are 63 architectural and
engineering firms in the City which employ 425 workers.
T
he total an n ual sa l es of the City’s ar chi tectural an d engineering industry gr oup is
estimated at $80.4 million. The largest architectural and engineering firms in the City include Kamm Consulting located on Newport Center Road
and Rimkus Consulting Group located on SW 12th Avenue. There are 43 specialized design services firms in the City which employ 115 workers.
The vast majority of these firms are either interior or graphic designers. The total annual sales of the City’s specialized de s i gn services industry
group is estimated at $14.6 million.
T
he Ci ty’s largest specialized de s i gn services firms include Decorators Mart Furniture located on North
Federal Highway and Studio Graphics located on Goolsby Boulevard. There are 22 computer systems design firms in the City which employ 157
workers.
Most of these fi rms pr ovide custom computer programming de s i gn se rvices. The total an n ual sa l es of the Ci ty’s computer systems
design industry group is estimated at $30.2 million. The largest computer systems design firms in the City include Coding Brains located on SW
15th Street and ISYS located on NE 21st Avenue. There are 14 motion picture and video industry firms in the City which employ 141 workers. The
total annual sales of the C
i
ty’s motion pi cture an d video industry gr o up is estimated at $62.4 million. The Ci ty’s largest motion pi cture and video
establishment is Quorum Productions located on Powerline Road.
Creative design establishments are typically small with under 5 employees. Significantly, nearly 60 percent of the City’s creative design firms have
appeared since 2010.
City of Deerfield Beach Creative Design Cluster Analysis
NAICS Description Establishments Employees Sales
5121 Motion Picture and Video Industries 14 141 $62,446,000
5413 Architectural, Engineering, and Related Services 63 425 $80,412,000
5414 Specialized Design Services 43 115 $14,665,000
5415 Computer Systems Design and Related Services 22 157 $30,283,000
Source: The Nielsen Company, 2015. Analysis by FIU Metropolitan Center