location analysis for outdoor recycling bin placement prepared for: final results
TRANSCRIPT


Location Analysis for Outdoor Recycling Bin Placement
Prepared for:
Final Results

Recycling
• Reduces greenhouse gas emissions• Reduces other pollutants• Reduces the need for landfills• Conserves resources• Produces economic benefit

Recycling and Texas State University
• Emerging Research University• over 35,000 students in 2013
• 44 outdoor recycling bins on campus• 8 purchased that have not been
placed

Problem Statement
• Analyze location of existing bins to determine the efficiency of their placement
• Determine optimal locations for unplaced bins

Project Overview
• Analyzed flow of foot traffic to determine most used paths
• Determined optimal locations for recycling bins
• Recommendations also considered bus stops, food courts, and underserved areas

Scope
Project duration: January 2014 – May 2014
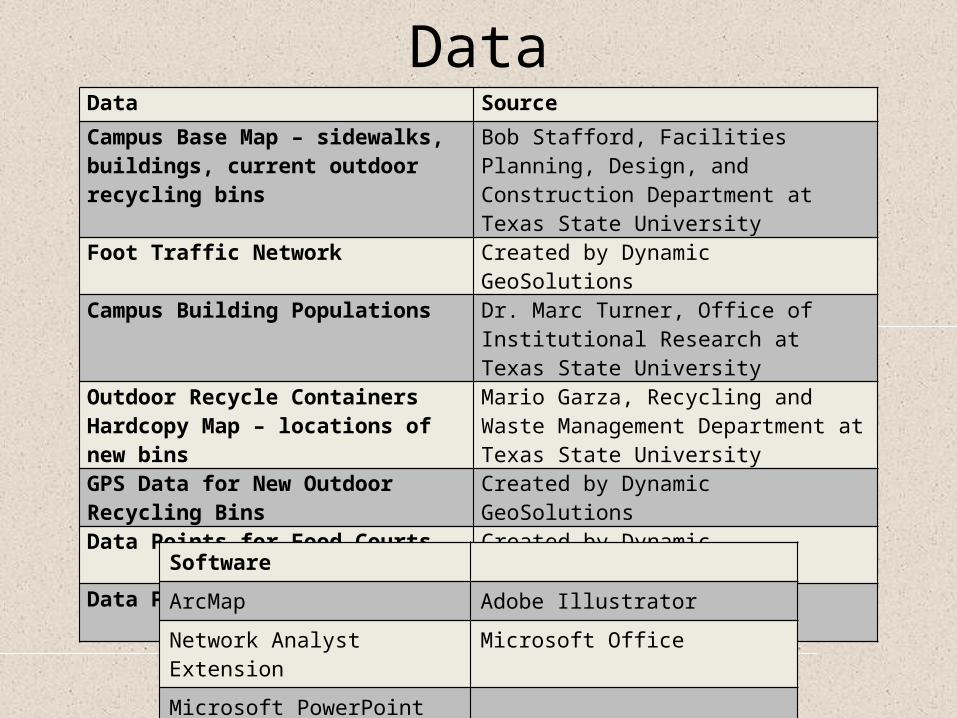
DataData Source
Campus Base Map – sidewalks, buildings, current outdoor recycling bins
Bob Stafford, Facilities Planning, Design, and Construction Department at Texas State University
Foot Traffic Network Created by Dynamic GeoSolutions
Campus Building Populations Dr. Marc Turner, Office of Institutional Research at Texas State University
Outdoor Recycle Containers Hardcopy Map – locations of new bins
Mario Garza, Recycling and Waste Management Department at Texas State University
GPS Data for New Outdoor Recycling Bins
Created by Dynamic GeoSolutions
Data Points for Food Courts Created by Dynamic GeoSolutions
Data Points for Bus Stops Created by Dynamic GeoSolutions
Software
ArcMap Adobe Illustrator
Network Analyst Extension
Microsoft Office
Microsoft PowerPoint

Methodology for Network Creation
• 23 buildings• 253 routes consisting of multiple
segments
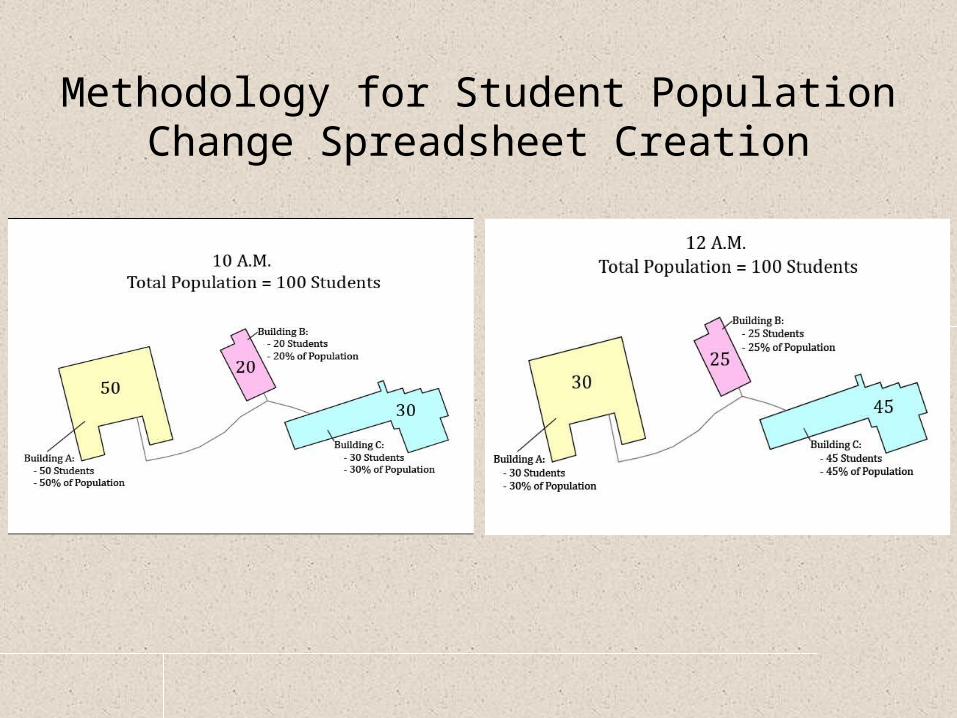
Methodology for Student Population Change Spreadsheet Creation
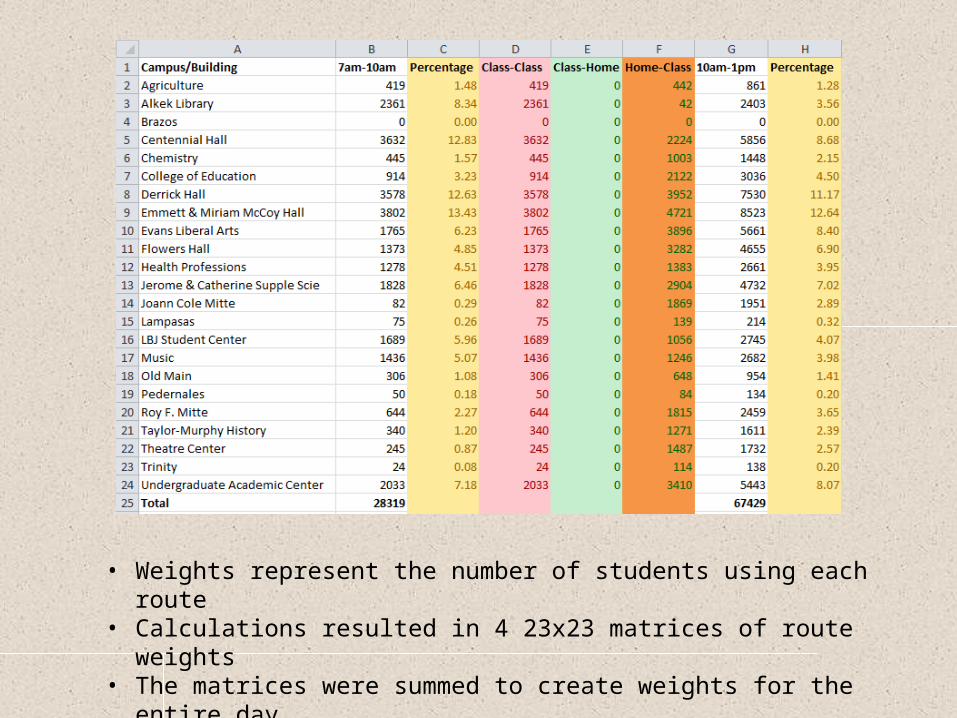
• Weights represent the number of students using each route• Calculations resulted in 4 23x23 matrices of route weights• The matrices were summed to create weights for the entire
day

Methodology for Analysis
• Weights were dissolved to the segments• Classified foot traffic
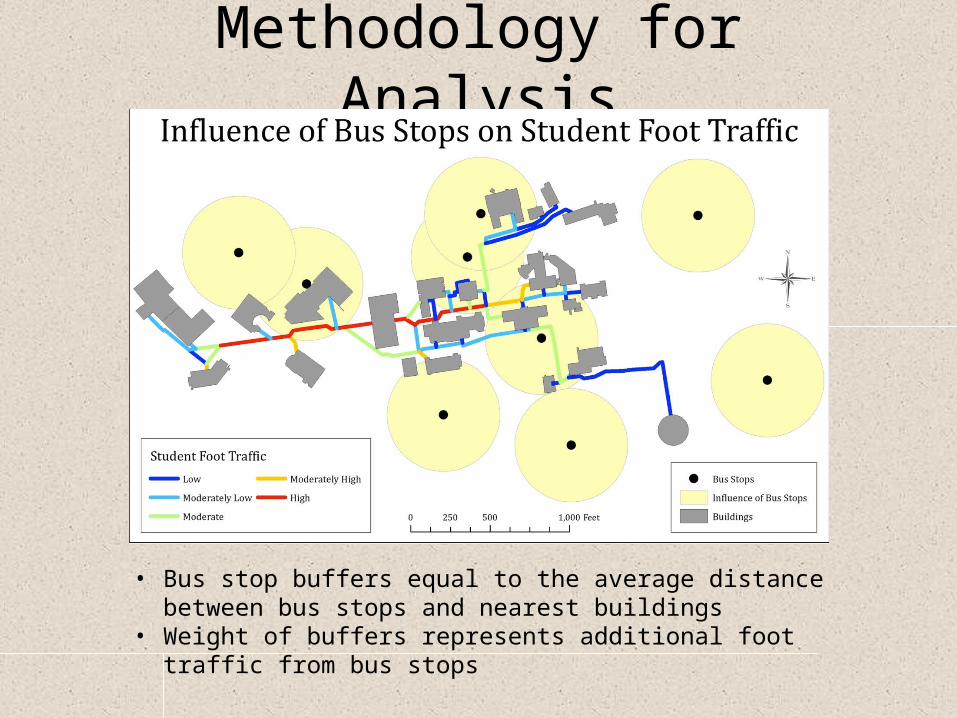
Methodology for Analysis
• Bus stop buffers equal to the average distance between bus stops and nearest buildings
• Weight of buffers represents additional foot traffic from bus stops
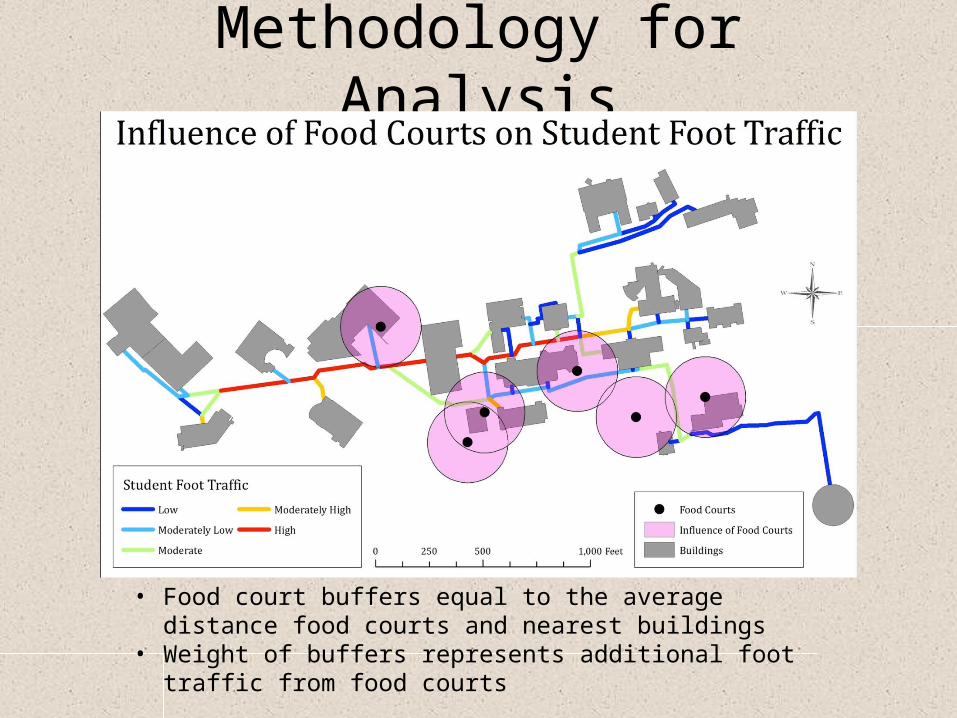
Methodology for Analysis
• Food court buffers equal to the average distance food courts and nearest buildings
• Weight of buffers represents additional foot traffic from food courts

Methodology for Analysis
Foot traffic with the influence of bus stops and food courts

Methodology for Recommendations
On average people will walk 12 m (39.37 ft) to dispose of refuse in a public place.
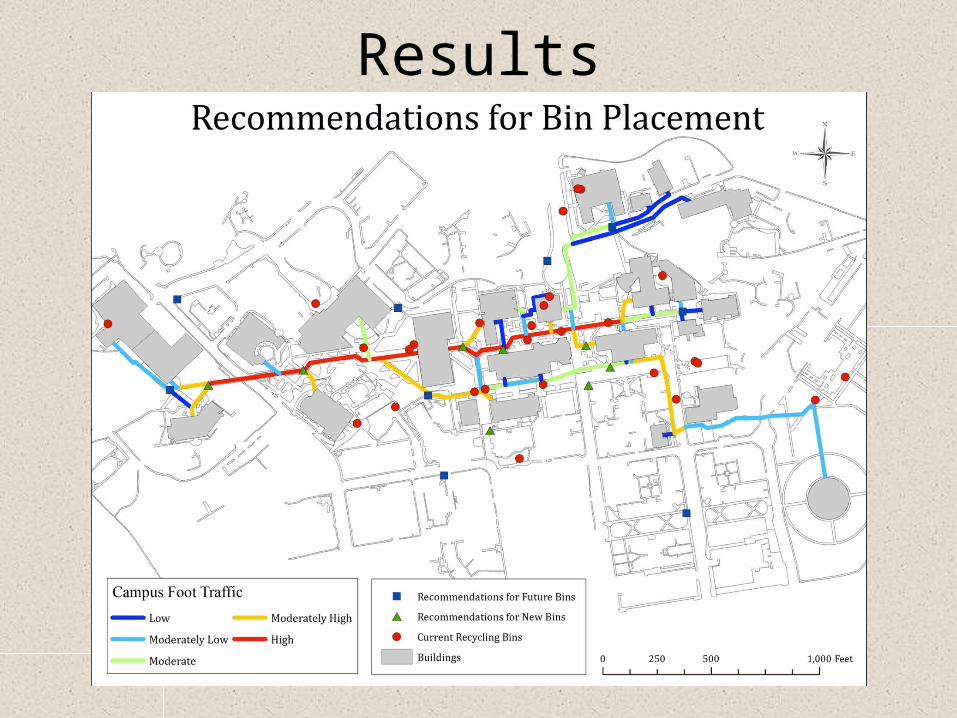
Results
Discussion
• Major assumption• Even redistribution of student
population between buildings• Does not account for clustering
• Limitations• Data• Time

Conclusions
• Many tasks involved in a GIS project
• Conceptualization is key
• Organization is crucial
• Teamwork is essential