london borough of lewisham local economic assessment march ... · london borough of lewisham local...
TRANSCRIPT

London Borough of Lewisham Local Economic Assessment March 2012 Contents Introduction 2 Summary 4 SECTION1: BUSINESS AND ENTERPRISE 8 1.1 Economy, Business and Enterprise 9 1.2 Transport and Communications 29 SECTION2: PEOPLE AND COMMUNITIES 38 2.1 Lewisham’s Demography 39 2.2 Workforce, Travel to Work and Earnings 48 2.3 Adult Skills 54 2.4 Economic and Social Exclusion and Deprivation 60 SECTION 3: SUSTAINABLE ECONOMIC GROWTH 76 3.1 Lewisham’s Regeneration Programme 77 3.2 Employment Land 85 3.3 Housing 89 3.4 Lewisham’s Economic Competiveness 101 Appendix 1: National Government Context 104 Appendix 2: The Third Sector in Lewisham 105 Appendix 3: Local Procurement 116 Appendix 4: The Domain Headlines 121 Appendix 5: Lewisham’s Low Carbon Economy 123 Appendix 6: Lewisham’s Natural Environment 128 Appendix 7: LEA Glossary 133

2
Introduction Local Economic Assessments: the statutory requirement The Local Democracy, Economic Development and Construction Act 2009 requires all Councils to prepare a Local Economic Assessment (LEA). This requirement followed on from the Review of Sub National Economic Development and Regeneration. It supported the view of the previous Government that local authorities needed to play a stronger role in local economic development and regeneration. The Coalition Government have kept the statutory requirement for authorities to produce LEAs, but have advised that they do not need to adhere rigidly to the statutory guidance that was issued. We have indicated below what elements of the guidance we have chosen to follow in preparing a Local Economic Assessment for Lewisham. What is required – and what is the purpose? Local authorities are required to:
• Carry out an assessment of the economic conditions of their local areas • Use this assessment as a cornerstone for strategies and targets at local, sub-
regional and regional levels.
The expectation was that the new duty would:
• Improve the quality of the evidence base and stimulate the use of shared evidence to support activity related to sub-regional economic development and the development of regional strategies;
• Increase understanding of how economic development can support different priorities for regeneration;
• Raise awareness of the ways in which local authorities and their partners can influence sustainable economic development through their wider policies;
• Strengthen analysis of the ways in which local authority areas fit into wider sub-regional and regional functional markets.
The LEA will therefore provide the Council and its partners with a robust and consistent evidence base for the development and review of key strategies including the Sustainable Community Strategy; People, Prosperity, Place; the Local Development Framework, and the Children and Young People’s Plan. The LEA does not provide policy or strategy recommendations and should not be viewed as a policy or strategy. However, it does identify opportunities based on the analysis on which policy and strategy can be built. Key issues from the guidance which we have adopted in developing Lewisham’s LEA
• The LEA is a ‘live’ document and we will regularly revise and update it to maintain its value as a source of information and intelligence. To ensure our LEA reflects latest economic changes - and provides for new opportunities – we propose to review the LEA annually and thoroughly revise it every three years.

3
• We have worked closely with the GLA to agree core evidence and take account of Mayoral strategies, and we will continue to do this.
• We have addressed a core set of themes: Business and Enterprise; People and Communities and Sustainable Economic Growth and these are reflected in the structure of this document.
• Our LEA is place based, forward looking and built on appropriate and proportionate evidence and data
• Our LEA has core elements of analysis in common with LEAs undertaken by neighbouring local authorities. This is particularly important where functional economic geography goes beyond administrative boundaries.
Structure of the LEA We have structured our LEA in the following way:
• Summary. This sets out the key features of the economy and its context and the opportunities which can be built on to pursue the goal of sustainable economic growth.
• Business and Enterprise. We recognise that the Lewisham economy is fully
integrated into the wider London and South East economy and aspects of this integration are described in this section. However, the focus is on describing the ‘demand side’ of the local economy: its structure, trends and particular strengths, the profile of the local business community, and the infrastructure in terms of transport and communications.
• People and Communities. This section describes the ‘supply side’ – that is,
the structure of the working age population and trends in this, the skills they have, the scale and nature of unemployment and inactivity and social and economic exclusion and associated deprivation.
• Sustainable Economic Growth. This section sets out Lewisham’s current
regeneration strategy, the availability of employment land and our conclusions in terms of economic competitiveness and the opportunities for creating sustainable growth in Lewisham as part of the economy of a large and dynamic capital city.
• Appendices. The appendices cover a range of more detailed contributions
on issues relevant to the LEA. If you have any questions about the contents of the Local Economic Assessment, please contact: Kevin Turner, Economic Development Manager, 0208 314 8229, [email protected]

4
Summary The Lewisham Context Lewisham is an Inner London borough and is an integral part of the London and wider regional economy. The economic factors which affect London also affect Lewisham. The Lewisham LEA recognises how thoroughly the local economy is integrated into the wider economy, highlights the key features of the local economy and labour market and identifies some of the specific opportunities to grow a thriving business community, create more jobs and generate higher incomes for its residents The borough is highly accessible to most parts of London. It is well located for access to markets and jobs in central London, Canary Wharf and other emerging development areas of the Thames Gateway, and southwards to Bromley, Croydon and the Gatwick area. The areas connectivity in terms of both transport and broadband is its most significant economic asset. Lewisham’s local businesses are predominantly small or SME businesses, providing a ready demand for office space. The main sectors are retail, business services and construction, with a small but growing creative sector clustered around Goldsmiths, University of London and built around their graduates. Goldsmiths, University of London together with Trinity Laban Conservatoire of Music and Dance and Lewisham College (one of England’s highest performing FE Colleges) create a strong HE and FE resource for the borough with significant potential as economic drivers. There is a strong entrepreneurial spirit in Lewisham with higher rates of self employment in comparison to others in the region. However, business survival rates are lower than the regional average and fewer businesses grow (in terms of employment). Lewisham has the smallest proportion of residents working in banking, finance and insurance and the highest proportion (39%) working in public administration, education and health. Nearly 70% of working residents travel outside of the borough for work, with the majority to central London. There are nine town centres in Lewisham, with Lewisham town centre set for significant expansion, building on its status as a sub-regional transport hub, with Deptford High Street and Convoys Wharf targeted for development as a major visitor and business destination (in the medium term) respectively. The Borough will also benefit from the on-going regeneration and investment in its current housing stock and future housing growth and further development of its transport infrastructure. The scale of housing growth plans are significant and reinforce the role of Lewisham as an attractive and affordable location from which to reach work over a wide area. The borough has a number of other development opportunities, particularly in the north, that offer the potential for economic growth over the next decade. These are highlighted in the LEA. Along with other Inner London boroughs, Lewisham has relatively high levels of unemployment. However, unlike other boroughs, there is far less geographical polarisation:

5
• Of the 31,890 residents receiving out-of-work benefits as at May 2010, there were 12,570 Incapacity Benefit/ESA claimants (the seventh highest in London), and 6,180 lone parent claimants (the fourth highest in London).
• In terms of JSA, 5% of the working age population (equivalent to 9,283 people) were claiming Jobseekers Allowance (JSA) at November 2010, compared to 3.9% across London and 3.5% for the UK.
Lewisham’s NEET population is significantly lower than the rest of London and the population as a whole. Only 4.9% of 16-18 year olds in Lewisham were recorded as not in employment, education or training in October 2010, compared with the figure for London (5.5%) and the UK (6.6%). Qualification levels amongst Lewisham’s working age residents compare reasonably well with Inner London, at the lower end. Only 9.5% of Lewisham’s working age population have no qualifications, which is below the Inner London average of 12.5%. However, qualification levels compare less well at the higher end. Only 39.6% of Lewisham’s working age population have qualifications at Level 4 or above – the third lowest level in Inner London. Although overall employment rates have remained high over recent years, there has been a sharp increase in the level of JSA claimants. The figures have gone up from 5746 in July 2008 to 9283 in November 2010. The number of 18-24 year olds who have been claiming for more than six months has gone up from 165 to 205 in the same period. National Government context and the implications for Lewisham In Appendix 1 we present a summary of relevant policy documents which provide the policy context for the LEA. These have implications for Lewisham:
• Changes to the welfare system could see up to 5,600 Incapacity Benefit/ESA claimants and up to 1,800 lone parent claimants in Lewisham who are not currently required to seek work being moved to Jobseekers Allowance by 2015, thereby reducing their levels of benefit. Many people in these groups are likely to be disadvantaged when competing against other jobseekers. This will also mean increased competition for current claimants, students and the recently unemployed.
• Public sector retrenchment is also expected to lead to an increase in the
number of people looking for work and claiming JSA. This means that some groups, such as women and those from BME communities (who are ‘over-represented’ in public sector employment), could be adversely affected by job losses.
• Up to 600,000 private sector jobs (nationally) are expected to be lost as a
consequence of public sector retrenchment, with construction, civil engineering and manufacturing most likely to be hit.
• Substantial private sector growth will be required to compensate for these job
losses. However, London is well-placed for private sector growth, given the strength of financial, banking and retail sectors. Lewisham is well-placed to take advantage of this likely growth because of its excellent transport links, proximity to the City and Canary Wharf and the potential to take advantage of the 2012 Olympic and Paralympic Games. This may result in greater numbers

6
of Lewisham residents being successful in seeking employment outside the borough.
• Local Enterprise Partnerships (LEPs) are being proposed to provide a more
bottom-up, local and demand-led approach to economic development. The challenge for Lewisham if there is a pan-London LEP is to retain the benefits from being part of the Thames Gateway. Another matter for Lewisham to consider will be the breadth of focus for a pan-London LEP. Worklessness, access to employment and skills development are all less of a priority although these are critical issues for Lewisham’s economic development which relies heavily on residents securing jobs outside of the borough.
Lewisham’s economic competitiveness and the future The evidence presented in this LEA indicates that the critical factors which have a bearing on Lewisham’s future competitiveness and economic sustainability are: • Lewisham is an integral part of the wider London economy. Most workers
commute out to jobs elsewhere, and the inflow of workers to the borough is much smaller than the outflow.
• What this means is that success for Lewisham is as much about equipping local people to take employment outside the borough and ensuring that transport links are effective as it is about promoting employment within the borough.
• Lewisham is a good place to live, even though there is much deprivation and poor quality housing. It offers affordable (in the government sense) and inexpensive housing, as well as high quality residential areas and quality green space. Its attractiveness is reflected in the rapid pace of housing development – up to 1,500 new homes a year - anticipated by developers.
• Like other boroughs, Lewisham’s boundaries are administrative and are largely artificial. In particular Thames-side from Surrey Quays to Greenwich Park is a burgeoning centre for the arts, business, retailing and education. Many of its attractions are (just) outside Lewisham, but the core of the area, Goldsmiths, University of London and important development sites are within the borough.
• Lewisham has excellent rail links to central London and to the Croydon employment area and southwards, and good road links (by London standards) to the M25 and the wider motorway network. These, and the borough’s housing position, are powerful attractors for firms and individuals wanting a London location without excessively high costs.
• Lewisham is entrepreneurial. Owing to out-commuter effect, the borough has relatively few firms. However, their number is expanding and the self-employment rate is high.
• Lewisham is strong in education, healthcare and public administration. Their short term prospects may be uncertain and there may be a degree of privatisation, but the activities themselves are expanding and offer both entry level and professional jobs for local people
Economic expansion in Lewisham is desirable in itself, even more so if it also serves to lessen deprivation. Hence, the LEA analysis suggests the following themes for expansion: • Promoting the development of the Thames-side area for business, artistic,
retailing, and high quality housing use, whilst being pragmatic about whether developments are within or just outside the borough.

7
• Reinforcing the employment base in administration, healthcare and education (regardless of ‘sector’, public or private) focused on the geographical centre of the borough.
• Encouraging, through the planning process, the rapid development of housing and business space in the borough; and, potentially, securing a further acceleration through new methods of using public sector assets to under-pin development.
• Building on success by encouraging a pooling of resources to promote enterprise, especially given the demise of Business Link and the reductions to the Borough’s own resources devoted to this area.
• Promoting adult skills as far as practicable, concentrating on people with few qualifications or who need, for instance, ESOL help or help with the validation of overseas qualifications. Encouraging links in skills and training provision across neighbouring boroughs recognising that it may be convenient for people to learn in institutions located in other local authority areas. Although the funding environment is unfavourable, this will be central to tackling deprivation
• Maximising the use of the DWP Work Programme and working closely with Prime Contractors to demonstrate the ‘gains to work’ potentially available to people on working age benefits.
Lewisham Local Economy SWOT Analysis Strength
• Excellent transport connectivity • Planned development in the north of the
borough • Dynamic communities • Parks and open spaces • Outstanding Further and Higher
Educational institutions • Substantial and varied housing stock with
significant growth planned
Weaknesses
• Small business base • Large number of residents with low skills
levels • Aspiration levels • Private sector led regeneration limited • Health profile of population • High levels of long-term worklessness • Business infrastructure not strong
Opportunities
• Thames Gateway opportunities • Olympic and Paralympic Games 2012 • Further improvements to transport
infrastructure • Housing growth and relative affordability • Local procurement action across public
sector • Emerging creative cluster • Developing entrepreneurial spirit • Planned developments • Building on strengths in health and
education • The “housing bonus”
Threats
• Slow growth out of recession • Sustained reductions in public sector
spending • Reduced private sector led regeneration • Transient communities • Outward migration • Low awareness of appeal of Lewisham
for businesses and home seekers

8
SECTION 1: BUSINESS AND ENTERPRISE

9
1.1 Economy, Business and Enterprise In this chapter we set Lewisham within its wider economic context and describe the features of the economy in terms of its connectedness to the wider economy and its role as an area of small businesses serving local and London wide markets, and home for many working outside Lewisham. We also highlight its particular strengths in the area of Education and Health. London: A vast, global city The London Development Agency (LDA) provides1 a positive description of the region’s economy:
• London’s economy is larger than Sweden or Austria with an output of £265 bn a year.
• Business activity is concentrated in central London. Businesses want to locate near to other firms with whom they both collaborate and compete. Central London offers unrivalled access to markets, labour and complementary businesses.
• London has a dynamic innovative and highly competitive economy. Growth has been driven in the past decade by high–value added business and financial services. Successful innovation is strongly identified with high productivity, and this has been consistently higher in London than any other region.
• Entrepreneurship is higher in London than elsewhere. Business start up rates and business innovation are higher in London than in any other region in the UK.
• The capital has a diverse, resilient economy and will recover from the recession followed by longer term positive growth. Over the next two decades it is probable that there will be significant growth in the environmental and creative sectors and in new forms of business services meeting the needs of new markets and a changing world.
2008 to 2011 Update • The regional economy has been more resilient to the economic downturn than
the rest of the UK. Employment grew by 4% in London (between March 2008 and July 2011) but fell by -1% across the UK
• The number of jobs in Manufacturing fell at a higher rate in London compared with the UK (-23% in London compared with -17% across the UK).
• The Construction sector also contracted across the UK but job losses were less in London (-11% across the UK but only -3% in London).
• Employment in the retail, hotels and leisure sectors continued to grow in London (11%) while across the UK the number fell slightly (by -1%).
• Growth in the number of businesses has slowed across the region. Between 2008 and 2010. The number grew by 2.59% across London and 3.38% across inner London. In the UK the number fell by -1.09%.
Lewisham’s businesses and the London Economy
• Lewisham has a small economy with only 40 jobs per 100 people of working age compared with a London average of 88 (Nomis 2010). The borough’s GVA is ranked 30th out of the 33 London Boroughs2.
1 Rising to the Challenge ‘The Mayor`s Economic Development Strategy for Greater London 2010 2 The Local Futures Group 2010. This is based on the estimate of the boroughs total economic output measured by Gross Value Added (GVA)

10
• The number of jobs in London grew by 10% between 1998 and 20083 while the number of jobs in Lewisham grew by only 4.9% during this period. The number of jobs in the private sector actually reduced in Lewisham during this time. Although the number of public sector jobs in Lewisham grew this was at a slower rate than the London average.
• The number of jobs in the borough declined sharply between 2008 and June 2011. Lewisham lost 9400 jobs during this period (15%). Most jobs were lost in the Public Sector and in Construction.
• In the five years prior to 2008 there was a strong entrepreneurial culture in Lewisham with rates of self employment in 2007 estimated to be 10.2% (higher than the national average (9%)) and only slightly below the regional average (10.7%). There was also a higher percentage of new businesses starting up, during this period with 15.8% of new businesses registering4 in the borough compared with 12.8% for London and 10.2% for the UK. However since 2008 the number of businesses in Lewisham fell by -2.42% (between 2008 and 2010) . The fall in the number of businesses was greater in Lewisham than across London (0.19%) and Inner London (0.73%). However it should be noted that Lewisham’s rate of new business growth was slightly higher than the regional average prior to 2008 and therefore the borough’s rate had further to fall.
• Local businesses rate the borough as above average as a location for doing business. They particularly value the good transport links and being close to central London with good access to customers and suppliers.
• However new businesses find it more difficult to survive or to grow than elsewhere in London. Only 37.8%%5 of local businesses are still trading after five years. And the percentage of small businesses showing year on year growth in employment is smaller than in any other London Borough.
• In line with other parts of London, Lewisham has lost the majority of its major private sector companies in the past 30 years. This trend has been exacerbated in Lewisham by the lack of suitable premises for larger companies. The majority of private sector employment is in retail chains, smaller retailers and the business services sector.
• Like much of outer London a substantial part of Lewisham’s economy provides services to its residents, such as health care, schools or consumer services (34% of employment in Lewisham is in the public sector6) as well as services such as shopping and leisure activities. The sharp reduction in public spending expected between 2011-14 is forecast to lead to significant job losses in the public sector. Rising unemployment and reductions in consumer spending will put further pressure on businesses which rely on the local consumption of goods and services.
Employment Structure and Trends Figure 1 overleaf compares employment in Lewisham with London and the UK. The percentage of people working in the business and finance sector is slightly lower in Lewisham compared with the national average but significantly below the average for London. Retail is the second largest employer for the borough. Employment in the public sector remains the largest sector although employment have fallen by 11% in this sector since 2008 (-3,000). Employment in the
3 Nomis October 2010 4 Nomis 2010. Based on VAT registration figures for 2007 5 Nomis October 2010 6 Nomis 2010

11
construction sector has collapsed showing a fall of 45% in the past two years (3,200 jobs lost in Lewisham). Figure 1 7
Employment June 2011
0.005.00
10.0015.0020.0025.0030.0035.0040.0045.0050.00
Manufac
turing
Constru
ction
Retail Dist
ributi
on &res
tauran
ts
Transport
& Com
munica
tion
Bankin
g fina
nce
Public
admin ed
ucatio
n & healt
h
Other s
ervice
s
Lewisham UKLondon
Figure 2 provides further analysis of employment in Lewisham compared with London and the UK. This table uses location quotients to show the concentration of employment in different sectors of employment in the borough compared with the regional and national average. A figure of 1.0 would be the average. This shows that Lewisham has a relatively small number of jobs in Manufacturing. The borough has just over a quarter of jobs in this sector (0.28) compared with the national average and two thirds of the London average (0.66). Figure 28 Employment in Lewisham compared with the regional and national average.
7 Nomis 2011 8 Nomis 2010

12
Change in employment Employment in Lewisham grew by only 4.91% between 1998 and 2008. This is a growth rate over 100% slower than the London average for the same period (10.74%) and significantly less than the average for the UK (9.53%). Growth has been concentrated in the public sector which created 4020 jobs during these ten years. The private sector actually shrunk slightly in Lewisham showing a net loss of 1,158 jobs. Figure 3 (below) provides a further analysis of the change in employment between 1998 and 2008. The green bars represent the actual change in employment in the borough. The purple bars show the change that would have happened if Lewisham had followed the London average. The local variance from the average is substantial in a number of areas: positive in Construction, Hotels and Restaurants and Public Administration but negative in all other areas, notably in Business Finance, Distribution, Education and Health and Social Work. If the local change in employment over this period was set at the regional average then the number of jobs in Business and Finance in Lewisham would have grown by over 3,200 jobs. What actually happened in the borough was that the number of jobs in this sector reduced slightly. The sector has therefore significantly underperformed in the borough. Public Administration and Education has grown significantly in Lewisham, although this is offset to some degree by a relative decline in the number of jobs in Health and Social work (compared with the regional average). The public sector overall (ie Public Administration, Education and Health and Social Work) has actually grown at a slower rate than the regional average. Employment in retail remains almost the same in line with the regional average. The number of local Manufacturing and Distribution jobs has reduced at a faster rate than the London average but the number of construction jobs has increased.
Figure 3 9 Change in Employment 1998 to 2008
9 Nomis 2010
Lewisham Employment 2008 Benchmark
Industry
UK London 3 : Manufacturing 0.28 0.66
4 : Construction 1.08 1.75 5 : Distribution, Retail Hotels and Restaurants 0.94 1.05
6 : Transport and Communications 0.72 0.57
7 : Banking, Finance and Insurance 0.98 0.62 8 : Public Administration, Education and Health 1.44 1.75

13
-2,000 -1,000 0 1,000 2,000 3,000 4,000
Manufacturing
Construction
Retail
Hotels and restaurants
Distribution
Business and finance
Public administration
Education
Health and social work
Recreational, cultural andsporting activities
Change in number of sector employees
Overallchange inemploymentin Lewisham98-08
Changeexpectedbased onregionalaverages
Change in Employment 2008-11 The number of jobs in the borough declined sharply between 2008 and June 2011. Lewisham lost 9400 jobs during this period (15%). Most jobs were lost in the Public Sector and in Construction. Figure 4
-3,500
-3,000
-2,500
-2,000
-1,500
-1,000
-500
0
500
1,000
Manufacturing Construction Distribution,hotels &
restaurants
Transport &Communication
Banking finance& insurance
Public admineducation &
health
Other services
Change in Employment in Lewisham 2008-2011

14
Figure 5, below, shows how the broad employment structure of Lewisham closely resembles neighbouring Greenwich, but differs significantly from Southwark and the London average in terms of having fewer jobs in Banking, Finance and Insurance. Figure 5
Businesses in Lewisham There are a relatively small number of businesses in the borough. There are 7,635 businesses in the borough (Business Demographies 2011). In addition to this it is estimated that there are a further 11,50010 people who live in the borough who are self employed. A significant proportion of these people will be operating businesses in the borough.
10 Nomis December 2010
2011 Employment compared with neighbouringboroughs
0%
20%
40%
60%
80%
100%
Greenwich Hackney Lewisham Southwark London
Manufacturing ConstructionRetail Distribution, hotels Transport & Communication Banking finance Public admin education & health Other services

15
Figure 6
The size of businesses Lewisham has relatively few large private sector companies. Compared with the London average Lewisham has 40% fewer large businesses (ie over 200 employees) and 10% fewer medium sized businesses (employing between 50-199 employees).
VAT Registered Businesses in Lewisham
Construction
Wholesale, retail and repairs
Hotels and restaurants
Education; health and social work
Transport, storage and communication
Real Estate, renting and business
activities
Public administration;
Other community, social and personal
services
Manufacturing

16
Figure 711
0.00%
0.50%
1.00%
1.50%
2.00%
2.50%
3.00%
Bexley Greenwich Hackney Lewisham Southwark Inner London London
Large Employers
50-199 employees 200 or more employees
Figure 8 below shows the five largest private sector employers in Lewisham (not all their employment is in the borough: for example, Regular Cleaning Services Ltd and CIS Security Ltd have head offices in the borough but employ staff across London). Figure 8 The 5 Largest Employers in Lewisham12
Business Activity Number of employees
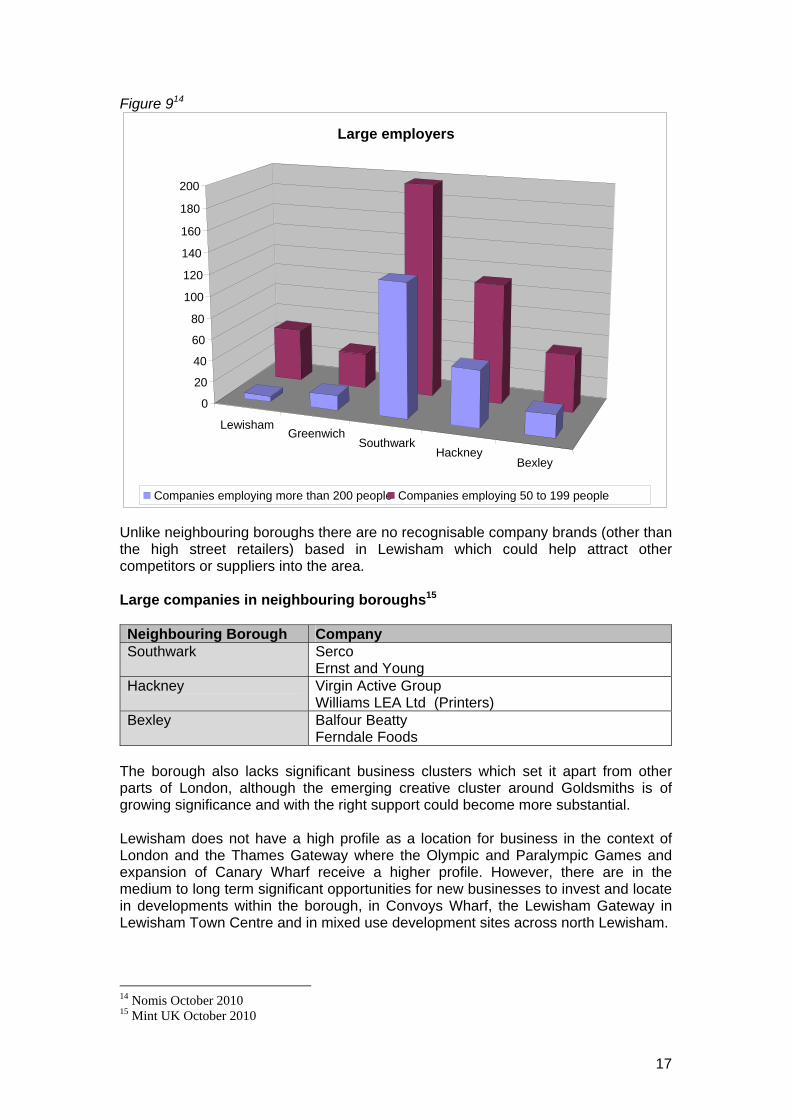
Regular Cleaning Services Ltd Commercial Cleaning Company 789 Cis Security Ltd Business Security 789 Holleran Group Ltd Civil Engineering 155 Brew Freelance Ltd Advertising 145 Temple Lifts Ltd Lift Contractors 113 Figure 9 overleaf shows actual numbers for large and medium sized businesses in Lewisham and in neighbouring boroughs. It shows that Lewisham has a small number of large or medium sized businesses. There are only 49 medium sized businesses (ie companies which employ between 50-199). This is lower than neighbouring boroughs particularly boroughs which are located in inner London such as Southwark and Hackney. The local economy is made up primarily of micro businesses (i.e. businesses which employ less than 10 staff). There is a slightly higher percentage of micro businesses in Lewisham (90%) than in London (87%) and Inner London (86%)13. 11 October Nomis 2010 12 Source: Mint UK. This excludes public sector organisations 13 Nomis October 2010
17
Figure 914
Unlike neighbouring boroughs there are no recognisable company brands (other than the high street retailers) based in Lewisham which could help attract other competitors or suppliers into the area. Large companies in neighbouring boroughs15 Neighbouring Borough Company Southwark Serco
Ernst and Young Hackney Virgin Active Group
Williams LEA Ltd (Printers) Bexley Balfour Beatty
Ferndale Foods
The borough also lacks significant business clusters which set it apart from other parts of London, although the emerging creative cluster around Goldsmiths is of growing significance and with the right support could become more substantial. Lewisham does not have a high profile as a location for business in the context of London and the Thames Gateway where the Olympic and Paralympic Games and expansion of Canary Wharf receive a higher profile. However, there are in the medium to long term significant opportunities for new businesses to invest and locate in developments within the borough, in Convoys Wharf, the Lewisham Gateway in Lewisham Town Centre and in mixed use development sites across north Lewisham.
14 Nomis October 2010 15 Mint UK October 2010
Lewisham Greenwich
SouthwarkHackney
Bexley
0 20
40
60 80
100 120 140 160 180 200
Large employers
Companies employing more than 200 people Companies employing 50 to 199 people

18
What businesses think of Lewisham Surveys of local businesses16 have consistently shown that most local businesses rate the borough as a good location for their business. 86% of businesses rated Lewisham as above average in 2010, up from 75% in 2006. Figure 9 below summarises what local business think of Lewisham. Most businesses like Lewisham because of its location and transport connections which provide good access to customers and some businesses are located in the borough because it is important to have a London postcode. However there is a growing concern with congestion and the lack of parking particularly in and around the town centres. The overall quality of the environment is rated poorly reflecting a concern with crime and in the areas surrounding businesses. Most premises are perceived as good or adequate. Lewisham is still seen as affordable for London. Figure 1017
T hink ing a b o ut the immed ia te lo ca lity o f yo ur bus ine ss, how do yo u ra te……
0
10
20
30
40
50
60
70
The overall quality ofthe environment
Access to customers Transportconnections
The quality of yourpremises
Excellent
Very good
Good
Average
Poor
Very poor
Extremely poor
16 Surveys of businesses in Lewisham were undertaken by Lewisham Council in 2010, 2006, 2004, 2001 17 Lewisham Business Survey September 2010

19
Figure 1118 What do businesses think about Lewisham?
o “We benefit from the London postcode.” o “It is a good location for doing business” o “…...lack of parking is a critical issue. Rich people spend their money outside
of the borough. The shopping experience needs to improve. Shops are tired looking. But the borough overall is kept clean.”
o …..vacant shops are “a cancer on the landscape” o Lewisham provides good access to other parts of London, and Kent o “We benefit from good links to Canary wharf via the DLR and good access via
the trains to the city.” o “It is cheaper than central London, and has good transport links.” o “We have developed strong links with the local community and relationships
with other creative organisations which are important for the success of our business.”
o “It is the perfect location for deliveries into London and access to the A2 for our Dover branch.”
o “The new developments will put Deptford on the map. Currently people don't know where Deptford is or are reluctant to come to the area as it is perceived as unsafe.”
o “Much of our work comes from the City and Central London. There are many print firms in Lewisham and South East London who we need to be close to.”
The majority of businesses (90%) plan to stay in the borough, either in their current premises or seeking new premises. However a high number of businesses (30%) are considering moving from their premises in the foreseeable future, mainly because they need larger premises or need to save money. Figure 12 Business location decisions 19
0.0%
10.0%
20.0%
30.0%
40.0%
50.0%
60.0%
70.0%
80.0%
Remain in presentpremises
Move to other premisesin Lewisham
Move to premisesoutside Lewisham
Don’t know
18 Lewisham Business Survey September 2010 19 Lewisham Business Survey September 2010

20
A number of medium and large businesses need larger industrial units which are not currently available in the borough and are therefore considering moving further out of London (eg to Greenwich, Bromley or Bexley) where there are suitable premises. Figure 1320 Why are businesses thinking of moving?
o “I need to have additional premises north of the river.” o “It is possible that the business would consider moving over the next 5 years.
We own the freehold and we have more space than we need. We are considering selling the freehold as it would release capital.”
o “We may need to move to larger businesses if we continue to expand and take on more staff. We would prefer to stay where we are as it is convenient to live close to where we work.”
o “We are currently in a residential area and would be better suited on an industrial park.”
o “If I was to move I would want to stay in Lewisham.” o “We might consider other premises when our lease expires in 2013.” o “The location is great but the costs are high.” o “We need more space, and a better environment away from residential
housing.” Business Start Ups and Entrepreneurship The latest figures estimates that there were 7635 enterprises in Lewisham (Business Demographies 2009). Between 2004 and 2007 the number of businesses was growing at a faster rate in Lewisham than the London average (15.8% compared with 12.8%). Since 2008 growth in the number of businesses has slowed across London. The fall in new businesses has been greater in Lewisham and the actual number of businesses in the borough has declined in the last three years.
20 Lewisham Business Survey September 2010

21
Figure 14
Count of Active Enterprises
0
2,000
4,000
6,000
8,000
10,000
12,000
14,000
16,000
2004 2005 2006 2007 2008 2009 2010
Newham Hackney Lewisham Southwark Greenwich
Knowledge‐Based Sectors Employment in knowledge-based sectors is recognised as a measure of economic competitiveness, which in turn is a determinant of current and future prosperity. Lewisham has a high proportion of businesses which provide goods or services to local people but few businesses operating across regional, national or international markets (fewer than might be expected taking into account its proximity to central London). Consequently the borough has a relatively small proportion of knowledge based jobs. Furthermore the proportion of knowledge-based jobs in the borough has been declining relative to the sub-region and regional pattern. Figure 15 Proportion of jobs in Knowledge Based Sectors (1998-2008)

22
0
10
20
30
40
50
60
London 98
London 08
SE London 98
SE London 08
Lewisham 98
Lewisham 08
Hi Tech Manufacturing
Media
Communications
Computer & R&D
Recreation and Culture
Financial & B Services
23
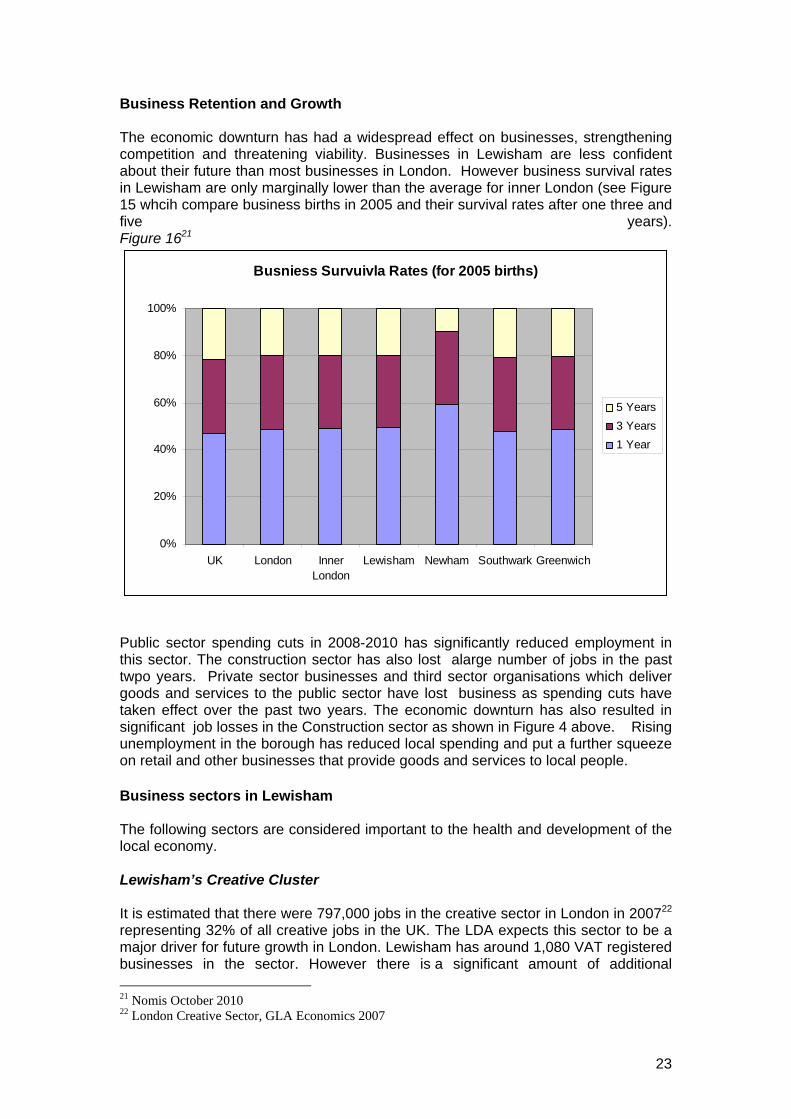
Business Retention and Growth The economic downturn has had a widespread effect on businesses, strengthening competition and threatening viability. Businesses in Lewisham are less confident about their future than most businesses in London. However business survival rates in Lewisham are only marginally lower than the average for inner London (see Figure 15 whcih compare business births in 2005 and their survival rates after one three and five years). Figure 1621
Busniess Survuivla Rates (for 2005 births)
0%
20%
40%
60%
80%
100%
UK London InnerLondon
Lewisham Newham Southwark Greenwich
5 Years 3 Years 1 Year
Public sector spending cuts in 2008-2010 has significantly reduced employment in this sector. The construction sector has also lost alarge number of jobs in the past twpo years. Private sector businesses and third sector organisations which deliver goods and services to the public sector have lost business as spending cuts have taken effect over the past two years. The economic downturn has also resulted in significant job losses in the Construction sector as shown in Figure 4 above. Rising unemployment in the borough has reduced local spending and put a further squeeze on retail and other businesses that provide goods and services to local people. Business sectors in Lewisham The following sectors are considered important to the health and development of the local economy. Lewisham’s Creative Cluster It is estimated that there were 797,000 jobs in the creative sector in London in 200722 representing 32% of all creative jobs in the UK. The LDA expects this sector to be a major driver for future growth in London. Lewisham has around 1,080 VAT registered businesses in the sector. However there is a significant amount of additional 21 Nomis October 2010 22 London Creative Sector, GLA Economics 2007

24
employment in the sector in businesses which are below the VAT threshold (in the micro businesses or self employment sectors) so the significance of the sector is likely to be greater.It is estimated that employment in the sector grew by 20% in Lewisham between 2005-200823. There are particular opportunities to grow employment in the digital media sector24. The presence of institutions like Goldsmiths, University of London and the Trinity Laban Centre (the UK’s first Conservatoire for Music and Dance) means there are opportunities to retain their graduates in the area and attract creative entrepreneurs and there is already an embryonic cluster building around Goldsmith graduates setting up locally. Ravensbourne College on the Greenwich Peninsula, although outside of the borough, has the potential to develop a new cluster of digital media businesses which could spin out into the borough. Goldsmiths, University of London, and Trinity Laban Conservatoire of Music and Dance will be particularly badly hit by the reduction in public spending in Higher Education because of the more significant cuts in support for humanities and arts based subjects. Digital and Media Sector Research undertaken in December 2011 has identified that Lewisham has a flourishing digital and media sector which can form an important component of the Borough’s strategy for sustainable economic growth. It is estimated that there are currently 628 digital and media businesses in the Borough. These businesses are spread across the Borough with no real evidence of any ‘clustering’, outside of Deptford Creek and Faircharm Trading Estate. Three quarters of the businesses are home based and software companies dominate although there are over 88 companies working in Film and Video. There is an opportunity to nurture growth in these types of businesses by supporting networking, and establishing a local hub which would encourage clustering. There are further opportunities to showcase businesses though local cultural events and festivals, support training and employment, foster work with Goldsmiths and develop appropriate premises for these businesses. Culture, Tourism and Leisure The tourist offer in and around Lewisham is significant, though small within the borough boundary. Sitting between two world heritage sites (Greenwich and the Tower of London), there are opportunities to develop the borough’s heritage and visitor economy. Lewisham is an Olympic Gateway borough being adjacent to Greenwich and Tower Hamlets which both host the games. The games provide an opportunity to further develop Lewisham as a visitor destination. Public Sector Over one in three people in Lewisham are employed in the public sector. Public sector spending cuts in 2010-2014 have reduced employment locally, regionally and nationally. Consequently it will be more difficult for residents who are made redundant from the public sector to re-join employment in the sector. The public sector will remain a significant employer and large public sector organisations should
23 GLA Economics : Working Paper 40: London’s creative workforce (2009 update) 24 Professor Alan Freeman, from GLA Economics contributed to a review of creative industries in Lewisham which was undertaken in 2010. He stated that ‘ ..one of the borough’s best opportunities is to develop a digital creative cluster – software development, leisure software, digital and online marketing and web design`.

25
be encouraged to support local business and employment. The restructuring of the public sector to draw in more third sector and private sector providers, particularly in the areas of welfare to work, health and education, may also provide alternative opportunities. The public sector is a significant local spender and the Council has developed an effective approach to local procurement which is described in detail in Appendix 3. Retailing There are nine town centres in Lewisham, with long-term plans to significantly expand Lewisham town centre, building on its status as a sub-regional transport hub. There are plans to develop Deptford High Street and Convoys Wharf as a major visitor and business destination. Retail is a major employer in the borough and the town centres contributes significantly to the vibrancy and identity of the borough. Retail will continue to suffer from the economic downturn. The retail offer in Lewisham town centre will need to improve to compete with Bromley and Bluewater.

26
Higher and Further Education Lewisham has a remarkable collection of Higher (HE) and Further Education (FE) institutions. Goldsmiths, University of London, and Trinity Laban Conservatoire of Music and Dance are both internationally recognised centres of excellence in the arts and leading education centres for cultural studies and the arts. Goldsmiths, University of London, with 1,500 staff and 9,400 students, is a major employer and generates significant student spend in the local economy. It is a key driver of the creative industries in the borough and a high percentage of local creative practitioners are graduates from the University. Goldsmiths works closely with the local authority and Creative Process to support the transfer of technology and skills from the university to local businesses. Lewisham College is one of the highest performing FE Colleges in England (it was the first double Beacon College in London) and with 600 FTE employees it is one of the largest employers in the borough. It represents a significant resource both in terms of training for local people and employees and also a source of significant support for small business growth. Their ABLE (Access to Better Lewisham Employees) project was a pioneering attempt to train local people and strengthen local businesses. There appears to be both considerable scope and appetite to develop stronger working relationships between the three institutions, the local authority and other partners to enhance the local value and impact of these drivers of the local economy. Business Services There are some 7,600 people employed in the business, finance and related services. Lewisham is an excellent location for businesses which supply goods or services to the business and financial sector in Canary Wharf, the City and other emerging development areas across the Thames Gateway. Employment in this sector has grown significantly in other areas of London in the past ten years but has fallen in Lewisham. Lewisham is currently not perceived as a location for offices. The LDA are projecting that growth in the region will continue to be focused in this sector. There will therefore be an opportunity to grow businesses in Lewisham which service the London business sector. Business and Inward investment support should be targeted at attracting office based businesses into the borough. Distribution Lewisham’s location and good transport links provides excellent access to London and the South East. The borough is an excellent location for businesses which need access to customers or suppliers in these areas, for example, catering and food suppliers, printing and publishing and office supplies. Despite this market advantage for the borough there has been a loss in jobs in the sector. This indicates a local market failure. This could relate to a lack of suitable premises in the borough. The Third Sector It is estimated that there are 613 third sector organisations in Lewisham25 (a detailed analysis of the sector is provided in Chapter 14). 42% of these define themselves as social enterprises. The governments Localism Bill may provide future opportunities
25 GuideStar, Review of Third Sector in Lewisham and Across All London Boroughs, September 2010.

27
for social enterprises to deliver public services. There is a detailed analysis of the sector in Appendix 2. Construction Although private sector investment in the regeneration of the borough and sub region has slowed since 2008 there are still opportunities through public sector investment to support the local construction sector which remains a significant employer in the borough. The sector has suffered particularly badly from the economic downturn, there are few medium or large construction businesses in the borough and many small businesses are being squeezed out of business as the sector readjusts and buyers look for larger contractors to deliver economies of scale. Environmental Industries The area around SE London Combined Heat and Power (SELCHP) in the north western corner of the borough is mainly occupied by heavy industry. There is an opportunity to develop a nucleus of waste recycling in line with the Mayor’s London Plan. This could usefully provide facilities for sorting and recycling. There are opportunities to grow the local green economy and for businesses to exploit new opportunities in the growing energy efficiency and energy generation markets. A more detailed assessment of moves to create a low carbon economy in Lewisham and the business opportunities this creates is set out in Appendix 5. Conclusion Lewisham’s economy is an integral part of the wider London and south east economy and most residents work outside Lewisham’s boundary. The economy of the local area has a significant public sector presence and the borough’s private sector is made up of small and micro businesses. There are relatively few businesses with the potential to expand and increase employment locally. Lewisham is not widely recognised as a location for businesses but the borough’s location and transport links are attractive to businesses. There appears to be scope to promote the area as a good location for small businesses serving the wider London market. There is potential to enhance business growth and employment in parts of the borough. This can be achieved through new developments which will create new business space and more attractive environments for businesses, by focusing support on attracting and growing knowledge based businesses (e.g. digital media, business services and businesses in the new environmental sectors) and by building on the strong education infrastructure. At the same time it will be important to retain and grow indigenous businesses in the retail, construction, personal services, creative and logistics sectors through support and an appealing ‘ladder’ of accommodation.

28
Business and Enterprise SWOT Analysis Strength
• Good business location • Good and improving transport links • Affordable • Emerging creative digital,media cluster • Higher and Further Education
Weaknesses
• Small private sector
• Poor growth
• Poor business survival rates
• Few knowledge based industries
• Few large business ‘names’
• Lack of large premises and office space • Perception as residential Borough • Quality of environment
Opportunities
• New Commercial space, Surrey Canal Convoys and other mixed used sites
• Establish Lewisham as location for small office, work space
• Start Up cluster and digital media sector
• Building on the embryonic creative cluster
• Develop a local green economy
• Grow the business services sector
• New improved retail offer in Lewisham Town Centre and Deptford high Street
• New London Enterprise Panel (LEP)
• 2012 Olympic and Paralympic Games
Threats
• Cuts in public sector
• Double dip recession means no growth in private sector
• Lack of development and of new commercial space (lost to residential)
• Loosing existing businesses due to poor environmental quality and/or lack of suitable premises
• Increasing rateable values push out small
businesses, start-ups and creative industry
• Cut in business support • Reduction in local Higher Education
• Competition from the Enteprise Zones
around the Royals in Newham and Greenwich Peninsula

29
1.2 Transport and communications Lewisham is a significant transport node within the wider London economy and this is reflected both in the feedback gained from businesses located in Lewisham and the commuting patterns of Lewisham residents. In this chapter we describe both the transport connectivity and flows and the relatively strong position of the borough in terms of broadband connectivity. Transport and Connectivity Lewisham has very good transport links to central London and south to Bromley, Croydon and the Gatwick area and is only 12 miles away from the M25. Within the Borough there are:
• 20 main line stations - two provide interchanges with the Underground network (New Cross and New Cross Gate) and Lewisham station provides direct interchange with the Docklands Light Railway (DLR). A further four stations (Brockley, Honor Oak Park, Forest Hill and Sydenham) provide an interchange with the Underground on the completed Phase 1 of the London Overground extension.
• 3 DLR stations - one at Lewisham with a formal bus/rail interchange. • 42 bus routes - tendered by Transport for London. • A designated wharf - on the Thames at Convoys Wharf.
Out of a total of 408 local authorities, Lewisham ranks 25th in Britain for ‘connectivity’. The average travel-to-work time is fairly typical for the sub-region and region, but high nationally (ranking 22nd). The borough is well placed to access the region’s airports, including City Airport, Gatwick, Heathrow and Stansted. This connectivity could support economic growth although there is a concern that businesses considering moving into the borough do not always appreciate how well connected the Borough is. The borough has low levels of net in-commuting (in fact the fifth lowest in Britain and the lowest in London) – demonstrating the relatively low levels of employment within the Borough. Traffic counts suggest that on a weekday around 150,000 vehicles cross through the western side of the Borough between 7am and 7pm. These traffic levels appear to be relatively stable against a 2000/01 baseline. The map overleaf highlights the rail and underground and bus connectivity in the borough.26
26 Figure 7.1, Current and future public transport infrastructure, page 73, Lewisham Borough Wide Transport Study- Final Report (August 2010)


31
Lewisham has one of the lowest proportions of people in the country travelling to work by car and has the 9th highest proportion travelling to work by public transport both nationally and regionally. Despite low proportions walking or cycling to work (which are perhaps partly related to long travel to work distances), the above results are positive in terms of its future environmental sustainability.
Council Business Surveys show that most businesses like Lewisham because of its location and transport connections which provide good access to customers and some businesses are located in the borough because it is important to have a London postcode. However there is a growing concern with congestion and the lack of parking particularly in and around the town centres.27 Figure 16 below is drawn from analysis of 2001 Census Journey to Work data and shows significant variation in modal share between wards in the borough. Figure 16
Split of work trips by principal mode (% persons) Ward LUL/DLR Train Bus, minibus,
coach Car driver
Bellingham 6% 28% 16% 36% Blackheath 11% 45% 9% 22% Brockley 17% 30% 17% 22% Catford South 4% 29% 13% 41% Crofton Park 8% 35% 13% 32% Downham 3% 22% 17% 43% Evelyn 25% 13% 22% 25% Forest Hill 7% 34% 14% 31% Grove Park 3% 34% 11% 40% Ladywell 11% 35% 13% 27% Lee Green 6% 40% 10% 31% Lewisham Central 12% 37% 13% 24% New Cross 20% 21% 23% 22% Perry Vale 6% 32% 13% 35% Rushey Green 7% 35% 16% 27% Sydenham 5% 33% 13% 34% Telegraph Hill 16% 26% 20% 24% Whitefoot 4% 25% 15% 41%
The highest percentages of train usage can be tracked to the most connected areas with the highest levels of affluence by ward. This suggests professional commuter concentrations in areas such as Blackheath, Ladywell and Lee Green.
27 Surveys of businesses in Lewisham were undertaken by Lewisham Council in 2010, 2006, 2004, 2001

32
Proposed enhancements to Lewisham’s transport infrastructure Lewisham’s draft Local Implementation Plan on Transport outlines proposed future transport investment in the borough.28 This includes: London Overground Phase 2 works will extend the line from Surrey Quays to Clapham Junction. While both Transport for London (TfL) and the Borough have extensively lobbied the Department for Transport for a £7m contribution towards the provision of a new station at Surrey Canal Road, a decision was made not to fund this at this stage, due to the current financial climate. Completion of construction of the Phase 2 route is programmed for early 2012, with opening to passengers services in the latter part of 2012 (i.e. after the Olympic and Paralympic Games). It is the intention of Transport for London (TfL) to construct Surrey Canal Road station as an addition to what will be already constructed and operated as part of the current ELL Phase 2 route designed. Thameslink The Thameslink Programme is a major enhancement programme that will permit up to 24 trains per hour up to twelve carriages, to run through the core Thameslink route between St Pancras and Blackfriars and thence to various destinations in south London. When complete the Thameslink programme will provide new connectivity and longer trains to a wider range of destination. Crossrail The Crossrail Project is well underway. It will provide extra capacity and relieve and reduction overcrowding on the central, District and Jubilee Lines. The interchange at Farringdon will reduce the need to travel into London. It will be crucial in enabling the potential growth of the Eastern region to be realised. . Of particular significance for Lewisham will be the interchange at Whitechapel between the East London Line and Crossrail. It will be very convenient for interchange with the Crossrail platforms being immediately below the East London Line ones. North Lewisham Links - improved walking and cycling routes The North Lewisham Links programme aims to improve walking and cycling routes in the north of the borough. Ten separate routes have been identified that connect possible new development sites with existing (and new) community facilities such as schools and colleges, town centres, parks and public open spaces.29
28 Lewisham Draft Local Implementation Plan 2011-2031 29 http://www.lewisham.gov.uk/Environment/Regeneration/DeptfordAndNewCross/NorthLewishamLinks/ - taken from the North Lewisham Masterplan

33
Figure 17 North Lewisham Links proposal Key 1. Deptford to New Cross Gate 2. Central Deptford 3. The Western Connection 4. Surrey Canal Road 5. Towards the river
6. Deptford Creek 7. Deptford Park 8. High Street to Creek 9. Riverside 10. New Cross Gate improvements
The Council is looking at a variety of different ways to fund this programme of work. Already, £4 million has been secured from central government to enable work to begin on the route between Deptford and New Cross which runs parallel to New Cross Road and takes in Fordham Park, the New Cross Underpass and Margaret McMillan Park. Route 1 is due for completion in Amy 2011; various bits of routes 5 and 9 are due to be finished by April 2011.

34
In the recently published Sub Regional Transport Plan there are two particular schemes to improve Transport in Lewisham: DLR Extension southwards from Lewisham via Catford to Forest Hill Extending the DLR further into South east London would provide direct access to Canary Wharf for residents south of Lewisham with a new interchange at Catford. It would provide Bromley and Orpington with only one change of train from Canary Wharf. It would also relieve pressure on the London Overground Route to Canada Water and the Canada Water to Canary Wharf section of the Jubilee line which is forecast to remain very crowded even with the planned upgrades to Jubilee Line Extension (JLE). The report recognises that more work will be required on the difficult alignment from Lewisham to Catford as the current position of the Lewisham DLR station creates problems. Funding constraints mean that priority will need to be given to maintaining the existing DLR network and providing essential upgrades where necessary. New extensions are unlikely to obtain funding until after the current TfL Business Plan period of 2017/18. Catford is a major centre and the Council has wider aspirations to develop the centre and create a new public square involving a realignment of the South Circular. There are also aspirations to improve Forest Hill around the station, so any proposals emerging will need careful study to assess the implications Bakerloo Line extension The Mayor’s Transport Strategy supports the long term extension of the Bakerloo Line from Elephant and Castle to improve access to south east London and provide better connectivity with other rail lines. To meet best the desired outcomes of the Transport Strategy a number of different options have been assessed, including a route to Hayes and others including a link to Bromley. Capacity benefits in the east sub region that would support population and employment growth include: • Enabling additional services on South Eastern lines to destinations in the Sub region. Capacity
for two additional trains per hour on each of the routes via Bexleyheath, Sidcup and Tonbridge has been identified.
• Reducing pressure on central London termini , providing wider benefits in the sub region. The draft core strategy concludes that the transport investment currently taking place and/or planned (Thames link, DLR 3 car extension, East London line extension, Lewisham lower H road layout, Kender Triangle) combined with policies to ensure modal shift and improve the walking and cycling environment will ensure that growth planned for the borough can be accommodated on a variety of transport modes.

35
Broadband The ability of individuals and businesses to connect to and use broadband connections is an increasingly important part of effective trading, education and training, and job finding. Lewisham ranks 33rd amongst all local authority areas nationally in relation to the number of broadband lines per head of population, and 2nd compared to other boroughs in the South East London area. Figure 18: Total broadband line (June 2009)
Filtered by Sub Region : London East
Rank. District Region Number Nat. Rank
1 Redbridge London 85633.54 29
2 Lewisham London 84511.02 33
3 Havering London 78619.11 44
4 Greenwich London 77605.03 49
5 Bexley London 76063.7 53
6 Hackney London 75495.64 55
7 Newham London 67467.13 69
8 Barking and Dagenham London 56582.37 96
9 Tower Hamlets London 56531.75 97
10 London City London 16914.22 370
National Average : N/A
Source: Local Knowledge; Point Topic
Notes: Source: Estimates from Point Topic surveys of both the Consumer and Business markets combined with operator reports on broadband numbers and a wide variety of official statistics on both demographics and business premises.
There are many community and youth centres across the borough that have computer suites. Their age or condition is not clear, nor is the extent to which they are currently used, but these represent a potential asset within local communities. All libraries have internet access and are a well used resource with demand potentially outstripping supply. The Building Schools for Future Programme is providing schools equipped for the 21st century with up to date technology and these new schools are also valuable assets for the community. There are a rising number of businesses in the Town Centres that provide wireless access and the Albany in Deptford is an example of a community space where a variety of people use the range of facilities offered providing a valuable working space to conduct their business and access broadband. The new Deptford Lounge will amongst other things provide flexible commercial space with the potential for broadband access.

36
The Local Development Framework outlines a number of sites earmarked for mixed-use development, in some instances in the most deprived areas of the borough, and provide potential for extending broadband penetration into those areas for existing and new residents and technology access to support mobile and field working business Lewisham Council has invested in technology to maximise access to services and offer flexible working for employees so they can work remotely and be more efficient in field working. Conclusion Connectivity is a positive aspect of Lewisham’s economy, in particular in its relationship with Greater London. Current and proposed transport developments will continue to improve this connectivity in the next twenty years. A number of the longer term developments to transport infrastructure are still in the very early stage and cannot be assumed to be delivered. The borough ranks highly both nationally and within London in terms of broadband connections and this contributes to the sense of a highly connected local economy.

37
Transport and connectivity SWOT Analysis Strengths
• Good transport links to central London • Good links to M25 • Linked to the London Underground • High level of connection to broadband • Lewisham Based businesses value the
connectivity of the borough
Weaknesses
• Perception of connectivity from outside the borough does not accurately reflect reality
• Variable connectivity to the underground system across the borough
• Lack of connection to broadband remains a feature of most deprived wards.
Opportunities
• The opening of the London Overground in the West of the borough
• Phase 2 of the London Overground
• North Lewisham Links programme, enhancing local transport around transport hubs and developments.
• Enhancing broadband access in deprived wards to support education, training and job seeking.
Threats
• The medium term viability of the Surrey Canal station on Phase 2 of the London Overground extension
• Business concerns over congestion
• Potential of increased commuting due to public sector cuts

38
SECTION 2: PEOPLE AND COMMUNITIES

39
2.1 Lewisham’s demography In this chapter we present a detailed analysis of the Borough’s demographic profile and an indication of how this profile is likely to change in the future. The London context London’s population and the migration that contributes to its dynamic, has grown by over 1 million people since 199130 to the current total of almost 8 million. By 2016 it is projected to reach 8.2 million31. Population Estimates and Projections Lewisham’s population has increased significantly since the last national Census, which was conducted in 2001. As Figure 19 shows ONS estimate that there has been an increase of over 17,000 people since the 2001 Census, giving a 7.1% increase in population. Looking more in-depth at the components of change aspect of the ONS population estimates reveals that Lewisham’s population growth is predominantly due to the birth rate being greater than the death rate. This is likely to be due to Lewisham’s young population age structure. Although there is seen to be a notable amount of international migration into the borough each year, the trend for the last ten years has generally been that this is countered by a greater level of out migration to other areas of the UK. This fluid population is likely to have an impact in terms of employment chances and sustainability. Figure 19 Source Population 2001 Census 248,922 2010 ONS Mid Year Estimate 266,500 2009 GLA Round Demographic Projections32 273,007
30 1991 Census and 2009 ONS Mid Year Population Estimates 31 ONS Population Projections 32 Taken from GLA 2010 Round Demographic Projections - Single Year of Age

40
Figure 2033
Lewisham Population Pyramid from ONS Mid Year Population Estimate 2010
15 14 13 12 11 10 9 8 7 6 5 4 3 2 1 0 1 2 3 4 5 6 7 8 9 10 11 12 13 14 15
Under 1
1-4
5-9
10-14
15-19
20-24
25-29
30-34
35-39
40-44
45-49
50-54
55-59
60-64
65-69
70-74
75-79
80-84
85-89
90+
Age
Gro
up
Population in Thousands
Males Females
In terms of projections the population is expected to continue increasing and is predicted to reach 316 000 by 203034. The age profile of Lewisham’s population Lewisham has a relatively young population compared to the age profile of England, with 8.0% of the population aged less than 5 years. This is expected to remain stable before decreasing slightly towards the end of this decade. It is the 5-14 year old category that is projected to increase the most by 2014; this has consequences for later in the current decade as this expanding group reaches working age and potentially the job market, particularly for those groups who do not pursue further or higher education. The proportion of residents aged 15-44 is expected to fall from the current level of 50.2% in 2010 to 49.7% in 201435, although the actual number of residents in this age category will continue to rise. This though will have economic repercussions as this main pool of working aged residents will have to support the increasing dependent population. 9.3% of Lewisham’s current population is aged over 65 years compared to the England average of 16.5%, this is expected to remain relatively stable up to 2014 and for the rest of this decade. However according to the Greater London Authority (GLA) predictions regarding ethnicity, the proportion of those aged 65 and over from black and minority
33 ONS Mid -Year Population Estimates 2010 34 ONS 2008 Sub National Population Projections 35 ONS 2008 Sub National Population Projections

41
ethnic (BME) groups is estimated to have risen from 14% seen in the 2001 Census to 22.7% in 2008, and will continue to rise to 25.3% in 2011 and 27.2% by 201436. Figure 21: Projected Population Growth, 2008 to 201437
Age Group 2008 2011 2014 % Total Growth
Baseline Year 2008-14 0 - 4 20,300 21,400 21,400
% growth 5.4 0 5.4 5 - 14 28,300 29,300 31,300
% growth 3.5 6.8 10.3 15 - 64 188,600 194,800 200,300
% growth 3.3 2.8 6.1 65 - 84 21,400 20,800 21,400
% growth -2.8 2.8 0 85+ 3,300 3,400 3,300
% growth 3.0 -2.9 0.1 Male 130,200 134,400 138,600
% growth 3.2 3.1 6.3
Female 131,800 135,300 139,100
% growth 2.7 2.8 5.7
Persons 262,000 269,600 277,700
% growth 2.9 3.0 5.9
Lewisham Wards Lewisham is divided into 18 electoral wards. New Cross, Brockley and Lewisham Central have the highest estimated populations, according to the latest ONS estimates38. However figures produced by the GLA39, which take into account large building developments in both Lewisham Central and Evelyn, state these two wards will see the greatest increases in the upcoming years and consequentially the largest ward populations overall (see Figure 22 overleaf).
36 GLA 2008 Round Ethnic Group Projections - Low 37 ONS 2008 Sub National Population Projections 38 ONS Mid 2010 Ward Estimates 39 GLA 2011 Round Ward Population Projections

42
Figure 2240
Lewisham Population by Ward - 2010
0
2,000
4,000
6,000
8,000
10,000
12,000
14,000
16,000
18,000
Belling
ham
Blackh
eath
Brockle
y
Catford
Sou
th
Crofton
Park
Downh
amEve
lyn
Forest
Hill
Grove P
ark
Lady
well
Lee G
reen
Lewish
am C
entra
l
New C
ross
Perry V
ale
Rushe
y Gree
n
Syden
ham
Telegra
ph H
ill
Whit
efoot
Figure 23 overleaf shows the projected ward populations for 2014 compared with figures for 2008. This increased population concentrated in the northern part of the borough is likely to have an impact of increasing demand for local services, including retail and entertainment, contributing income to the local economy.
40 ONS 2010

43
Figure 23: Ward Population Projections, 2011 and 2015 41
GLA Ward Population Projections
0
2000
4000
6000
8000
10000
12000
14000
16000
18000
20000
Belling
ham
Blackh
eath
Brockle
y
Catford
Sou
th
Crofton
Park
Downh
amEve
lyn
Forest
Hill
Grove P
ark
Lady
well
Lee G
reen
Lewish
am C
entra
l
New C
ross
Perry V
ale
Rushe
y Gree
n
Syden
ham
Telegra
ph H
ill
Whit
efoot
2011 2015
Ethnicity profile of Lewisham’s residents Data sources on ethnicity in Lewisham diverge in the picture that is presented. ONS estimates released in 2007 state that the proportion of Lewisham residents from a BME ethnic group had actually decreased since the figure recorded in the 2001 Census. However various administrative sources, including the school census, indicate that this is not the case, hence the GLA projections are used in this section. Compared to 2001 Census figures, the borough has seen a considerable increase in the percentage of the population from non-white ethnic groups. It is estimated that 59.5% of the population is White and 40.5% are from minority ethnic communities, compared to 66% and 34% respectively in 2001. Black Caribbean (13.0%) and Black African (11.4%) are the two largest minority groups42.
41 GLA 2011 Round Ward Population Projections 42 GLA 2010 Ethnic Group Projections

44
Figure 24: Population by Ethnicity, 2001 compared to 201543
Ethnic Group 2001 Census 2011 GLA Projections
2015 GLA Projections
Total growth
White 164,100 163,573
168,433
4333
% growth -0.3 3.0 2.6 Black Caribbean 30,543
35,734
37,779
7236
% growth 17.0 5.7 23.7 Black African 22,571 31,433
34,067
11,496
% growth 39.3 8.4 50.9 All Others 31,710 44,157
48,326 16,616
% growth 39.3 9.4 52.4
The working age population remains less diverse than the population overall, however according to the GLA projections the proportion of White residents of working age will decline slightly by 2014. The unemployment rate for ethnic minorities in Lewisham is 15.3%. This is much higher than for white residents (7.6%) and is also slightly higher than for the corresponding population in London overall (13.9%)44.
Migration Between 2003 and 2010, there was net migration loss of approximately 17,000 people from Lewisham to the rest of the UK. It is generally thought that people migrate out to other areas of the South East. With respect to international migration, Lewisham has more recently seen a decrease in the number of people locating here, although the net figure for 2003 to 2007 is 11,600. International in migration from mid 2007 onwards has seen a notable decrease in the number of international migrants arriving in Lewisham compared to the preceding years. According to the Department for Work and Pensions, a total of approximately 8000 non-UK nationals were issued with new National Insurance numbers in 2010/11.45 Overseas National Insurance Registration This data source allows us to see the impact of working age migrants to the borough. The most recent data (2010/11) shows that Nigerian nationals had the highest level of National Insurance (NI) registrations at 790. Of the European Union (EU) Accession nations Poland was the most cited and whilst this nationality had previously been the most numerous nationality in terms of overseas NI registrations the number has fallen notably. The very nature of an application for a NI number indicates that these in-migrants are economically active. Although the levels seen in Lewisham are smaller than elsewhere in London, it is likely that there will still be an impact on the labour market. Although this figure gives us an indication of levels of international migration, it does not include (a)
43 GLA 2010 Ethnic Group Projections 44 ONS Annual Population Survey, Jan 2010 - Dec 2010 45 DWP, 2011

45
their dependants or (b) those working without National Insurance numbers. Compared to other London boroughs, this number is relatively low. Figure 25 National Insurance Registrations of Overseas Nationals 2010/11
0 100 200 300 400 500 600 700 800
Nigeria
France
India
Poland
Italy
Rep of Lithuania
Sri Lanka
Spain
China Peoples
Jamaica
Rep of Ireland
Romania
Germany
Netherlands
Brazil
Portugal
Rep of Latvia
Ghana
Pakistan
Australia
2010
/11
Number of NINO Applications
A further indication of levels of international migration to an area is ‘Flag 4’ data, which is taken from GP patient registers, i.e. when a patient’s last given address is not in the UK it is marked as a ‘Flag 4’. For Lewisham there was a steady level of Flag 4s until 2004, before it rose notably in 2005, continuing in 2006. 2007 onwards has seen the levels fluctuate. This dataset shown in Figure 26 illustrates that in-migration did increase post the accession of the ‘A8’ nations, however it also now appears to be in decline. Figure 26
Year Flag 4 In-migrants 2002 4,687 2003 4,580 2004 4,550 2005 6,085 2006 6,096 2007 6,013 2008 6,611 2009 6,299

46
Electoral Register Data The electoral register by its nature only presents data for those aged 18 and above. Apart from British, the main nationalities present in Lewisham according to the 2011 Electoral Register are Nigerian, Irish, Jamaican and French. Notably though there were 2258 Polish people registered to vote, which is a large increase from the level of Polish nationals seen in the 2001 Census (413). Other EU accession countries also present in sizeable numbers on the electoral roll were Lithuanians’ (798), Romanians (472) and Hungarians (252). There was also a notable number of Ghanaian’s present on Lewisham’s electoral register. This data again highlights the diverse and dynamic nature of Lewisham’s population. This has an impact in terms of employment and the labour market as gaining employment may be less straight forward for new migrants than those who are long term UK residents. School Language Census This data by its very nature gives details of a very different demographic section of Lewisham. Caveats of the dataset are that data is not collected for every single child that attends school in Lewisham and not all Lewisham pupils are resident in the borough, whilst some Lewisham residents are pupils in another borough. The number of languages spoken in the Borough, as monitored by the School Language Census, has increased over the last few years to approximately 165 (Summer 2011). After English, the next most frequently spoken language is French, this is thought to be due to the language being widely spoken in West Africa. The third most commonly cited language is Yoruba, a dialect spoken again across West Africa, including Nigeria and parts of Ghana. The Nigerian population in Lewisham has been visible since the 2001 Census however there were not enough people stating their country of birth as Ghana in the Census to warrant its own figure. Translation Requests Information has been collected from the translation requests service since the contract began with the current provider in October 2007 until December 2008. This shows that it tends to be the more established communities that request the use of a translator, namely Tamil, Vietnamese and French (although French could also be for certain African communities). Interestingly Polish does not feature on the list at all which could be taken as an indicator that Polish migrants English is of a sustainable standard or that they are not engaged with Council services. Demography - conclusion It is therefore possible to see that there is no one clear new community group present in Lewisham. The borough remains a dynamic and diverse place to live and work but within this diversity there are divergent reasons for migration and communities which place different demands on the local economy. Demography SWOT Strength
• Dynamic, diverse population, where people of all backgrounds live
• Large number of languages and
Weaknesses
• Net out migration creates a very fluid population, knock on effect of lack of sustainability and understanding of economically active population

47
nationalities present • Relatively high levels of overall
deprivation compared to other areas in England. This deprivation is also concentrated in pockets
Opportunities
• Diversity of the population is projected to be seen across all age groups
• New building developments in the north
of the borough will provide employment and leisure opportunities
Threats
• Change of population dynamic will create a more dependent population
• Higher than average crime rates may
deter businesses

48
2.2 Workforce, travel to work, and earnings Lewisham’s thorough integration into the wider London labour market is most clearly described by the daily flows of people into and out of the area. The outflows of Lewisham residents working or studying outside the borough are substantially greater than inflows of individuals coming to Lewisham to work or study. • Workforce flows: Outflows (79,125) are approximately 2.5 times greater than inflows (29,442) with
North London and South East London representing the largest sources of outflows. South East London is also a large source of workforce inflows.
• North London is also a strong source of workforce outflows reflecting the primarily business/commercial nature of Westminster.
• 31% of total outflows are to South East London with Southwark (15%) representing the largest source. Equally, 31% of total outflows are also to North London with Westminster (18%) representing the largest source.
• 70% of total inflows are from South East London with Greenwich (22%) and Bromley (22%) representing the largest sources.
• Westminster followed by Southwark and the City of London have the biggest net difference of outflows and inflows, with substantially greater outflows from Lewisham to these local authorities.
• Relatively large populations of individuals from Dartford (614), Sevenoaks (579) and Medway (545) work in Lewisham.
• Slightly smaller populations of Lewisham residents also work in Dartford (445) and Sevenoaks (246).
Figure 27: Workforce - Travel to/from Lewisham from/to other London local authorities46
Local authority Inflows Outflows Difference North London 1,111 23,270 -22,159 North East London 1,407 12,484 -11,077 West London 795 4,385 -3,590 South East London 17,085 23,513 -6,428 South West London 3,975 11,460 -7,485 Greater London 24,374 75,112 -50,738
The full scale of Lewisham’s integration into wider labour markets is presented in Figure 28 (overleaf) which shows examples of the more significant flows into and out of the area.
46 Figures taken from the GLA London Plan to group local authorities into North London etc

49
Figure 28: Workforce Travel into and out of Lewisham47
47 Geographic Information and research 2006 (This data is taken from the Census)

50
Total weekday population flows Lewisham’s total weekday population outflows are approximately 2.5 times greater than inflows with over 86,000 individuals leaving Lewisham each weekday to work or study, compared to just 33,000 individuals coming to Lewisham. Details are provided in Figure 29 below.
Figure 29: Total - Travel to/from Lewisham from/to Greater London and England48
District Workforce Student Total In Out In Out In Out Difference
North London 1,111 23,270 0 73 1,111 23,343 -22,232 North East London 1,407 12,484 13 19 1,420 12,503 -11,083 West London 795 4,385 0 31 795 4,416 -3,621 South East London 17,085 23,513 3,295 6,506 20,380 30,019 -9,639 South West London 3,975 11,460 258 666 4,233 12,126 -7,893 Greater London 24,374 75,112 3,566 7,417 27,940 82,529 -54,589 Rest of England 5,068 4,013 30 122 5,098 4,135 963 Total 29,442 79,125 3,596 7,539 33,038 86,664 -53,626
When Lewisham’s resident workforce and student populations are taken into account, the total number of individuals working or studying in Lewisham is slightly higher than the number of Lewisham residents working or studying outside the borough. Details are provided in Figure 30 below. (Is this so? Fig 30. I think suggests total outflows is higher than Lewisham residents + in flows?)
Figure 30 : Lewisham’s weekday population49
Workforce Lewisham 35,170 + Inflows 29,442 - Outflows 79,125 Total -14,513
Income and earnings Most of Lewisham’s residents work outside Lewisham and they typically have lower weekly earnings than the rest of the SE London sub-region. Figure 31 overleaf shows that the average full time salary for people living within Lewisham is approximately £29,476 p.a.
48 2001 Census 49 2001 Census

51
Figure 31: Median Gross Annual Earnings for Employed in Lewisham 2004-2011 for Full-time Employees50
20,000
21,000
22,000
23,000
24,000
25,000
26,000
27,000
28,000
29,000
30,000
31,000
32,000
33,000
34,000
35,000
36,000
37,000
2004 2005 2006 2007 2008 2009 2010 2011
£
Bexley Bromley Greenwich Lewisham Southwark
Figure 32 overleaf displays the annual average median weekly resident earnings since 2002. Lewisham resident’s average weekly earnings were almost £50 lower than the London average in 2009. Similarly, Lewisham residents’ typically had lower weekly earnings than the rest of the SE London sub-region.
50 Annual Survey of Hours and Earnings 2004-2011

52
Figure 32: Median Gross Weekly Resident Earning, 2004 - 201151
400.0
450.0
500.0
550.0
600.0
650.0
2004 2005 2006 2007 2008 2009 2010 2011
£
Lewisham SE London London
The difference in workplace and resident weekly earnings has now narrowed in Lewisham. This contrasts with the difference between workplace and residents’ earnings in many other parts of London – particularly in outer London – where median income is significantly higher for residents than for those working in the area.
51 : Annual Survey of Hours and Earnings

53
Figure 33: Workplace and Resident Earnings, 2011
500
520
540
560
580
600
620
640
660
Lewisham SE London London
Resident Workplace

54
2.3 Adult skills52 Current estimates suggest that skills levels are rising in Lewisham, as shown in Figure 34 below. Figure 34: Estimated Rising skill levels in Lewisham 2005-0953
0102030405060708090
2005 2006 2007 2008 2009
% with NVQ4+
% with NVQ3+
% with NVQ2+
% with NVQ1+
% with otherqualifications% with noqualifications
However, the skills gap reported by employers is estimated to be widening (Figure 35 below). Figure 35: Employer reported skills gap54
0.05.0
10.015.020.025.030.0
Tow
erH
amle
ts
Cro
ydon
Hou
nslo
w
Bar
king
&D
agen
ham
Eal
ing
Hac
kney
Wal
tham
Fore
st
Gre
enw
ich
Lew
isha
m
Lam
beth
Mer
ton
New
ham
Har
inge
y
Bre
nt
Sou
thw
ark
200520072009
52 Data on skills attainment, skills gaps and learner success rates are projections from national surveys executed in 2005 and 2007. They are the latest data available and cannot be disaggregated to ward level. 53 http://www.nomisweb.co.uk Annual Population survey.
54 http://data.gov.uk/dataset/ni-174-skills-gaps-in-the-current-workforce-reported-by-employers National Employer Skills Survey, Skills gaps exist where employers report having employees who are not fully proficient at their job. The proportion of establishments reporting any skills gaps in the current workforce is calculated as: ( x / y ) * 100 where: x = the number of employers who report having any skills gaps in their existing workforce. y = the total number of employers.

55
The two data sets represent different populations, those that live in Lewisham and those that work in Lewisham. There is likely to be considerable overlap between their populations. It is therefore difficult to determine whether those living in the borough have a greater level of skill attainment than the overall working population of the borough or whether, even though skills attainment is improving, this is not impacting on the employer reported skills gap. The improved attainment levels and success rates of Lewisham adult learners strongly suggests that the quality of adult learning in the borough is high. It is estimated that:
• 41.6% of Lewisham residents are educated to National Vocational Qualification (NVQ) Level 4 and above, which means they have a higher national diploma or degree level qualifications.
• 56.2% have NVQ Level 3 and above which is equivalent to at least 2 A Levels or an advanced
General National Vocational Qualification (GNVQ).
• 68.8% have NVQ Level 2 and above which is the equivalent of 5 or more GCSEs at grades A-C or an intermediate GNVQ.
• 77.6% have NVQ Level 1 and above, which equates to less than 5 GCSEs at grades A-C or a
foundation GNVQ.
• 15.8% of Lewisham residents hold other qualifications such as foreign qualifications. This compares to 8.8% nationally and 14.3% London which suggest foreign qualifications correlate with areas of higher immigration.
• 6.6% have no formal qualifications at all but this has declined since 2005 (13.7%).

56
Figure 36: Success rates for all borough residents attending Adult Learner Responsive provision55.
Although national funding priorities are for courses that lead to qualifications, providers respond to the needs of those without basic skills through a wide provision of family learning. As well as helping parents to improve the educational outcomes for their children, family learning creates learning opportunities for people who lack confidence to attend formal courses and provide a stepping stone to gaining qualifications in the future. It is likely that national budget cuts could lead to local reductions in provision. Strategic response to needs and aspirations of residents Lewisham adult learning providers have strong user involvement mechanisms that feed back needs and aspirations of users. The wider views of those not currently engaged in adult learning were explored in 2007 when Lewisham Council carried out a telephone survey of 927 residents on adult learning.56
55 www.thedataservice.org.uk/statistics/statisticalfirstrelease/sfr_current/ Adult Learner Responsive provision is learning that has traditionally been delivered in a college to adults. It ranges from non accredited attendance based learning to qualifications to Level 4 or Level 5. Success rates are based on the individual aims that were expected to end in the academic year. They are calculated as the number of learning aims achieved divided by the number started. This is based on the borough of learners post codes not on results of all providers in a borough. 56 Community Education Lewisham: Residents telephone survey on the future shape of the service (2007)

57
The survey explored the motivations of ‘potential learners’ who were interested in adult learning and the reasons why some residents are not interested. 35% of residents were interested in adult learning. Of those who said they were not interested the most popular reasons given were being too busy and the cost. There are more people in this group with an annual income over £25,000 suggesting that not needing or having time for adult education is an obvious factor. Men and older residents are less likely to be interested but ethnicity, disability or unemployment have no apparent bearing on level of interest. For the 35% who said they were interested more were interested in career orientated learning than learning for pleasure or personal development. Sense of achievement was reported as more important to potential learners than developing confidence or making new friends. Age is the only factor that affects this. Potential learners aged 45 or over are much more motivated by learning for pleasure. Women are more interested than men. There is no overall difference in levels of interest between White British respondents and those from Black and Ethnic minority groups. Over 65s are less likely to be interested. Potential learners are more likely to have younger children. The demand for English for Speakers of Other Languages (ESOL) in the London Borough of Lewisham is high. At the last census, over 130 languages were spoken in the borough and this increases to 170 in the current school population. Traditionally, the majority of ESOL learners have been refugees and asylum seekers, but there is a rising demand from migrant workers compared to newly arrived asylum seekers. It is fair to say that adult learning in Lewisham is to a large extent, needs led. The Mayor’s Commission which reported in March 200957 was established to shape the council’s strategic vision for libraries, adult skills and community learning. The Commission explored future possibilities across the range of service, activities and engagement offered through libraries and learning. Key recommendations for adult learning include: • Establish a partnership to review current provision in the borough and deliver a clear strategy for
adult learning in Lewisham, creating closer co-ordination across the agencies involved and clear progression routes for learners.
• Identify the curriculum areas that are most vulnerable to changes in national funding, including
those available to sustain and develop learning undertaken for personal development and enjoyment. Based on this assessment the partnership should explore alternative sources of funding and support for adult learning.
• The Council should ensure that the most vulnerable residents, including those with learning
difficulties and disabilities, are supported into and have access to a range of learning, and where appropriate are able to access further training and employment.
• The Council, in collaboration with the community and voluntary sector, should explore
opportunities to bring learning closer to ‘hard to reach’ learners and to continue the development of family-centred learning.
• There are a range of community spaces and other buildings, such as libraries, community
centres, leisure centres and schools, where community learning, particularly informal learning activities can and does take place. The Council should develop proposals to enable this capacity
57 Mayor’s Commission on Libraries and Learning: A review chaired by the Mayor of Lewisham, Sir Steve Bullock on the future of library services and adult learning in the borough (2009)

58
to be utilised for adult learning, increasing the offer that individual schools are able to make to their local community.
The established partnership has an agreed vision, ‘Together we will make Lewisham a borough in which everyone has the opportunity and support they need to learn’, and has agreed aims, objectives and strategy. They have also developed a borough-wide learner charter in a step towards ensuring equality of experience for all Lewisham learners. Local provision Community Education Lewisham (CEL) and Lewisham College are the major providers of adult ‘Skills for Life’ learning opportunities in Lewisham. There is also a large voluntary sector and a large independent provider of adult skills. In addition there are numerous small specialist providers of accredited and non-accredited courses. Lewisham Service Providers Forum (LSPF) brings together partners from the public, private and third sector with a role to play in supporting local residents into training and employment. Lewisham College works with one of the most extensive employer bases developed by a college in London. Goldsmiths, University of London, uses customer insight to widen participation. It focuses on groups without a cultural tradition of higher education, to ensure that courses are relevant and to retain students. Outreach work focuses on two target groups; young people in schools and colleges and adults in work or unemployed, particularly hard to reach groups such as ex-offenders. Conclusion Lewisham residents who are in employment, work over a very wide area and only a minority live and work in Lewisham. Overall, the Lewisham labour force is relatively highly skilled and skill levels are rising. 71.4% have NVQ Level 2 and above which is the equivalent of 5 or more GCSEs at grades A-C or an intermediate GNVQ. 8.3% have no formal qualifications at all. 2 We usually tell how Lewisham has relatively high levels of low skilled residents and those with higher qualifications, but a gap in the middle? Has this changed? JH check) The overall picture of adult skills in the borough is understood by providers who have developed strategic responses to address gaps. Budget reductions across local government and the education sector are likely to reduce the capacity of the borough to provide these services at the same level. The area has an outstanding Further Education College (subject to the most recent OFSTED inspection) in Lewisham College (London’s first double Beacon College) which provides a significant opportunity in terms of local opportunities to enhance skills.

59
Skills SWOT Analysis Strength • Improving adult skills attainment
• Quality of Provision
Weaknesses • Mapping of skills provision
• Community Education Lewisham links to employers
• No Learning Partnership to lead local skills strategy
Opportunities • Further Development of Learning
Partnership to address weaknesses
• Enhancing link between local HE and FE institutions and local businesses (like previous ABLE project)
• Match learning with employer skills needs and growing sectors
Threats • Ability to address the tension between
Government funding priorities and the need for ESOL provision and non-accredited learning.
• Budget savings proposals may impact negatively on the borough’s ability to deliver work related training and basic skills

60
2.4 Economic and social exclusion and deprivation In this chapter we describe the pattern of income across the borough and the detailed scale and nature of unemployment, inactivity and health together with an analysis of deprivation in the borough. Spatial distribution of wealth/income In the main, Lewisham does not have the juxtaposed wealth and poverty of some other inner London boroughs. However, as seen in chapter 2.1 above, average income levels in Lewisham are below the average; both in comparison to inner London and outer London. An examination of 2007 Paycheck data on equivalised incomes (that is household incomes adjusted in a nationally-recognised standard way to allow for differences in household size such as differences in the number of children in the household) across London shows that whereas 14.2 per cent of all London households had an annual income of less than £15,000; the comparable percentages for Inner London was 15.4 per cent and for Lewisham was 17.2 per cent58. Figure 37: Comparison of Median Equivalised Household Income59 Mean
Equivalised Household Income (£)
Median Equivalised Household Income (£)
Median Equivalised Household
Income Band (£)
Modal Equivalised Household
Income Band (£)
Lewisham £35,269 £28,865 25-30k 15-20k Inner London £39,723 £31,852 30-35k 15-20k Outer London £36,244 £29,665 25-30k 15-20k London £37,687 £30,509 30-35k 15-20k Great Britain £31,386 £25,486 25-30k 15-20k Compared to elsewhere in London, Lewisham is below the Inner and overall London average.
58 Paycheck data, 2007 59 Paycheck data 2008

61
Figure 38: Average Household income by Ward in Lewisham60
Household Income (£)
£0
£5,000
£10,000
£15,000
£20,000
£25,000
£30,000
£35,000
£40,000
£45,000
£50,000
Bellingham
Blackheath
Brockley
Catford South
Crofton Park
DownhamEve
lyn
Forest Hill
Grove Park
Ladywell
Lee Green
Lewisham Centra
l
New Cross
Perry Vale
Rushey Green
Sydenham
Telegraph Hill
Whitefoot
Ward
A number of wards within the Borough have median household income significantly below the Lewisham average. These areas correspond closely to the Index of Multiple Deprivation (IMD), employment and benefit claimant data. The highest earners in Lewisham live in Blackheath, Forest Hill and Lee Green. Downham and Whitefoot are the lowest earners. Lewisham’s benefit claimant analysis Figure 39 overleaf indicates that the economic activity among Lewisham residents is relatively consistent with other London boroughs. However, Lewisham at 10.1% experiences a greater rate of unemployment among working age adults relative to the London average, 9.2%61. According to the Office of National statistics (ONS) model based estimate, 15,000 Lewisham residents are unemployed62.
60 Paycheck data 2008 61 ONS Annual Population Survey July 2010 - June 2011 62 ONS Annual Population Survey July 2010 - June 2011
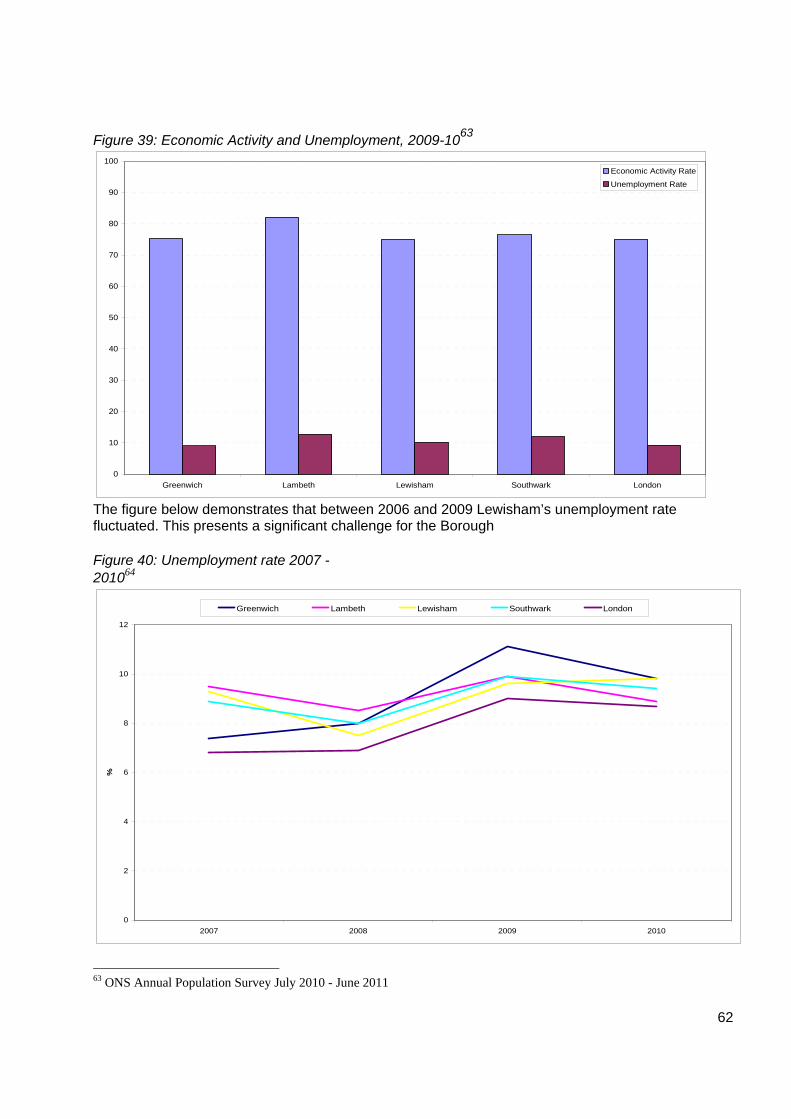
62
Figure 39: Economic Activity and Unemployment, 2009-1063
0
10
20
30
40
50
60
70
80
90
100
Greenwich Lambeth Lewisham Southwark London
Economic Activity Rate
Unemployment Rate
The figure below demonstrates that between 2006 and 2009 Lewisham’s unemployment rate fluctuated. This presents a significant challenge for the Borough
Figure 40: Unemployment rate 2007 - 201064
0
2
4
6
8
10
12
2007 2008 2009 2010
%
Greenwich Lambeth Lewisham Southwark London
63 ONS Annual Population Survey July 2010 - June 2011

63
Figure 41 shows the significant gap between JSA claimant numbers and vacancies available in the borough. However, the travel to work area for many in Lewisham is quite extensive (and the number of vacancies may for many, significantly understate those vacancies which are accessible to a Lewisham resident) for many seeking an unskilled or semi-skilled job, a local job will be the only realistic one because of travel costs. Figure 41: JSA claimants compared to vacancies in the borough65
JSA Claimants Vacancies January 2008 5676 316 January 2009 7099 208 January 2010 9342 581 January 2011 9412 595 January 2012 10,791 629 Out of the working age population of 187,80066 Lewisham has 28,76067 people claiming out of work benefits. This represents 15.3% of the working age population (aged 16-64) compared to the London average 12.4%. More recent data available for Jobseekers Allowance, in January 2012, showed 10,791 residents were claiming. Which is 5.7% of the working age population and higher than the London and Great Britain average. From 2008 onwards there is a clear upward trajectory of job seekers, reflecting the impact of the economic downturn. Lewisham’s overall level of economic activity has reduced to now be in line with the London average at 75.0%.68 The majority of Lewisham residents on jobseeker allowance at January 2012, had been claiming for less than six months. Lewisham has 18.6% long term (12 months plus) jobseekers allowance claimants which is less than the London average of 22.0%69. Long term claimants has consistently been lower than the London average for a number of years, but recently we have started to see an increase in the number of long term claimants, reflecting Lewisham’s dependence on public sector employment. The highest number of jobseeker claimants in Lewisham are aged between 25-49.70 Of the total 10,791 people claiming JSA in October 2010, 6,664 (7.0%) were male and 4,127 (4.5%) were female. This is a similar trend across London and Great Britain where more males are claiming than females. (See Figure 42).
64 Annual Population Survey 65 ONS 2011 66 ONS 2011 67 ONS May 2011 68 ONS Annual Population Survey (June 2010 - July 2011) 69 ONS, 2012 70 Nomis Dec 2010

64
Figure 42: JSA Claimants (October 2010)71 Lewisham
(numbers) Lewisham
(%) London
(%) Great Britain
(%)
All people 10,791 5.7 4.4 4.0 Males 6,664 7.0 5.3 5.5
Females 4,127 4.5 3.4 2.6 Note: % is a proportion of resident population of area aged 16-64 and gender There are consistently high levels of unemployment within specific client groups, notably lone parents (of which there are 5,300 claiming lone parent support) and clients on incapacity benefit (of which there are currently 12,630 F in the borough, see Figure 43. Figure 43: Working-age client group - key benefit claimants (May 2011)72
Lewisham (numbers)
Lewisham(%)
London(%)
Great Britain (%)
Total claimants 32,280 17.2 14.3 14.5 Job seekers 9,630 5.1 4.1 3.6 ESA and incapacity benefits 12,630 6.7 5.8 6.5 Lone parents 5,300 2.8 2.0 1.5 Carers 1,610 0.9 0.9 1.2 Others on income related benefits 1,210 0.6 0.5 0.5 Disabled 1,670 0.9 0.8 1.0 Bereaved 250 0.1 0.2 0.2
71 Nomis Oct 2010 72 DWP benefit claimants - working age client group, May 2010

65
Figure 44: Lewisham’s JSA claimant count73
0
2000
4000
6000
8000
10000
12000
Jan-0
8
Mar-08
May-08
Jul-0
8
Sep-08
Nov-08
Jan-0
9
Mar-09
May-09
Jul-0
9
Sep-09
Nov-09
Jan-1
0
Mar-10
May-10
Jul-1
0
Sep-10
Nov-10
Jan-1
1
Mar-11
May-11
Jul-1
1
Sep-11
Nov-11
Jan-1
2
Figure 44 shows how the JSA claimants count in Lewisham has continued to steadily rise in Lewisham since January 2008. The JSA rate then stabilised between May 2008 and May 2011, rising again in line with the impact of public sector retrenchment. Worst performing neighbourhoods are defined as Lower Super Output Areas (LSOAs) with a benefit claim rate of 25% or more based on a 4 quarter average up to February 2009. LSOAs are statistical areas smaller than wards. An average LSOA contains around 1,500 people. The working age population for this dataset is defined as the sum of females aged 16-59 plus males aged 16-64. Of Lewisham’s 166 Lower Super Output Areas, 8 LSOAs have a benefit claimant rate of 25% or more74. These LSOAs fall within the wards of:
• Bellingham • Forest Hill • Sydenham • Lewisham Central • Evelyn • Rushey Green • Whitefoot
There is particular concentration within the ward of Evelyn where there are two LSOAs of over 25%.
73 ONS Claimant Count Data, 2008-12 74 CLG Datahub, 2010

66
Analysis of the working age claimant figures shows that there are high levels of unemployment within specific client groups, notably; lone parents (of which there are 5,300 claiming lone parent support) and clients on incapacity benefit (of which there are currently 12,630 in the borough) Analysis of Lone Parent and IB claimants by Lower Super Output Areas show that: • There is a slightly higher concentration of IB claimants in the south of the borough • The majority of the 12 key neighbourhoods (LSOAs) correspond to areas of social housing /
estates. • When mapped against other indices of deprivation such as child poverty, these are also found to
be high. • In Lewisham, there has been an increase in claimants for Job Seekers Allowance (JSA) from
3.3% of the total working age population to 5.1% (an increase of 3,297 people) over the period October 2008 to October 2010F
75F This represents a 53.4% increase. The most recent data
available by Ward76 shows that Downham, Evelyn and Bellingham had the highest rates of JSA claimants.
• The claimant rate has been increased even further in 2011 as Lewisham was impacted significantly impacted by the public sector budget cuts.
Deprivation In relative terms, Lewisham remains amongst the most deprived local authority areas in England. In the overall Index of Multiple Deprivation or IMD (the combined score from all the indices), Lewisham’s average score was 30.97, which puts Lewisham as the 31st most deprived of all Local Authorities (one being the most deprived). This means that as a local authority, Lewisham is within the 20% most deprived Local Authorities in the country. In 2007 Lewisham was ranked 39th, so although the current ranking is lower, a number of authorities that were within the 20% most deprived nationally, no longer exist such as Easington, Penwith and Wansbeck.
The proportion of LSOAs in the bottom 20% nationally has actually decreased slightly. 36.7% of Lewisham’s 166 Lower Super Output Areas (LSOAs) were in the 20% most deprived in England, compared with 38.6% in 2007 and 33% in 2004. Only four of these LSOAs were within the worst 10% (previously there were eight in 2007); they are dispersed across Evelyn, Lewisham Central, Rushey Green and Whitefoot. However, 57 of Lewisham’s LSOAs were in the bottom 10%-20% (up one from 2007), making a total of 61 LSOAs in the bottom 20%.
75 This compares to a rise for the whole of London from 2.7% in October 2008 to 4.0% in October 2010, ONS, 2010. 76 Refers to May 2010

67
Figure 45: Number of Lewisham’s Lower Super Output Areas amongst the 10% and 20% most deprived in England (2004, 2007 and 2010)
3
8
4
54
6461
0
10
20
30
40
50
60
70
2004 2007 2010
Num
ber o
f LSO
As
Worst 10%
Worst 20%
As well as an overall score of multiple deprivation each local authority is also given a score of the average ranking of its LSOAs, (this is because the IMD score does not weight all of the seven domains equally). On this score, Lewisham is also ranked as more deprived than 2007 achieving a score of 16th, compared to 22nd most deprived in 2007 (again where one is the most deprived). The difference between Lewisham’s overall IMD and the average rank of its Indices of Deprivation (ID) may indicate that for some ID measures, a number of Lewisham’s LSOAs scored particularly low scores. This is most likely to be because the domains where Lewisham is most deprived, Crime and Housing, are not weighted as highly as Employment and Income.
Figure 46: Headline indicators
2004 2007 2010 Rank of Index of Multiple Deprivation (IMD)
57th 39th 31st
Rank of the Average Rank of Indices of Deprivation (ID)
38th 22nd 16th

68
With nearly 40% of Lewisham’s LSOAs in the bottom 20%, and almost all of the remaining LSOAs being in the bottom 50%, the IMD results again suggest that Lewisham faces some significant challenges. Care must be taken not to assume that “less deprived” means “wealthier” as the indices measure only levels of deprivation, not affluence. In addition, it is important to recognise that even in LSOAs with little deprivation there may be individuals and families experiencing deprivation. These people will also need to access support and services aimed at tackling deprivation.
Lewisham is not alone among comparable areas in facing the challenge of increasing levels of deprivation. However, closer analysis of the individual domains needs to be undertaken to evaluate the effectiveness of actions and determine what additional steps need to be taken.
Figure 47: Overall deprivation (combined deprivation score)
Worst 20% in England
Best 20% in England

69
Figure 48: Number of LSOAs in bottom 20% nationally
Total
number of output areas
Number of output areas in 20% most
deprived
Proportion of output areas in the 20%
most deprived
Bellingham 9 8 88.9
Blackheath 9 2 22.2
Brockley 9 2 22.2
Catford South 9 0 0.0
Crofton Park 9 0 0.0
Downham 10 9 90.0
Evelyn 10 7 70.0
Forest Hill 9 2 22.2
Grove Park 9 4 44.4
Ladywell 8 0 0.0
Lee Green 8 0 0.0
Lewisham Central 9 4 44.4
New Cross 10 5 50.0
Perry Vale 10 3 30.0
Rushey Green 9 4 44.4
Sydenham 10 3 30.0
Telegraph Hill 10 3 30.0
Whitefoot 9 5 55.6
LEWISHAM - 2010 166 61 36.7
LEWISHAM - 2007 166 64 38.6
Change 0 -3 -1.9
[The 5 most deprived wards are highlighted.]
Deprivation is likely to impact on residents’ life chances as well as their employment opportunities and will affect the local economy. The geographic distribution of the output areas in Lewisham which see the highest relative levels of deprivation is quite striking with the concentration of pockets at the north and south of the borough.

70
Free school meals data In Lewisham this variable results in a 17% point difference between those achieving five A*- C grades at GCSE level. This will have future impacts on Lewisham’s economy as those with low or no educational attainment will be disadvantaged when seeking employment. Related to deprivation is the issue of crime, particularly relevant in Lewisham as this has traditionally been the area that residents state is their greatest concern when asked in surveys. Figure 49 compares the last two years crime data for both Lewisham and London (excluding the City of London). Figure 49. Crime Statistics - Number of Offences77
12 months to January 2012 12 months to January 2011 Lewisham Met Total Lewisham Met Total
Homicide 7 107 9 131 Violence Against the Person (Total) 6,365 154,772 6,982 168,989
Rape 139 3,410 144 3,238 Other Sexual 295 6,889 235 6,999 Robbery (Total) 1,686 39,132 1,556 35,638 Robbery (Person) 1,557 36,341 1,416 32,492 Robbery (Business) 129 2,791 140 3,146 Burglary (Total) 3,244 96,045 3,256 92,652 Burglary Residential 2,272 63,473 2,288 60,186 Burglary Non-Residential 972 32,572 968 32,466 Gun Crime 137 2,421 139 2,938 Motor Vehicle Crime 3,108 99,450 3,356 100,703 Domestic Crime 1,766 46,465 2,096 48,935 Racist & Religious Hate Crime 211 7,990 230 9,117
Homophobic Crime 40 1,212 33 1,326 Total Crimes 27,630 816,248 29,242 827,762
In the majority of the categories that crime is grouped into, as well as overall there were less recorded offences in the 12 months to January 2012 then the preceding year, with robbery a notable exception. The most common offence was ‘Violence against the person’ in both Lewisham and in London. Disability Between national census’s disability data is difficult to obtain. In 2001 the percentage of Lewisham’s residents who stated that they had a ‘limiting long-term illness’ was 15.6%.This was just slightly higher than the London average of 15.5%. More recent survey data78 has shown that the employment rate of disabled residents in Lewisham is generally in line with London overall. However like London this figure in Lewisham is over 20% lower than it is for non disabled residents. This indicates that disabled residents in Lewisham who want to be in employment are not always able to find it. This is an area that needs to be considered and could potentially be due the borough having less employment opportunities within its boundaries than elsewhere. 77 Metropolitan Police Service 2012 78 Annual Population Survey data

71
Fuel Poverty Fuel Poverty is a relatively difficult area to accurately measure79. Despite this, latest figures (2008) from the Department of Energy and Climate Change (DECC) suggest that80:
• 15.6% of English households are fuel poor
• In 1996 this was 26% of households Data for Lewisham suggests that 7.4% of households are fuel poor, which is lower than the regional London average, however this figure doesn’t take into account the recent price rises, and is based on a full income definition as opposed to residential income (i.e. income after housing costs). The GLA commissioned research to look at the effect of housing costs on the definition of fuel poverty in London (where the household has been defined as vulnerable, including for example households with children under 16 years old). This study suggested that 27.5%, of this group in London, were in fuel poverty before the recent price rises in energy81. The lowest consumption of domestic electricity and gas (measured by megawatt per hour) is in the north (New Cross and Evelyn) followed by the south of the borough (Whitefoot, Bellingham and Downham). See maps and source below. This pattern is largely echoed across the borough breakdown of deprivation posing implications for fuel poverty.
79 Source: GLA ‘Fuel Poverty in London report’ (April, 2009) 80 Source: DECC ‘Annual report on fuel poverty statistics’ (2010) 81 Source: GLA ‘Fuel Poverty in London report’ (April, 2009)

72
Figure 50 Total Consumption of Domestic Electricity and Gas From January 2008 to December 2008

73
The Health Profile of Lewisham Lewisham is among the 20% worst areas in England for deprivation, life expectancy and premature deaths from cancer and circulatory disease. According to Health, Wellbeing and Care82:
• Life expectancy is lower than the England average and there are particular inequalities across the Borough. For example, between 2002 and 2006 there was up to a 6-year difference between the wards with the lowest and highest life expectancy for men (4-year difference for women). Lewisham Central and New Cross have the lowest life expectancy.
• In line with national trends, All Age All Cause Mortality rates (AAACM) for both males and
females have continued to fall in 2007-09. The rate is still higher for Lewisham compared to England.
• Early deaths are significantly higher than expected for a range of causes, including cancer,
heart disease, stroke, circulatory disease, respiratory diseases and overall deaths linked to smoking (comparing mortality rates for England as a whole and London).
• For period 2005-2007 there were 18% more deaths in men from cancer in Lewisham
compared to England. For women there was no significant difference. There are significant inequalities in cancer mortality within Lewisham. New Cross and Bellingham wards have the highest mortality rates for 2003-07.
• Diabetes, circulatory diseases, respiratory diseases and other long-term conditions are all
significant causes of ill-health in Lewisham. Incidence of prostate cancer, bowel cancer, lung cancer and breast cancer are a particular cause for concern.
• Black and minority ethnic communities are at greater risk from health conditions such as
diabetes, hypertension and stroke.
• Substantial number of residents live with a long term condition (LTC), such as diabetes, stroke and respiratory diseases (e.g. asthma, COPD). According to the 2001 Census, 16% of Lewisham’s population lives with a long term illness that limits their day to day activities, a higher percentage than is found in the population nationally.
• It is estimated that 18.17% of adults are engaged in binge drinking83 in Lewisham. This is
lower than the average for England (20%) and higher that the rates for London as a whole (14.3%). Higher risk drinking rates (50 units or more per week) at 5.16% are similar to those for London (5.1) and England (5.5). However, other statistics indicate that Lewisham has particular problem areas with higher than average London and England rates for alcohol related hospital admissions84 and alcohol attributable crimes 85.
82 Unless otherwise referenced all data are taken from Health Wellbeing and Care: Lewisham Joint Strategic Needs Assessment 2010 83 8 units for men, 6 units for women in one session. 84 Lewisham 1719 per 100,000 hospital admissions compared to London (1489.9) and England (1582.4) Local alcohol profiles for England
http://www.nwph.net/alcohol/lape/index.htm 85 Lewisham 14.49 per 1000 population compared to London (12.2) and England (8.06) Local alcohol profiles for England
http://www.nwph.net/alcohol/lape/index.htm

74
• It is estimated that 27% of adults smoke in Lewisham compared to the 22% England average. The death rate due to smoking in Lewisham is also higher than for England.86
• There are ethnic inequalities in admissions to adult psychiatric inpatient services in Lewisham.
The admission rate for White ethnic groups in Lewisham is 1.6 times higher than the England average for all ethnic groups, whilst the admission rate for Black ethnic groups in Lewisham is 2.8 times higher the England average.87
• Lewisham has particular sexual health problems including higher than average rates of
sexually transmitted infections and HIV prevalence, teenage pregnancy and high numbers of terminations.
• In Year 6 (10 and 11 year olds) the obesity rates in 2007/8 were higher than both the London
and England averages. The highest levels of physical activity tend to be in more affluent parts of the borough.
Figure 51: National Indicator set
Indicator London Ranking
NI 112 – Under 18 conception rate (% chance)* 14/33(2008)
NI 123 - Smoking quitters* 18/33 (2009/10) NI 119 - Self reported measure of people’s health and well-being (Place Survey) 21/33 (2008)
NI 8 – Adult participation in sport* 23/33 (2008/9) NI 39 - Alcohol related admissions 26/33 (2008/9) NI 122 - Cancer mortality rates** 28/33 (2008) NI 120b - Mortality rate, males* 31/33 (2008) NI 120a - Mortality rate, females* 33/33 (2008) NI 121 - Circulatory disease mortality** 29/33 (2008) NI 55 – Obesity among primary children in Reception* (07/08) 21/32 ((2008/9)
NI 146 – Adults with learning disabilities in employment* (05/06) 16/33 (2009/10)
NI 137 – Healthy Life Expectancy at age 65** 26/32
NI 56 - Obesity among primary school age children ** 19/32 (2008/9)
*denotes inclusion in Lewisham’s 2008/11 LAA **denotes inclusion as an Local Performance Indicator Conclusion Both the IMD and health data presented in this section show that Lewisham faces notable challenges in terms of economic and social exclusion. However this is a picture seen in many parts of inner London. In terms of health, life expectancy, although improving, still lags behind other areas of the 86 266.9 per 100,000 population compared to England 206.8 population 87 London Adult Mental Health Scorecard 2011 London Health Observatory Commissioning Support for London.

75
country. Projects such as the Health Joint Strategic Needs Assessment worked on in partnership between the Primary Care Trust and the Council will create better awareness of specific problems and how they can be addressed. Currently both the high levels of ill health experienced by people within the borough and the level of deprivation are significant drags on Lewisham’s economy. Economic and Social Exclusion SWOT Analysis Strengths
• Lewisham is home to a diverse range of people from various backgrounds and communities.
Weaknesses
• Health issues and high % of IB claimants • Mortality rates are considerably higher
among BME communities than the rest of the population.
• Problems of both health and deprivation are clustered in particular areas of the borough
Opportunities
• Awareness of the challenges the borough faces will help facilitate improvements.
Threats
• The relative decline of deprivation levels from 2004 to 2007.
• Levels of smoking and alcohol consumption are both higher than the London average.

76
SECTION 3: SUSTAINABLE ECONOMIC GROWTH

77
3.1 Lewisham’s regeneration programme In this section we describe Lewisham’s regeneration strategy for 2008-20 which is a key part of creating a foundation for sustainable economic growth in the borough. Introduction Lewisham has an appealing and attractive environment with a significant amount of open space and considerable potential for further enhancement to make it a place where more people will want to work, start and build businesses, visit and live. In Appendix 6 we describe the local environment and its assets in more detail. 'People, Prosperity, Place - the Lewisham Regeneration Strategy 2008-2020’ sets out Lewisham Council's vision for building on these assets and describes the future of the borough from now until 2020, and the projects and plans which are underway to deliver that vision. It focuses on the ways in which regeneration contributes to the Community Strategy priorities agreed by the Lewisham Strategic Partnership, particularly those around crime, health, education, enterprise and business growth and cultural vitality. ‘People, Prosperity, Place’ also reflects the priorities of the emerging Core Strategy, the principal document in Lewisham’s Local Development Framework (LDF) which sets out the Council’s overarching planning spatial vision. The Core Strategy is underpinned by five thematic strategic objectives:
• Regeneration and growth areas • Providing new homes • Growing the local economy • Environmental management • Building a sustainable community
Future growth – people and places The Greater London Authority predicts that the overall population of Lewisham is expected to increase by close to a quarter between 2006 and 2031 - an additional 64,300 people in total. The Council - mindful of the above statistic - has a preference for ambitious borough-wide regeneration and growth which could see more than 19,000 new homes in the borough by 2025. Figure 52

78
Physical growth and regeneration in the borough of Lewisham is primarily focused on a corridor in the north, incorporating the localities of Lewisham, Catford, Deptford and New Cross. This capitalises on the higher public transport accessibility of the area, and the need to intensify land uses in town centres (in terms of Lewisham and Catford) and on re-designated employment/industrial land (in Deptford and New Cross). This approach also supports the London Thames Gateway growth area and the London Plan Opportunity Area designations. Lewisham town centre Currently designated a ‘major’ centre within the London Plan, the Council’s aspirational vision for Lewisham town centre is as a “metropolitan destination of exceptional quality; a bustling urban centre and first class shopping and leisure destination. The town centre will benefit from sustainable and diverse new residential communities, attractive waterfront environments and a network of vibrant public parks, streets and open spaces.” There are several sites and schemes within Lewisham town centre that will contribute towards the realisation of the Council’s vision, all of which are outlined in the Lewisham town centre Area Action Plan (AAP). The allocation of sites within Lewisham has the potential to provide at least 2,550 new homes by 2016 and a further 890 new homes by 2025; and an extra 20,000 m² of retail floorspace over a similar period.

79
Overview of Lewisham town centre Area Action Plan
Figure 53
The lynchpin for the
regeneration of the town centre is
Lewisham Gateway (‘1’ on the above map), one of five Strategic
Sites identified in the emerging Core Strategy (Strategic Site
Allocations). Outline
planning permission
was granted in 2007 for a
comprehensive mixed use redevelopment of the site for up to 100,000 m², incorporating:
• Up to 57,000 m² residential – equating to up to 800 new homes • Up to 12,000 m² shops, financial with professional services • Up to 17,500 m² offices / education • Up to 5,000 m² leisure • Up to 4,000 m² restaurants and cafés and drinking establishments • Up to 3,000 m² hotel • Up to 1,000 m² hot food takeaways • 500m² health • Provision of up to 500 car parking spaces.
The Loampit Vale development (covering ‘11’ and ‘12’ on the above map) is a further mixed use redevelopment in the heart of the town centre, a partnership between the Council and Barratt Homes. The development comprises:
• Eight buildings ranging in height from 5 to 22 storeys • 788 new homes • A leisure centre (including a swimming pool) • Replacement facilities for the existing London City Mission • Shops, financial/professional services and business space (approx. 1,670m², including
business space for ‘creative industries' of approx. 620m²)

80
• Public and private open space • Associated highway works.
Planning permission for Loampit Vale was granted in late 2009, and works commenced in summer 2010. Various other elements of the Lewisham town centre Area Action Plan also have implications in terms of new business and retail space, including the Thurston Road scheme (which received planning permission in 2006, and includes three ground-level retail units) the Silkworks development in the very north of the town centre (the building of which is now largely complete, and again features retail at ground-level) and Lee High Road (various mixed-use development opportunities). Catford town centre Catford - the borough of Lewisham’s only other ‘major’ centre – is also the subject of an emerging AAP, designed to realise the Council’s vision of a “lively attractive town centre focused around a high quality network of public spaces. It will have a well designed shopping centre and leisure uses, provide homes for a large, diverse residential community and will be the home of Council services for the borough.” The AAP proposes a strengthened civic role for Catford; an additional 18,000 m² of retail floor space (largely derived from existing vacant retail units and the redevelopment of the existing Catford Shopping Centre); and 650 new homes by 2016, with a further 1,100 by 2026. Central to the regeneration of Catford – in both senses of the word – is the Milford Towers/Catford Shopping Centre complex (‘Development Opportunity Site 1’ on the above map). Milford Towers is a block of 276 flats located directly above the shopping centre. One cannot be redeveloped without the other, which has been a long-standing hurdle to the regeneration of Catford as the shopping centre was until recently privately owned by St Modwen Properties plc

81
Overview of Catford town centre Area Action Plan
Figure 54
However, in January 2010 the Council set up Catford Regeneration
Partnership Ltd (CRPL), a wholly owned
company limited by shares, to acquire St
Modwen’s land interests in the town centre. This represents a
significant reduction in
the fragmentation
of land ownership in
Catford, removing a key historical
barrier to the regeneration of the town centre. CRPL completed the acquisition earlier this year, and visioning work for the regeneration programme has commenced. Until recently, a consortium of Countryside and Hyde HA were bringing forward a comprehensive development of the former Catford Stadium site (‘Development Opportunity Site 3’ on the above map). Planning permission has been granted for 589 homes, a community centre, 508 m² of commercial space next to the Catford Station, and a new public space in between the two stations. Due to the economic situation, those plans have stalled; however, it is understood that the HCA are aiming to select new partners under the Delivery Partner Panel. Development sites elsewhere in Catford town centre which have business potential include the former Rising Sun and George public houses, and Plassy Road island retail park.

82
Deptford and New Cross Evelyn and New Cross wards have some of the highest levels of deprivation in the borough of Lewisham (and therefore the UK), and the Council recognises the need for a proactive approach to support and improve these areas. Local regeneration and renewal would deliver a radical improvement in the physical quality of the urban environment, and a key aspect of this is the restructuring of the area’s employment base. The Lewisham Employment Land Study (ELS), taking account of the low level of commercial activity in the borough and structural trends, recommends that the Council should release or reallocate 121,000 m2 of industrial/warehousing space and that it should identify 76,000 m2 of office/B1 supply. As the Deptford and New Cross areas accommodate a high percentage of Lewisham’s protected industrial land, these recommendations have significant impact on the area. A re-designation of land use in the North Deptford area has the potential to provide 54,000-106,800 m² of employment floor space over 20 years, alongside at least 10,500 new homes by 2025. The Council’s plans for the area involve improving public transport accessibility, pedestrian and walking connections, and public open space, in order to meet its vision for Deptford and New Cross as “...an attractive, safe and prosperous place to live and work, with a strong local identity and sense of its own history. Any development in the area will be characterised by landmark buildings, high quality streets and public spaces, the creation of new and improved routes between them, and a greater emphasis on the natural environment, parks and open spaces.” Four of the five Strategic Sites identified in the emerging Core Strategy (Strategic Site Allocations) are located in Deptford/New Cross, namely Convoys Wharf, Surrey Canal Road (including Millwall stadium), Oxestalls Road (aka The Wharves Deptford), and Plough Way (including Marine Wharf and Cannon Wharf). Convoys Wharf is the borough's single largest redevelopment site, covering approximately 17ha and taking up approximately half of Lewisham's River Thames frontage. In 2002, then-owner News International submitted an outline planning application for around 3,500 new homes, 73,000sq m² of employment space, plus major new cultural and creative facilities. The Council agreed the application in principle in 2005 but GLA concerns over the approach to the protected wharf have put the application on hold for the past few years. In 2008, the site was bought by Hutchison Whampoa Property, who have recently submitted an amended planning application which is broadly similar to the 2002 one.

83
Convoys Wharf 3,500 homes 1,825 jobs
Oxestalls Road 950 homes 1,000 jobs
Grinstead Road 160 homes 160 jobs
Surrey Canal Road 2,700 homes 2,500 jobs
Silwood Estate 891 homes
Childers St 200 homes 480 jobs
Marine Wharf 750 homes 160 jobs Pepys estate
312 homes
Figure 55 Proposed allocation of homes and jobs in the North Deptford area

84
Pre-application negotiations for the Surrey Canal Road development site are at an advanced stage. Developer ‘Renewal’ is expected to submit an outline planning application – under the banner of ‘Surrey Canal: London’s Sporting Village’ - in late 2010, with implementation potentially from late 2011. Up to 2,700 residential units could be built to accommodate a population of 6,000, plus employment space of 5,000 m², equating to around 2,500 jobs. Part outline/detailed planning application for the Oxestalls Road site was submitted to the Council in early 2010. The application proposes 950 residential units and 8,700-10,300 m² of employment space (equating to 950 jobs). The Marine Wharf development (within the Plough Way strategic site) was submitted for outline planning application in late 2009, with implementation expected from late 2010. A further 600 units could be provided by this scheme, and 160 new jobs. The Cannon Wharf development (also within the Plough Way strategic site) could include up to 665 units, plus premises with the capacity to provide up to 424 jobs. It is expected to be reviewed by Planning Committee in mid-2010, with implementation potentially from 2011. The release of these industrial sites for mixed use employment development would complement other mixed use development in the Creekside (Deptford/Greenwich) London Plan Opportunity Area. Development opportunities here could contribute new and reconfigured employment floor space ranging between 54,000 m² to 106,800 m² over 20 years, and at least 4,100 homes by 2025. Deptford Town Centre is mid-way through a five-year regeneration programme, which has already delivered a new leisure centre extension and new parking arrangements. Over the next two years, the Giffin Street site adjoining the town centre will have a major public square, strengthening the attraction of the High Street, as well as a landmark new public building incorporating a new Tidemill School, library and community space, alongside additional employment space and housing. A new Deptford Station will provide a further public square adjoining Deptford High Street, improving station accessibility.

85
3.2 Employment Land The analysis of the economy of Lewisham in Section 1 described the issues around space for small businesses and growing businesses. The creation of a range of opportunities to build and provide space for established, new and growing businesses is important in realising the appeal of the borough as a highly accessible place for retail and visitor attractions and a and a good place to run a business. In this chapter we describe the development opportunities for creating more space which can attract jobs and income to the borough and ensuring that the existing small businesses can grow. London The London Plan sets out the Mayor’s Spatial Development Strategy for the capital. The plan aims to make London a more prosperous city with strong and diverse economic growth. The plan aims to:
• Support and promote the business and finance, creative, cultural and leisure sectors.
• Make East London the priority area for new development, regeneration and investment
• Promote London’s polycentric development and a stronger and wider role for town centres
• Release employment land that is no longer needed so that it can be put to better uses.
Lewisham
• Employment floor space in the borough has decreased in recent years. • New offices for London’s growth sectors in business services, finance and
banking sectors have not been developed. • Many of the boroughs industrial estates are in poor condition and offer low
density employment uses. • The council’s approach is to build on the strengths that Lewisham has in terms
of its position in relation to central London markets. The council wants to encourage new employment by generating development in flexible premises, capable of accommodating a wide variety of businesses that can take advantage of the proximity to central London’s markets.
Lewisham’s Opportunity areas The council’s Regeneration Strategy and the London Plan both set out areas within the borough which can support growth in employment. Deptford Creek is identified as an Opportunity Area, capable of accommodating substantial new jobs and homes. Lewisham and Catford Town Centres are designated Major Centres. They are important for accommodating economic growth and meeting the needs of the population. In addition, three regeneration areas are designated at Deptford, Lewisham and Bellingham. Lewisham is also home to two preferred industrial sites in the Mayor of London’s Strategic Employment Locations study, namely the Surrey Canal and Bromley Road Strategic Employment Locations. The London Plan states that these areas perform a strategic function by providing a reservoir of business and industrial sites within the London-wide economy.

86
Lewisham is in the London Thames Gateway a sub region which is identified as a key growth area in the London Plan. The Government seeks to accommodate significant housing and economic growth in the Thames Gateway, by developing brownfield land and regenerating existing urban areas, placing strong emphasis on the environmental quality of green space and the public realm. The Catford, Lewisham and North Lewisham corridor represents Lewisham’s main focus for growth within the Thames Gateway. Benefiting from good levels of public transport accessibility, the corridor has become a focus of change and significant regeneration. The overall approach by the council is to build on the strengths that Lewisham has in terms of its position in relation to the central London markets. By directing new employment generating development in flexible premises, capable of accommodating a wide variety of businesses that can take advantage of the proximity to central London markets, to a number of large industrial sites in the Regeneration Corridor in Deptford/New Cross and Lewisham Gateway, it is intended that the variety and vitality of the local economy will be improved and the number of jobs available locally increased. These regeneration corridors and industrial areas coincide with some of the most deprived areas of the borough. The physical and environmental improvements associated with these new developments are intended to provide a more attractive environment for new businesses to locate to and to improve its image and profile as a place for business.
A survey of existing employment land in the Borough88 provides evidence of the under-use of many of the industrial sites in the regeneration corridor. The study identified that many of these sites had not been invested in over many years and offered low density uses which would not contribute to meeting job growth projections without extensive reinvestment in new mixed use development that could be used to support new business development. The council’s planning policy is to support the development of these sites to provide for a range of new premises which will attract new businesses. It is hoped that these businesses will generate new jobs that can be filled by local people and help ensure that the local economy is more sustainable. Although vacancy levels for commercial property are high there is high demand for units in better quality industrial estates. The council wants to protect local employment locations throughout the borough which provide good quality relatively modern industrial/warehousing units. The council’s policy is also to protect the Lower Creekside Local Employment Location which provides popular low cost premises enabling the growth of a creative sector associated with the cultural activities at Goldsmiths College and the Laban Trinity Laban Conservatoire of Music and Dance which has been identified as a potential growth sector in the borough. Retail Employment Growth The council wants to support retail growth particularly in the main town centres. The Lewisham Gateway will extend and broaden the retail offer in Lewisham Town Centre as well as providing leisure uses and a hotel to contribute to job growth in this sector. This development will provide a variety of job opportunities for those people in Lewisham who have few qualifications and will provide opportunities to reduce the necessity for out commuting. 88 Roger Tyms and Partners, London Borough of Lewisham, Employment Land Study, November 2008

87
Transport Lewisham is exceptionally well served by public transport. There are regular train services from the borough’s main stations to Central London, and fast access to Canary Wharf, a major employment hub, via the DLR. The council’s priorities for transport are 1) Increasing the capacity of the DLR, 2) delivering the East London Line extension and 3) creating a state of the art interchange at Lewisham town centre. Improvements to Lewisham, Deptford, Catford, New Cross Gate and Forest Hill stations are a priority and will be key to regeneration of the areas surrounding them. Conclusion The plans for the Regeneration of the borough includes the creation of new employment generating development focused on a number of large industrial sites in Deptford and New Cross. It is hoped that these development will bring new physical and environmental improvements which will help retain and attract new businesses into the area. However these developments alongside the major developments in the Town Centres rely on investment from developers. The current economic climate is making it increasingly difficult to attract investment, to bring forward development of these sites in Lewisham.

88
Lewisham Regeneration Programme SWOT Analysis Strength
• Low cost sites for businesses • Attractive for start-ups • Attractive for small businesses • Proximity to City and Canary Wharf • Transport links • Good customer base for small shops • Creative industry cluster
Weaknesses
• Low value developments do not attract investment
• Lack of freehold properties • Lack of large premises • Shortage of office space • Customer base not attractive for large,
high prestige retailers • Quality of environment • Quality of premises
Opportunities
• Planned transport infrastructure • Convoys wharf • Development of old industrial estates in
North Lewisham • Lewisham Gateway • Start-up cluster • Strengthening the creative cluster
Threats
• Lack of investment to bring forward developments
• Losing existing businesses due to poor
environmental quality • Not enough large premises for move-on
needs and inward investment • Continued threat from other retail centres • Increasing rateable values push out small
businesses, start-ups and creative industry

89
3.3 Housing Lewisham plays a significant role in London as a residential area accessible to jobs in inner London and the surrounding areas. The development of the housing market is therefore central to enhancing this role and fully realising the potential of its current built environment and connections. In this chapter we describe the current scale and nature of the housing stock, the challenges this offers, and the opportunities for developing the residential role of the borough as part of a strategy of sustainable economic growth. The London Story The population of Greater London was estimated to be 7.8 million people in 2009. It continues to increase, with the latest projections showing an expected growth of around one million people over the next 20 years, and an additional 700,000 households.89 The ‘London Plan’ (the Spatial Development Strategy for Greater London)90, last revised in July 2011 explains the major issues facing London over the period to 2031. It predicts a growing and more diverse population. It sets a target for an annual average of 32,210 additional homes each year between 2011 and 2021. The first statutory Housing Strategy for London (2010)91 was published in February 2010 and aimed to provide more affordable homes and more family homes for Londoners. It’s plan for 50,000 new affordable homes to be delivered by 2012 is broadly on target. Since then a new investment round has begun, the Mayor for London has taken on a greater role in decisions over housing investment in London and there have been major changes to the allocation of government funding for housing. Linked to this are significant changes proposed in the Localism Bill. As a result, the 2010 strategy has been reviewed and a revised housing strategy is currently being consulted on92. This continues to recognise that the wider economic and social benefits of housing investment are much greater in London than elsewhere. The Mayor’s London Plan recognises that London’s economic growth depends heavily on an efficient labour market and this in turn requires adequate housing provision to sustain it including affordable housing – both homes for social renting and intermediate housing.
The 2008 London Strategic Housing Market Assessment93 estimates an annual requirement for 32,600 new homes in London, with affordable housing making up more than half the total. The Lewisham Story Communities and Local Government projections for the number of households in Lewisham are forecast to increase steadily. By 2033, the Government suggests that the number of households will be 151,000 (CLG, 201094). 89 ONS Mid-Year Population Estimates, GLA, Focus on London 2011: Housing a Growing City, 2011. 90 www.london.gov.uk/publication/londonplan 91 www.london.gov.uk/publication/london-housing-strategy 92 www.london.gov.uk/publication/revised-london-housing-strategy-public-consultation 93 www.london.gov.uk/publication/2008-london-strategic-housing-market-assessment

90
The household composition of Lewisham from the Strategic Housing Market Assessment in 2008 shows a slight decline in single people, single pensioners, and group of adults with children and a larger decline in adults with children, however, there was a corresponding increase of adult couples without children. Lone parents make up about 14% of households in the borough. 16% of all households contain pensioners only.
94 CLG, (November 2010) www.communities.gov.uk/documents/housing/xls/1781041.xls

91
Figure 56 Household Composition in Lewisham in 2001 and 200795 Household Type 2001
(Census) 2007 (Lewisham SHMA)
Single Person 23.4% 21.8%
Single Pensioner 11.4% 10.4%
Adult Couple with Children 16.1% 15.6%
Adult Couple without Children
13.5% 14.5%
Lone Parent 14.6% 14.2%
Other 21.0% 23.4% Lewisham lost 8% of its population to other parts of England and Wales from 2005. However the population still grew due to international in migration and the birth rate. Migration patterns show a clear north/south London split with those leaving the southern central areas of London moving to other southern boroughs. The strong population flows between Lewisham, Bexley, Bromley, Greenwich and Southwark is one of several factors that support the notion of these boroughs as a housing sub region. The map below shows that Lewisham receives population from Lambeth and Southwark, but loses population to Greenwich Bromley and Bexley. Figure 57 - London migration flows between boroughs of London96.
95 Source: Census 2001 and Lewisham Strategic Housing Market Assessment 2008 (Lewisham SHMA) 96 Source: Lewisham Strategic Housing Market Assessment 2008
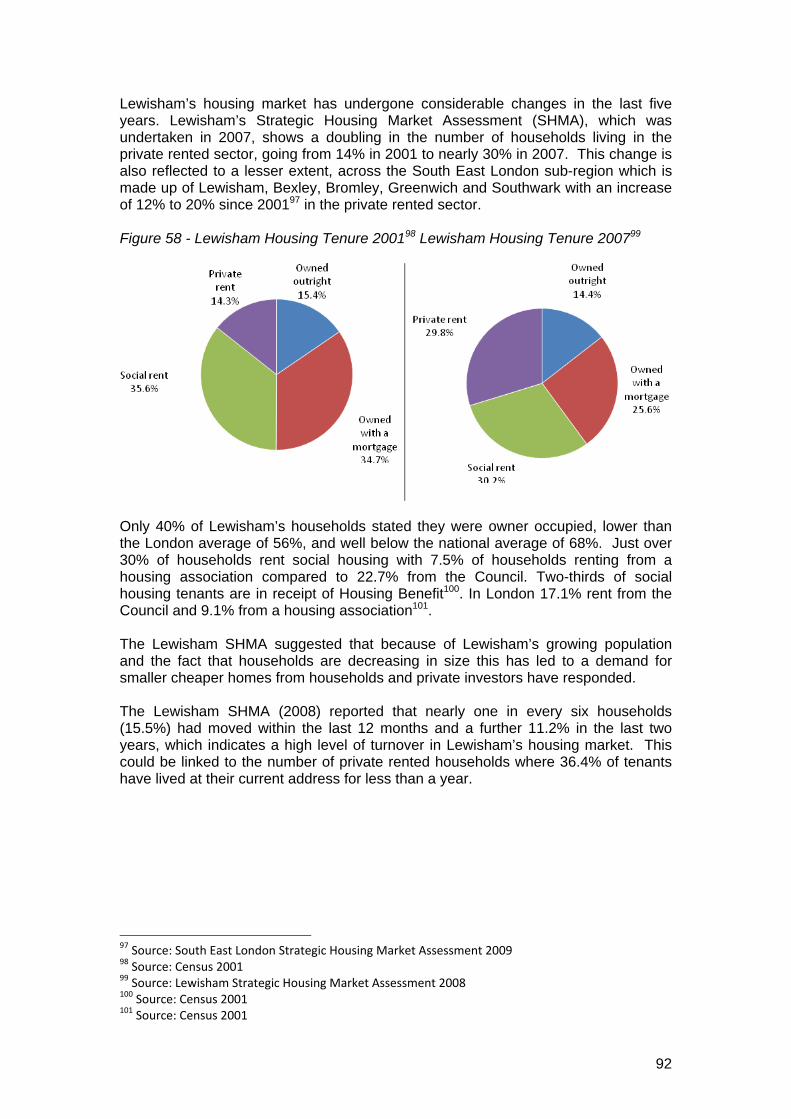
92
Lewisham’s housing market has undergone considerable changes in the last five years. Lewisham’s Strategic Housing Market Assessment (SHMA), which was undertaken in 2007, shows a doubling in the number of households living in the private rented sector, going from 14% in 2001 to nearly 30% in 2007. This change is also reflected to a lesser extent, across the South East London sub-region which is made up of Lewisham, Bexley, Bromley, Greenwich and Southwark with an increase of 12% to 20% since 200197 in the private rented sector. Figure 58 - Lewisham Housing Tenure 200198 Lewisham Housing Tenure 200799
Only 40% of Lewisham’s households stated they were owner occupied, lower than the London average of 56%, and well below the national average of 68%. Just over 30% of households rent social housing with 7.5% of households renting from a housing association compared to 22.7% from the Council. Two-thirds of social housing tenants are in receipt of Housing Benefit100. In London 17.1% rent from the Council and 9.1% from a housing association101. The Lewisham SHMA suggested that because of Lewisham’s growing population and the fact that households are decreasing in size this has led to a demand for smaller cheaper homes from households and private investors have responded. The Lewisham SHMA (2008) reported that nearly one in every six households (15.5%) had moved within the last 12 months and a further 11.2% in the last two years, which indicates a high level of turnover in Lewisham’s housing market. This could be linked to the number of private rented households where 36.4% of tenants have lived at their current address for less than a year.
97 Source: South East London Strategic Housing Market Assessment 2009 98 Source: Census 2001 99 Source: Lewisham Strategic Housing Market Assessment 2008 100 Source: Census 2001 101 Source: Census 2001

93
Figure 59 - Lewisham Housing Stock 102
Detached1.7% (1,900)
Semi‐detached10.2% (11,050)
Terraced33.8% (36,600)
Purpose built flat28.2% (32,750)
Converted dwelling26.1% (28,200)
Lewisham’s SHMA indicated that a total of 20.2% of households across Lewisham reported that there was at least one serious problem with their property. The most common problems are damp penetration or condensation, window repairs and a lack of fixed heating. Currently 55% of Lewisham’s council housing stock is non-decent. Over 83% of all householders in Lewisham were satisfied with their current property, with 11% expressing dissatisfaction with their property103. Figure 60 - Satisfaction with Current Home by Tenure104 The analysis from Lewisham’s Strategic Housing Market Assessment indicated that 38% of respondents to the survey reported that they wanted to move, with the remaining 62% being content to remain in their current property. The main reason for wanting to move was because households wanted a larger home. Of those wanting to move, over 50% expected to stay within Lewisham. Around 60% of the people who left an existing household stayed within Lewisham. It was also the case that around 50% moved to rented accommodation.
102 Source: Lewisham Strategic Housing Market Assessment 2008 103 Source: Lewisham Strategic Housing Market Assessment 2008 104 Source: Lewisham Strategic Housing Market Assessment 2008
Detached and semi-detached properties comprise around 12% of the stock, terraced housing comprises around a third of the total with flats accounting for the remaining 55%. Nearly half of all flats are formed from a converted dwelling, rather than being purpose built. Over two-thirds of the housing stock of Lewisham was built before 1945.
0% 10% 20% 30% 40% 50% 60% 70% 80% 90% 100%
Lewisham
Owner Occupied
Social Rent
Private Rent
Very satisfied Fairly satsified Neither Fairly d iss atisfied Very dissatisfied

94
Lewisham’s Strategic Housing Market Assessment (2008) indicated that a total of 10.2% of all households across Lewisham live in overcrowded conditions. However, only around 3% of households in owner occupied accommodation were overcrowded compared to 12% of in social housing and nearly 18% in the private rented sector. As at 1st April 2009 there are 2232 overcrowded households on the housing register of which 1773 are severely overcrowded (taken from Lewisham’s Housing Register Data) As at 1st April 2010, Lewisham had 17,483 households on the housing register and during 2009/10, the Council had only 1,447 homes to let via its Choice Based Lettings Scheme, Homesearch. This indicates the significant gap between the number of households in housing need and available supply. In August 2010 there were 1,066 households living in temporary accommodation, this is a reduction of 31% from the same month last year. (Lewisham’s Homelessness Data) Overall, according to Lewisham’s Strategic Housing Market Assessment (2008), a total of 33,922 households were assessed as living in unsuitable housing due to one or more factors105. There were big differences between the proportion of households in unsuitable housing based on their current tenure – with only 14.0% of owner occupiers being unsuitably housed, compared to 40.9% of those who rent privately and 41.2% of households renting from a social landlord. Looking at household characteristics, 43.9% of lone parent households, 32.2% of adult couples with children and 72.6% of groups of adults with dependent children are living in unsuitable housing. Figure 61 - Established Households Living in Unsuitable Housing106
By discounting the households whose needs do not require alternative housing provision in Lewisham, only 10,684 (31.4%) of the identified 33,922 unsuitably housed households remain.
105 Source: Lewisham’s Strategic Housing Market Assessment 106 Source: Lewisham Strategic Housing Market Assessment 2008

95
House Prices and Rents The graph below shows the average house prices and sales volume in Lewisham over the past ten years107. House prices increased steadily from 2002 to 2006, then steeply until the spring of 2008 followed by a dip due to the economic downturn. Figure 62
House prices in Lewisham are now increasing again from a July 2009 average of £239,000 to the latest figure of £272,000 for January 2012. This relates to an average London house price of around £351,000. Sales volumes are still very low compared to the period from 2002 to 2008. Figure 63 illustrates the relative house prices across Greater London in 2008, when prices were are their highest.108
107 Source: Land Registry 108 Source: Land Registry, January 2008 to December 2008

96
Figure 63
In 2000, the price of an average property in Greater London was around 8.0 times the average earnings of someone working in the area with the lowest quartile property cost about 5.5 times the lowest quartile earnings. By 2007 the relationship between the averages had risen to around 11.0 times earnings with lowest quartile prices being over 9.0 times earnings109. Compared to the rest of London, it is considered one of the more affordable boroughs to live in. Between 2001 and 2007 property prices in Lewisham rose by 100%. The average price of a property in Lewisham (2007) was approximately 70% of the London average110. However, the average (full time) Lewisham salary of £28,620111, with a lack of mortgage products and high deposits required, home ownership is difficult to attain. This figure compares to an average salary of £31,127112 for those living in Greater London (see average earnings chart below). Lewisham’s SHMA indicates that 19% of households have an income of over £40,000 and 48% of households have an annual income of less than £15,000. This indicates that low-income families are reliant on social housing and affordable private rented housing to meet their housing needs. Figure 64
109 Annual Survey of Hours and Earnings and HM Land Registry. Date? 110 Source: Lewisham SHMA 2008 111 GLA London Data 2009 112 Ibid

97
Lewisham Rental Market – March 2010113 Lower
Quartile Median Upper
Quartile Mean Count
Studio £526 £600.00 £696 £696 111 1 bed £675 £750 £826 £826 381 2 bed £850 £900 £1050 £1050 441 3 bed £1050 £1200 £1357 £1357 198 4 bed £1300 £1552 £2009 £2009 98 The data shows that the average monthly rent for a 2 bedroom property in Lewisham was £1050. With average full time salaries in Lewisham at £28,650 affordability of larger bed units becomes prohibitively expensive once one gets beyond 2 bed properties. This in turn makes it increasingly difficult for families on low incomes to rent suitable housing in Lewisham and often leads to overcrowding. Figure 65 Bed size Average Annual
Rent Average Gross Yearly Salary
%of income spent on rent (rounded)
Studio 8,352 28,650 29 1 9,912 28,650 35 2 12,600 28,650 44 3 16,284 28,650 57 4+ 24,108 28,650 84
New housing supply Prior to the General Election of 2010, Lewisham agreed a target of 429 affordable homes per year as a Local Area Agreement target. The Mayor of London has set a more challenging target of 533 units per annum.114 The annual average and the overall new housing completion rate in Lewisham nearly met that required by the London Plan allocations, with a total of 4,646 dwellings completed against a target of 4,665.
113 Source: South East London Housing Market Bulletin covering quarter January to March 2010. The information on prices has been taken from the website Findaproperty.com. 114 Following the General Election of 2010, the Coalition Government abolished the national performance management framework, Local Area Agreements, regional housing targets and Regional Development Strategies (Regional Development Strategies will be formally abolished when the Localism Bill becomes an Act of Parliament). In its place the Government has introduced a New Homes Bonus whereby local areas will receive financial incentives if they choose to build more homes.

98
Figure 66 - Actual housing completions 2004/05 to 2008/09115
The Council expects housing delivery to be below target for the next three monitoring years. However, it is expected that a strong supply of new housing will come on stream from 2011/12 onwards. The key reasons for this are that: • The recession and ‘credit crunch’ has slowed the number of planning applications
received and therefore permissions granted for housing in the last year • Through the Core Strategy and the Site Allocations Development Plan
Documents the Council will provide an up-to-date supply of development sites for housing (the DPDs are scheduled for approval from 2011 onwards)
• Estate renewal and development by Registered Social Landlords (RSLs) will continue with large schemes currently being built or planned for the Kender, Excalibur, Silwood and Heathside and Lethbridge estates
• The approval of a number of schemes pre 2007/08 are expected to be completed • A number of large schemes, including the Strategic Site Allocations, which are
currently in the pre-application phase, are expected to come forward within the next three to seven years.
Figure 67 - Projected housing completions 2009/10 to 2025/26116
115 Source: LBL Planning Service 2009 116 Source: LBL Planning Service 2009

99
The new housing supply will be delivered across the borough and Figure 68 below demonstrates the key areas. Figure 68 Housing Quantity
(number of new homes – all tenures)
Lewisham town centre
3,400
Catford town centre
1,950
Deptford New Cross (DNX)
2,050
DNX Mixed Use Employment Locations
7,400
South of the borough
750
Existing commitments elsewhere in the borough (current planning applications)
2,100
Future commitments elsewhere in the borough (analysis of past trends)
4,000
(Source: Lewisham Draft Core Strategy) Lewisham’s Strategic Housing Market Assessment modelling results show there is a five-year net housing requirement of 6,777 additional homes across all tenures. Affordable Housing From 2004 until 2008 when the economic downturn slowed development progress, Lewisham had seen an average net increase of around 800 homes of which 44% was affordable housing. The Mayor’s draft London Plan will abolish the previous Mayor’s 50 per cent affordable housing planning target. Instead, it adopts a new regional planning target for an average net supply of at least 13,200 new affordable homes each year in London, taking into account economic viability and the likely availability of public sector investment. Lewisham as part of its Housing Strategy has retained the aim to deliver 50% affordable housing on each new development. To ensure a mixed tenure and promote mixed and balanced communities, the affordable housing component is to be provided as 70% social rented and 30% intermediate housing. Conclusion Compared with elsewhere in London Lewisham is an affordable borough in which to live as average house prices are below the London average. Amongst all Lewisham householders, satisfaction is high, the area is seen as a good place to live and there is easy travel to a large travel to work area. The forecast for new home construction in the borough is significant and will help Lewisham build on its role as a good place to live for work across London. However, of council owned social housing stock more than half is ‘non-decent’ and one in ten households are overcrowded. In addition current demand for social housing outstrips supply. Lewisham is however addressing this issue and has
100
committed to build new homes. Further challenges do however remain. These include the forecasted increase in number of Lewisham households and the projected increase in London’s population (both of which could place new pressures on housing supply). Housing SWOT Analysis Strength
• Over 83% of all householders in Lewisham were satisfied with their current property;
• Affordability of Lewisham as a place to live
• Accessible to large number of jobs in accessible work search area
Weaknesses
• 55% of council owned housing stock is ‘non-decent’
• 10.2% of all households in Lewisham are overcrowded
• Gap between the number of households in housing need and available supply.
Opportunities • The main reason for wanting to move
was because households wanted a larger home. Of those wanting to move, over 50% expected to stay within Lewisham.
• Lewisham has agreed a target of 429 affordable homes per year as a Local Area Agreement target
Threats • Increasing London and Lewisham
population • Forecast projection for the number of
Lewisham houses set to increase • Increased demand in more single person
household units • High turnover in Lewisham’s housing
market • Difficulty moving into owner occupied
accommodation • 9% dip in Lewisham house prices
following recession • Given average earnings in Lewisham
affordability of larger bed units (over 2 bed)becomes prohibitively expensive
• The economic climate has slowed housing delivery, it is expected to be below target for the next three years

101
3.4 Lewisham’s economic competitiveness An area’s economic competitiveness measures how successful its people and businesses are able to be, given their environment. Many factors discussed earlier are conducive to competitiveness; efficient markets for skills, property, housing and transport services, and enterprise, as measured by the numbers of businesses or self-employed people. Other factors, such as research and development, are also important, but tend to be conducted on a regional or national level. A local area that does well on measures such as these is likely to be competitive; but evidence of competitiveness appears in outcomes such as GVA per head, productivity per hour worked, employment rates and wage rates, and growth in the number of people and businesses in an area – indicating its attractiveness as a place to live and to do business. The UK Competitiveness Index117 is a weighted index of variables conducive to or reflective of competitiveness. Lewisham ranks 87th out of 380 UK local authority districts, close in the rankings to its neighbours, Croydon and Bromley, and outside London to places like Swindon, Brighton and Solihull. Amongst London boroughs, however, Lewisham does relatively less well, ranking 21st among the 32. The UKCI is a starting point for analysis, though it incorporates only measures for which statistics are easily available on a consistent basis. Amongst the component measures, Lewisham performs very well on the inter-related variables of productivity, pay per head and the number of graduates; but poorly on GVA, reflecting the fact that there are relatively few jobs and workplaces within Lewisham’s boundaries, and on labour market statistics such as the employment rate and numbers claiming Job Seeker’s Allowance. Synthesising the UKCI findings with the material already presented in this Assessment, the following are the critical factors bearing on Lewisham’s competitiveness: • Lewisham is an integral part of the wider London economy: most workers
commute out to jobs elsewhere, and the inflow of workers to the borough is much smaller than the outflow.
• This means that success for Lewisham is as about equipping local people to take employment outside the borough and ensuring that transport links are maximised as well as promoting employment within the borough.
• Lewisham is a good place to live, even though there is much deprivation and poor quality housing. It offers affordable (in the government sense) and inexpensive housing, as well as high quality residential areas and quality green space. Its attractiveness is reflected in the rapid pace of housing development – up to 1,500 new homes a year - anticipated by developers.
• Like other boroughs, Lewisham’s boundaries are to some extent artificial. In particular Thames-side from Surrey Quays to Greenwich Park is a burgeoning centre for the arts, business, retailing and education. Many of its attractions are (just) outside Lewisham, but the core of the area, Goldsmiths, and important development sites are within the borough.
• Lewisham has excellent rail links to central London and to the Croydon employment area and southwards, and good road links (by London standards) to the M25 and the wider motorway network. These, and the housing position just
117 All details can be accessed free of charge via http://www.cforic.org/pages/ukci2010.php

102
summarised, are powerful attractors for firms and individuals wanting a London location without excessively high factor costs.
• Lewisham is entrepreneurial. Although, because of the out-commuter effect, the borough has relatively few firms, their number is expanding and the self-employment rate is high
• Lewisham is strong in education, healthcare and public administration. Their short term prospects may be uncertain and there may be a degree of privatisation, but the activities themselves are in secular expansion and offer both entry level and professional jobs for local people
Many residents face deprivation, especially in the north, within the Thames-side opportunity area, and the south of Lewisham, but in pockets throughout the borough. Economic expansion in Lewisham, and the reduction of deprivation, means building on the competitive advantages summarised above. Deprivation is in part about the health and other social challenges summarised in this Assessment, but employment deprivation is especially important. Unemployment in London is high, and higher still in Lewisham, particularly for women. And although inactivity (ie worklessness amongst people who are neither in work nor unemployed) is not especially high, the proportion of inactive people who say that they want to work is much higher in Lewisham than the London average. Almost one person in seven of working age (some 25,000 Lewisham residents) is either unemployed or inactive but wanting work. People’s attitudes to work are strongly influenced by rationality. If a person has few skills (and so can command only a low wage), fears losing benefits if a job doesn’t ‘work out’, and faces a long and expensive journey to work, he or she will have little incentive to take work even if it is available. Change for the better means improving skills118, selling hard to people the ways in which they can escape from the benefits poverty trap, and ensuring that local jobs are available in entry level positions where long commutes are not worthwhile – whilst recognising that improving skills at somewhat higher levels will raise out-commuting still further. Economic expansion in Lewisham is desirable in itself, and doubly desirable if it also serves to lessen deprivation. With that in mind, the LEA analysis suggests the following themes for expansion: • Promoting the development of the Thames-side area for business, artistic,
retailing, and high quality housing use, whilst being pragmatic about whether developments are within or just outside the borough
• Reinforcing the employment base in administration, healthcare and education (regardless of ‘sector’, public or private) focused on the geographical centre of the borough
• Encouraging through the planning process the rapid development of housing and business space in the borough; and, potentially, securing a further acceleration through new methods of using public sector assets to under-pin development
• Building on success by encouraging a pooling of resources to promote enterprise, especially given the imminent demise of Business Link and the reductions to the Borough’s own resources devoted to this area.
• Promoting adult skills as far as practicable, concentrating on people with few qualifications or who need, for instance, ESOL help or help with the validation of
118 The skills position in Lewisham is generally good – better than the London average – but people facing deprivation are not in this favourable position and these comments relate to that substantial minority of Lewisham residents.

103
overseas qualifications. Encouraging links in skills and training provision across neighbouring boroughs recognising that it may be convenient for people to learn in institutions located in other local authority areas. Although the funding environment is unfavourable, this is central to tackling deprivation
• Maximising use of the DWP Work Programme to demonstrate the ‘gains to work’ potentially available to people on working age benefits.
Lewisham’s Economic Competitiveness : SWOT Analysis Strengths
• Good public transport communication • Location to the City, Central London and
Canary Wharf • Employment in growing sectors • Well qualified residents
• Strong HE and FE institutions
Weaknesses
• High unemployment and growing • High dependence on low value sectors
and public sector • High levels of out-commuting • Small business base and little growth
Opportunities
• Major new developments – North Lewisham and Lewisham Gateway
• New Transport – East London Line
Extension
• Developing strong partnership with HE and FE institutions
• Promoting adult skills
• Supporting micro businesses and SMEs
Threats
• Lack of investment to bring forward development
• Low value sectors = low opportunities = low growth
• Increase in unemployment • Public sector cuts
• Lack of investment in education and support for employment , skills, enterprise and business development

104
Appendix 1: National Government context The most significant documents from the coalition government’s policy agenda in relation to employment, enterprise and opportunity are: Universal Credits White Paper This White Paper was published in November 2010 and sets out the Coalition Government’s plans to introduce legislation to radically simplify the welfare system by merging the existing 30 or more work-related benefits into a single universal payment. Get Britain Working: Welfare To Work Reforms The key reform is the introduction of the Work Programme, a single integrated package of support providing personalised help for everyone who finds themselves out of work, based on need rather than benefit claimed. Delivery will be contracted out, with providers given longer to work with clients, and more flexibility on how they deliver support. Providers will be incentivised to work with those furthest from the job market. Localism Bill The Localism Bill was introduced in December 2010 and is intended to shift power from central government back into the hands of individuals, communities and councils. Key packages include non-domestic rates, changes to social housing policies and devolving powers to the Mayor of London and London Boroughs. Skills For Sustainable Growth Strategy The Skills for Sustainable Growth strategy sets out the Government’s vision for reform of the further education and skills system in order to improve the skills of the workforce, the performance of the economy and engagement in learning. It includes expanding the numbers of adult apprenticeships available, with £605 million being invested in the 2011-12 financial year. Local Growth White Paper The Local Growth White Paper published in October 2010 sets out the Government’s role in empowering locally driven growth, encouraging business investment and promoting economic development. As part of the White Paper it was announced that:
• Twenty-seven Local Enterprise Partnerships (LEPs) proposals have been approved, which will see local businesses and civic leaders working together to drive sustainable economic growth and create new jobs in their communities.
• The £1.4bn Regional Growth Fund (RGF) will be introduced to support the creation of private sector jobs.
• Proposals for local authorities to be able to retain a proportion of the local business rates as an incentive to support business growth.
• A proposal for a Tax Increment Finance (TIF) scheme which will enable Local Authorities to retain business rate uplift generated from development to kick start investment and development.

105
Appendix 2: The voluntary and community sector The size of the sector There are 613 voluntary and community sector (VCS) organisations in Lewisham. The average number across all London boroughs is 826, placing Lewisham 16th out of the 32 boroughs by size of the sector119. It should be noted that the definitions for voluntary and community sector organisations vary and that some sources estimate that the numbers of VCS organisations in Lewisham to be higher. Nonetheless, the methodology used to inform this review is consistent across London, and in the national survey of charities and social enterprises, so comparisons between boroughs remain relatively reliable. Among five London boroughs from Lambeth to Bexley, Lewisham’s voluntary and community sector is the third largest (see Figure 1). Figure 1: Number of voluntary and community sector organisations - a five borough comparison
0
200
400
600
800
1000
1200
Sou
thw
ark
Lam
beth
Lew
isha
m
Gre
enw
ich
Bex
ley
119 Review of Third Sector in Lewisham and Across All London Boroughs September 2010, GuideStar Data Services

106
Of these 613 organisations, 40% are registered charities only, 17% are registered charities and companies limited by guarantee (CLGs), 38% are CLG only, 4% are industrial and provident societies(IPSs), and 1% are community interest companies (CICs) see Figure 2. 42% are classed as social enterprises; this is above the London borough average of 35% (see Figure 3). Social Enterprise include IPSs, CICs and ClGs. Figure 2: Profile of voluntary and community sector organisations – London Plan Central Boroughs
0
10
20
30
40
50
60
70
Sout
hwar
k
Lam
beth
Lewi
sham
Gre
enw
ich
Bexle
y
Registered Charities only
Registered Charity also withCLG registration
Company Limited by Guaranteeonly CLG
Community Interest Community
Industrial Provident Societies
Figure 3: Proportion of Social Enterprise compared across all London Boroughs120
22% of Lewisham’s registered charities are categorised as education/training charities, which is also the average percentage for London in this category. Indeed,
120 GuideStar Data Services 2010

107
the percentage of charities by category in Lewisham closely follows the pattern for London as a whole (see Fig. 4). Figure. 4: Lewisham’s charities by category code121
D101 General Charitable Purpose D108 Religious activities D102 Education/Training D109 Arts/culture D103 Medical/Health/Sickness D110 Sport/recreation D104 Disability D111 Animals D105 Relief of Poverty D112 Environment/conservation/heritage D106 Overseas aid/Famine relief D113 Economic/community development/employment D107 Accommodation/Housing D114 Other charitable purposes
Registered charities in Lewisham (including CLG’s) employ 5063 people, ranking the borough 21st out of the London boroughs by number of staff employed122, and 4th out of the 5 London Central Boroughs (LCBs). 1187 full time equivalent (FTE) staff work for registered charities in Lewisham. This ranks the borough 19th in London, and 4th amongst the LCBs.
A 5 borough comparison
No. of FTE staff
Lambeth 9745 Southwark 8445 Greenwich 1714 Lewisham 1187 Bexley 1117
The last National Place Survey indicated that 18.3% of people in Lewisham give unpaid help at least once a month123. The Communities and Local Government Citizenship Survey found that in England as a whole 26 percent of people
121 GuideStar Data Services 2010 122 Excludes City of London 123 National Place Survey

108
0
1000
2000
3000
4000
5000
6000
7000
8000
Sou
thw
ark
Lam
beth
Lewi
sham
Gre
enw
ich
Bex
ley
Num
ber T
rust
ees
participated in formal volunteering once a month and 35 per cent of people participated in informal volunteering124. Early figures from a local survey carried out by volunteer centre Lewisham, which combined all forms of formal and informal volunteering, as well as other regular unpaid work suggests that 36% of people in Lewisham may regularly volunteer125. Lewisham has 3367 trustees, which is the third highest among the London Central boroughs, representing 2% of all London charity trustees (see Fig 5). Figure 5: Number of trustees – a five borough comparison
124 DCLG Citizenship Survey (2008/09) 125 Lewisham Volunteering Impact Assessment/Volunteering Strategy (forthcoming)

109
The total income for all VCS organisations in Lewisham (including CLGs, CICs and IPSs) is £171m (see Fig 6), ranking it 3rd out of the LCBs, bringing in just 0.6% of the £22.4bn total third sector income in London (see Fig 7). Figure 6: Total income for all voluntary and community sector organisations (£m) – a 5 borough comparison
£0
£200
£400£600
£800
£1,000
£1,200
£1,400£1,600
£1,800
£2,000
Sout
hwar
k
Lam
beth
Lewi
sham
Gre
enw
ich
Bex
ley
Tota
l Inc
ome
£m
Figure 7: Total income for all voluntary and community sector organisations (£m) – by TGLP borough126
The total assets from all VCS organisations in Lewisham amount to £228m. Registered charities account for £224m of these assets, which is 0.4% of the £55.6bn charitable assets in London. This ranks Lewisham 5th among the London Central boroughs (see Figure 8).
126 Guidestar Data Services 2010

110
Figure 8: Total assets for all VCS organisations – a 5 borough comparison127
0
500
1000
1500
2000
2500
3000
3500
4000
Southwark Lambeth Lewisham Greenwich Bexley
Valu
e of
Ass
ets
£m
According to the latest available accounts of each charity, Lewisham registered charities received £24m in grants, ranking it 4th among the London Central boroughs (see Fig. 9). Lewisham charities made £3m of grants, ranking the borough 7th among the TGLP (see Fig. 10). Figure. 9: Grant received by registered charities (£m) - a 5 borough comparison128
050
100150200250300350400450500
Southwark Lambeth Lewisham Greenwich Bexley
Tota
l Gra
nts
Rec
eive
d £m
Figure 10: Grants made (£m) – charities only - a 5 borough comparison
129
0
50
100
150
200
250
Lambeth Southwark Lewisham Greenwich Bexley
Tota
l Gra
nts
mad
e £m
127 Guidestar Data Services 2010 128 Guidestar Data Services 2010 129 Guidestar Data Services 2010

111
The maturity and influence of the sector The voluntary and community sector in Lewisham is relatively young compared to the rest of the London Boroughs: 29% of Lewisham’s charities were registered within the last 5 years, the eight highest percentage across all London boroughs, and 22% were registered between 5 and 10 years ago, the joint fourth highest percentage across London. This characteristic is less significant when viewed within the context of the TGLP boroughs, however. Among these ten boroughs, Lewisham has the fifth largest percentage of charities registered within the last five years. Half of the ten London boroughs with the highest proportion of charities registered between five and ten years ago are part of the TGLP. Figure 11: Age profile of registered charities in Lewisham130
29%
22%
29%
7%
7%
6%
0-5 years5-10 years10-20 years20-30 years30-40 years40- 50 years
130 Guidestar Data Services 2010

112
What the voluntary and community sector thinks The 2010 national survey of charities and social enterprises (NSCSE)131, which analysed responses from 274 organisations in the borough, found that almost a quarter of organisations in Lewisham (23%) operate at a neighbourhood level. A quarter of organisations in total operate either regionally (10%) or nationally (15%), and 12% operate internationally. The survey found that there has been not significant change in this area since the original 2008 national survey of third sector organisations (NSTSO). Lewisham ranked top in London and fourth in the country by the sector for providing an environment for a thinking third sector in 2008. Respondents to the 2010 NSCSE felt they had sufficient resources in the areas of trustees and management committees (69%), volunteers (52%), management and leaderships staff (54%) and advice and support (48%). Areas of insufficient resources were financial reserves (48%), space to operate (32%) and paid staff (26%). This remains largely unchanged from the 2008 survey. 85% of organisations felt they had been successful in achieving their main objectives. However, the survey found a statistically significant decrease in the rate of organisations that felt confident of achieving their objectives over the following year, a drop of 9% to 76% in 2010 from 85% in 2008. The overall satisfaction rate with support for VCS organisations at a local level was 32%, with a slight decrease in organisations who were dissatisfied with support at a local level from a quarter (25%) to a fifth (20%) of respondents. The number of organisations that indicated they were ‘very satisfied’ doubled from 3% to 7%. The three highest satisfaction rates were for access to advice and support (34%), access to training (32%) as well as a significant increase in the number of organisations that indicated they were well supported to work with other charities, social enterprises and/or voluntary organisations to deliver local services (from 19% in 2008 to 27% in 2010). The three areas most in need of improvement were: support to enable organisations to maintain sufficient financial reserves (22%), funding/bidding for contracts (21% were dissatisfied), office space (17%- though this decreased from 24% in 2008). 14 VCS respondents to the Lewisham Business Survey in July 2010132 stated that financial viability, and securing future funding, was the main challenge and top business issue facing their organisation. Premises and recruitment were two commonly identified second priorities. 27% of Lewisham respondents to the NSCSE 2010 identified the delivery of public services (social housing, health care, day centres, counselling, community safety) as their main activity, which is a significant increase compared to the 2008 survey (16% identified delivery of services as their main role in 2008). There was a significant decrease in the number of organisations providing advice to individuals as their main role, which halved from 21% to 10%. The number of organisations helping people access services or benefits also halved from 11% to 4%.
131 National Survey of Charities and Social Enterprises, 2010, Cabinet Office 132 Lewisham Business Survey, July 2010

113
31% of responding organisations who received income from a statutory body received this in the form of grants from the Council. 10% received income from council contracts. There was a significant increase in the number of organisations who were satisfied with local statutory grant funding/contract bidding arrangements from 10% in 2008 to 20% in 2010. The number of organisations dissatisfied with these arrangements fell slightly from 28% to 23%, which does not represent a statistically significant change given the sample size. Summary • Whilst Lewisham ranks 16th by size of sector across all London Boroughs, it is in the
middle when compared to other boroughs in the London Central Sub-region. • Lewisham has a relatively young sector (ranking 2nd out of 32 for the proportion of
charities registered between 10-20 years ago. Half (51%) registering in the last 10 years.
• Lewisham’s VCS has the third highest proportion of Companies Limited by
Guarantee of all London Boroughs voluntary and community sectors, Lewisham ranks 7th in terms of proportion of Community Interest Companies and 5th in terms of proportion of Industrial and Provident Societies, suggesting that Lewisham leads the way in a shift away from traditional to new approaches operating in its VC sector.
• Lewisham’s voluntary and community sector make is fairly typical of London
Boroughs and is dominated by education, training and religious charities. • Lewisham’s registered charities ranks 21st out of 32 employing 5063 paid staff, and
19th out of 32 in London in terms of number of FTE’s (1187). • Lewisham’s VCS ranks 24th with its level of income (£1,653m), 24th with the value of
its assets (£228m) and 22nd with the value of grants received by charities. • Whilst Lewisham’s voluntary and community sector ranks low across all London
Boroughs, it ranks middle compared to the London Central Boroughs, doing less well than Lambeth and Southwark but better than Greenwich and Bexley.
Conclusion The voluntary and community sector in Lewisham has traditionally been seen as an important factor in the borough’s economy. However it is a sector with a number of risks to its future survival with public sector cuts and the reduction in grants. The sector has the potential to respond to the opportunities presented by the localism act and may well further contribute to the economic growth in the borough

114
Note on Data Sources All data is compiled from filed accounts either from Companies House or the Charity Commission and relies on the accurate reporting of each organisation. As there are different reporting obligation according to the size of organisation, some may not report on all variables therefore caution should be used when interpreting the figures. All voluntary and community sector organisations includes: registered charities, companies limited by guarantee, community interest companies and Industrial and Provident societies. The borough comparison used is the London Central Boroughs Sub-Region taken From the London Plan. This sub-region is referred to as one of the London groupings for the London Enterprise Partnership still in draft at the time of writing. The sources used for this report are the Data is taken from a specially commissioned report produced by GuideStar Data Services, 2010133 and the National Survey Of Third Sector Organisations commissioned by the Cabinet Office, 2008134 , as well as the National Survey of Charities and Social Enterprises update in 2010, and the Lewisham Business Survey in 2010.
133 London Enterprise Partnership Draft Proposal to Government, November 2010, GLA 134 National Survey of Third Sector Organisations, December 2008, Cabinet Office

115
Voluntary and community sector SWOT Analysis Strength
• The sector is young • The sector is highly incorporated with
relevant frameworks for commissioning and less reliance on grant funding
• High proportion of social enterprise • The sector in the National Third Sector
survey 2008 felt they were successful at what they do
Weaknesses
• The sector lacks capital and revenue investment
• Research in the sector suggests
uncertainty about organisations confidence in meeting their main objectives
• The sector is young and would benefit
from support • Reliance on public sector commissioning
and tendering opportunities and the impact of the cuts
• Council is the main commissioner with
other public sector partners playing a smaller commissioning role
• Commissioning to achieve economies of
scale reduces opportunities for Lewisham the sector
Opportunities
• Localism legislation potentially provides opportunities for business, assets and finance
• Commissioning approaches to include
clauses to include local voluntary and community sector as part of supply chain
• New approach to business support to
provide more specialist support to the sector.
Threats
• The sector is young • Impact of increased localism • Public sector cuts • Commissioning to achieve economies
of scale

116
Appendix 3 Local Procurement London • The Mayor of London recognises the value and importance of support which can
open up supply chain opportunities for Small and Medium Sized Enterprises (SMEs) in London.
• The London Economic Development Strategy states that ‘Major Businesses are working with the Mayor and the LDA to provide greater support to SMEs’. An example of this work is the ‘opening up of opportunities for SMEs through ‘CompeteFor’, which enables SMEs to compete for contracts for the 2012 Olympic and Paralympics Games and other substantial projects’. (paragraphs 2.18 and 2.19).
• The government sets out in the white paper ‘The Path to strong, sustainable and balanced growth’, (Department for Business Innovation and Skills, November 2010) how it will provide the conditions for growth which will create private sector jobs. This will involve focusing on government activities to provide conditions for private sector growth. This includes support to help SMEs access public sector contracts. The government has signalled an aspiration that 25% of new government contracts should be awarded to SMEs135. It is proposed that steps are taken to reduce the barriers faced by small businesses in competing for public sector contracts and to make it easier for SMEs to find opportunities to do business with the public sector.
Lewisham • The public sector represents over a third of the local economy. There are
opportunities to strengthen local public sector supply chains to help sustain and grow local SMEs.
• The proximity of Lewisham to the City, Canary Wharf and the Olympic and Paralympic Games means that there are opportunities to strengthen supply chains between local SMEs and large businesses in these business districts.
• Local procurement support has resulted in significant benefits for local businesses. The Council’s Local Labour and Business Scheme and Business Advisory Service has in 2009/2010 helped 179 local small businesses, access 98 contracts worth £3.28 million.
• However it has proved difficult to engage with local buyers136 and to change buyer behaviour across both the public and private sector. Austerity measures are exacerbating these difficulties as public and private sector procurement becomes increasing preoccupied with reducing costs.
• Only 17.3% of Lewisham Council’s expenditure is with local SMEs. Research undertaken by the Council's Economic Development Services in 2010 indicates potential to increase opportunities for local SMEs and to reduce the gap between the local spend and the government’s target of 25% for public sector expenditure with SMEs.
135 Helping small firms start, grow and prosper, Department of Business Innovation and Skills January 2011. 136 An evaluation undertaken of the work of the East London Business Place Project showed that local procurement support across the Thames Gateway hadn’t engaged effectively with buyers in South East London.

117
• Local SMES lack the knowledge, skills and capacity to compete for many opportunities to work with large organisations in the public and private sector.
Opportunities for local procurement The Lewisham Economy is dominated by a large public sector which represents approximately a third of the local economy. The public sector is made up predominantly of a few large public sector organisations such as the Council and Lewisham Hospital. There are also a large number of SMEs, community organisations and social enterprises which deliver goods and services to the public sector. . There are a high number of businesses which provide services to the business services sector across London. These include a wide range of companies including printers, security firms, cleaning firms, office suppliers, and catering companies. There is evidence137 that these businesses are struggling to hold on to work as markets contract. Some businesses report of long term supply chain opportunities disappearing overnight. Others report of being squeezed out of traditional markets by new competitors. Austerity measures in the public sector will make it more difficult for the large number of local SMEs which deliver goods and services to the public sector. Public sector buyers will focus on value for money and large scale contracts which will restrict opportunities for SMEs. Lewisham Council's commitment to local procurement Local Government does recognise that local companies can provide social and economic benefits and that these benefits should be included as part of the ‘best value’ assessment of tenders. As the Council increasingly becomes an enabler of change and a purchaser rather than provider of services, the importance of good procurement increases. The council is taking a number of steps to help create a market for its services which local businesses can get increased benefit from. This includes:
• A Local Labour and Business Scheme which brokers SMEs to opportunities with the Councils main contractors, subcontractors and partners.
• Actively promoting opportunities to local businesses via the Council`s Business Advisory Service (BAS).
• a Supplier Development Officer at BAS supporting local SMEs to be ‘fit to supply’.
• Implementing supply chain management processes which can generate opportunities for local SMEs. For example to split up work packages into smaller lots to make it easier for local SMEs to compete for tenders.
• Developing and maintaining where appropriate lists of “accredited suppliers”. • Creating the conditions in which new contractors, suppliers and service
providers can enter the market, by encouraging diversity and innovation.
137 Lewisham Business Survey 2010

118
Despite these efforts it has proved difficult to significantly influence the practice of buyers to ‘buy local’ and to widen and strengthen local public sector supply chains. Only 17.3% of local authority expenditure in the area is with local SMEs. There is potential to increase this percentage and to move closer to the Council and other statutory public sector providers achieving the government’s target (of 25% for public sector expenditure with SMEs). This is indicated by the fact that over £21M of Lewisham Council's expenditure is on transactions less than £40,000 (ie transactions which represent potential opportunities for local SMEs). The barriers faced by SMEs Many local SMEs lack information on locals supply chain opportunities. SMEs can miss out on potential supply chain opportunities for a number of reasons. These include:
• SMEs lacking experience and confidence in the procurement process • not knowing how to either access or respond to tender opportunities. • Limited resources make it difficult to identify expertise needed.
Buyers are also often unaware of both of the benefits of contracting with smaller local companies and the economic benefits of local procurement. The Government has recognised that SMEs are also often more effective at bringing innovation to public services138 The impact of local procurement support Initiatives such as the Lewisham Local Labour and Business Scheme have been successful in developed the skills of SMEs in the borough so that they are ‘fit to supply’. The scheme has improved SMEs access to information on business opportunities and in assisting these businesses to access new opportunities particularly in relation to the council’s partners and contractors. In the past year the scheme has helped 179 local small businesses, access 98 contracts worth £3.28 million. Lewisham has been a partner in the East London Business Place Project (ELBP) since 2008. This project built upon the successful local procurement work undertaken by the Canary wharf Group. The project aimed to ensure that SMEs across the inner London Thames Gateway benefited from the investment and opportunities created by the Olympic and Paralympic Games and the wider regeneration of the Thames Gateway. The table overleaf includes key findings of the evaluation of the impact of local procurement work undertaken by the ELBP project in the Thames Gateway139.
138 The Glover Report (2008) Accelerating the SME Economic Engine and The Richard Report (2008)‘Small Business and Government ‘ both identify the huge potential for the public sector to stimulate SME innovation by acting as the ‘first customer’ for new products and services . 139 Impact Evaluation of ELBP, Regeneris, April 2010.

119
• Around 28% of business beneficiaries reported an increase in turnover since
receiving support from ELBP. • Around 50% of these businesses attributed 90‐100% impact on turnover
directly to support received from ELBP. • 28% of those businesses reporting a profit said that this was in no way
attributable to ELBP. • Around a fifth of business beneficiaries reported an increase in business
employment levels since receiving support from ELBP. Again around half (48%) of these businesses attributed 90‐100% this impact on employment directly to support received from ELBP.
• 24% said that this impact was in no way related to the support provided by ELBP.
• Around a quarter of business beneficiaries reported an increase in business profit levels since receiving support from ELBP.
• 58% of these businesses attributed 90‐ 100% of this impact on profit directly to support received from ELBP.
• 15% of these businesses suggested that their increase in profits was in no way as a result of ELBP activities.
Conclusion There is scope to increase opportunities for Lewisham businesses to work with the public sector by adapting public sector procurement practices so that they are more accessible to local SMEs. Lewisham businesses are also well positioned to exploit opportunities to work with large private sector businesses in Central London and Canary Wharf. Local SMEs need support to develop their skills and capacity to compete for opportunities. There are new opportunities to support social enterprises with the opening up of markets for social enterprises to deliver public sector services.

120
Local Procurement SWOT Analysis Strength
• Local Labour and Business Support and the Business Advisory Service
• Lewisham is in an excellent location for
businesses to benefit from supply chain opportunities from the largest concentration of business in the UK
• Large construction sector
Weaknesses
• Local Businesses lack the knowledge, skills and capacity to compete
• Private sector contraction
Opportunities
• Large local public sector • Opportunity to work through the LSP • Olympic and Paralympic Games and
Thames Gateway • Opportunities for the social enterprises
created through Localism.
Threats
• Austerity measures in the public sector reduce opportunities for local SME
. • Recession results in lack of investment
and reduction in opportunities. • Competition from businesses outside of
Lewisham • Buyers refuse to engage or support local
procurement

121
Appendix 4: The Domain headlines In addition to the IMD overall score and rank, each Local Authority is ranked against seven domains and two supplementary indices. Although relative to other local authorities Lewisham is deemed as more deprived, deprivation has not increased in all domains. Relative levels of deprivation have increased in the domains of Health, Barriers to Housing, Crime and Disorder and Income Deprivation affecting Older People. Deprivation levels within individual domains and indices vary greatly.
• Income domain: Lewisham was ranked as the 31st (28th in 2007) most deprived, placing the borough within the 10% most deprived with respect to this measure. 12.0% of Lewisham’s LSOAs are in the 10% most deprived and income deprivation is a particular problem in Bellingham, Downham and Evelyn, although Blackheath, Forest Hill, Lewisham Central, Sydenham, Telegraph Hill and Whitefoot also had at least one LSOA which was classified within the 10% most deprived.
• Employment domain: Lewisham was ranked the 35th most deprived local authority, which was an improvement from 2007 when it was ranked 31st with respect to employment. Only three LSOAs were in the 10% most deprived, they were located in Bellingham, Lewisham Central and Rushey Green. Evelyn is also experiencing notable employment deprivation.
• Health and disability domain: Deprivation related to health and disability has, relative to other areas of the country increased since 2007. Previously only three LSOAs in the borough were in the worst 10% in this domain. However this has now risen to six, with a concentration in Lewisham Central and Rushey Green. Pockets of deprivation in this domain also exist in Downham and Whitefoot.
• Education domain: Deprivation related to education is less of a concern in Lewisham than in England as a whole. Downham saw the greatest levels of deprivation in this domain with seven of its ten LSOAs classified within the 20% most deprived nationally. Bellingham and Whitefoot wards also had pockets of this kind of deprivation. The average age in these wards is older than the population of the borough.
• Barriers to housing and services domain: Deprivation related to barriers to housing and services remains widespread across the borough, with areas within every Lewisham ward being in the 20% most deprived. 19.9% of Lewisham’s LSOAs are in the 10% most deprived (12.7% in 2007) and deprivation is a particular problem in Evelyn and New Cross, although 11 other wards also host pockets of severe deprivation, with 89.2% of all LSOAs being in the 20% most deprived for this domain.

122
• Crime and disorder domain: Crime deprivation is also widespread across the borough and Lewisham is more deprived than in 2007. 60.2% of Lewisham’s LSOAs are in the 20% most deprived. Notably, Lewisham performs poorly in the lowest 10% nationally too, as 24.1% of Lewisham’s LSOAs are in this percentile. Crime deprivation is a particular problem in Blackheath, Brockley and Downham.
• Living environment domain: Deprivation of this kind is generally high across Lewisham. 107 of Lewisham’s LSOAs are in the bottom 20%, however this a decrease from 2007 (when it was 125). Five wards (Brockley, Lewisham Central, Perry Vale and Rushey Green) have all of their LSOA’s in the bottom 20% and a further four wards have at least 75% of their LSOA’s in the bottom 20%.
• Income deprivation affecting children index: Deprivation is seen for this domain across the majority of the borough. Bellingham, Downham and Evelyn are the most deprived wards but numerous other wards also experience high levels of deprivation.
• Income deprivation affecting older people index: Deprivation is also widespread across the borough. 43.4% of Lewisham’s LSOAs are in the bottom 20%. Bellingham, Evelyn, and New Cross are the most deprived wards.

123
Appendix 5: Lewisham’s low carbon economy London Targets for reducing carbon emissions Lewisham Council is working towards delivery of the London target of a 40% reduction in carbon emissions by 2020. This target is based on a baseline of 1990 bringing the timeframe for the borough’s carbon target in line with national and regional targets. Local authority level data is not available prior to 2005. However it is common practice to extrapolate from the national dataset which does exist back to 1990 and assume that changes at the national level equate to Lewisham. A Lewisham target of a 40% reduction in carbon emissions by 2020 would therefore be as follows: Year CO2 tonnes %
reduction Notes
1990 1,391,000 Extrapolated from 2005 data for a 15.4% reduction 1990-2005140
2005 1,177,000 15.4% DECC data
2009 995,000 28.5% DECC data (latest year for which data is available)
2020 835,000 40.0% CO2 level to achieve 40% target
Per capita carbon emissions in the local authority area In September 2011 the Department of Energy and Climate Change published new figures for CO2 emissions for UK local authorities141. The figures cover 2005-9 and are based on domestic, commercial, industrial, agricultural fuel and electricity consumption, emissions from transport (excluding aviation and shipping) and land use changes. The figures are calculated from actual consumption data and statistics from the Department for Transport on road traffic. Lewisham’s carbon emissions have decreased by 15% over the period for which DECC data is available compared to a London average of 10%. Using UK average carbon figures for 1990-2005, Lewisham’s carbon footprint has fallen by 28.5% since 1990. Lewisham’s emissions are predominantly from the domestic sector, with DECC’s 2009 figures showing that they account for half the borough’s emissions compared to 36% for London. Road transport accounts for 26% and industry and commerce 24% of Lewisham’s remaining emissions, compared to 20% and 44% elsewhere in London.
140 http://www.decc.gov.uk/assets/decc/statistics/climate_change/1_20100325084241_e_@@_ghgnationalstatsrelease.pdf 141 http://www.decc.gov.uk/en/content/cms/statistics/indicators/ni186/ni186.aspx

124
Total CO2 emissions 2009 (tonnes)142
Total Emissions
0 200 400 600 800 1000 1200 1400 1600
Bexley
Southwark
Greenwich
Lewisham
Greater London Average
Bor
ough
s
Tonnes
Scope of the low carbon economy The low carbon economy has been categorised143 as comprising renewable energy technologies and ‘emerging low carbon activities’. In Lewisham these emerging low carbon activities may include businesses providing goods and services designed to reduce emissions from transport and construction; energy management for the domestic and business sectors; information technology; finance; research and development; and environmental consultancy. The number and location of these ‘low carbon’ businesses within Lewisham is not known, although London and the South East accounts for 32% of the UK’s £100bn value attributed to low carbon and environmental goods and services.144 BERR analysis145 predicts that despite the current international and national economic climate the environmental economy will grow by 45% creating 400,000 jobs over the next 8 years, with renewable energy and emerging low carbon activities the main driver for this.
142 Total CO2 emissions 2009 data (Source DECC 2011) 143 Low Carbon and Environmental Goods and Services: an industry analysis BERR 2009 144 Low Carbon and Environmental Goods and Services: an industry analysis BERR 2009 145 Low Carbon and Environmental Goods and Services: an industry analysis BERR 2009

125
Stimulating the local carbon economy Lewisham Council promotes environmental awareness and action across local businesses in a range of ways including: • Advice and engagement with local businesses on sustainable business practices • Promotion of good practice including an Environmental Award within Lewisham’s
Business Awards for businesses • A Business Environmental Excellence Scheme, which offers free advice and
recognises good practice through bronze, silver and gold awards. • Work with local businesses to implement voluntary workplace travel plans to ease
parking and congestion in commercial areas and promoting walking and cycling. Low carbon: Planning and development aspects Lewisham’s new core strategy promotes low carbon and energy efficient development. The following hierarchy is used to assess applications: • using less energy, in particular by adopting sustainable design and construction
measures • supplying energy efficiently, in particular by prioritising decentralised energy
generation, and; • using renewable energy. Low carbon and public sector procurement The Council and its partners are large purchasers of goods, services and commodities, which have their own impact on climate change. The Council, UHL and Lewisham Homes have made a commitment146 to ‘green procurement’, recognising that it is vitally important to mitigate climate change. The Council’s procurement strategy also emphasises the broader issues of resource efficiency and minimisation of waste, and encompasses the production of greenhouse gases. The Council’s Green Procurement Guide147 promotes and encourages innovative improvement in environmental performance, through the development of environmental criteria in the award of contracts. In 2008/09 Lewisham Council undertook a carbon footprint measurement of its supply chain covering 532 suppliers spanning 77% of the council’s supply chain. The results calculated the carbon footprint of the Council’s supply chain at over 2.5 times the Council’s direct emissions. Conclusions Lewisham’s directly elected Mayor, Sir Steve Bullock, has identified the reduction of carbon emissions as a priority for the borough. The Council’s approach is intended to
146 Lewisham Council’s Environmentally Responsible Procurement Strategy (2008); University Hospital Lewisham’s Sustainability and Carbon Reduction Strategy (2010); Lewisham Homes’ Sustainability Strategy (2010). 147 Lewisham Council’s Environmentally Responsible Procurement Strategy (2008);

126
respond to this, and has drawn in funding from the public and private sectors for a range of projects to cut emissions and engage with residents. This work creates opportunities for stimulating the low carbon economy locally and for providing training and employment opportunities. The Council also aims to combine the environmental agenda with a social purpose; targeting resources on the most vulnerable residents and working with public sector and community partners to help the elderly, people with long-term health issues and those on low incomes. The emerging low carbon economy in London and the south east represents a significant opportunity in relation to employment. However, knowledge of the extent of these businesses in the borough is limited, particularly those operating at a national and international level.

127
Low Carbon Economy SWOT Analysis Strength
• The reduction of carbon emissions is a Lewisham Mayoral priority;
• Some good local data is available on the
carbon footprint of the councils supply chain – this represents a strong platform upon which to develop our local intelligence;
• Well established focus locally on tackling
climate change and fuel poverty by engaging with residents (reflecting the percentage of carbon emissions from the domestic sector).
Weaknesses
• Some difficulties is reliably and accurately measuring fuel poverty
• Knowledge of the extent of low carbon
economy businesses in the borough is limited, particularly those operating at a national and international level.
Opportunities
• Stimulating the low carbon economy locally and providing training and employment through a range of externally funded projects to cut emissions and engage with residents
• Projected rise in environmental economy by 45%
• The emerging low carbon economy in London and the south east represents a significant opportunity in relation to employment.
• Domestic sector represents over 50% of the borough’s emissions.
• The marketability of Lewisham’s status as a low carbon borough.
Threats
• There is currently no activity specifically designed to target low carbon economy businesses or attract them into the borough.

128
Appendix 6: Lewisham’s Natural Environment Lewisham’s portfolio of natural and historic assets Lewisham has a varied portfolio of parks and other green spaces from those with strong historical links, such as Beckenham Place Park and Blackheath, to those that have been created through community campaigning, such as the Sue Godfrey Local Nature Reserve. • Open space in Lewisham, in public and private ownership, makes up almost 20% of
the Borough’s land area (726ha) of which 415 ha is classified Public Open Space Over a fifth of the borough is parkland or open space148.
• The council has 21 nature conservation areas directly under ecological management. • The Borough has three sites, listed as Grade 2 importance, included on the English
Heritage Register of Historic Parks, Gardens and Landscapes: Horniman Gardens, Manor House Gardens and Grove Park Cemetery.
• Lewisham’s rivers include a short section of the Thames, Deptford Creek, and longer stretches of the Ravensbourne and its tributaries the Pool, Quaggy and Spring Brook.
• The rivers also provide the setting for Lewisham’s historical past, which can be observed through Deptford's early 19th-century industrial buildings, the preserved residential buildings in St Mary’s Conservation Area located to the south of Lewisham Town Centre and Beckenham Place Park. The River Thames itself is London's largest archaeological site.
Satisfaction and performance data • Lewisham’s parks have been awarded 11 Green Flags which is amongst the highest
in London, and 2 of the boroughs nature reserves have received Community Green Flag Awards Pennant Awards149.
• The Council has also supported the creation of many of the borough 73 community food growing projects 150
• 84% of residents surveys are very satisfied or satisfied that their local park or open space was clean and cared for151
• When asked how frequently people used parks and open spaces in Lewisham 91% had visited on a weekly basis during the summer months falling to 71% in the winter152
• Whilst Lewisham is a relatively green borough, approximately one fifth is still deemed to be deficient in public open space. The wards most affected are New Cross, Evelyn, Telegraph Hill, Brockley, Catford South, Perry Vale, Whitefoot and Grove Park153.
148 Source: Lewisham Leisure and Open Space Study 2009. To compare Lewisham’s parkland and open space is difficult given that this is information is not consistently published, and measures vary depending on the inclusion of privately owned green space. 149 Source: 2009/10 Annual Report 150 Source: Capital Growth project website February 2012 151 Source: Lewisham Parks and Open Spaces Survey June 2011 152 Source: Lewisham Parks and Open Spaces Survey June 2011 153 Source: Lewisham Core Strategy 2010

129
• Due to finite land and development pressures within the borough, the opportunities to create additional open space are limited. Therefore the focus is likely to rest on protecting and improving existing open space.154
Open Space in Lewisham155
Use of parks and open spaces • Parks provide an opportunity for outdoor exercise including a number of organised
fitness programmes such as; organised walks, military fitness and nature’s gym (which combine conservation activity and keeping fit).
154 Source: Lewisham Core Strategy 2010 155 Source: Lewisham Core Strategy 2010

130
• There are currently 24 parks user groups to actively involve the local community in the daily life of the park or open space and to provide support to the parks contactor in the day-to-day management of the park.
• Five of Lewisham’s parks and open spaces host farmers’ markets in which locally grown produce is sold. As well as food produce, local areas and crafts are also sold.
• Other events such as the Blackheath fireworks and Lewisham People’s Day make use of Lewisham’s open space.
Regeneration and Development • The borough hosts part of the South East London Green Chain Walk. This is a
network of inter-linked open spaces that extend through Lewisham and the neighbouring boroughs of Bexley, Greenwich and Bromley.
• The Green Chain is an integral section of the All London Green Grid (ALGG) which links green spaces across London. The ALGG has looked to promote internal linkages to encourage movement between business and retail areas. For example, Route one of the North Lewisham Links has included the re-landscaping in Margaret McMillan Park and Fordham Park making the route from Deptford High Street to New Cross more open and accessible which has encouraged the flow of people walking between the two areas and markets. It has also had a positive impact on the adjacent Albany Theatre, from which you can now see the train line, with the ambition to make it feel more connected.
• The ALGG has a network of recreational walking and cycle routes and it forms part of the 'Capital Ring', a strategic walking route linking inner London boroughs by a network of paths through open spaces, green links, canals and rivers.
• The SEL Green Chain walk within Lewisham has been extended linking parks on the western side of the borough (Sydenham Wells Park, Horniman Gardens and Telegraph Hill Park), linking to Crystal Palace Park in the London Borough of Bromley156.
• There have been recent improvements to nine of Lewisham’s parks and playgrounds, funded from the Play Builder project, utilising natural materials157.
• The Council has been successful in securing £2 million Parklands funding to regenerate the central and southern fields at Ladywell. This project will look to make improvements to local biodiversity and open up additional sections of the river Ravensbourne.
• The Parklands project has also funded improvements and signage along the Waterlink Way, a strategic linear walking and cycle route through the spine of the borough (from Lower Sydenham to Deptford Creek -following mainly the river Ravensborne). Other green travel routes include the Thames Path National Trail, Route 21 and the London Cycle Network. 158
• Further improvements have been made to parks in the north of the borough including major relandscaping of the upper and lower Pepys Parks, green spaces on the Pepys estate and Fordham Park.
Resilience to environmental shocks
156 Source: Lewisham Core Strategy 2010 157 Source: Lewisham Core Strategy 2010 158 Source: Lewisham Core Strategy 2010

131
• At least one-fifth of all residential and non-residential properties in the borough are at some risk of flooding from these sources159. While the Thames poses a potential risk of flooding to properties within this area of river frontage, properties are currently protected from flooding by the River Thames Tidal Defences up to the 1 in 1,000 year event.
• Investment has also been made into flood defences to reduce the risk of flooding, particularly within Lewisham Town Centre. However, fluvial flooding still remains a threat to property within the borough160.
• Additional steps taken to reduce the risk of flooding and to ameliorate the effects of climate change including the installation of Garden roofs on buildings in Lewisham such as the Horniman Museum, Shaws Cottage, Creekside Centre and Laban Dance Centre161.
Conclusion Lewisham has been widely recognised for its work on environmental management. Resident participation is key to the Council’s approach and satisfaction with parks and open spaces is high. By accessing funding to invest in local regeneration, the Council has demonstrated a commitment to further enhance Lewisham’s reputation as a liveable borough. However, the council does face challenges. There are areas of the borough that do not have adequate access to green and open space and there little scope to change this. There is also a risk of flooding although it is considered minimal.
159 Source: Strategic Flood Risk Assessment (SFRA) 2008 160 Strategic Flood Risk Assessment (SFRA) 2008 161 Source: Lewisham Biodiversity Partnership, ‘A natural renaissance for Lewisham’ (2006-2011)

132
Natural Environment SWOT Analysis Strength
• Over a fifth of the borough is parkland or open space.
• Lewisham is amongst the highest in London for the number of Green Flag awards (11 in total)
• The borough has a number of river fronts, conservation areas and historic parks
• Resident satisfaction with parks and open spaces is above the London average
• Community participation evidenced by the various park user and improvement groups.
Weaknesses
• There are areas of green and open space deficiency with little scope to create additional open space
Opportunities
• Lewisham’s green and open space provides an opportunity to further utilise it’s open space to promote local producers and artists, exercise opportunities and community events.
• The All London Green Grid promotes
internal and external borough linkages which will streamline routes to local business sites and amenities. This has the potential to attract local residents and businesses
• Funding secured for regeneration projects to improve parkland. Park facilities and green corridors
Threats
• Whilst satisfaction with parks and open spaces is still high budget reductions may have a negative impact on future satisfaction levels.
• There is a possible threat of flooding due to the level of river frontage in the borough, however, appropriate steps have been taken to identify and minimise these risks where possible

133
Appendix 7: LEA Glossary
• AAP - Area Action Plan • BAS – Business Advisory Service • BME – Black and Minority Ethnic • CLG – Communities and Local Government Department • CLGs – Companies Registered by Guarantee • CEL – Community Education Lewisham • CILs – Community Interest Companies • CRPL - Catford Regeneration Partnership Ltd • DECC – Department of Energy and Climate Change • DLR – Docklands Light Railway • ELBP – East London Business Place Project • ESOL – English for Speakers of Other Languages • EU – European Union • FE – Further Education • FTE – Full time Equivalent • GLA – Greater London Authority • GVA – Gross Value Added • GNVQ – General National Vocational Qualification • HA – Housing Association • HE – Higher Education • IB – Incapacity Benefit • IDEA – Improvement and Development Agency • IMD – Index of Multiple Deprivation • IPSs – Industrial and Provident Societies • JLE – Jubilee Line Extension • JSA – Job Seekers Allowance • JSP – Job Centre Plus • LDA – London Development Agency • LDF – Local Development Framework • LEA – Local Economic Assessment • LEP – Local Economic Partnership • LSOA – Lower Super Output Area • LSP – Local Strategic Partnership • NEET – Not in employment, education or training • NI – National Insurance • NSTSO – National Survey of Third Sector Organisations • NVQ – National Vocational Qualification • PAS – Planning Advisory Service • RGF – Regional Growth Fund • ONS – Office for National Statistics • SHMA - Strategic Housing Market Assessment • SMEs – Small and Medium Enterprises • TfL – Transport for London • TGLP – Thames Gateway • TIF – Tax Increment Finance