long-term changes in biological characteristics and ...€¦ · figure 2 opalescent squid landings...
TRANSCRIPT

LONG-TERM CHANGES IN BIOLOGICAL CHARACTERISTICS AND FISHERY
OF LOLIGO OPALESCENS
A Thesis
Presented to
The Faculty of Moss Landing Marine Laboratories
and the Department of Marine Science
San Jose State University
In Partial Fulfillment
of the Requirements for the Degree
Master of Science
by
Briana C. Brady
May 2008

© 2008
Briana C. Brady
ALL RIGHTS RESERVED

APPROVED FOR THE DEPARTMENT OF MARINE SCIENCE
______________________________________________________ Dr. Gregor M. Cailliet
______________________________________________________ Dr. James T. Harvey
______________________________________________________ Dr. Richard M. Starr
APPROVED FOR THE UNIVERSITY
______________________________________________________

ABSTRACT
LONG-TERM CHANGES IN BIOLOGICAL CHARACTERISTICS AND FISHERY
OF LOLIGO OPALESCENS
by Briana C. Brady
Opalescent squid, Loligo opalescens, captured from central and southern
California fisheries were examined for long-term changes in size, sex ratio, and
fecundity. Samples were collected in Monterey from 1948 to 2006 and in the Channel
Islands and Catalina Island from 1999 to 2007. A significant (P<0.0001) decline in
opalescent squid size and fecundity occurred in Monterey. The trend in monthly mean
sizes was similar among locations. Monthly mean sizes were negatively correlated with
fishing pressure; when fishing pressure was strong, smaller individuals were captured the
following fishing season. Body size was also negatively correlated with hatch-month sea
surface temperature (SST). Negative correlations between anomalies for monthly mean
SST and sizes were found – individuals grew larger if a winter was anomalously cooler.
In addition, monthly mean upwelling and body sizes were positively correlated during the
juvenile stage. The ratio of males to females captured in the fishery fluctuated in all
areas.

v
DEDICATION
I would like to dedicate my master’s thesis to David VenTresca. David was my
first mentor in studying California’s marine ecosystems. He always gave aspiring marine
biologists first-hand opportunities to study the ocean. David passed away in November.
He enjoyed life to the fullest, and will always be in my memories and prayers.
ACKNOWLEDGEMENTS
I would like to express sincere gratitude to my advisors. Throughout my thesis
work, Dr. Greg Cailliet and Dr. Rick Starr at Moss Landing Marine Laboratories
(MLML) gave me continuous support, encouragement, and invaluable suggestions. Their
scientific guidance enabled me to complete my work successfully. I am indebted to Mr.
Dale Sweetnam, my supervisor at the California Department of Fish and Game (CDFG),
for providing funding and input for this project and, to Dr. Jim Harvey (MLML
committee member) for his statistical input throughout this study.
I am grateful for the collaborative effort made by CDFG, the California
opalescent squid industry, and local scientists and researchers from various institutions
that made this work possible. I wish to express my appreciation for the feedback I
received from the ichthyology students at MLML and the University of California at
Santa Barbara (UCSB). I am thankful for the willingness of Dr. Bob Warner and Dr.
Jenn Caselle, from UCSB, to allow discussion of this project at their student lab
meetings. I am thankful to Ms. Gina Smith and Mr. Jared Kibele (CDFG GIS Analysts)
for producing maps of California, and to Mr. Bob Leos (CDFG Research Analyst), Dr.

vi
Joe Wible (Hopkins Marine Station (HMS) librarian), and the University of Victoria
library staff for providing historical data, and to Mr. Andrew Rassweiler (UCSB PhD
Candidate) who offered statistical input. Dr. Lou Zeidberg (HMS postdoctoral fellow),
Ms. Jan Mason (Pacific Fishery Environmental Laboratory (PFEL) fisheries biologist),
Dr. Emmanis Dorval (Southwest Fisheries Science Center (SWFSC) fisheries biologist),
Dr. John Butler (SWFSC fisheries biologist), Dr. Frank Schwing (PFEL director and
oceanographer), Mr. John Geibel (CDFG statistician), and Dr. Eric Hochberg (Santa
Barbara Museum of Natural History Invertebrate Zoologist) all provided much needed
review of this document.
I am as ever especially indebted to my mother, Ms. Anne Marie Brady, for her
love and support throughout my life. I also wish to thank my family and husband’s
family for their support and understanding during my study. Moreover, my sincere
thanks go to my cousin, Miss Alison Haupt, a graduate student at HMS, and to Alison’s
family for hosting a celebratory thesis bar-b-q in my honor. Finally, I wish to express my
love and appreciation to my husband, Dr. Scott Hamilton a research biologist at UCSB,
who helped to guide me in this journey and who continued to rejoice in life’s experiences
with me as I made my way through the process of completing a master’s thesis.

vii
TABLE OF CONTENTS
List of Tables ................................................................................................................... viii List of Figures ..................................................................................................................... x Introduction......................................................................................................................... 1
Opalescent Squid Fishery ............................................................................................... 5 Biology of the Opalescent Squid Fishery ....................................................................... 7 Environmental Variables .............................................................................................. 13 Changes in Biological Aspects of Opalescent Squid.................................................... 15
Methods............................................................................................................................. 16
Biological Datasets and Analyses................................................................................. 17 Fishing and Environmental Datasets and Analyses ...................................................... 23
Results............................................................................................................................... 26
Biological Data ............................................................................................................. 26 Fishery and Environmental Data .................................................................................. 41
Discussion......................................................................................................................... 59 Summary ........................................................................................................................... 74 References......................................................................................................................... 76

viii
LIST OF TABLES
Table 1 Origin of datasets, years for which data were available, location where data were collected, and variables reported Table 2 Number of opalescent squid sampled and minimum and maximum sizes for each study period in Monterey Table 3 Results for a one-way ANOVA in RS for mean DML and mass for the month of June in Monterey, 1948 to 2006 Table 4 Chi-square results for comparing opalescent squid sex ratios to 1:1 for Monterey, 1948 to 2006 Table 5 Pearson correlation coefficients of mean DML and mass by month between regions from 2000-01 to 2006-07 Table 6a-c Chi-square results for opalescent squid sex ratios compared to 1:1 for 3 regions Table 7a-b Pearson correlation coefficients for mean DML versus fishery and environmental variables by month for Monterey from 1948-49 to 2006-07 Table 8a-b Pearson correlation coefficients for mean DML versus fishery variables by month for Monterey from 2000-01 to 2006-07 and two southern California sites from 1999-00 to 2006-07 Table 9a-b Pearson correlation coefficients for mean DML versus SST by month for Monterey from 2000-01 to 2006-07 and two southern California sites from 1999-00 to 2006-07 Table 10a-b Pearson correlation coefficients for mean DML versus upwelling by month for Monterey from 2000-01 to 2006-07 and two southern California sites from 1999-00 to 2006-07 Table 11a-b Pearson correlation coefficients for mean mass versus SST by month for Monterey from 2000-01 to 2006-07 and two southern California sites from 1999-00 to 2006-07 Table 12a-b Pearson correlation coefficients for mean mass versus upwelling by month for Monterey from 2000-01 to 2006-07 and two southern California sites from 1999-00 to 2006-07

ix
Table 13 Pearson correlation coefficients for a measure of fecundity (standing stock of oocytes) versus total catch for Catalina Island from 1999-00 to 2002-03

x
LIST OF FIGURES
Figure 1 Statewide opalescent squid landings and strong El Niño events north and south of Point Conception for fishing seasons from 1927-28 to 2006-07 (data source CDFG landing receipts) Figure 2 Opalescent squid landings for Monterey area ports for purse and lampara nets for fishing seasons 1969-70 to 2006-07 (data source CDFG landing receipts) Figure 3 Location of 7 commercial fishing ports for sample collection Figure 4a DML, climate, sex ratio, and sample size for Monterey, 1948 to 2006 Figure 4b Opalescent squid mass from Monterey, 1948 to 2006 (data source See Table 1) Figure 5a-d Mean DML and mass with corresponding 95% CI pooled by month for each study period in Monterey, 1948 to 2006 (data source See Table 1) Figure 6a-d Mean DML and mass with corresponding 95% CI for June for Monterey, 1948 to 2006 (data source See Table 1) Figure 7a DML maximum for each sample month for Monterey, 1948 to 2006 Figure 7b Mass maximum for each sample month for Monterey, 1948 to 2006 (data source See Table 1) Figure 8a-b Mean proportion of maturity, DML, and mass with corresponding 95% CI by month with total catch (mt) for Monterey, 1989 to 1994 (data source See Table 1) Figure 9a-b The number of sample days and number of opalescent squid sampled per month for 3 regions from 1999-00 to 2006-07 (data source See Table 1) Figure 10a-d Mean DML and mass with corresponding 95% CI for 3 regions from 1999-00 to 2006-07 (data source See Table 1) Figure 11a-c Mean proportion of males with corresponding 95% CI by month for 3 regions from 1999-00 to 2006-07. The upper and lower solid lines depict the 95% CI for the entire period, and the middle solid line depicts the mean. The upper and lower dashed lines show the 95% CI for a daily sample size of 30 squid, and the middle dashed line signifies a sex ratio of 1:1. (data source See Table 1) Figure 12 Fraction of potential female fecundity released with corresponding 95% CI for 3 regions from 1999-00 to 2003-04 (data source See Table 1)
xi
Figure 13a-c Monterey area fishery data from 1950-51 to 2006-07 (data source, See Table 1) Figure 14a-c Regional fishery data from 1998-99 to 2006-07 (data source, See Table 1) Figure 15a-d Total catch summed for each month throughout each time period and overall mean DML by month (data source See Table 1) Figure 16a-l Monterey SST anomalies from the long-term annual mean from 1945 to 2006 (data source see Table 1) Figure 17a-l Monterey upwelling anomaly from 1945 to 2006 (data source see Table 1) Figure 18a-c Mean SST with corresponding 95% CI, SST anomaly, and upwelling by month for 3 regions from 1998-99 to 2006-07 (data source See Table 1) Figure 19a-d Pearson correlation for monthly mean DML and mass versus environmental variables for Monterey, 1948 to 2006; *P<0.05
INTRODUCTION
Approximately 120 fishing vessels have participated in California’s commercial
opalescent (market) squid (Loligo opalescens) fishery during the past decade; and
landings have averaged 70,000 metric tons (mt), making the fishery one of the state’s
most important by quantity and value (CDFG 2005). The Market Squid Fishery
Management Plan (MSFMP) indicates the harvest of this species is sustainable, although
opalescent squid abundance appears to fluctuate greatly as evidenced by fishery landing
receipts recorted in the California Department of Fish and Game’s (CDFG) Commercial
Fisheries Information System (Figure 1). Many aspects of the life history and population
biology of opalescent squid are greatly influenced by changes in sea surface temperature
(SST) from year to year (Starr et al. 1997, 2002; CDFG 2005; Keiper et al. 2005). In
occurrence with strong El Niño events, which create a warm-water, low-nutrient
environment, fishery landings may decline by greater than 90%, and will usually rebound
the following season (McInnis and Broenkow 1978; Ish et al. 2004; Reiss et al. 2004).
Fishery-dependent data from the Monterey area from 1989 to 1994 indicated that body
size and sex ratios differed from samples collected from the 1940s to the 1970s (Leos
1998). Variables that may be associated with the observed differences in the biological
characteristics of opalescent squid include changes in fishing gear, regulations, fishing
pressure, and environmental conditions.
Determining possible causes for changes in the life history characteristics of
opalescent squid is essential for successful fishery management. For this study, potential
factors influencing fluctuations in biological aspects of the opalescent squid fishery were

2
Figure 1 Statewide opalescent squid landings and strong El Niño events north and
south of Point Conception for fishing seasons from 1927-28 to 2006-07
(data source CDFG landing receipts)
examined through: 1) the analysis of long-term (1948 to 2006) changes in dorsal mantle
length (DML), mass, sex ratios, and fecundity using original data collected in Monterey
from Fields (1965), Evans (1976), Spratt (1979), Leos (1998), and CDFG’s most recent
sampling program (1999 to 2006); 2) the assessment of recent (1999 to 2007) changes in
DML, mass, sex ratios, and fecundity from CDFG sample data for central (Monterey) and
southern California (northern Channel Islands and Catalina Island); and, 3) the
correlation of long- and short-term biological fluctuations with patterns in fishery and
environmental variables.
Opalescent Squid Life History
The scientific name for opalescent squid in past research was Loligo opalescens,
although recent work based on morphology and molecular data suggests the name should
1929-30 1939-40 1949-50 1959-60 1969-70 1979-80 1989-90 1999-00
Met
ric to
ns x
1,0
00
0
50
100
150
North South
El Niño

3
be changed to Doryteuthis (Amerigo) opalescens (Anderson 2000; Vecchione et al.
2005). Opalescent squid inhabit the coastal, pelagic zone from southeast Alaska to Baja
California (Recksiek and Frey 1978). Hatching at a DML of less than 3 mm, they remain
within 1 km of the shore for approximately 1 month and then are widely distributed by
ocean currents (Zeidberg and Hamner 2002). There is a limited understanding of
opalescent squid distribution between birth and spawning (Cailliet and Vaughan 1983);
however, some observations of opalescent squid indicate they are common within the
upper 400 m of the water column (Hunt et al. 2000). Opalescent squid live to an age of
10 months (Butler et al. 2001), grow to an average DML of 152 mm (CDFG 2005), and
reproduce at the end of their lifespan (Macewicz et al. 2004) when they congregate to
spawn in nearshore areas. Prior to more recent work (Jackson 1994; Butler et al. 1999),
age estimates were as great as 4 years with an estimated average of 2 years (Fields 1965;
Spratt 1979).
Primary spawning grounds occur in shallow, sandy habitats in central and
southern California in less than 180 m, but eggs have been reported as far north as British
Columbia and as deep as 792 m (CDFG 2005). Multiple cohorts recruit to the spawning
grounds within a season and individuals die soon after spawning (semelparous). Near the
end of their lifespan, as reproduction takes place and eggs and spermatophores are
released, the mantle condition of females and males deteriorates, and their body mass
decreases. Females lose more mass than males, because as much as 50% of female body
mass can be attributed to gonad size (Fields 1965). A female of 134 mm in DML has the
potential to lay 4000 eggs (potential fecundity). Females may lay 20 egg cases and each

4
egg case, which is attached to the substrate or other egg masses, can contain up to 300
eggs. On average, females lay less than 40% of their potential fecundity or the number of
eggs present within the ovary and oviduct (Macewicz et al. 2004). Female opalescent
squid do have the ability, however, to release 78% of their potential fecundity. As egg
cases accumulate, up to 100 m2 of seafloor are covered by egg case clusters (Dickerson
and Leos 1992).
Eggs hatch in about 4 to 5 weeks at a surrounding water temperature of 12 °C
(Isaac et al. 2001). The SST and productivity during hatch-month affects growth rates
and the DML at which opalescent squid mature and recruit to the fishery (Jackson and
Domeier 2003; Reiss et al. 2004). According to Jackson and Domeier’s (2003) study,
female (r=0.72, P=0.002, n=15) and male (r=0.61, P=0.013, n=16) DMLs were
negatively correlated with the SST of the hatch-month. They also found that female
(r=0.65, P=0.008, n=15) and male (r=0.81, P<0.001, n=16) DMLs were positively
correlated with the hatch-month upwelling index (Jackson and Domeier 2003). The
DMLs of male opalescent squid aged during the 1997-98 El Niño and 1998-99 La Niña
events were not dependent on age, whereas female DMLs were found to be partially
correlated with age – so females were larger because of being older, not solely from
having faster growth rates.
At an age of about 1 month, juveniles enter the water column where they feed on
macrozooplankton and remain until they reach maturity. As adults, they prey upon
crustaceans, other squid, and coastal pelagic finfish such as sardines (Sardinops sagax
carulea), anchovies (Engraulis mordax), and mackerel (Scomber japonicus) (Fields

5
1965; Karpov and Cailliet 1979). They are prey items for marine mammals, seabirds,
coastal pelagic finfish, and other squid (Morejohn et al. 1978; Lowry and Carretta 1999;
Keiper et al. 2005).
Opalescent Squid Fishery
The commercial opalescent squid fishery began in 1863 in Monterey and
expanded to southern California where a substantial increase in landings occurred during
the 1960s (Vojkovich 1998). In both areas, fishing may occur year round; however, the
fishery usually spans from April through October in Monterey and from October through
March in southern California. Although the fishery may extend from San Francisco to
the Big Sur coast, the Monterey fishery is concentrated mainly off the Monterey
Peninsula. In southern California, fishing activity may be strong along the coast from Pt.
Conception to San Diego and out to the Channel Islands. Since the inception of the
fishery, opalescent squid have been used as food and bait abroad and within the U.S.
When the commercial fishery began in the mid 1860s, fishing occurred during the
night, and fishermen used a handheld torch to attract and aggregate opalescent squid at
the surface. The opalescent squid were then captured with a handheld net that was
deployed by two other boats (Fields 1965). A similar system is in use today; however,
fishing also may occur during the day. Current fishing practices use a light boat with up
to 30,000 watts and a purse or drum seine and tender vessel that wrap the opalescent
squid with a large net. The corralled opalescent squid are brought onboard with an
automated pumping system. Within the last decade, the average mesh size was 1 inch
(2.5 cm) (CDFG 2005). Another form of gear used in the current fishery is the hydraulic

6
brail (scoop) net, which is used onboard vessels that are usually smaller than purse
seiners. Because brail vessels are compact and more maneuverable, they are used in
shallower depths that are closer to shore and in areas where seiners are prohibited (e.g.,
Santa Monica Bay and the mainland side of Catalina Island).
In Monterey during the early 1900s, when the lampara net was first used to
capture opalescent squid, the average reported mesh size was 1.25 inches (3.2 cm) (Fields
1965). Average opalescent squid landings in the early 1900s in Monterey were about 100
mt a year and sometimes reached 5,500 mt (Scofield 1924). By the 1970s, about 6,000
mt were landed a year in Monterey. In the late 1980s, the lampara net was replaced by
the purse seine net in Monterey (Figure 2). From 1999 to 2007, the average catch was
8,000 mt in Monterey.
1969-70 1979-80 1989-90 1999-00
Met
ric to
ns x
1,0
00
0
5
10
15
PurseLampara
Figure 2 Opalescent squid landings for Monterey area ports for purse and lampara nets
for fishing seasons 1969-70 to 2006-07 (data source CDFG landing receipts)

7
In southern California, where brail nets were primarily used until the 1970s,
annual landings were sometimes as high as 6,000 mt. Once purse seine nets replaced the
majority of brail nets, landings in southern California typically surpassed those in
Monterey. Since 1999, landings in southern California have averaged 66,000 mt.
Opalescent squid fishing regulations have been minimal throughout the duration
of the fishery with most pertaining to area and time closures, gear restrictions, catch
amounts, and permits. Until 1959 in Monterey, the opalescent squid fishery was
permitted to use lights to attract opalescent squid to the surface. Using lights as an
attractant was restricted to prevent the harvest of opalescent squid directly from Monterey
fishing docks and to reduce the disruption of lights on spawning opalescent squid
(Dickerson and Leos 1992). The ban on lights was lifted in the Monterey area in the late
1980s, just as Leos (1998) began sampling opalescent squid. In 1984, to allow periods of
uninterrupted spawning, a weekend closure went into effect for the Monterey area, and
the closure was extended to southern California in 2000. Also, in 2000 light wattage was
restricted to 30,000 per vessel to reduce detrimental effects on nesting marine birds. A
harvest guideline (HG) of 113,398 mt (125,000 short tons (st)) was set in 2001 to avoid
overfishing. The HG was reduced to 107,048 mt (118,000 st) in 2005. To attain a
capacity goal in fleet size, the California Fish and Game Commission adopted a restricted
access permit program in 2005.
Biology of the Opalescent Squid Fishery
Due to the value of the opalescent squid resource, several fishery-dependent
studies have focused on collecting biological data from landings. Fields (1965) worked

8
with CDFG to collect fishery-dependent data concerning size, sex, and age information
from 1946 to 1962. CDFG continued to sponsor work in the 1970s when Moss Landing
Marine Laboratories (MLML), Spratt (CDFG, 1979), and Evans (MLML, 1976) analyzed
size, sex, and age data from fishery catches from 1972 to 1975 in Monterey using
methods similar to Fields (1965). Leos (1998) completed a similar sampling project from
1989 to 1994 for the same area in Monterey. In 1998, CDFG, with input from the
National Marine Fisheries Service (NFMS), established an ongoing sampling program
targeting the fishing ports near Monterey, Santa Barbara, and Los Angeles (Figure 3).
Fields (1965) documented aspects of the life history characteristics of opalescent
squid collected from the Monterey fishery from 1946 to 1962. During the course of
Fields’ (1965) sampling efforts, approximately 7,660 opalescent squid were collected
from random samples from fishing vessels and processing pumps. Fields (1965) found
that sex ratios were nearly equal, and females had a narrower size range than males at
spawning. Opalescent squid were estimated to live to 4 years, but this was based on an
analysis of size groups only and was never validated. The average DML of opalescent
squid collected during Fields’ (1965) study was 140 mm for females and 150 mm for
males with their respective average masses being 50 g and 70 g. Size of opalescent squid
during his study varied, however, from 1948 to 1962 (Figure 4a-b). Fields made the
point that the decline in size was not the effect of more animals of a certain size group but
an absence of larger opalescent squid. For instance, in 1948, 15% of males had DMLs
greater than 172 mm, whereas in 1950 less than 1% of DMLs of males were larger than
172 mm.

9
Figure 3 Location of 7 commercial fishing ports for sample collection
2. Monterey
1. Moss Landing
Point Conception
3. Santa Barbara
4. Ventura 5. Port Hueneme
6. San Pedro
7. Terminal Island
Northern Channel Islands
Catalina Island
CA
Area enlarged

10
Figure 4a DML, climate, sex ratio, and sample size for Monterey, 1948 to 2006
0.0 0.5 1.0 0 10 20 3050 75 100 125 150 175 200
Edges of box equal 25th and 75th percentiles Whiskers equal 10th and 90th percentiles Solid black line within box equals mean Outlying values Overall avg. DML
Study period avg. DML
Climate: ENW Weak El Niño ENM Moderate El Niño ENS Strong El Niño LNW Weak La Niña LNM Moderate La Niña LNS Strong La Niña PDO Pacific Decadal Oscillation Alt. Alternative
DML box plot by month:
•
Sex ratios: Avg. prop. of males +/- 95% Confidence
Interval Equal sex ratio Sample size: Num. sample days/mth
•
ENM
LNS
LNW
ENW
LNW
LNS
LNM
ENS
ENM
ENM
Cool PDO
Warm PDO
Alt. PDO
ENW
ENS
LNS
Fields (1965)
1948-57
Leos (1998)
1989-94
DFG 1999-06
Evans (1976) Spratt (1979)
1973-75
Climate Proportion Sample DML (mm) Period of Males Size

11
Figure 4b Opalescent squid mass from Monterey, 1948 to 2006
(data source See Table 1)
0 25 50 75 100 125 150
Overall avg. mass Study period avg. mass
•
Edges of box equal 25th and 75th percentiles Whiskers equal 10th and 90th percentiles Solid black line within box equals mean Outlying values
Mass box plot by month: Fields (1965)
1948-57
Leos (1998)
1989-94
DFG 1999-06
Evans (1976) Spratt (1979)
1973-75
Mass (g)

12
In the 1970s, Spratt (1979) counted statolith growth rings and found opalescent
squid lived up to 4 years, but this too was not validated. In his publication, mean DMLs
were not referred to – although some of the raw DML, mass, and sex ratio data were
available from his analysis (Spratt 1979). Evans (1976), however, did publish results for
mean opalescent squid size, but the results were for samples collected in only 1974.
Evans (1976) assessed opalescent squid samples from the Monterey and southern
California commercial fishery catches. For Monterey, DML and mass of commercially
caught opalescent squid were of comparable size to some of the values reported by Fields
(1965). Sex ratios were dominated by males in both geographic regions, whereas Fields
(1965) had reported equal sex ratios for Monterey. Opalescent squid in southern
California were longer in DML; however, Monterey opalescent squid had greater body
mass at length. Evans (1976) found there were greater numbers of immature opalescent
squid in southern California and opalescent squid matured at a smaller size in Monterey.
As Fields (1965) had discovered, female opalescent squid were less variable in size than
males.
Leos (1998) collected opalescent squid samples from the commercial fishery in
Monterey Bay in the late 1980s and early 1990s just after a regulatory measure for a
weekend closure was adopted. A greater proportion of spawned opalescent squid were
found in the catch on Mondays, the day following the weekend closure. The results from
Leos’ (1998) study indicated that the weekend closure gave opalescent squid the
opportunity to spawn without interruption, thereby allowing more eggs to be released by
females. Opalescent squid were not aged during the 1998 study. The results from a

13
Students T-Test indicated DML and mass were significantly (P < 0.001) smaller than the
sizes reported by Fields (1965). Sex ratios were equal in Monterey fishery landings. The
distribution of size for females was narrower than males. Leos (1998) also detected that
mean DMLs of opalescent squid were larger during the first month of the fishing season,
which typically coincided with the onset of upwelling – DMLs immediately decreased,
and then increased as the fishing season progressed. The majority (93.5%) of the
sampled opalescent squid were sexually mature.
In 1998, the beginning of the latest CDFG-sponsored sampling program, a group
of about 200 opalescent squid were collected for ageing purposes. These opalescent
squid were aged by counting statolith increments and were determined to be an average
of 6 months old, with some as old as 10 months (Butler et al. 1999, 2001). Since then,
daily growth increments were validated by growing opalescent squid from hatching to 52
days in a laboratory setting (Vidal et al. 2002), and have shown that opalescent squid
DML at capture can be linked to the regional SST of the hatch-month (i.e., 4 to 10
months prior to capture) (Jackson and Domeier 2003; Reiss et al. 2004). Additional
information collected in the CDFG sample program included gonad weight and mantle
condition, which can be used to calculate the standing stock of oocytes or fecundity
within a female opalescent squid at time of capture.
Environmental Variables
Opalescent squid spawning activity is associated with local and seasonal influxes
of nutrients from upwelling or winter mixing events (Zeidberg et al. 2006). In Monterey,
the upwelling season and the spawning activity of opalescent squid usually begin

14
between February and April. During these months, when winds from the northwest
become more common, nutrient-rich water from the ocean-bottom near the upwelling-
center off Point Año Nuevo is driven to the surface, and provides an abundant food
source for the zooplankton communities upon which newly hatched opalescent squid
prey. In southern California, opalescent squid spawning coincides with winter mixing of
surface waters and deeper-water upwelling, which usually happens from October to
March.
SST, nutrients, and surface water circulation in central and southern California
undergo long- and short-term cycles. Climatic regime shifts and El Niño Southern
Oscillation (ENSO) events are described by indices that reflect such oceanographic
changes over long- and short-time periods, respectively. The Pacific Decadal Oscillation
(PDO), an example of a regime shift, fluctuates between anomalously warm and cool
SST every 20 to 30 years (Hare and Mantua 2000; Mantua and Hare 2002). During cool
water phases, primary productivity increases and causes a bloom in phytoplankton that is
reflected through trophic cascades up the food chain from zooplankton to small coastal
pelagic finfish and invertebrates and onto larger organisms (Francis et al. 1998). The
ENSO is similar to the PDO but occurs on a much shorter time scale lasting from 6 to 18
months, and is called El Niño during warm water, low-nutrient phases and La Niña
during periods of cool water and high-nutrients (Parrish and Tegner 2001; Marinovic et
al. 2002). Warm water PDO or ENSO periods cause food availability for opalescent
squid to diminish greatly.

15
Changes in Biological Aspects of Opalescent Squid
Populations of many harvested marine organisms exhibit fluctuations in
biological aspects through time. Distinguishing the proportion of those variations caused
by direct impacts due to fishery exploitation, environmental factors, or biotic factors
(e.g., competition, predation) remains a challenge. Many researchers have focused on
changes in the abundance of fished species caused by oscillations in the environment and
fishing pressure (MacCall 1996; Hofmann and Powell 1998; Klyashtorin 1998; Beamish
et al. 1999; Moser et al. 2000, 2001; Steneck and Wilson 2001; Chavez et al. 2003;
Mason 2004). Others have correlated changes in life history traits of fished species, such
as body size, age, and reproductive potential, with oceanographic or fishery variables
(Trippel 1995; VenTresca et al. 1995; Law 2000).
Although the opalescent squid fishery often collapses during episodic El Niño
events, a fishable population has persisted throughout the duration of the warm water,
low-nutrient PDO cycle that began in 1977 (Jackson and Domeier 2003; Reiss et al.
2004). Recent El Niño and La Niña cycles are correlated with short-term changes in
opalescent squid abundance (Ish et al. 2004; Zeidberg et al. 2006), age, growth, timing of
maturity (Jackson and Domeier 2003; Reiss et al. 2004), and paralarval densities
(Zeidberg and Hamner 2002). Results of previous studies on opalescent squid indicate
age and growth are dependent on SST and food availability (Forsythe 2004), and body
size increases as SST decreases (Jackson and Domeier 2003; Reiss et al. 2004).
Fluctuations in SST and nutrient availability are not as extreme in different phases of
regime shifts compared with ENSO; however, past research has shown long-term

16
changes in the size and sex ratios of opalescent squid from the earlier phases of the
fishery (i.e., 1940s), through regime shifts and many ENSO events, to the present (Fields
1965; Evans 1976; Leos 1998).
These studies indicated that changes in the life history of opalescent squid may be
related to fishing pressure and environmental variables; however, the strength of a
relationship among these variables has yet to be determined. For this study, the following
hypotheses were addressed to evaluate changes in biological characteristics of opalescent
squid and to attempt to separate environmental effects from fishery induced. The results
of this study will provide information that is necessary for successful management of the
fishery. The hypotheses include:
1) DML, body mass, the proportion of females, and fecundity have declined in the
opalescent squid fishery through time, and these biological aspects were similar among
geographic locations; and
2) Observed biological changes, as identified in hypothesis 1, correspond to
patterns in fishery or environmental data: a) Size was negatively correlated with fishing
pressure from the previous fishing season; b) Size was negatively correlated with hatch-
month SST; and c) Size was positively correlated with hatch-month upwelling.
METHODS
Eight different, historic data sources (biological, fishery, and environmental
information) were used in the analyses (Table1). Data were presented temporally by
year, fishing season (from April 1 to March 31 of the following year), and month. For

17
Monterey, data were available from 1948 to 2006 and were compared by: 1) consecutive
months (i.e., January through December); and 2) by the same month for each fishing
season (e.g., June for each year). Data from 1999 to 2007 were compared on a monthly
basis for the Monterey area (only to 2006), the northern Channel Islands (Anacapa, Santa
Cruz, Santa Rosa, and San Miguel Islands), and Catalina Island. These 3 areas were
chosen because spawning in Monterey occurs during the opposite season of the southern
California sites, and spawning activity will sometimes occur only in the northern Channel
Islands or Catalina Island – although in some years spawning occurs at all locations
simultaneously.
Biological Datasets and Analyses
Fields (1965), Evans (1976), Spratt (1979), and Leos (1998) provided only
summarized biological information in their publications. The original data collected in
Monterey for each study period were found in various sources. A reference for Fields’
(1965) data was located online at the University of Victoria’s library web site. DML,
mass, and sex data were obtained from X, Y plots created by Fields (1965) – only data
for 1948 to 1957 were available. DML, mass, and sex data collected by Spratt (1979)
and Evans (1976) from 1972 to 1975 were found in archived CDFG files. Data from
1989 to 1994 were available from the original CDFG data sheets and contained DML,
mass, sex, and maturity records (Leos 1998). The most recent CDFG sampling project
spanned from 1998 to 2007 for 3 port complexes: 1) Monterey and Moss Landing; 2)
Santa Barbara, Ventura, and Port Hueneme; and 3) San Pedro and Terminal Island (see
Figure 3). Data from 1999 to 2007 were used in the analysis because data collected in
18
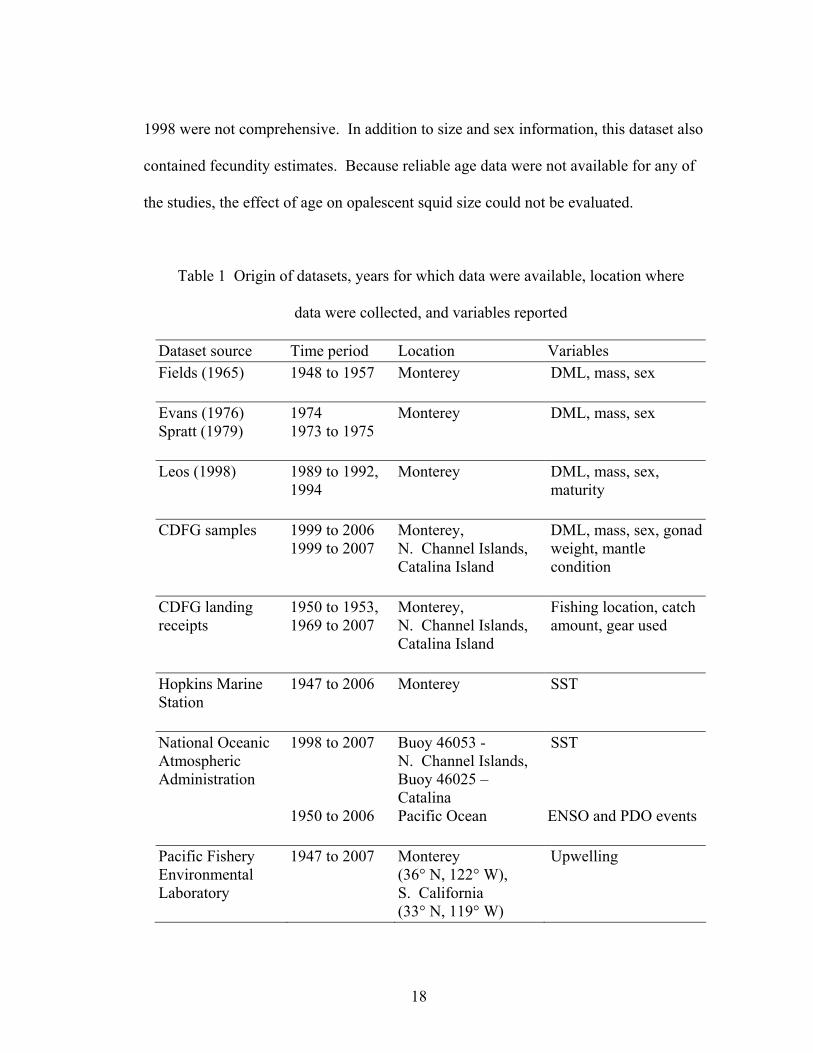
1998 were not comprehensive. In addition to size and sex information, this dataset also
contained fecundity estimates. Because reliable age data were not available for any of
the studies, the effect of age on opalescent squid size could not be evaluated.
Table 1 Origin of datasets, years for which data were available, location where
data were collected, and variables reported
Dataset source Time period Location Variables Fields (1965)
1948 to 1957 Monterey DML, mass, sex
Evans (1976) Spratt (1979)
1974 1973 to 1975
Monterey DML, mass, sex
Leos (1998) 1989 to 1992, 1994
Monterey DML, mass, sex, maturity
CDFG samples 1999 to 2006 1999 to 2007
Monterey, N. Channel Islands, Catalina Island
DML, mass, sex, gonad weight, mantle condition
CDFG landing receipts
1950 to 1953, 1969 to 2007
Monterey, N. Channel Islands, Catalina Island
Fishing location, catch amount, gear used
Hopkins Marine Station
1947 to 2006 Monterey SST
National Oceanic Atmospheric Administration
1998 to 2007 1950 to 2006
Buoy 46053 - N. Channel Islands, Buoy 46025 – Catalina Pacific Ocean
SST ENSO and PDO events
Pacific Fishery Environmental Laboratory
1947 to 2007 Monterey (36° N, 122° W), S. California (33° N, 119° W)
Upwelling

19
Biological data from the various time periods were collected with similar
methods. Samplers visited commercial fishing docks throughout the fishing season and
collected a sample of opalescent squid from fishing vessel holds, the processing pump, or
transportation bins. In the lab, opalescent squid were drained of excess fluid, weighed to
the nearest 0.1 g, measured along the dorsal side of the mantle to the nearest mm, and the
sex was determined. In some of the earlier samples, opalescent squid were either
measured immediately or after being frozen; whereas all samples taken in the 1980s or
later were measured on the same day of collection.
Fields (1965) collected random numbers of opalescent squid at the docks
throughout the unloading process. Spratt (1979) and Evans (1976) collected a random
sample of approximately 1,000 g and then measured different numbers of opalescent
squid each time. Leos (1998) measured 25 randomly selected opalescent squid from
2,000 g samples. Handfuls of opalescent squid were collected throughout the entire
offloading process until a 2,000 g sample filled a bucket. In the most recent sampling
regimen, approximately 40 opalescent squid were randomly taken from the processing
pumps – samplers watched the majority of the offloading process and took 5 or 6
individuals with a handheld net as the opalescent squid were pumped into shipping bins
(Kong et al. 2004). Thirty opalescent squid were then measured. In addition to recording
DML, mass, and sex information for the 1999 to 2007 samples, fecundity and age data
were collected. Gonads, mantle punches, and statoliths were taken for the first 5 females
of every sample and a mantle punch and statoliths were removed for the first male of

20
every sample. Statoliths were not aged or validated, and were not available for use in this
analysis, although they may be used later for additional verification purposes.
The number of opalescent squid and days sampled each month varied for all the
collection periods in Monterey. The sample unit that was used for analyses was a day.
Means and 95 % confidence intervals (CI) for DML, body mass, sex ratio, maturity, and
fecundity were calculated for each day a sample was taken and were used in subsequent
analyses. Samples were not collected in every month. Because opalescent squid size
differs in relation to the month of capture, samples could not be combined within a year
to determine if the biological aspects of opalescent squid changed through time. DML
and body mass were graphed by month in box plots, which show the minimum,
maximum, mean, and the 10th, 25th, 75th, and 90th percentiles of the size distribution.
Corresponding sex ratios and samples sizes were graphed adjacent to monthly DMLs to
reveal temporal patterns. A Chi-square test was used to compare the monthly sex ratios.
In this instance, the numbers of female and male opalescent squid were summed by
month and not by sample day, and the proportion of males was used in comparisons. The
Chi-square statistic was 3.84 with 1 degree of freedom (i.e., 2 sexes, 2-1=1).
A one-way ANOVA was used to determine if DML and mass changed
significantly through time in Monterey. The month of June was sampled the most from
1948 to 2006 – 18 years for DML and 15 years for mass. Because some months of June
had only 1 sample day, variances could not be compared with a Cochran’s Test. Due to
variances for the month of June being unequal and sample sizes being largely different,
Resampling Statistics (RS) for Excel was used to run a one-way ANOVA to compare

21
DML and mass for females and males (RS 2006). The RS ANOVA was executed with
10,000 iterations and with replacement (bootstrap).
The proportion of immature, mature, and spent individuals captured by the fishery
from 1989 to 1994 in Monterey was calculated for each month. Mean DML and mass
also were depicted with the maturity data to illustrate how the monthly index of maturity
changed with size through time. To determine if patterns in the maturity index related to
fishery landings, total catch also was graphed by month.
Biological data were compared by month for 3 geographic regions for fishing
seasons from 1999-00 to 2006-07. Mean DMLs and masses were graphed by month for
each region. Pairwise comparisons for monthly sizes for each region were made with a
Pearson product-moment correlation. The mean proportion of males captured in the
fishery from each region was calculated for each month. Since past studies found sex
ratios to be 1:1, this ratio was included in the graphs. The 95% CI from 1999 to 2007
was computed for each region. Similar to the analysis computed for sex ratios in
Monterey from 1948 to 2006, a Chi-square test was used to compare the monthly sex
ratios to 1:1 for each region. RS for Excel was used to compute the 95% CI for a
proportion of 0.50 for a daily sample size of 30 opalescent squid.
For the 3 geographic regions, gonad weight and mantle condition were available
from 1999 to 2004 (only 2002 measurements were available for Monterey). The fraction
of released potential fecundity for individual females was calculated from the following
(Macewicz et al. 2004):
Ep = 29.8L, [r2 = 0.34]
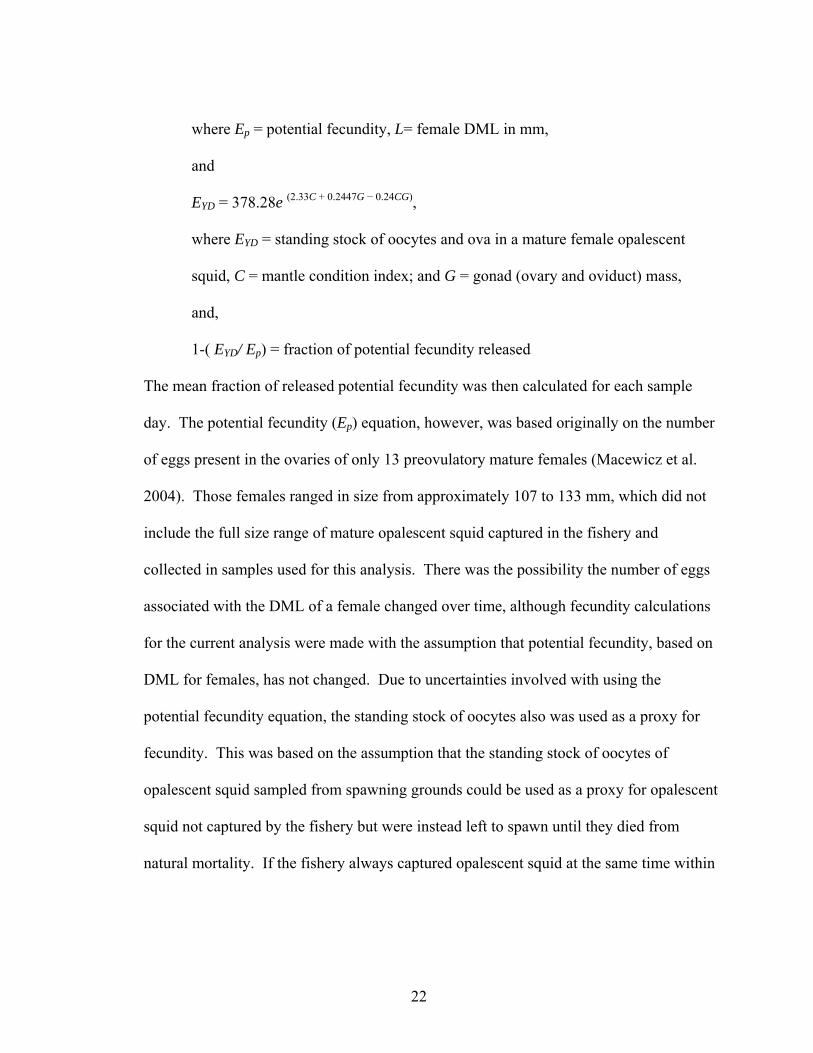
22
where Ep = potential fecundity, L= female DML in mm,
and
EYD = 378.28e (2.33C + 0.2447G − 0.24CG),
where EYD = standing stock of oocytes and ova in a mature female opalescent
squid, C = mantle condition index; and G = gonad (ovary and oviduct) mass,
and,
1-( EYD/ Ep) = fraction of potential fecundity released
The mean fraction of released potential fecundity was then calculated for each sample
day. The potential fecundity (Ep) equation, however, was based originally on the number
of eggs present in the ovaries of only 13 preovulatory mature females (Macewicz et al.
2004). Those females ranged in size from approximately 107 to 133 mm, which did not
include the full size range of mature opalescent squid captured in the fishery and
collected in samples used for this analysis. There was the possibility the number of eggs
associated with the DML of a female changed over time, although fecundity calculations
for the current analysis were made with the assumption that potential fecundity, based on
DML for females, has not changed. Due to uncertainties involved with using the
potential fecundity equation, the standing stock of oocytes also was used as a proxy for
fecundity. This was based on the assumption that the standing stock of oocytes of
opalescent squid sampled from spawning grounds could be used as a proxy for opalescent
squid not captured by the fishery but were instead left to spawn until they died from
natural mortality. If the fishery always captured opalescent squid at the same time within

23
their life history, the standing stock of eggs in opalescent squid should signify a relative
amount of eggs that non-captured opalescent squid were capable of releasing.
Fishing and Environmental Datasets and Analyses
Fishery information from landing receipts was used to determine how fishing gear
and catch amounts changed through time and differed among geographic regions. The
CDFG had landing receipts in digital format from 1969 to 2007. Historic landing
receipts were available via microfiche from 1950 to 1968. Receipts from 1950 to 1953,
which overlapped with the biological data, were searched for opalescent squid
information and then added to the landing receipt database to increase the time coverage
for opalescent squid catch. Summaries of landings data were available from CDFG
Fishery Bulletins from 1929 to the present; however, these summaries did not include the
number of landings made, so a catch-per-trip (or catch-per-unit-effort (CPUE)) estimate
could not be calculated. Therefore, the data from the landing receipt microfiche were
used even though total metric tons landed did not match those reported in CDFG Fishery
Bulletins. Only fishery data reflecting accurate information about the geographic
distribution of opalescent squid were used in the analysis – any information pertaining to
an area outside of the normal depth distribution of opalescent squid was not included.
Total catch amounts and CPUE were calculated for each period and area.
To determine if the observed change in mean opalescent squid size was valid or if
it was instead an artifact of sampling (i.e., fishing gear), a comparison of opalescent squid
DML in relation to gear type was made with data from Leos (1998). During the late
1980s, opalescent squid were caught with lampara, purse, or drum seine nets. An RS

24
bootstrapped ANOVA with 10,000 iterations was used to compare the mean size of
opalescent squid caught with lampara nets or purse and drum seine nets.
SST and upwelling data were available for locations proximal to opalescent squid
fishing grounds in central and southern California. For Monterey, SSTs collected at
Hopkins Marine Station were available from 1945 to 2006. In southern California, SST
data were available from National Oceanic and Atmospheric Administration buoys near
the northern Channel Islands (buoy #46053) and Catalina Island (buoy #46025) from
1998 to 2007. Fluctuations in mean SSTs were calculated from 1945 to 2006 for
Monterey, and for 1998 to 2007 for Monterey, the northern Channel Islands, and Catalina
Island. SST was used as a proxy for food availability for opalescent squid (Roemmich
and McGowan 1995; Jackson and Domeier 2003; Ish et al. 2004). SST anomalies were
computed in Matlab (version 12.0). Mean monthly SSTs were assigned a consecutive
number from 1 to 12. The average SST for each single month of the year for the entire
time series was calculated (e.g., all January months, all February months) and then
subtracted from the corresponding month within each year to compute the anomaly for
that month. Upwelling index and anomaly values were available from the Pacific
Fisheries Environmental Laboratory web site for Monterey and southern California.
The relationship between opalescent squid size and fecundity and fishing or
environmental variables was tested with Pearson product-moment correlations. To
determine which fishing related and oceanographic factors had the greatest influence on
opalescent squid size, SST, upwelling, and fishery landings (i.e., number of fishing days,
total catch, and CPUE) were correlated with opalescent squid DML and mass. The size

25
to which an individual opalescent squid may grow to and be captured by the fishery may
be determined more so during certain stages of their life history. Because certain stages
of an opalescent squid’s life history may be more susceptible to environmental factors or
fishing pressure, correlations were performed for 1-month lags for up to 1 year prior to
the individual being captured. A Sequential Bonferroni Test was used to correct for
multiple correlation tests with the following steps: 1) P-values for 13 months of
correlations (month 0 was equal to the time of capture) were sorted from least to greatest;
2) the alpha-value (0.05) was divided sequentially by the number of lags (i.e., 13, 12,
11…1); and 3) if the P-value was less than the newly calculated alpha-value, then it was
considered to be significant. To determine if any correlations between opalescent squid
body size and environmental factors were affected by relatively weaker or stronger
values, anomalies for DML and mass were calculated. The statistical software SAS
(version 9.1) was used to compute the anomalies for DML and mass because there were
months without values, and the code used in Matlab was not written to accept missing
values.
The longest time series for the fecundity data was from Catalina Island. The
fraction of potential fecundity released and standing stock of oocytes data from Catalina
Island were correlated with fishery landings between 1 to 12 months following the month
samples were collected to determine if a proxy for fecundity was related to the amount of
opalescent squid captured at a later time. All correlations were calculated in JMP
(version 7.0) with a Pearson product-moment correlation.
26
RESULTS
Biological Data
Of the original data collected from each time period in the Monterey area, 27,680
records for individual opalescent squid were analyzed. As previously documented (Leos
1998), mean DMLs and masses of opalescent squid decreased for both sexes from 1948
to 1994 – this decline continued into the 2000s. The minimum and maximum values for
DML and mass of opalescent squid caught by the fishery decreased through time for each
study period (Table 2 and see Figure 4a-b).
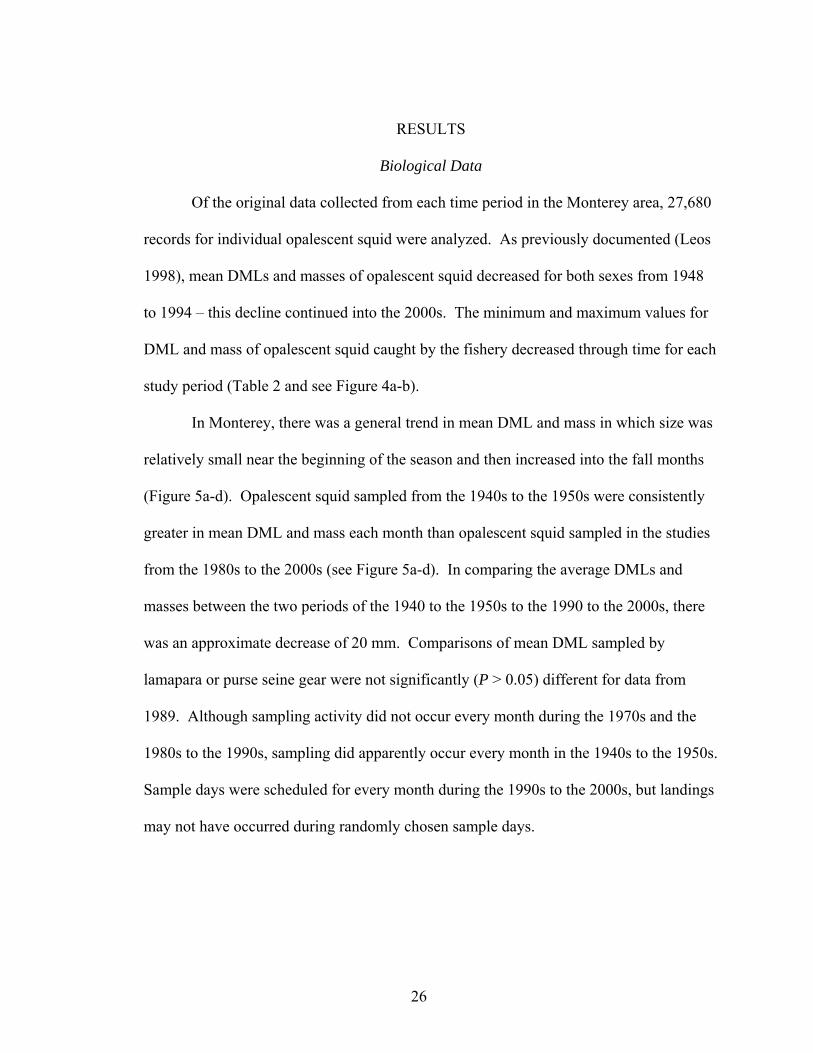
In Monterey, there was a general trend in mean DML and mass in which size was
relatively small near the beginning of the season and then increased into the fall months
(Figure 5a-d). Opalescent squid sampled from the 1940s to the 1950s were consistently
greater in mean DML and mass each month than opalescent squid sampled in the studies
from the 1980s to the 2000s (see Figure 5a-d). In comparing the average DMLs and
masses between the two periods of the 1940 to the 1950s to the 1990 to the 2000s, there
was an approximate decrease of 20 mm. Comparisons of mean DML sampled by
lamapara or purse seine gear were not significantly (P > 0.05) different for data from
1989. Although sampling activity did not occur every month during the 1970s and the
1980s to the 1990s, sampling did apparently occur every month in the 1940s to the 1950s.
Sample days were scheduled for every month during the 1990s to the 2000s, but landings
may not have occurred during randomly chosen sample days.

27
Table 2 Number of opalescent squid sampled and minimum and maximum
sizes for each study period in Monterey
Study period Squid Minimum Maximum DML (mm) All squid
1948-1957 4,533 78.0 192.0 1973-1975 831 86.0 188.0 1989-1994 6,200 58.0 185.0 1999-2006 16,116 62.0 173.0
Female squid
1948-1957 2,272 86.0 179.0 1973-1975 331 96.0 167.0 1989-1994 2,970 58.0 159.0 1999-2006 7,022 83.0 158.0
Male squid
1948-1957 2,261 78.0 192.0 1973-1975 500 86.0 188.0 1989-1994 3,230 62.0 185.0 1999-2006 9,094 62.0 173.0
Mass (g) All squid
1948-1957 2,761 13.0 148.0 1973-1975 831 12.7 140.1 1989-1994 6,200 5.6 124.5 1999-2006 16,116 8.5 107.3
Female squid
1948-1957 1,429 13.0 112.0 1973-1975 331 15.9 108.7 1989-1994 2,970 5.6 84.3 1999-2006 7,022 8.5 76.9
Male squid
1948-1957 1,332 13.0 148.0 1973-1975 500 12.7 140.1 1989-1994 3,230 6.7 124.5 1999-2006 9,094 9.0 107.3

28
Figure 5a-d Mean DML and mass with corresponding 95% CI pooled by month for each
study period in Monterey, 1948 to 2006 (data source See Table 1)
Mean DMLs and masses of females and males were significantly different in June
from 1948 to 2006 (Table 3). June was sampled the most among all sampling years due
to the relatively greater fishery landings during this month, and was chosen to depict the
overall pattern of decline in size (Figure 6a-d). In some years, opalescent squid DML or
mass did overlap in size, which signifies the variability of opalescent squid body size.
However, in only 1 month (May 2000) following the 1970s did the maximum sizes reach
those of the earlier samples (Figure 7a-b).
Apr Jul Oct Jan100
120
140
160
Apr Jul Oct Jan100
120
140
160
Apr Jul Oct Jan20
40
60
80
100
Apr Jul Oct Jan20
40
60
80
100d. Male squidc. Female squid
DM
L (m
m)
Mas
s (g
) a. Female squid b. Male squid
1940-50s1948 to 1957 1970s1973 to 1975 1980-90s1989 to 1994 1990-00s1999 to 2006

29
Table 3 Results for a one-way ANOVA in RS for mean DML and mass for the month of
June in Monterey, 1948 to 2006
Female Male DML P < 0.0001 P =0.01 Mass P =0.04 P =0.05
Sex ratios fluctuated in Monterey from 1948 to 2006. The majority of monthly
sex ratios of females and males captured in the fishery were significantly different from
1:1 (Table 4, see Figure 4a). From 1989 to 2006, there was a general trend in which the
mean proportion of males increased throughout the fishing season.
The monthly maturity index for females and males exhibited different patterns for
each fishing season from 1989 to 1994 in Monterey (Figure 8a-b). Opalescent squid
recruiting to the fishery in 1989 and 1990 were mature from April to August and then an
increase in the proportion of spent individuals occurred. In 1991, the proportion of
immature females increased at the end of the fishing season rather than the proportion of
spent individuals. Also in 1991, the proportion of spent males captured in the fishery was
greatest in July. During the 1992 fishing season, individuals were identified as mature
throughout the fishing season with no notable increase in the proportion of immature or
spent individuals. In 1994, the proportion of mature female opalescent squid remained
consistent throughout the season, whereas males were spent in most months. Total catch
decreased at the end of the fishing season as more spent opalescent squid recruited to the
fishing grounds. Trends in mean DML and mass did not correspond to the monthly
patterns exhibited in the maturity index.

30
Figure 6a-d Mean DML and mass with corresponding 95% CI for June for Monterey,
1948 to 2006 (data source See Table 1)
1948 1958 1968 1978 1988 199820
40
60
80
1948 1958 1968 1978 1988 199820
40
60
80
1948 1958 1968 1978 1988 1998100
120
140
160
180
1948 1958 1968 1978 1988 1998100
120
140
160
180
Mas
s (g
)
DM
L (m
m)
a. Female squid
d. Male squid
b. Male squid
c. Female squid

31
Table 4 Chi-square results for comparing opalescent squid sex ratios to 1:1 for
Monterey, 1948 to 2006
Jan Feb Mar Apr May Jun Jul Aug Sep Oct Nov Dec
1948 8.4* 0.0 8.5* 4.1* 0.4
1949 8.7* 4.4* 2.7 3.4 20.4* 8.5* 8.7* 0.9 0.1 2.4
1950 1.2 22.3* 1.4 5.1* 1.1 9.3* 9.9* 43.7*
1951 10.9* 5.6* 57.7* 8.5* 0.0
1952 0.1 0.0 0.7 0.4
1953 4.6*
1957 0.7
1973 18.7* 23.0*
1974 0.3 3.3 20.7*
1975 0.7
1989 1.3 4.0* 6.8* 0.0 0.0 4.5* 0.7 0.4
1990 0.6 9.6* 0.7 1.3 6.8* 10.0* 10.7* 7.8*
1991 0.7 5.9* 1.9 0.9 1.6
1992 0.1 5.6* 0.5 1.4 5.8* 1.6
1994 2.0 0.0 11.0* 2.9 9.7* 1.0
1999 5.4*
2000 4.3* 64.4* 26.8* 0.6 1.6 5.0*
2001 3.3 1.8 5.4* 33.8* 0.8 1.2 0.6
2002 0.0 7.0 19.9* 15.7* 18.3* 13.3* 30.4* 0.2 5.6* 3.6
2003 8.9* 1.9 6.1* 5.0* 22.5* 2.7 0.6 1.0
2004 10.8* 8.5* 7.0* 2.6 26.1* 30.0* 6.4*
2005 6.0* 28.6* 17.1* 30.8*
2006 75.6* 49.3* 30.0* *Sex ratios were significantly different from 1:1

32
Figure 7a DML maximum for each sample month for
Monterey, 1948 to 2006
100 120 140 160 180 200DML Maximum (mm)
1948
January
2006
1948
May
2006
1948
April
2006
1948
March
2006
1948
February
2006
1948
June
2006
1948
July
2006
1948
November
2006
1948
October
2006
1948
September
2006
1948
August
2006
1948
December
2006
100 120 140 160 180 200DML Maximum (mm)

33
Figure 7b Mass maximum for each sample month for
Monterey, 1948 to 2006 (data source See Table 1)
60 80 100 120 140 60 80 100 120 140Mass (g)
1948
January
2006
1948
May
2006
1948
April
2006
1948
March
2006
1948
February
2006
1948
June
2006
Mass (g)
1948
July
2006
1948
November
2006
1948
October
2006
1948
2006
1948
August
2006
1948
December
2006
September

34
Figure 8a-b Mean proportion of maturity, DML, and mass with corresponding
95% CI by month with total catch (mt) for Monterey, 1989 to 1994
(data source See Table 1)
Apr Aug Dec Apr Aug Dec Apr Aug Dec Apr Aug Dec Apr Aug
0.0
0.5
1.0
1.5
2.0
2.5
3.0
-100
-50
0
50
100
150
DM
L (mm
) – Mass (g) – Tons (m
t)
Pro
porti
on o
f Mat
urity
Immature Mature
Mean DML Tons*100 Mean Mass
Spent
Apr Aug Dec Apr Aug Dec Apr Aug Dec Apr Aug Dec Apr Aug
0.0
0.5
1.0
1.5
2.0
2.5
3.0
-100
-50
0
50
100
150
1989 1990 1991 1992 1994
DM
L (mm
) – Mass (g) – Tons (m
t)
b. Male squid
a. Female squid
Pro
porti
on o
f Mat
urity

35
For the geographic comparison of the biological aspects of opalescent squid,
60,022 individuals were sampled from Monterey, the northern Channel Islands, and
Catalina Island (Figure 9a-b). From 2000-01 to 2006-07 there was a decrease in mean
opalescent squid DML and mass in all areas (Figure 10a-d). In 1999-00 opalescent squid
size was the largest for the northern Channel Islands and Catalina Island. Opalescent
squid size was the smallest during the 2004-05 fishing season for southern California.
Body size then increased in 2005-06 for sites south of Point Conception, but size
decreased even further in 2005-06 and 2006-07 in Monterey for all opalescent squid.
Figure 9a-b The number of sample days and number of opalescent squid sampled
per month for 3 regions from 1999-00 to 2006-07 (data source See Table 1)
1999-00 2000-01 2001-02 2002-03 2003-04 2004-05 2005-06 2006-0705
1015202530
0500100015002000
1999-00 2000-01 2001-02 2002-03 2003-04 2004-05 2005-06 2006-0705
1015202530
0500100015002000
1999-00 2000-01 2001-02 2002-03 2003-04 2004-05 2005-06 2006-0705
1015202530
0500100015002000c. Catalina Island
Days per month Squid per month
Sam
ple
days
/ m
onth
Squid / m
onth
a. Monterey
b. N. Channel Islands

36
Figure 10a-d Mean DML and mass with corresponding 95% CI for 3 regions
from 1999-00 to 2006-07 (data source See Table 1)
1999-00 2000-01 2001-02 2002-03 2003-04 2004-05 2005-06 2006-070
20
40
60
80
1999-00 2000-01 2001-02 2002-03 2003-04 2004-05 2005-06 2006-070
20
40
60
80Mas
s (g
)
d. Male squid
c. Female squid
1999-00 2000-01 2001-02 2002-03 2003-04 2004-05 2005-06 2006-0780
100
120
140
160
1999-00 2000-01 2001-02 2002-03 2003-04 2004-05 2005-06 2006-0780
100
120
140
160 b. Male squid
a. Female squidD
ML
(mm
) Monterey
yN. Channel Islands Catalina Island
37
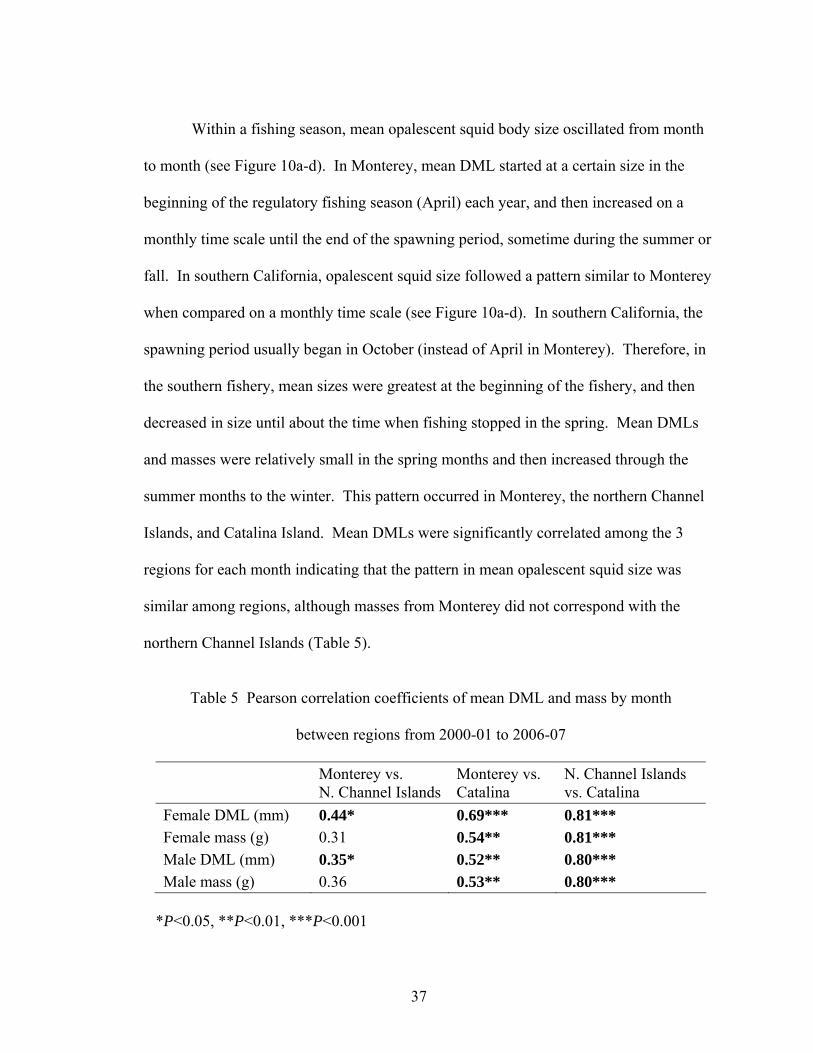
Within a fishing season, mean opalescent squid body size oscillated from month
to month (see Figure 10a-d). In Monterey, mean DML started at a certain size in the
beginning of the regulatory fishing season (April) each year, and then increased on a
monthly time scale until the end of the spawning period, sometime during the summer or
fall. In southern California, opalescent squid size followed a pattern similar to Monterey
when compared on a monthly time scale (see Figure 10a-d). In southern California, the
spawning period usually began in October (instead of April in Monterey). Therefore, in
the southern fishery, mean sizes were greatest at the beginning of the fishery, and then
decreased in size until about the time when fishing stopped in the spring. Mean DMLs
and masses were relatively small in the spring months and then increased through the
summer months to the winter. This pattern occurred in Monterey, the northern Channel
Islands, and Catalina Island. Mean DMLs were significantly correlated among the 3
regions for each month indicating that the pattern in mean opalescent squid size was
similar among regions, although masses from Monterey did not correspond with the
northern Channel Islands (Table 5).
Table 5 Pearson correlation coefficients of mean DML and mass by month
between regions from 2000-01 to 2006-07
Monterey vs. N. Channel Islands
Monterey vs. Catalina
N. Channel Islands vs. Catalina
Female DML (mm) 0.44* 0.69*** 0.81*** Female mass (g) 0.31 0.54** 0.81*** Male DML (mm) 0.35* 0.52** 0.80*** Male mass (g) 0.36 0.53** 0.80***
*P<0.05, **P<0.01, ***P<0.001

38
In most months, males from all 3 areas for 1999-00 to 2006-07 dominated sex
ratios of opalescent squid captured in the fishery (Figure 11a-c). For the majority of the
months, the proportion of males was within the 95% CI for a sample size of 30. In some
months the proportion of males was significantly greater than the proportion of females
(Table 6a-c). Past studies in Monterey found sex ratios to be equal from 1948 to 1962
(Fields 1965) and from 1989 to 1994 (Leos 1998) and not equal in 1974 (Evans 1976) –
the results of this study indicate that sex ratios were equal in some months but not the
majority. In Monterey, there was a general increase in the proportion of males from 1999
to 2006, although this increase was not evident in the southern California sites.
If female opalescent squid are captured before they have an opportunity to spawn,
they will have a greater standing stock of eggs in their bodies, whereas females that have
spawned will contain fewer eggs. Potential fecundity of female opalescent squid is
dependent on DML (Macewicz et al. 2004); therefore, the temporal pattern in potential
fecundity was the same as DML. Moreover, because DML decreased in Monterey from
1948 to 2006, potential fecundity decreased. To estimate the fraction of potential
fecundity a female had released into the environment at the time of capture, the ratio of
oocyte standing stock to potential fecundity was subtracted from 1. It appears that
released fecundity increased from 1999-00 to 2002-03 (Figure 12). In Monterey from
2001-02 to 2002-03, the fraction of released fecundity increased through the fishing
season from April to the fall, which matches the patterns in maturity index from 1989 to
1994 when there was a greater proportion of spent individuals later in the fishing season
(see Figure 8a-b).

39
Figure 11a-c Mean proportion of males with corresponding 95% CI by month for 3
regions from 1999-00 to 2006-07. The upper and lower solid lines depict the 95%
CI for the entire period, and the middle solid line depicts the mean. The upper
and lower dashed lines show the 95% CI for a daily sample size of 30 squid;
the middle dashed line signifies a sex ratio of 1:1. (data source See Table 1)
1999-00 2000-01 2001-02 2002-03 2003-04 2004-05 2005-06 2006-070.00.20.40.60.81.0
1999-00 2000-01 2001-02 2002-03 2003-04 2004-05 2005-06 2006-070.00.20.40.60.81.0
1999-00 2000-01 2001-02 2002-03 2003-04 2004-05 2005-06 2006-070.00.20.40.60.81.0 c. Catalina Island
a. Monterey
b. N. Channel Islands
Pro
porti
on o
f mal
es

40
Table 6a-c Chi-square results for opalescent squid sex ratios compared to 1:1 ratio
for 3 regions
Jan Feb Mar Apr May Jun Jul Aug Sep Oct Nov Dec a. Monterey 1999 5.4* 2000 4.3* 64.4* 26.8* 0.6 1.6 5.1* 2001 3.3 1.8 5.4* 33.8* 0.8 1.2 0.6 2002 0.0 7.0* 19.9* 15.7* 18.3* 13.3* 30.4* 0.2 5.6* 3.6 2003 8.9* 1.8 6.1* 5.0* 22.5* 2.7 0.6 1.0 2004 10.8* 8.5* 7.0* 2.6 26.1* 30.0* 6.4* 2005 6.0* 28.6* 17.1* 30.8* 2006 16.1* 72.6* 49.3* 30.0* b. N. Channel Islands 1999 17.6* 1.1 29.6* 2.4 42.1* 24.8* 4.5* 2.3 2000 23.8* 61.5* 15.2* 15.7* 0.7 16.4* 0.0 10.4* 0.2 2.5 2001 0.2 1.2 0.1 2.6 0.1 5.0* 12.3* 2.1 6.2* 14.0* 8.0* 9.6* 2002 2.3 17.3* 9.1* 2.2 0.1 3.3 0.6 0.2 28.9* 24.9* 7.1* 2003 0.5 32.0* 6.0* 13.7* 13.3* 0.2 19.0* 0.1 0.1 2004 18.4* 1.1 10.1* 17.1* 0.1 3.6* 2005 6.4* 0.0 23.6* 25.6* 0.8 2006 1.1 0.1 2.1 6.4* 3.9* 2007 2.4 0.0 2.8 c. Catalina 1999 66.4* 18.1* 31.2* 0.1 1.2 0.1 1.8 7.3* 2000 28.2* 25.6* 10.7* 0.0 12.1* 0.8 0.1 0.5 0.1 2.3 2001 3.2 0.1 0.0 3.2 4.3* 1.3 6.1* 1.2 2.1 0.3 0.2 2002 0.1 0.1 9.2* 3.6 1.0 1.1 2003 4.3* 4.8* 8.4* 30.0* 20.0* 0.4 0.0 14.3* 0.0 0.3 5.1* 2004 0.1 6.6* 5.0* 8.5* 0.4 15.0* 2005 8.5* 6.5* 0.0 2.2 1.6 0.2 0.6 2.5 3.6 3.9* 2006 6.2* 24.7* 19.2* 1.4 8.1* 1.4 5.0* 2007 7.5* 14.4* 0.7 *Sex ratios were significantly different from 1:1

41
Figure 12 Fraction of potential female fecundity released with corresponding 95% CI for
3 regions from 1999-00 to 2003-04 (data source See Table 1)
Fishery and Environmental Data
The average catch-per-daily-vessel-landing was calculated from dealer receipts
(Figure 13a-c). Calculating CPUE in this manner did not account for 0 take even if effort
was expended, nor was the actual amount of fishing time used in analyses. CPUE in this
instance was used as a relative measure of the amount of opalescent squid removed per
standardized-unit-of-effort (one fishing vessel day) through time and among different
geographic regions. From 1950-01 to 1953-54 and from 1969-00 to 1989-90 in
Monterey, the average catch-per-landing was never greater than 10 mt, and from 1990-91
to 2006-07, CPUE was greater than 10 mt in some years (see Figure 13c). In 2002-03,
even though the number of landings remained low, the average CPUE was greater than
20 mt per landing, signifying a potential increase in opalescent squid abundance during
that fishing season (see Figure 13a-c).
1999-00 2000-01 2001-02 2002-03 2003-04
0.00.20.40.60.81.0
Frac
tion
of P
oten
tial
Fecu
ndity
rele
ased
Montereyy
N. Channel Islands Catalina Island

42
Figure 13a-c Monterey area fishery data from 1950-51 to 2006-07
(data source, See Table 1)
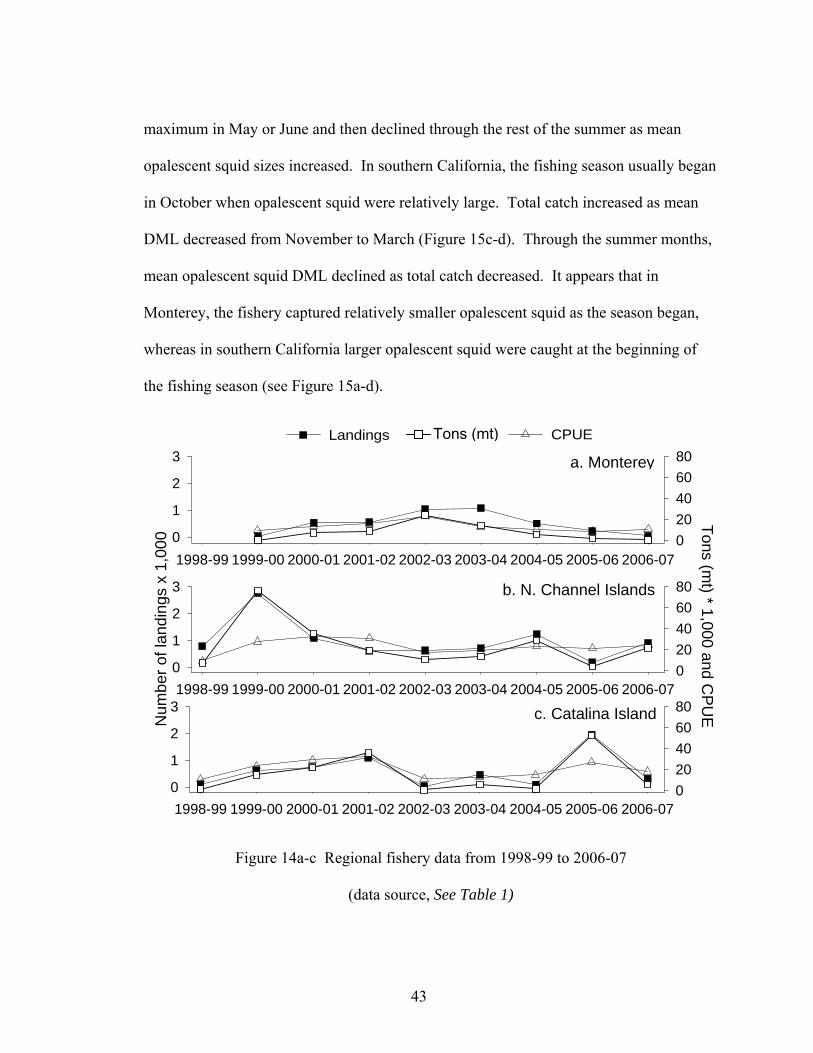
From 1998-99 to 2006-07, total catch and CPUE were considerably greater in
southern California than in Monterey (Figure 14a-c). In 1999-00 there were higher
landings from the northern Channel Islands than from Catalina Island and in 2005-06, the
opposite trend occurred. In years when landings were relatively small in Monterey,
landings were greater in the southern California sites.
In Monterey, the fishing season usually began within the month of April when
mean opalescent squid sizes were relatively small (Figure 15a-b). Total catch reached a
1950-51 1970-71 1980-81 1990-91 2000-010
102030
1950-51 1970-71 1980-81 1990-91 2000-010123
1950-51 1970-71 1980-81 1990-91 2000-010
102030
a. Number of landings To
ns (m
t) x
1,0
00
c. CPUE
b. Total catch
Trip
s x
1,00
0 To
ns (m
t) pe
r trip
43
maximum in May or June and then declined through the rest of the summer as mean
opalescent squid sizes increased. In southern California, the fishing season usually began
in October when opalescent squid were relatively large. Total catch increased as mean
DML decreased from November to March (Figure 15c-d). Through the summer months,
mean opalescent squid DML declined as total catch decreased. It appears that in
Monterey, the fishery captured relatively smaller opalescent squid as the season began,
whereas in southern California larger opalescent squid were caught at the beginning of
the fishing season (see Figure 15a-d).
Figure 14a-c Regional fishery data from 1998-99 to 2006-07
(data source, See Table 1)
Landings Tons (mt)
1998-99 1999-00 2000-01 2001-02 2002-03 2003-04 2004-05 2005-06 2006-070
1
2
3
020406080
1998-99 1999-00 2000-01 2001-02 2002-03 2003-04 2004-05 2005-06 2006-070
1
2
3
020406080
1998-99 1999-00 2000-01 2001-02 2002-03 2003-04 2004-05 2005-06 2006-070
1
2
3
020406080
a. Monterey
c. Catalina Island
b. N. Channel Islands
Num
ber o
f lan
ding
s x
1,00
0
Tons (mt) * 1,000 and C
PU
E
CPUE

44
Figure 15a-d Total catch summed for each month throughout each time period and
overall mean DML by month (data source See Table 1)
Apr Jul Oct Jan120130140150160170
Apr Jul Oct Jan01020304050
Apr Jul Oct Jan120
130
140
150
Apr Jul Oct Jan05101520
Apr Jul Oct Jan120
130
140
150
Apr Jul Oct Jan01020304050
Apr Jul Oct Jan120
130
140
150
Apr Jul Oct Jan010203040
a. Monterey 1950-2006
b. Monterey 1999-2006
c. N. Channel Islands 1999-2007
d. Catalina Island 1999-2007
DM
L (m
m)
Total catch (mt) x 1,000
DMLTotal catch

45
The 1976-77 regime shift caused SST to increase and upwelled nutrients to
decrease along California. The monthly average SST recorded at Hopkins Marine
Station near Monterey was 13.3°C (CI = 0.09) from 1947 to 2006; SST warmed 0.5°C.
The seasonal pattern in SST – where SST is warm in the summer and cool in the winter –
did not falter, but the SST of the summers and winters were warmer after the 1976-77
regime shift (Figure 16a-l). The strength of upwelling did not change considerably
(Figure 17a-l); nutrients that would normally be upwelled were reduced due to an
increase in water column stratification (McGowan et al. 2003; Kim and Miller 2007).
Environmental conditions differed between central and southern California.
Mean monthly SSTs were consistently cooler near Monterey than in southern California
during the summer months, whereas, SSTs were more similar during winter months
(Figure 18a-b). The strongest upwelling occurred in spring and summer in both areas
(Figure 18c). In Monterey, upwelled water provided a source of nutrients from
bathymetric depths and in southern California, nutrients were upwelled from the
continental slope (Venrick et al. 2006). Upwelling values overlapped in both areas
throughout the year. During the 1998-99 La Niña, a shift to a cool regime phase was
predicted, but instead of the shift being permanent, in 2002, SST became warm and
upwelling relaxed. In addition, the timing of seasonal events shifted. For example, the
spring transition that usually occurred in Monterey during March was offset to summer
months in the 2005-06 (Peterson et al. 2006) and 2006-07 seasons (Goericke et al. 2007).
Oceanographic conditions in southern California were near the long-term average during
this alternative period (Bograd et al. 2000; Durazo et al. 2001).

46
Figure 16a-l Monterey SST anomalies from the long-term annual mean from
1945 to 2006 (data source see Table 1)
-202
-202
-202
-202
-202
-202
-202
-202
-202
-202
-202
1945 1955 1965 1975 1985 1995 2005-202
l. Dec
k. Nov
j. Oct
i. Sep
h. Aug
g. Jul
f. Jun
e. May
d. Apr
c. Mar
a. Jan
b. Feb
SS
T an
omal
y

47
Figure 17a-l Monterey upwelling anomaly from 1945 to 2006 (data source see Table 1)
l. Dec
k. Nov
j. Oct
i. Sep
h. Aug
g. Jul
f. Jun
e. May
d. Apr
c. Mar
a. Jan
b. Feb
-200-100
0100
-200-100
0100
-200-100
0100
-200-100
0100
-200-100
0100
-200-100
0100
-200-100
0100
-200-100
0100
-200-100
0100
-200-100
0100
-200-100
0100
Upw
ellin
g an
omal
y
1945 1955 1965 1975 1985 1995 2005-200-100
0100

48
Figure 18a-c Mean SST with corresponding 95% CI, SST anomaly, and upwelling by
month for 3 regions from 1998-99 to 2006-07 (data source See Table 1)
1998-991999-002000-01 2001-022002-03 2003-042004-052005-06 2006-078
10
12
14
16
18
20
22
1998-991999-002000-01 2001-022002-032003-042004-052005-062006-07-100
0
100
200
300
400
500N. Point ConceptionS. Point Conception
1998-991999-002000-012001-022002-03 2003-042004-052005-06 2006-07-3
-2
-1
0
1
2
3
SS
T (°
C)
SS
T an
omal
y U
pwel
ling
(m/3 s
/100
m)
a.
b.
c.
Montereyy
N. Channel Islands Catalina Island
Montereyy
N. Channel Islands Catalina Island

49
Causes for the decline in opalescent squid size are not well-known. For Monterey
from 1948 to 2006, the PDO shifted from a cool regime to a period of warm water in
1976-77 and then to an alternative period in 1999, and there were numerous ENSO
events (see Figure 4a). Opalescent squid DML was larger during the cool PDO and in
years immediately following strong La Niña events, whereas warmer water led to
comparatively smaller individuals (See Figure 4a). Correlations between biological
characteristics and fishing pressure were not as strong as correlations between opalescent
squid size and environmental variables for Monterey from 1948-49 to 2006-07. Mean
DMLs for females and males were negatively correlated with landings 8 months prior to
capture (Table 7a-b). CPUE 7 to 12 months before capture had a negative effect on
female DML, but there were no significant correlations between male size and CPUE
(see Table 7a-b). Total catch was negatively correlated with female DMLs at 8 to 12
months before capture (see Table 7a-b). A correlation with a 12-month lag indicates that
the catch 1 year before opalescent squid were captured will have an effect on the size of
individuals from a generation 1 year later unless opalescent squid live to 12 months.
Different results were found for the 3 geographic regions from 1999-00 to 2006-
07 (Table 8a-b). There were no significant correlations between mean DMLs and the
number of landings in Monterey, but instead positive correlations occurred from 7 to 9
months before capture in the northern Channel Islands for females and males. CPUE was
positively correlated with DML at time of capture for males in the Monterey, but there
were minor significant correlations between mean DML and CPUE for the southern
California sites (see Table 8a-b).

50
Table 7a-b Pearson correlation coefficients for mean DML versus fishery and
environmental variables by month for Monterey from 1948-49 to 2006-07
Lag
Landing
CPUE
Catch
SST
SST Anomaly
Upwelling
Upwelling Anomaly
a.
Female 0
-0.01 -0.23 -0.08 -0.25* -0.22** -0.42** -0.13 1
0.01 -0.17 -0.08 -0.09 -0.35** -0.34** -0.18 2
0.01 -0.05 -0.04 -0.03 -0.35** -0.14 -0.19 3
0.13 -0.05 -0.01 0.09 -0.32** 0.07 -0.20 4
0.13 -0.09 -0.04 0.09 -0.29** 0.24* -0.13 5
0.18 -0.11 0.04 0.10 -0.19 0.30** -0.17 6
0.06 -0.32 -0.01 -0.06 -0.19 0.30** -0.25 7
-0.07 -0.37* 0.10 -0.27* -0.23 0.16 -0.28* 8
-0.37* -0.39* -0.39* -0.38** -0.21 -0.14 -0.33** 9
-0.34 -0.44* -0.38* -0.43** -0.21 -0.30** -0.23 10
-0.25 -0.38* -0.32* -0.48** -0.32** -0.39** -0.16 11
-0.19 -0.30 -0.29 -0.37*** -0.27* -0.45** -0.11 12
-0.19 -0.31* -0.33* -0.14 -0.19 -0.45*** -0.18
b.
Male 0
0.08 -0.13 0.01 -0.23 -0.32** -0.33** -0.01 1
0.10 -0.06 0.01 -0.07 -0.32** -0.25** -0.10 2
0.08 0.01 0.03 0.02 -0.33** -0.08 -0.12 3
0.16 0.02 -0.07 0.07 -0.31** 0.09 -0.15 4
0.15 -0.06 -0.01 0.06 -0.31** 0.25* -0.06 5
0.15 -0.11 0.02 0.02 -0.23 0.28* -0.14 6
0.09 -0.27 0.02 -0.10 -0.22 0.29* -0.18 7
-0.10 -0.34 -0.06 -0.26* -0.21 0.17 -0.20 8
-0.39* -0.30 -0.34 -0.33** -0.15 -0.10 -0.24 9
-0.33 -0.29 -0.30 -0.38** -0.17 -0.23* -0.11 10
-0.18 -0.29 -0.25 -0.41** -0.25* -0.31* -0.06 11
-0.16 -0.21 -0.23 -0.35** -0.26* -0.33** -0.05 12
-0.09 -0.20 -0.27 -0.12 -0.17 -0.34** -0.05 *P<0.05, **P<0.01, ***P<0.001

51
Table 8a-b Pearson correlation coefficients for mean DML versus fishery variables by
month for Monterey from 2000-01 to 2006-07 and two southern California sites
from 1999-00 to 2006-07
Monterey
N. Channel Islands Catalina Lag
Landing CPUE Catch Landing CPUE Catch Landing CPUE Catch a.
Female 0
0.11 0.55* 0.26 0.16 0.30 0.26 0.09 0.19 0.09 1
0.03 0.44* 0.19 0.06 0.12 0.15 -0.08 0.07 -0.07 2
-0.06 0.49* -0.10 -0.02 0.20 0.12 -0.15 -0.16 -0.15 3
-0.07 0.38 0.01 -0.05 0.13 0.07 -0.21 -0.11 -0.23 4
-0.12 0.20 0.20 -0.07 0.04 -0.01 -0.32 -0.14 -0.34 5
0.26 -0.05 0.30 0.15 0.14 0.13 -0.31 -0.20 -0.30 6
0.44 -0.16 0.22 0.30 0.14 0.24 -0.18 -0.15 -0.15 7
-0.29 -0.15 -0.24 0.44** 0.20 0.34 -0.02 0.06 0.01 8
-0.25 -0.22 -0.20 0.48** 0.11 0.37* 0.08 0.07 0.10 9
-0.24 -0.40 -0.14 0.44** 0.05 0.31 0.13 0.15 0.14 10
-0.22 -0.17 -0.24 0.34 -0.01 0.22 0.22 0.14 0.19 11 -0.35 -0.04 -0.32 0.23 -0.01 0.13 0.12 0.16 0.13 12
-0.43 0.02 -0.24 0.22 -0.09 0.10 -0.01 0.07 0.04 b.
Male 0
0.20 0.62 0.35 0.19 0.36* 0.28 0.22 0.29 0.22 1
0.11 0.52 0.36 0.10 0.14 0.18 0.05 0.22 0.05 2
-0.01 0.52 0.20 0.05 0.20 0.19 -0.06 0.09 -0.05 3
0.01 0.43 0.01 0.09 0.18 0.20 -0.15 -0.02 -0.17 4
-0.09 0.15 0.12 0.07 0.08 0.12 -0.27 -0.08 -0.28 5
0.19 -0.12 0.29 0.24 0.17 0.22 -0.27 -0.16 -0.27 6
0.44 -0.14 0.23 0.42* 0.16 0.37* -0.18 -0.14 -0.15 7
0.32 -0.22 -0.17 0.47** 0.18 0.38* -0.02 0.03 0.01 8
-0.16 -0.15 -0.10 0.37* 0.02 0.27 0.09 0.15 0.12 9
-0.11 -0.19 -0.06 0.36 -0.05 0.21 0.14 0.18 0.15 10
-0.10 -0.09 -0.11 0.32 -0.09 0.16 0.23 0.13 0.21 11
-0.21 0.14 -0.24 0.25 -0.09 0.07 0.13 0.19 0.14 12
-0.33 0.20 -0.19 0.21 -0.13 0.06 0.01 0.15 0.05 *P<0.05, **P<0.01

52
Environmental factors including mean SSTs and upwelling were significantly
correlated with mean DMLs in Monterey from 1948-49 to 2006-07. There was a
negative correlation between mean DML or mass with monthly SST at time of capture
and from 7 to 11 months before opalescent squid were sampled, which should coincide
with their hatch-month (Figure 19a-b). Additionally, there was a positive correlation
between mean DML and mass versus upwelling approximately 4 to 6 months before
capture (Figure 19c-d). Anomalies for monthly mean SST, upwelling, and opalescent
squid sizes were correlated to determine if relatively stronger or weaker environmental
variables would have an even greater effect on opalescent squid size. Correlations
between the anomalies for monthly mean DML and SST, indicate an actual negative
correlation existed that was not just an artifact of seasonality (see Table 7a-b).
Similar patterns existed for Monterey, the northern Channel Islands, and Catalina
Island from 1999-00 to 2006-07 (Tables 9-12). In Monterey from 1999-00 to 2006-07,
mean DML and SST were negatively correlated between 8 to 10 months before capture
and positively correlated 1 to 4 months before being collected. Anomalies for monthly
mean SSTs and opalescent squid DMLs were not significantly correlated. These patterns
for Monterey from 1999-00 to 2006-07 do not match the results from 1948-49 to 2006-07
probably because the sample size was considerably less due to the shorter time period. In
southern California, similar correlations were significant probably because the sample
size was larger due to the fishery being more active throughout the fishing season. In the
northern Channel Islands, monthly mean DMLs were negatively correlated with mean
SSTs from 5 to 8 month for females and from 6 to 8 months for males before time of
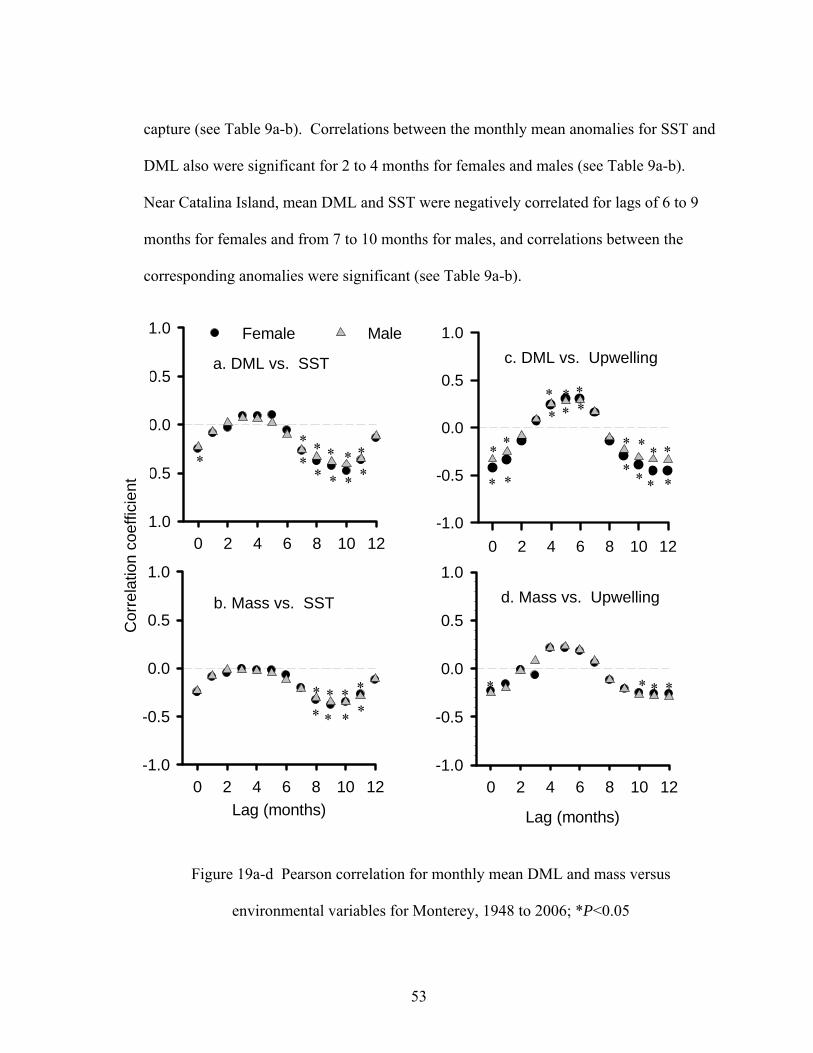
53
capture (see Table 9a-b). Correlations between the monthly mean anomalies for SST and
DML also were significant for 2 to 4 months for females and males (see Table 9a-b).
Near Catalina Island, mean DML and SST were negatively correlated for lags of 6 to 9
months for females and from 7 to 10 months for males, and correlations between the
corresponding anomalies were significant (see Table 9a-b).
Figure 19a-d Pearson correlation for monthly mean DML and mass versus
environmental variables for Monterey, 1948 to 2006; *P<0.05
Cor
rela
tion
coef
ficie
nt
Lag (months)0 2 4 6 8 10 12
-1.0
-0.5
0.0
0.5
1.0
*
**** * *
*
0 2 4 6 8 10 121.0
0.5
0.0
0.5
1.0
* *
****
* * **
*
a. DML vs. SST
b. Mass vs. SST
Female Male
Lag (months)
0 2 4 6 8 10 12-1.0
-0.5
0.0
0.5
1.0
** * *
d. Mass vs. Upwelling
0 2 4 6 8 10 12-1.0
-0.5
0.0
0.5
1.0
* *
**
*
*
**
*
* *
*
**
*
*
*
*
c. DML vs. Upwelling

54
Table 9a-b Pearson correlation coefficients for mean DML versus SST by month for
Monterey from 2000-01 to 2006-07 and two southern California sites
from 1999-00 to 2006-07
DML vs. SST DML anomaly vs. SST anomaly
Lag Monterey N. Channel Islands Catalina Monterey N. Channel
Islands Catalina
a.
Female 0
0.08 0.41** 0.26 -0.20 -0.18 -0.27 1
0.40* 0.34* 0.39** -0.11 -0.20 -0.36* 2
0.57** 0.14 0.46*** -0.06 -0.39** -0.32* 3
0.57** -0.10 0.35** -0.11 -0.49** -0.37* 4
0.41* -0.28 0.13 -0.22 -0.43** -0.41** 5
0.27 -0.39** -0.11 -0.16 -0.20 -0.34* 6
-0.03 -0.54** -0.41** -0.06 -0.21 -0.51** 7
-0.28 -0.55** -0.59*** 0.07 -0.23 -0.51** 8
-0.49** -0.46** -0.55*** 0.08 -0.31 -0.31* 9
-0.55** -0.16 -0.38*** 0.25 -0.18 -0.20 10
-0.49** 0.16 -0.13 0.17 -0.01 -0.09 11
-0.16 0.37* 0.07 0.06 -0.16 -0.17 12
0.19 0.47** 0.25 -0.15 -0.02 -0.13 b.
Male 0
0.02 0.28 0.11 -0.14 -0.12 -0.16 1
0.26 0.19 0.32* -0.17 -0.13 -0.27 2
0.41 -0.02 0.45** -0.13 -0.43** -0.33* 3
0.43* -0.20 0.45** -0.19 -0.51** -0.31 4
0.28 -0.31 0.28 -0.20 -0.46** -0.38** 5
0.13 -0.37 0.06 -0.23 -0.30 -0.33* 6
-0.04 -0.43* -0.25 -0.08 -0.22 -0.46*** 7
-0.15 -0.41** -0.50*** 0.15 -0.25 -0.43*** 8
-0.33 -0.32** -0.57*** 0.17 -0.31 -0.26 9
-0.37 -0.07 -0.51*** 0.28 -0.17 -0.20 10
-0.36 0.18 -0.31* 0.17 -0.02 -0.11 11
-0.20 0.30 -0.15 -0.03 -0.01 -0.26* 12
0.09 0.33 0.10 -0.16 0.03 -0.09 *P<0.05, **P<0.01, ***P<0.001
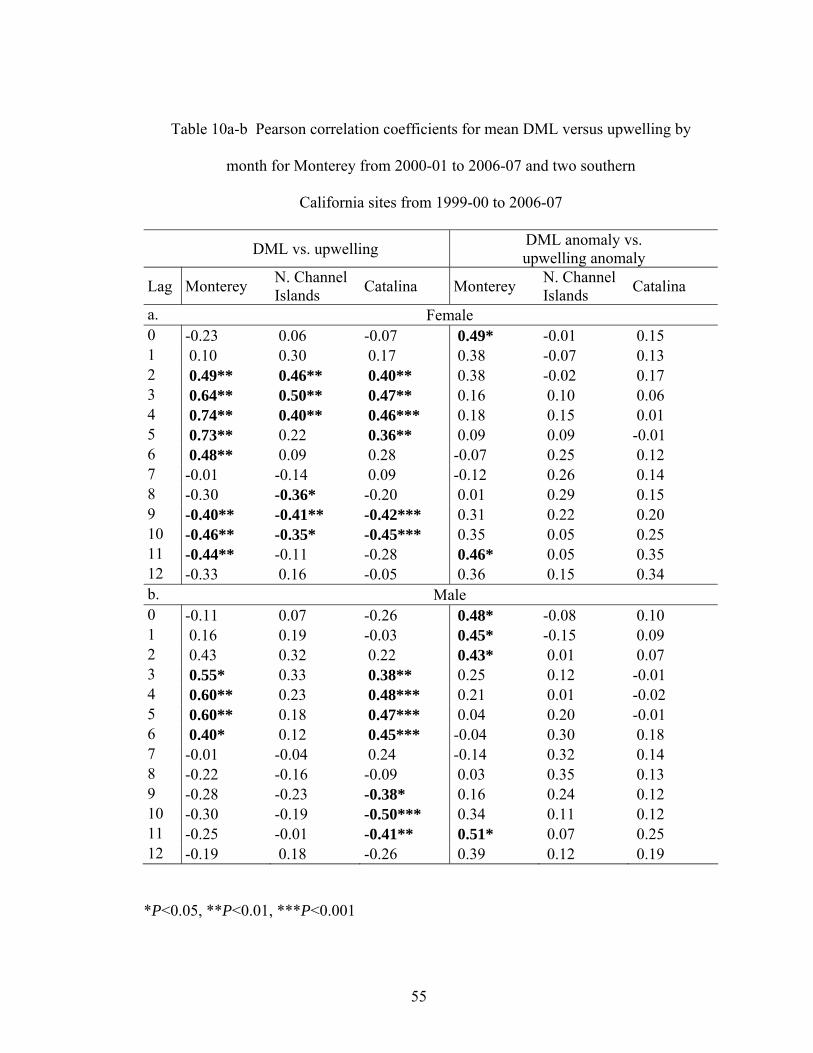
55
Table 10a-b Pearson correlation coefficients for mean DML versus upwelling by
month for Monterey from 2000-01 to 2006-07 and two southern
California sites from 1999-00 to 2006-07
DML vs. upwelling DML anomaly vs. upwelling anomaly
Lag Monterey N. Channel Islands Catalina Monterey N. Channel
Islands Catalina
a.
Female 0
-0.23 0.06 -0.07 0.49* -0.01 0.15 1
0.10 0.30 0.17 0.38 -0.07 0.13 2
0.49** 0.46** 0.40** 0.38 -0.02 0.17 3
0.64** 0.50** 0.47** 0.16 0.10 0.06 4
0.74** 0.40** 0.46*** 0.18 0.15 0.01 5
0.73** 0.22 0.36** 0.09 0.09 -0.01 6
0.48** 0.09 0.28 -0.07 0.25 0.12 7
-0.01 -0.14 0.09 -0.12 0.26 0.14 8
-0.30 -0.36* -0.20 0.01 0.29 0.15 9
-0.40** -0.41** -0.42*** 0.31 0.22 0.20 10
-0.46** -0.35* -0.45*** 0.35 0.05 0.25 11
-0.44** -0.11 -0.28 0.46* 0.05 0.35 12
-0.33 0.16 -0.05 0.36 0.15 0.34 b.
Male 0
-0.11 0.07 -0.26 0.48* -0.08 0.10 1
0.16 0.19 -0.03 0.45* -0.15 0.09 2
0.43 0.32 0.22 0.43* 0.01 0.07 3
0.55* 0.33 0.38** 0.25 0.12 -0.01 4
0.60** 0.23 0.48*** 0.21 0.01 -0.02 5
0.60** 0.18 0.47*** 0.04 0.20 -0.01 6
0.40* 0.12 0.45*** -0.04 0.30 0.18 7
-0.01 -0.04 0.24 -0.14 0.32 0.14 8
-0.22 -0.16 -0.09 0.03 0.35 0.13 9
-0.28 -0.23 -0.38* 0.16 0.24 0.12 10
-0.30 -0.19 -0.50*** 0.34 0.11 0.12 11
-0.25 -0.01 -0.41** 0.51* 0.07 0.25 12
-0.19 0.18 -0.26 0.39 0.12 0.19
*P<0.05, **P<0.01, ***P<0.001

56
Table 11a-b Pearson correlation coefficients for mean mass versus SST by month for
Monterey from 2000-01 to 2006-07 and two southern
California sites from 1999-00 to 2006-07
Mass vs. SST Mass anomaly vs. SST anomaly
Lag Monterey N. Channel Islands Catalina Monterey N. Channel
Islands Catalina
a.
Female 0
0.11 0.43** 0.39** -0.16 -0.17 -0.23 1
0.39 0.27 0.45*** 0.05 -0.30 -0.30 2
0.47* -0.05 0.39** 0.05 -0.47** -0.30 3
0.46* -0.15 0.20 0.01 -0.43** -0.33 4
0.37 -0.35* -0.09 -0.02 -0.39** -0.45** 5
0.28 -0.51** -0.33 -0.02 -0.32** -0.37** 6
0.02 -0.59** -0.56* -0.08 -0.26 -0.45*** 7
-0.15 -0.50** -0.64*** 0.27 -0.19 -0.39** 8
-0.34 -0.32* -0.51*** 0.20 -0.17 -0.19 9
-0.38 -0.05 -0.24*** 0.33 -0.13 -0.11 10
-0.34 0.18 0.04 0.22 -0.15 -0.06 11
-0.08 0.38* 0.27 0.02 -0.16 -0.05 12
0.11 0.50** 0.41 -0.28 0.04 -0.03 b.
Male 0
0.02 0.27 0.18 -0.12 -0.13 -0.14 1
0.25 0.16 0.35* -0.15 -0.23 -0.25 2
0.41 -0.05 0.42** -0.09 -0.49** -0.32 3
0.44* -0.19 0.37** -0.12 -0.48** -0.29 4
0.28 -0.32 0.15 -0.13 -0.45** -0.43** 5
0.12 -0.42** -0.07 -0.21 -0.40** -0.35* 6
-0.03 -0.46** -0.35* -0.02 -0.28 -0.42** 7
-0.12 -0.42** -0.53** 0.21 -0.27 -0.34* 8
-0.28 -0.29 -0.55*** 0.24 -0.24 -0.19 9
-0.34 -0.03 -0.44*** 0.32 -0.12 -0.14 10
-0.33 0.16 -0.22 0.19 -0.06 -0.07 11
-0.19 0.28 -0.03 -0.03 -0.04 -0.18 12
0.05 0.32 -0.19 -0.20 -0.03 -0.04 *P<0.05, **P<0.01, ***P<0.001

57
Table 12a-b Pearson correlation coefficients for mean mass versus upwelling
by month for Monterey from 2000-01 to 2006-07 and two
southern California sites from 1999-00 to 2006-07
Weight vs. upwelling Weight anomaly vs. upwelling anomaly
Lag Monterey N. Channel Islands Catalina Monterey N. Channel
Islands Catalina
a.
Female 0
-0.07 0.16 0.10 0.48** 0.02 0.09 1
0.19 0.39* 0.32* 0.39 0.01 0.04 2
0.45* 0.52** 0.52*** 0.31 0.04 0.12 3
0.53** 0.47** 0.49*** 0.10 0.04 -0.06 4
0.61*** 0.35 0.41** 0.19 0.03 -0.05 5
0.49** 0.18 0.25 -0.07 0.13 0.02 6
0.28 0.04 0.09 -0.14 0.30 0.12 7
-0.11 -0.21 -0.11 -0.23 0.29 0.17 8
-0.27 -0.36* -0.37** 0.03 0.33 0.13 9
-0.27 -0.38* -0.52*** 0.38 0.26 0.14 10
-0.31 -0.25 -0.42** 0.35 0.17 0.20 11
-0.26 0.01 -0.16 0.48** 0.12 0.26 12
-0.14 0.24 0.14 0.42* 0.08 0.22 b.
Male 0
-0.07 0.10 -0.16 0.50** -0.02 0.19 1
0.20 0.23 0.06 0.51** -0.07 0.04 2
0.43* 0.34* 0.31* 0.46* 0.06 0.09 3
0.54*** 0.32 0.41** 0.26 0.10 -0.05 4
0.58*** 0.22 0.48*** 0.22 0.06 -0.02 5
0.56* 0.19 0.43** -0.01 0.20 0.03 6
0.37 0.10 0.37* -0.06 0.29 0.21 7
-0.04 -0.04 0.13 -0.18 0.32 0.16 8
-0.23 -0.16 -0.17 0.02 0.33 0.14 9
-0.28 -0.23 -0.42* 0.25 0.23 0.13 10
-0.28 -0.16 -0.49*** 0.34 0.15 0.11 11
-0.23 -0.01 -0.34* 0.50** 0.08 0.24 12
-0.15 0.17 -0.17 0.41* 0.10 0.14 *P<0.05, **P<0.01, ***P<0.001

58
Correlations between monthly mean upwelling and opalescent squid DMLs were
significantly positive in Monterey, the northern Channel Islands, and Catalina Island for
females for lags of 2 to 6 months (see Table 10a). For males, however, the positive
correlation between mean DMLs and upwelling was only significant in Monterey and
Catalina Island (see Table 10b). Anomalies for DML and upwelling were significant in
Monterey from 0 to 2 months; however, there were no significant correlations between
anomalies for upwelling and DMLs in southern California (see Table 10b). Similar to
DML, mean body mass was negatively correlated with SST and positively correlated
with upwelling (see Tables 11-12). When SST was warm during potential hatch-months
of opalescent squid, then adult body mass was relatively smaller than if SST had been
cool during the early life stages.
Two measures of female fecundity for spawning adults were tested for
correlations with fishery landings projected from 1 to 12 months into the future around
Catalina Island from 1999-00 to 2002-03. The first measure of fecundity that was tested
was the mean fraction of released potential fecundity for each month of adult female
opalescent squid. This measure was not significantly correlated with fishery landings
that occurred 1 to 12 months later. The second measure of female fecundity, the standing
stock of oocytes, however, did have a positive correlation with fishery catch 4 to 7
months after samples were taken (Table 13). These results indicate that oocyte standing
stock may be used as a proxy to predict fishery landings projected up to 7 months into the
future.

59
Table 13 Pearson correlation coefficients for a measure of fecundity (standing stock of
oocytes) versus total catch for Catalina Island from 1999-00 to 2002-03
Projection (month) Oocytes vs. Catch 0 -0.24 1 -0.27 2 -0.30 3 -0.05 4 0.42*** 5 0.61*** 6 0.73*** 7 0.58** 8 0.23 9 -0.12 10 -0.25 11 -0.26 12 -0.09
**P<0.01, ***P<0.001
DISCUSSION
Having access to original, historic, biological data to statistically evaluate long-
term trends is uncommon. Although the opalescent squid fishery began in the mid 1800s
and the biological samples for this study were not collected until the 1940s, sampling did
begin just as fishing pressure was substantially increasing in California. The results of
this study offer insight into long-term trends in the biology of the fished population of
California’s opalescent squid.
Biological characteristics of opalescent squid tend to oscillate over time; for
instance a significant decrease in opalescent squid body size and an increase in the
proportion of males were evident in this study. Although, monthly mean opalescent

60
squid DMLs may fluctuate in excess of 20 mm within a fishing season, recorded sizes
have yet to reach the maximum average sizes of the past. Given that opalescent squid are
a valuable commodity for California’s economy and that numerous marine organisms
depend on opalescent squid as a food source, it is important to identify potential causes
for the decline in opalescent squid body size from 1948 to 2006 and the increase in the
proportion of males captured in the fishery from 1999 to 2006.
The presence of smaller opalescent squid in fishery landings may be from
individuals recruiting to the fishery at a younger age, indicating that individuals are
maturing earlier. Many exploited species have undergone such changes in age (Trippel
1995). One cause for an earlier age-at-maturity is the compensatory response where
fishing reduces population density, thereby fostering a less competitive environment for
food resources and allowing more food intake and faster growth. The explanation that an
increase in food availability may have increased growth rates in the opalescent squid
population is somewhat weak because there has been a decline in food availability over
the long-term (Roemmich and McGowan 1995). The ages of harvested opalescent squid
were not available for this analysis. Past ageing studies indicate, however, that the
longevity of opalescent squid may have decreased from the 1940s to the 2000s (Fields
1965; Spratt 1979; Butler et al. 1999; Jackson and Domeier 2003; Reiss et al. 2004).
Another factor that may have caused the decline in opalescent squid size in
Monterey could be a change in how individuals were sampled or captured by the fishery.
Since the inception of the opalescent squid fishery, a change in gear types made fishing
more efficient, fishermen’s knowledge about the behavior of opalescent squid improved,

61
technology for finding aggregations became more sophisticated, and regulations changed.
There was a shift from lampara to purse or drum seine nets in Monterey in the late 1980s
when the ban on purse seine nets was lifted. Gear types, including lampara, purse, and
drum seine nets, did not have the same mesh size and may have selectively captured
certain sizes of opalescent squid. Even though on average there was a larger mesh size
used from the 1940s to late 1980s than from the early 1990s to the mid 2000s, this still
does not explain why the maximum size in opalescent squid declined. In fact, relatively
smaller individuals (both DML and mass) were captured in the later study periods
although the mesh size was larger. Since opalescent squid from the largest sizes were
missing, the decline in monthly mean DMLs and masses cannot be solely an effect of
mesh size or gear type. In addition, the use of purse seine nets led to a decrease in actual
fishing time. Identifying opalescent squid aggregations became easier as improvements
in sonar technology allowed fishermen to discriminate between different schooling
species. With all of these improvements, fishermen have harvested a greater amount of
opalescent squid in the more recent years, thus allowing more opportunities to sample –
yet the maximum sizes were still missing from the samples.
A fishing regulation that could have affected opalescent squid size was a ban on
using lights as an attractant from 1959 to 1989 in Monterey (CDFG 2005). Considering
that in most fishing seasons opalescent squid DML was above the long-term mean from
the 1940s to the 1970s and that the ban on lights began in the middle of that time period,
lights probably did not have a significant effect on opalescent squid size.
62
From 1950 to 2007, total catch in Monterey increased starting in the mid 1980s.
Some may argue that with larger catch volumes, a greater number of relatively smaller
opalescent squid have been sampled, thereby causing the mean size to decline. This
could be the case for samples taken in 2000, but RS for Excel was used when the
sampling sizes were greatly unequal, thereby reducing the bias of sample size and
unequal variances. In addition, with more individuals being sampled from the
environment by the fishery, there should have also been a greater likelihood that the
largest individuals would be captured, but instead they were non-existent in samples
taken from the 1980s to the 2000s.
The fishing fleet may have been intercepting opalescent squid before they actually
reached the spawning grounds. This would have caused mean DMLs of sampled
opalescent squid to be smaller. The fishery occurs mainly during the night; in recent
years, however, there has been an increase in daytime fishing (unpublished DFG logbook
data). The data on maturity collected from the 1980s to the 1990s was fairly constant
through time. Even though a direct measure of maturity was not taken for the samples
from the 2000s, it was noted whether the sex was discernable. The percentage of
unknown sex in opalescent squid samples did not change, indicating that the fishery did
not intercept opalescent squid earlier in their life history or at smaller sizes.
Size-selectivity by the fishery may have played a role in the decline in opalescent
squid size. The fishing fleet captures only the largest opalescent squid, thereby leaving
the smaller individuals to reproduce and spawn offspring that may grow to a size that is
similar to their parents. The fishing industry usually targets the largest individuals

63
because buyers often will not accept relatively small opalescent squid. If the fishing
industry knows that spawning opalescent squid are too small, then they will not put forth
the effort to catch them, thereby leaving the smaller opalescent squid to spawn. The
offspring of the smaller opalescent squid may live to spawn individuals that may grow to
a size that is similar to their parents. This form of size-selective mortality leads to a
population that spawns smaller larvae through time (Conover and Munch 2002; Melville-
Smith and de Lestang 2006). Fishermen usually target the largest opalescent squid, thus
leaving the smaller individuals to reproduce, therefore the likelihood of size-selectivity
shaping the biological aspects of the opalescent squid population is also a potential factor
leading to a change in size through time. This effect could compound the gradual
decrease in food availability caused by the warm, nutrient-poor cycle of the PDO and the
increased frequency of El Niños. The cumulative affect of fishing may interfere with the
natural ability of opalescent squid to counteract the effects of a warmer, low-nutrient
environment (Jackson et al. 2001).
Among the different environmental and fishery aspects that were tested as
potential factors causing the decrease in mean opalescent squid DML, SST had the
greatest correlation with body size, which supports the findings of other studies (Jackson
and Domeier 2003; Reiss et al. 2004). When SST was warm, relative to long-term
averages, mean DML was relatively smaller from 7 to 11 months later; and when SST
was cold, mean DML was larger within the same time lag. Interestingly, the correlation
was significant up to 11 months before the time of capture, which could potentially mean
that some individuals were as old as 11 months, although the most recent ageing studies

64
have estimated opalescent squid to live to a maximum of 10 months (Butler et al. 2001).
According to the results of this study, not only was DML smaller with a warmer hatch-
month, but DML was even smaller during months that were anomalously warmer.
Opalescent squid body size was not just fluctuating with SST as a coincidence –
either SST or something related to SST, like food supply, caused some of the variability
in opalescent squid size. Opalescent squid that were estimated to hatch in cool months of
early spring grew even larger if SSTs were anomalously cooler. When SST was warmer
than usual, DML was relatively smaller. In addition to the short-term effects of SST on
opalescent squid size, a longer-term effect also was taking place. As SST increased
decadally from the 1940s to the 2000s, mean opalescent squid DML and mass decreased.
The most probable causes for the observed decline in opalescent squid size were
the limiting nature of SST and food supply during the earlier life stages of opalescent
squid. The California Current was less productive and warmer from 1977 to 2007 than it
was from 1948 to 1975. In the California Current system, SST can be inversely related to
nutrients and plankton (Roemmich and McGowan 1995). When SST increases,
zooplankton (one of the main food items of opalescent squid) decreases. Zooplankton
and pelagic finfish, the main prey items of opalescent squid (Fields 1965; Cailliet et al.
1979; Karpov and Cailliet 1979; CDFG 2005), have decreased since the 1950s
(Roemmich and McGowan 1995; Chavez et al. 2003). Not only has the SST during the
past 60 years increased, but food availability for opalescent squid also has decreased.
Upwelling and opalescent squid DML were positively correlated from 2 to 6
months and negatively correlated from 8 to 11 months, or at the beginning of the lifespan

65
of opalescent squid. A negative correlation for upwelling during the hatch-month may
correspond more to the movement of water and passive larvae transport from nursing
grounds rather than with nutrients (Zeidberg and Hamner 2002). Upwelling and
opalescent squid DML were positively correlated during their growth stage (2 to 6
months), which corresponds to the time when they would be actively feeding on
zooplankton. Upwelling would bring nutrients to the surface, causing a bloom in
phytoplankton and zooplankton, thereby increasing the food source of juvenile opalescent
squid. The absence of significant correlations between the anomalies for upwelling and
body size may signify that anomalously high upwelling within a particular season is
unlikely to correspond to larger opalescent squid DMLs.
Sampling concurrently within different geographic regions began in 1998 during
an El Niño when there happened to be a considerable decline in landings. The lack of
opalescent squid and samples continued in Monterey through the 1999-00 season;
however, CDFG samplers obtained samples from southern California during the 1999-00
La Niña. Opalescent squid DMLs and masses were significantly larger than in other
years in southern California during the first season of sampling; probably due to the
increase in nutrients and drop in SST from the 1999-00 La Niña. There was a
considerable reduction in body size in 2004-05 in Monterey, most likely due to a
decrease in food availability because there was a delay in the onset of upwelling, which
was associated with weaker winds (Goericke et al. 2005). In 2005-06, upwelling was
again reduced in Monterey, causing the size of opalescent squid to decline even further,

66
whereas mean DMLs and masses increased in both of the southern California sites as the
SST was in a cool state (Peterson et al. 2006).
Although the primary spawning periods in Monterey and southern California
occurred at different times, mean DMLs and masses fluctuated on a monthly basis in the
same pattern. Size was usually at a minimum in early spring and at a maximum in late
fall and early winter. Ageing studies conducted in southern California during 1998
(Butler et al. 1999) and from July 1998 to March 2000 (Jackson and Domeier 2003)
indicated the oldest opalescent squid were from 225 to 257 days (7.5 to 8.5 months), and
they matured as early as 129 to 163 days (4.3 to 5.4 months). Based on opalescent squid
being between 6 to 10 months old (Butler et al. 2001), the relatively largest individuals
captured in November, December, and January would have been born from February to
July during relatively cool to medium SSTs and during periods of increased food supply
due to upwelling. Relatively smaller opalescent squid caught in March, April, and May
would have been hatched from July to November during a nutrient low period with
months that were warm due to summer heat.
As shown in the correlations between opalescent squid DML and mass and
environmental variables, SST explained up to 60% of the variation in size during
potential hatch-months and upwelling was related more to the juvenile period. The lack
of a significant correlation in Monterey from 2000 to 2006 between opalescent squid
body size and environmental factors was probably due to a smaller sample size north of
Point Conception versus southern California. Due in part to a relatively short life span
and low fat content, when opalescent squid consume nutrients, the energy is used for

67
growth instead of being stored for later use (O'Dor and Webber 1986). Growth was
influenced primarily by SST and food availability due to the rapid response opalescent
squid have to fluctuations in these factors (Jackson and Domeier 2003; Reiss et al. 2004).
Interestingly, although SST was consistently cooler in Monterey than southern California,
opalescent squid size overlapped for each of the locations, even though opalescent squid
in Monterey should be larger due to the cooler SSTs. This signifies that SST explains
just a portion of the variation in size and that other variables like age, food supply, and
fishing pressure should be considered.
In Monterey from 1948 to 2006, the proportion of males incrementally increased
from the beginning of the fishing season in April to the end of the year, and then the
number of females increased at the end of the fishing season. Patterns in monthly sex
ratios indicated that one sex may have completed their spawning stage and died of natural
causes before being caught by the fishery (Starr and McCrae 1984, 1985). In other
species of Loligo, males recruit to the fishery before females (Boyle and Pierce 1994),
which may cause the number of males present at the spawning grounds to increase if the
presence of cohorts overlaps considerably.
There appeared to be an increase in the proportion of males in Monterey during
the study. Whether this was due to a decline in the number of females or an increase in
the number of males could not be determined due to the absence of an actual biomass
estimate for this species. Past studies have identified the presence of smaller, lone males
on the spawning grounds (Hanlon et al. 2004; Zeidberg 2008). These “sneaker” males
insert their spermatophores into the mantle cavity of females mating with larger males. A

68
decrease in opalescent squid size may be associated with an increase in the proportion of
males being captured by the fishery and with the paternal effect of smaller males.
Additionally, changes in fishing methods may have also caused a shift in sampled
sex ratios. Within the past few years, daytime fishing has increased, and perhaps those
schools were dominated by a particular sex. Another possibility is that catch was
dominated by males in a year when abundance was low; for instance in the 2004-05 and
2005-06 fishing seasons, catch was unusually small and sex ratios were dominated by
males. In addition, lights may affect sex ratios if one sex is more phototropic (Leos
1998). A decline in the number of females present in the ecosystem would be of great
concern because each cohort is dependent on the fecundity of females from past months.
Potential fecundity for females was directly related to DML (Macewicz et al.
2004). In Monterey, assuming that the relationship between DML and fecundity has not
changed, there was an SST induced decrease in potential fecundity associated with the
decline in body size from 1948 to 2006. Even if this may be the case, in some of the
more recent years, opalescent squid landings greatly surpassed those from the past, which
occurred because of an increase in food supply due to the presence of a La Niña and to
greater effort on the part of the fishery.
In 2005-06, potential fecundity for opalescent squid in Monterey declined to an
all time low as did the fishery for that season and the following 2006-07 season. The
decline in female fecundity and landings can be attributed to the relatively warmer SST in
Monterey and the delay and weakening in upwelling from 2004-05 to 2006-07. In
southern California from 1999-00 to 2006-07, potential fecundity was relatively lower in

69
2004-05, but this rebounded in 2005-06 to values similar to previous seasons. Landings
did not closely match the decline in DML or potential fecundity in southern California as
was seen in Monterey. Although the Monterey fishery could extend from the Farallon
Islands to Pt. Conception, it was mostly concentrated near Monterey. The southern
California fishery covered a much greater area with fishing activity occurring along the
coast from Pt. Conception to the Mexican border and around the offshore islands. A
greater area of spawning grounds and a larger number of active fishing vessels in the fleet
could explain why landings persisted through periods of lower female fecundity in
southern California.
Identifying potential causes for long-term changes in opalescent squid size is
imperative for effective fisheries management. The current management strategy for
sustainable harvest in the opalescent squid fishery involves monitoring the amount of
eggs released by females. In other words, one way for the fishery to be replenished is to
ensure that enough females have laid enough eggs before being caught by the fishery.
According to the current assessment of egg escapement by CDFG and NMFS, enough
eggs (at least 30% of potential fecundity) are being released. However if size, which is
directly related to fecundity and has been in an overall decline for at least the past 60
years, continues to decrease, there should be concern for the future health of the fishery.
One of the primary objectives of the MSFMP is to ensure the sustainable harvest
of the species. According to statewide landings for the past decade, the fishery has done
well – the resource appears to support the abundance the fishery extracts. For most
species, CPUE is not considered a reliable index for abundance. For the opalescent squid

70
fishery, however, fishermen only expend the effort to fish when opalescent squid
aggregate in abundance. Therefore, CPUE does serve as an index of the available
abundance of opalescent squid on well-known spawning grounds. CPUE in the
opalescent squid fishery has in general increased thus signifying a supposed increase in
relative abundance on the spawning grounds and perhaps an increase in the area fished.
The resource may not be able to sustain such levels of fishing pressure especially when
coupled with a decline in food availability, which may be revealed by a decline in
opalescent squid size and the proportion of females captured in the fishery.
To ensure sustainable long-term conservation of the resource, current
management for the opalescent squid fishery includes a host of measures that pertain to
catch limits, gear restrictions, and closures. The seasonal catch limit, which was set at
107,047 mt in 2005 to prevent the fishery from over-expanding, was based on a multi-
year average catch of previous seasons. To provide opalescent squid with a period of
uninterrupted spawning, a weekend closure was enacted in 1984 for Monterey and then
extended to southern California in 2000. Opalescent squid captured immediately
following the weekend fishing closure tended to have spawned more than those caught
later in the week (Leos 1998). Due to an increase in fishing pressure and the number of
vessels participating in the fishery, a restricted access program was established in time for
the 2005-06 fishing season. Gear restrictions pertain primarily to reducing any
disturbance of lights on the local communities and wildlife, not on opalescent squid
communities. In the past, however, lighting was restricted in Monterey from 1959-60 to
1987-88. Since then, lighting has been restricted to 30,000 watts.

71
In 1996-97, 1999-00, and 2000-01 landings surpassed the current catch limit,
however, the majority of the catch came from south of Pt. Conception. Since 2002,
statewide catch has not exceeded 74,000 mt, and within the past 3 fishing seasons,
landings have been extremely low in Monterey. As shown by work done by Reiss et al.
(2004), opalescent squid abundance naturally declines and then increases through time;
however, it remains to be determined if in Monterey, where the habitat for spawning is
concentrated in a relatively confined area, opalescent squid are no longer found in
abundance because prolonged exposure to artificial illumination is having a negative
effect, thereby causing a reduction in landings. The natural diel migration of opalescent
squid allows them to feed in the shallows at night in the safety of darkness from visual
predators; during the day, they remain at depth. When opalescent squid are on the
spawning grounds and are targeted by fishing vessels, they are attracted to lights, or are
phototropic.
Opalescent squid paralarvae hatch primarily during the night (Fields 1965; Vidal
et al. 2002). Similar among squid species, recently hatched young are attracted to light
and will actively swim towards any light source (Rugh 1950; Recksiek and Kashiwada
1979). Opalescent squid paralarvae, however, will not hatch when there is constant
illumination (Vidal et al. 2002). A postponement in hatching due to the presence of
lights would cause embryos to use nutrient resources from yolk globules that would
otherwise serve as their food source during the first few days of their paralarval stage. In
addition, if opalescent squid paralarvae hatch during the night and are then immediately
exposed to artificial light they will be more prone to mortality as they swim towards the

72
surface where nighttime predators are actively feeding. The effect lights have on
opalescent squid paralarvae mortality should be further investigated to determine
potential consequences for the adult population. In confined fishing areas, such as
Monterey, restricting the use of lights for a pre-determined period or adding an additional
weekday closure during the fishing season may be an alternative management option to
establishing a full seasonal closure.
We have observed that the abundance of opalescent squid declines and size
decreases in the event of anomalously warm water with the opposite occurring during
cool periods. To offset any potential compounding impacts the opalescent squid fishery
may have during nutrient-limited periods, a climate-based annual catch limitation might
be used. If an El Niño event is forecasted for the central and southern California coast,
then the capacity of a seasonal catch limit could be set in accordance to the predicted
strength of the environmental anomaly (Agnew et al. 2005). Catch limits could be set
based on strong, weak, or moderate El Niño events. This could protect the opalescent
squid that are available and also reserve those opalescent squid for other species, such as
marine mammals (Lowry and Carretta 1999), birds, and finfish, that depend on
opalescent squid as a food source (Morejohn et al. 1978; Recksiek and Frey 1978).
During cool periods, the HG could be increased to account for an increase in abundance
and to provide an opportunity for the fishery participants to benefit from the improved
conditions.
The central and southern California fisheries, however, do not respond to El Niño
events in the same capacity. For instance, following the 1982-83 El Niño, which began

73
in August 1982 and ended in June 1983, opalescent squid landings in southern California
were significantly less than landings in Monterey for the 1982-83 fishing season. In the
following two fishing seasons, 1983-84 and 1984-85, landings decreased in Monterey
and continued to be reduced in southern California. During the 1997-98 El Niño, which
began in April 1997 and ended in April 1998, landings first dropped in southern
California as was seen in the 1982-83 El Niño. Then in 1998-99 and 1999-00, landings
rose dramatically in southern California, but fell below 500 mt in Monterey. Therefore, a
climate based seasonal catch limit could be assigned separately to fishing areas north and
south of Pt. Conception. Because southern California usually experiences the effects of
an El Niño first, the climate-based catch limit for their fishing season (October to March)
could be set accordingly. In Monterey, the climate-based catch limit could be set for
March to September for two seasons following the El Niño. If future studies indicate
environmental factors are not the primary causal factor for changes in the biological
aspects of opalescent squid, then management measures could be re-evaluated (Agnew et
al. 1998).
Aside from the difference in landings in the central and southern fisheries that
occurs because of El Niño events, the fishery could be managed according to region due
to the noticeable difference in catch. According to the results of this study, opalescent
squid from the two regions were not different from one another. We can see this in
average monthly DML and mass. If patterns were to diverge in the future (as seen in sex
ratios), then managing the two areas as separate regions could be considered. The

74
seasonal catch limit of 107,047 mt could be modified to match an amount that represents
the landings of the most recent past few years for each area, not statewide.
A management option that perhaps could be pursued in the near future would be
to have a seasonal closure to protect the largest size classes of opalescent squid, thereby
allowing the largest females to spawn without interruption within a 1 or 2 month period
regardless of changing environmental conditions (Dawe and Beck 1997). In southern
California, the seasonal closure could be set for November and/ or December, when
opalescent squid are at their largest. In Monterey, the seasonal closure could be in
August and/ or September when opalescent squid are being captured and relatively larger
than earlier in the fishing season. These seasonal closures could protect the largest size
class of opalescent squid, thereby allowing a greater proportion of spawning to occur,
thus ensuring a more sustainable resource.
SUMMARY
Body size, sex ratios, and fecundity of opalescent squid captured in California’s
most valuable fishery were examined for spatial and temporal patterns and changes.
Biological samples were collected in Monterey from 1948 to 2006 and from the northern
Channel Islands and Catalina Island from 1999 to 2007. There was a significant decline
in opalescent squid DML and mass in Monterey from 1948 to 2006. Monthly opalescent
squid body size was similar among all three areas. Due to the fishing season occurring at
different times of the year within each fishing region, the Monterey fishery captured
larger individuals as the fishing season progressed from April to August, whereas the

75
southern California fishery captured the largest opalescent squid in the beginning of the
season in October.
According to past studies, opalescent squid live from 4 months to 4 years,
although most recent ageing studies indicate they have an average lifespan of 6 months.
The SST of their hatch-month can determine their ultimate size. For this study, there was
a significant correlation between potential hatch-month SST and mean DML and mass
that signified opalescent squid will be larger at catch when they are born in cooler water
and grow through months with an abundant food source. This holds true for Monterey
from 1948 to 2006 and for southern California from 1999 to 2007. Significant negative
correlations between the anomalies for SST and body size for potential hatch-months
indicated that if a winter was anomalously cooler, then opalescent squid DMLs would be
even larger. Upwelling and body size were significantly correlated during the juvenile
stage; stronger upwelling in the season would lead to larger individuals a few months
later. The anomalies were not significantly correlated, which signifies that a relative
increase in upwelling within a year will not lead to larger opalescent squid. In addition,
when CPUE was high on adults, then the fishery probably removed a greater portion of
larger individuals before they had a chance to spawn, thereby leaving smaller individuals
to spawn and generate smaller offspring in the following fishing season. The proportion
of males captured in the fishery has increased within the past 7 years in Monterey. The
potential decline in the number of females present in the fishery and a decrease in DML
are of significant concern for the sustainability of the opalescent squid population
because females are producing fewer eggs.

76
REFERENCES
Agnew DJ, Baranowski R, Beddington JR, des Clers S, Nolan CP. 1998. Approaches to
assessing stocks of Loligo gahi around the Falkland Islands. Fisheries Research 35:155-69.
Agnew DJ, Hill SL, Beddington JR, Purchase LV, Wakeford RC. 2005. Sustainability
and management of southwest Atlantic squid fisheries. Bulletin of Marine Science 76(2):579-93.
Anderson FE. 2000. Phylogenetic relationships among loliginid squid (Cephalopoda:
Myopsida) based on analyses of multiple data sets. Zoological Journal of the Linnean Society 130:603-33.
Beamish RJ, Noakes DJ, McFarlane GA, Klyashtorin L, Ivaov VV, Kurashov V. 1999.
The regime concept and natural trends in the production of Pacific salmon. Canadian Journal of Fisheries and Aquatic Sciences 56:516-26.
Bograd SJ, Digiacomo PM, Durazo R, Hayward TL, Hyrenback KD, Lynn RJ, Mantyla
AW, Schwing FB, Sydeman WJ, Baumgartner T and others. 2000. The state of the California Current, 1999-2000: forward to a new regime? CalCOFI Reports 41:26-52.
Boyle PR, Pierce GJ. 1994. Fishery biology of northwest Atlantic squid: an overview.
Fisheries Research 21:1-15. Butler J, Fuller D, Yaremko M. 1999. Age and growth of market squid (Loligo
opalescens) off California during 1998. CalCOFI Reports 40:191-95. Butler J, Wagner J, Henry A. 2001. Age of harvested California market squid. In: Marine
Region, editor. Status of the market squid fishery with recommendations for a conservation and management plan. Los Alamitos: California Department of Fish and Game; p E9-10.
Cailliet GM, Karpov KA, Ambrose DA. 1979. Pelagic assemblages as determined from
purse seine and large midwater trawl catches in Monterey Bay and their affinities with the market squid, Loligo opalescens. CalCOFI Reports 20:21-30.
Cailliet GM, Vaughan DL. 1983. A review of the methods and problems of quantitative
assessment of Loligo opalescens. Biological Oceanography 2(2-4):379-400. CDFG. 2005. Final Market Squid Fishery Management Plan submitted to the California
Fish and Game Commission March 25, 2005. Sacramento: California Department of Fish and Game Marine Region; p 525.

77
Chavez, F.P., Ryan J, Lluch-Cota SE, Niquen C M. 2003. From anchovies to sardines and back: multidecadal change in the Pacific Ocean. Science 299(5604):217-21.
Conover DO, Munch SB. 2002. Sustaining fisheries yields over evolutionary time scales.
Science 297(5578):94-6. Dawe EG, Beck PC. 1997. Population structure, growth, and sexual maturation of short-
finned squid (Illex illecebrosus) at Newfoundland. Canadian Journal of Fisheries and Aquatic Sciences 54:137-46.
Dickerson T, Leos R. 1992. California market squid. In: Leet WS, Dewees CM, Haugen
CW, editors. California's living marine resources and their utilization. Davis: Sea Grant; p 36-9.
Durazo R, Baumgartner TR, Bograd SJ, Collins CA, De La Campa S, Garcia J, Gaxiola-
Castro G, Huyer A, Hyrenbach KD, Loya D and others. 2001. The state of the CA Current, 2000-2001: a third straight La Niña year. CalCOFI Reports 42:29-60.
Evans RG. 1976. Analysis of squid (Loligo opalescens) samples from Monterey Bay and
southern California for 1974 [master's thesis]. Moss Landing (CA): Moss Landing Marine Laboratories, p 88.
Fields WG. 1965. The structure, development, food relations, reproduction, and life
history of the squid Loligo opalescens Berry. Fish Bulletin 131. Long Beach: California Department of Fish and Game; p 108.
Forsythe JW. 2004. Accounting for the effect of temperature on squid growth in nature:
from hypothesis to practice. Marine and Freshwater Research 55(4):331-339. Francis RC, Hare SR, Hollowed AB, Wooster WS. 1998. Effects of interdecadal climate
variability on the oceanic ecosystems of the NE Pacific. Fisheries Oceanography 7(1):1-21.
Goericke R, Venrick E, Koslow T, Lara Lara JR, Gaxiola-Castro G, Weise MJ, Sydeman
WJ, Valdez JG, Harvey JT, Schwing FB and others. 2007. The state of the California Current, 2006-07: regional and local processes dominate. CalCOFI Reports 48:33-66.
Goericke R, Venrick E, Mantyla A, Bograd SJ, Schwing FB, Hyuyer A, Smith RL,
Wheeler PA, Hooff R, Peterson WT and others. 2005. The state of the California Current, 2004-2005: still cool? CalCOFI Reports 46:32-71.
Hanlon RT, Kangas N, Forsythe JW. 2004. Egg-capsule deposition and how behavorial
interactions influence spawning rate in the squid, Loligo opalescens in Monterey Bay, California. Marine Biology 145:923-30.

78
Hare SR, Mantua NJ. 2000. Empirical evidence for North Pacific regime shifts in 1977 and 1989. Progress in Oceanography 47:103-45.
Hofmann EE, Powell TM. 1998. Environmental variability effects on marine fisheries:
four case histories. Ecological Applications 8(1 Suppl):S23-32. Hunt JC, Zeidberg LD, Hamner WM, Robison BH. 2000. The behaviour of Loligo
opalescens (Mollusca: Cephalopoda) as observed by a remotely operated vehicle (ROV). Journal of Marine Biological Association of the United Kingdom 80:873-83.
Isaac G, Neumeister H, Gilly WF. 2001. The effects of temperature on early life stages of
the California squid (Loligo opalescens). Monterey: California Department of Fish and Game, report; p14.
Ish T, Dick EJ, Switzer PV, Mangel M. 2004. Environment, krill and squid in the
Monterey Bay: from fisheries to life histories and back again. Deep-Sea Research II 51:849-62.
Jackson GD. 1994. Statolith age estimates of the Loliginid squid Loligo opalescens
(Mollusca: Cephalopoda): corroboration with culture data. Bulletin of Marine Science 54(2):554-7.
Jackson GD, Domeier ML. 2003. The effects of an extraordinary El Niño / La Niña event
on the size and growth of the squid Loligo opalescens off Southern California. Marine Biology 142:925-35.
Jackson JBC, Kirby MX, Berger WH, Bjorndal KA, Botsford LW, Bourque BJ, Bradbury
RH, Cooke R, Erlandson J, Estes JA and others. 2001. Historical overfishing and the recent collapse of coastal ecosystems. Science 293(5530):629-38.
Karpov KA, Cailliet GM. 1979. Prey composition of the market squid, Loligo opalescens
Berry, in relation to the depth and location of capture, size of squid, and sex of spawning squid. CalCOFI Reports 20:51-7.
Keiper CA, Ainley DG, Allen SG, Harvey JT. 2005. Marine mammal occurrence and
ocean climate off central California, 1986 to 1994 and 1997 to 1999. Marine Ecology Progress Series 289:285-306.
Kim H-J, Miller AJ. 2007. Did the thermocline deepen in the California Current after the
1976/77 climate regime shift? Journal of Physical Oceanography 37:1733-9. Klyashtorin LB. 1998. Long-term climate change and main commercial fish production
in the Atlantic and Pacific. Fisheries Research 37:115-25.

79
Kong C, Bishop TL, Larson ML, Kraus J, Taylor BL. 2004. A guide to port sampling, laboratory sampling procedures, and databases for the market squid fishery. Santa Barbara: California Department of Fish and Game, manual; p 87.
Law R. 2000. Fishing, selection and phenotypic evolution. ICES Journal of Marine
Science 57:659-68. Leos RR. 1998. The biological characteristics of the Monterey Bay squid catch and the
effect of a two-day-per-week fishing closure. CalCOFI Reports 39:204-11. Lowry MS, Carretta JV. 1999. Market squid (Loligo opalescens) in the diet of California
sea lions (Zalophus californianus) in southern California (1981-1995). CalCOFI Reports 40:196-207.
MacCall AD. 1996. Patterns of low-frequency variability in fish populations of the
California current. CalCOFI Reports 37:100-10. Macewicz BJ, Hunter JR, Lo NCH, LaCasella EL. 2004. Fecundity, egg deposition, and
mortality of market squid (Loligo opalescens). Fishery Bulletin 102:306-27. Mantua NJ, Hare SR. 2002. The Pacific Decadal Oscillation. Journal of Oceanography
58:35-44. Marinovic BB, Croll DA, Gong N, Benson SR, Chavez FP. 2002. Effects of the 1997-
1999 El Niño and La Niña events on zooplankton abundance and euphasiid community composition wihtin the Monterey Bay coastal upwelling system. Progress in Oceanography 54:265-77.
Mason JE. 2004. Historical patterns from 74 years of commercial landings from
California waters. CalCOFI Reports 45:180-90. McGowan JA, Bograd SJ, Lynn RJ, Miller AJ. 2003. The biological response to the 1977
regime shift in the California Current. Deep-Sea Research II 50:2567-82. McInnis RR, Broenkow WW. 1978. Correlations between squid catches and
oceanographic conditions in Monterey Bay, California. In: Recksiek CW, Frey HW, editors. Biological, oceanographic, and acoustic aspects of the market squid, Loligo opalescens Berry. Fish Bulletin 169. Long Beach: California Department of Fish and Game; p 161-70.
Melville-Smith R, de Lestang S. 2006. Spatial and temporal variation in the size at
maturity of the western rock lobster Panulirus cygnus George. Marine Biology 150:183-95.

80
Morejohn GV, Harvey JT, Krasnow LT. 1978. The importance of Loligo opalescens in the food web of marine vertebrates in Monterey Bay, California. In: Recksiek CW, Frey HW, editors. Biological, oceanographic, and acoustic aspects of the market squid, Loligo opalescens Berry. Fish Bulletin 169. Long Beach: California Department of Fish and Game; p 67-98.
Moser HG, Charter RL, Watson W, Ambrose DA, Butler JL, Charter SR, Sandknop EM.
2000. Abundance and distribution of rockfish (Sebastes) larvae in the southern California bight in relation to environmental conditions and fishery exploitation. CalCOFI Reports 41:132-47.
Moser HG, Charter RL, Watson W, Ambrose DA, Hill KT, Smith PE, Butler JL,
Sandknop EM, Charter SR. 2001. The CalCOFI ichthyoplankton time series: potential contributions to the management of rockfy-shore fishes. CalCOFI Reports 42:112-28.
O'Dor RK, Webber DM. 1986. The constraints on cephalopods: why squid aren't fish.
Canadian Journal of Fisheries and Aquatic Sciences 64:1591-605. Parrish RR, Tegner MJ. 2001. California's variable ocean environment. In: Leet WS,
Dewees CM, Klingbeil R, Larson EJ, editors. California's living marine resources: a status report. Oakland: University of California; p 21-8.
Peterson B, Emmett R, Ralston S, Forney KA, Benson S, Goericke R, Venrick E,
Mantyla A, Lavaniegos BE, Weise M and others. 2006. The state of the California Current, 2005-2006: warm in the north, cool in the south. CalCOFI Reports 47:30-74.
Recksiek CW, Frey HW. 1978. Background of market squid research program, basic life
history, and the California fishery. Biological, oceanographic, and acoustic aspects of the market squid, Loligo opalescens Berry. Fish Bulletin 169. Long Beach: California Department of Fish and Game; p 7-9.
Recksiek CW, Kashiwada J. 1979. Distribution of larval squid, Loligo opalescens, in
various nearshore locations. CalCOFI Reports 20:31-4. Reiss CS, Maxwell M, Hunter JR, Henry A. 2004. Investigating environmental effects on
population dynamics of Loligo opalescens in the southern California Bight. CalCOFI Reports 45:87-97.
Roemmich D, McGowan J. 1995. Climatic warming and the decline of zooplankton in
the California Current. Science 267(5202):1324-26. RS. 2006. Resampling Stats Add-in for Excel user's guide. Arlington: Resampling Stats,
Inc.; p 177.

81
Rugh R. 1950. The effect of x-radiations on squid larval tropisms. Biological Bulletin 98(3):247-53.
Scofield WL. 1924. Squid at Monterey. California Fish and Game 10:176-82. Spratt JD. 1979. Age and growth of the market squid, Loligo opalescens Berry, from
statoliths. CalCOFI Reports 20:58-64. Starr RM, Cope JM, Kerr LA. 2002. Trends in fisheries and fishery resources associated
with the Monterey Bay National Marine Sanctuary from 1981-2000. La Jolla: California Sea Grant; p 156.
Starr RM, Johnson KA, Laman EA, Cailliet GM. 1997. Fishery resources of the
Monterey Bay National Marine Sanctuary. La Jolla: California Sea Grant; p 50-51. Starr RM, McCrae JE. 1984. Squid resource assessment: annual report. Salem: Oregon
Department of Fish and Wildlife; p 39. Starr RM, McCrae JE. 1985. Market squid (Loligo opalescens) investigations in Oregon,
1983-85. Salem: Oregon Department of Fish and Wildlife; p 41. Steneck RS, Wilson CJ. 2001. Large-scale and long-term, spatial and temporal patterns in
demography and landings of the American lobster, Homarus americanus, in Maine. Marine and Freshwater Research 52(8):1303-19.
Trippel EA. 1995. Age at maturity as a stress indicator in fisheries. BioScience 45:759-
72. Vecchione M, Shea E, Bussarawit S, Anderson F, Alexeyev D, Lu C-C, Okutani T,
Roeleveld M, Chotiyaputta C, Roper C and others. 2005. Systematics of Indo-west Pacific Loliginids. Phuket Marine Biological Center Research Bulletin 66:23-6.
Venrick EL, Reid FMH, Weinheimer A, Lange CB, Dever EP. 2006. Temporal patterns
of silicious flux in the Santa Barbara Basin: the influence of north Pacific and local oceanographic processes. CalCOFI Reports 47:156-73.
VenTresca DA, Parrish RH, Houk JL, Gingras ML, Short SD, Crane NL. 1995. El Niño
effects on the somatic and reproductive condition of blue rockfish, Sebastes mystinus. CalCOFI Reports 36:167-74.
Vidal EAG, DiMarco FP, Wormuth JH, Lee PG. 2002. Optimizing rearing conditions of
hatchling loliginid squid. Marine Biology 140:117-27.

82
Vojkovich M. 1998. The California fishery for market squid (Loligo opalescens). CalCOFI Reports 39:55-60.
Zeidberg L. 2008. First observations of ‘sneaker mating’ in the California market squid,
Doryteuthis opalescens, (Cephalopoda: Myopsida). JMBA2 - Biodiversity Records 5998:Published on-line.
Zeidberg L, Hamner WM, Nezlin NP, Henry A. 2006. The fishery for California market
squid (Loligo opalescens) (Cephalopoda: Myopsida), from 1981 through 2003. Fishery Bulletin 104:46-59.
Zeidberg LD, Hamner WM. 2002. Distribution of squid paralarvae, Loligo opalescens,
(Cephalopoda: Myopsida), in the southern California bight in the three years following the 1997-1998 El Niño. Marine Biology 141:111-22.