longitudinal lfs catherine barham and paul smith ons
TRANSCRIPT
Longitudinal LFS
Catherine Barham and Paul Smith
ONS
Outline
• Introduction to LLFS• Examples of analyses• Potential quality issues• Weighting• Attrition bias and gross flows• Conclusions
Introduction to LLFS
• LFS panel structure designed for cross-sectional data
• BUT potential to link individuals• First LLFS datasets released 2001• Back to winter 1992/93• All working age people who responded at
each of the waves• Subset of variables
What can this data be used for?
• Movements between E, U and N
• Enables calculation of gross flows
• Impact of government policies
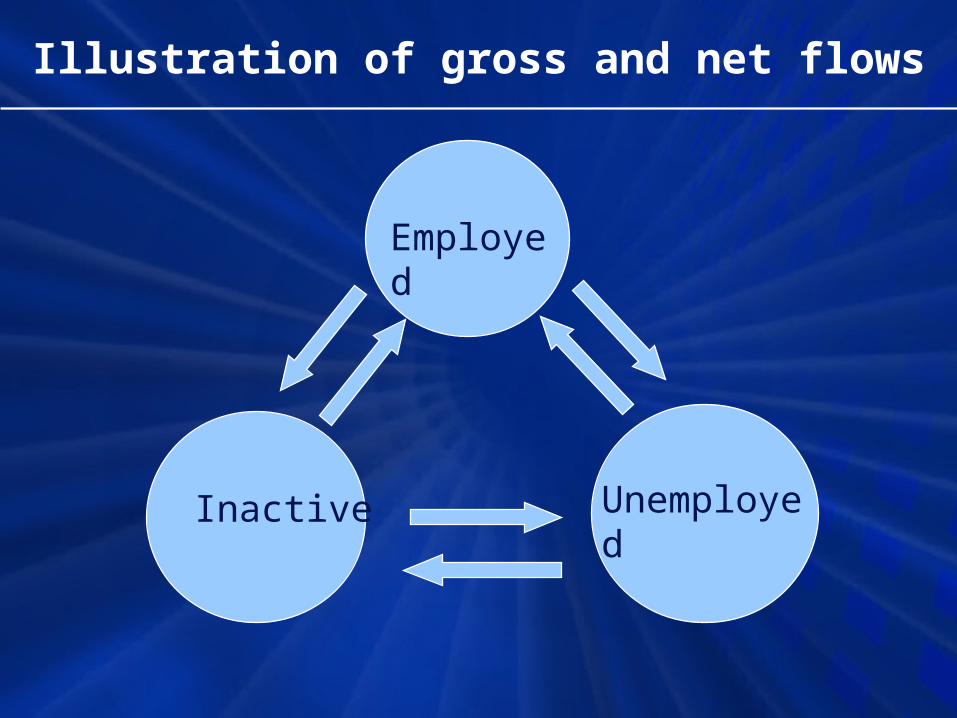
Illustration of gross and net flows
Employed
UnemployedInactive
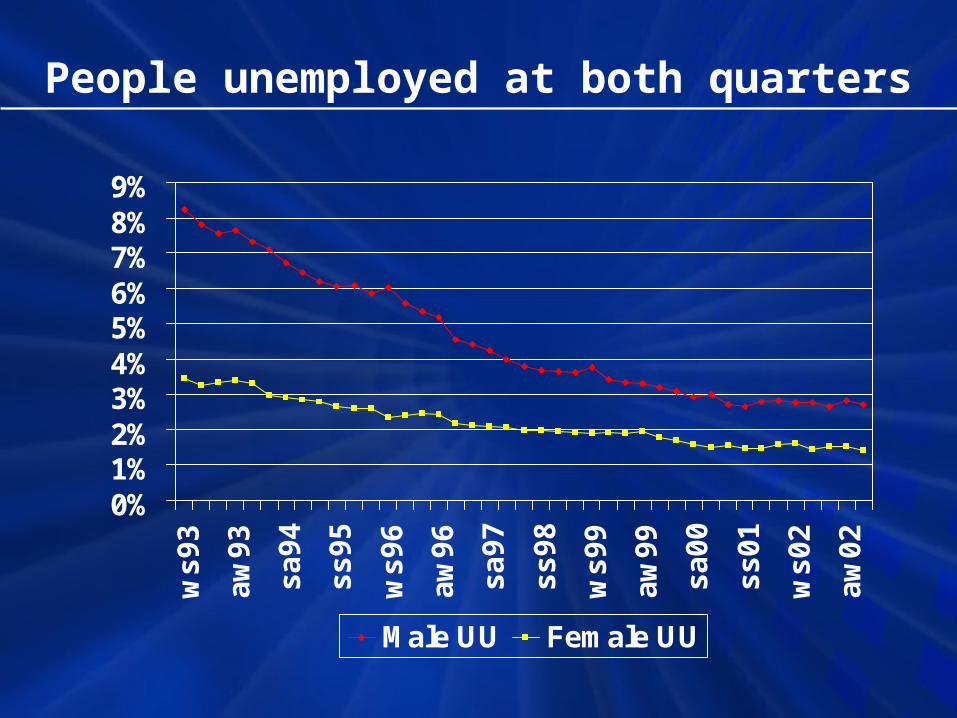
People unemployed at both quarters
0%1%2%3%4%5%6%7%8%9%w
s9
3
aw
93
sa
94
ss
95
ws
96
aw
96
sa
97
ss
98
ws
99
aw
99
sa
00
ss
01
ws
02
aw
02
Male UU Female UU

Unemployed people moving to employment and inactivity
0%
5%
10%
15%
20%
25%
30%
35%
ws93-aw93
ws94-aw94
ws95-aw95
ws96-aw96
ws97-aw97
ws98-aw98
ws99-aw99
ws00-aw00
ws01-aw01
ws02-aw02
Male UE Male UN Female UE Female UN
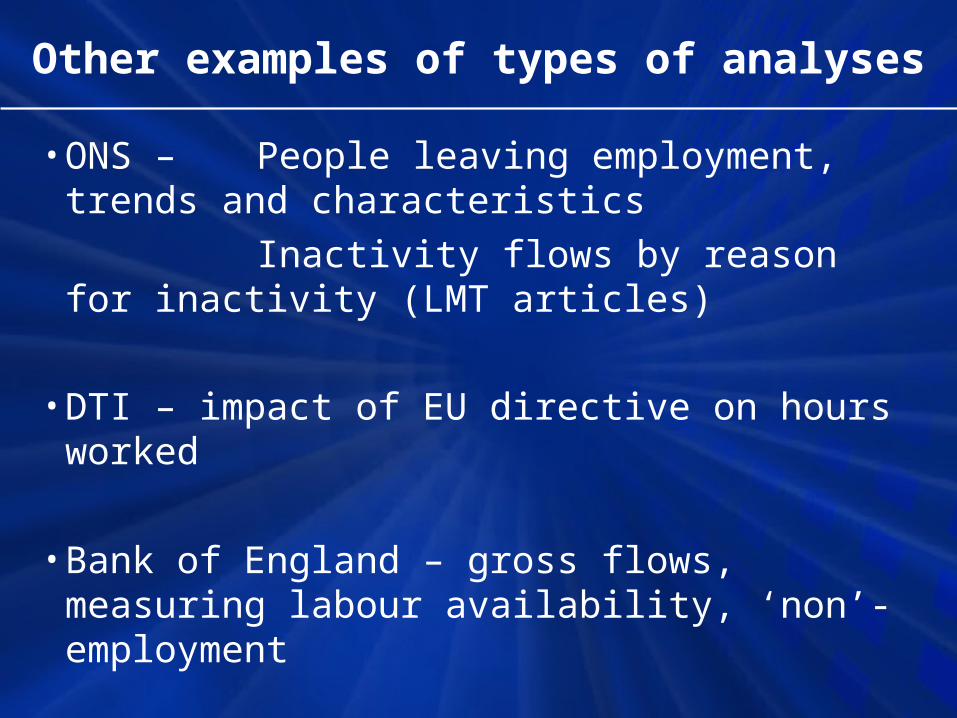
Other examples of types of analyses
• ONS – People leaving employment, trends and characteristics
Inactivity flows by reason for inactivity (LMT articles)
• DTI – impact of EU directive on hours worked
• Bank of England – gross flows, measuring labour availability, ‘non’-employment
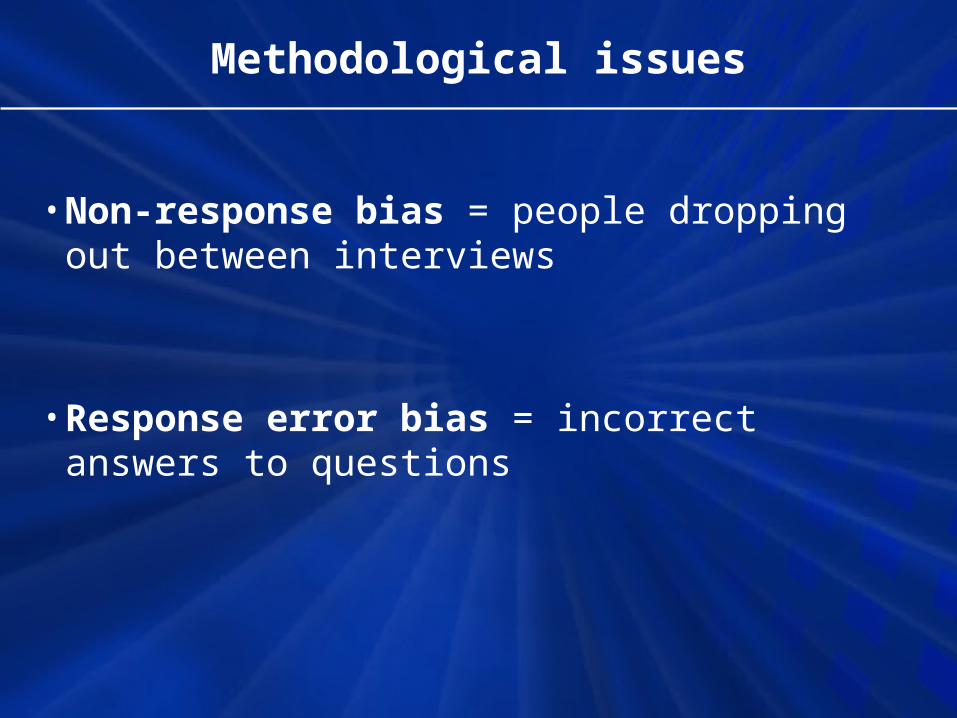
Methodological issues
• Non-response bias = people dropping out between interviews
• Response error bias = incorrect answers to questions
Response error bias
• Common survey problem, errors cancel out in cross-sectional data
• LLFS – impacts on gross flows between economic activity statuses.
• Likely to bias estimates of gross flows upwards• Transitions likely to be most affected are: U to N,
part-time E and either U or N, for women any transition involving U and for students moves between E and U
• Some inconsistencies may be caused by general volatility
Further work
• PhD thesis: Measurement error with application to the LFS, Southampton University
• Completed 2003• Main findings:
1 Existence of measurement error can result in alteration in direction of gross flows
2 Using Swedish re-interview data, it’s possible to account for the measurement error
3 More work is needed to quantify the detailed effects of this methodology on gross flows
Implications of findings
• LLFS still considered ‘experimental’
• ONS carrying out further work to investigate findings in more detail
Options for weighting
• LFS data currently weighted by– person– household
• Longitudinal dataset relies on matched households, which means
– Sample smaller (non-matches discarded)– Sample has different representation
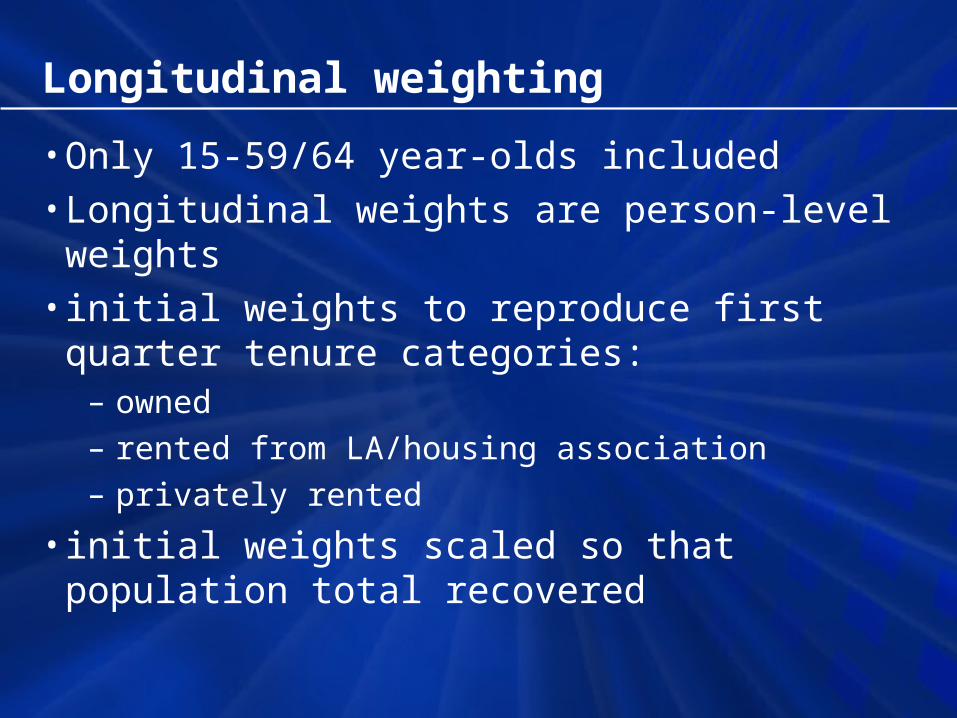
Longitudinal weighting
• Only 15-59/64 year-olds included• Longitudinal weights are person-level weights• initial weights to reproduce first quarter tenure
categories:– owned– rented from LA/housing association– privately rented
• initial weights scaled so that population total recovered
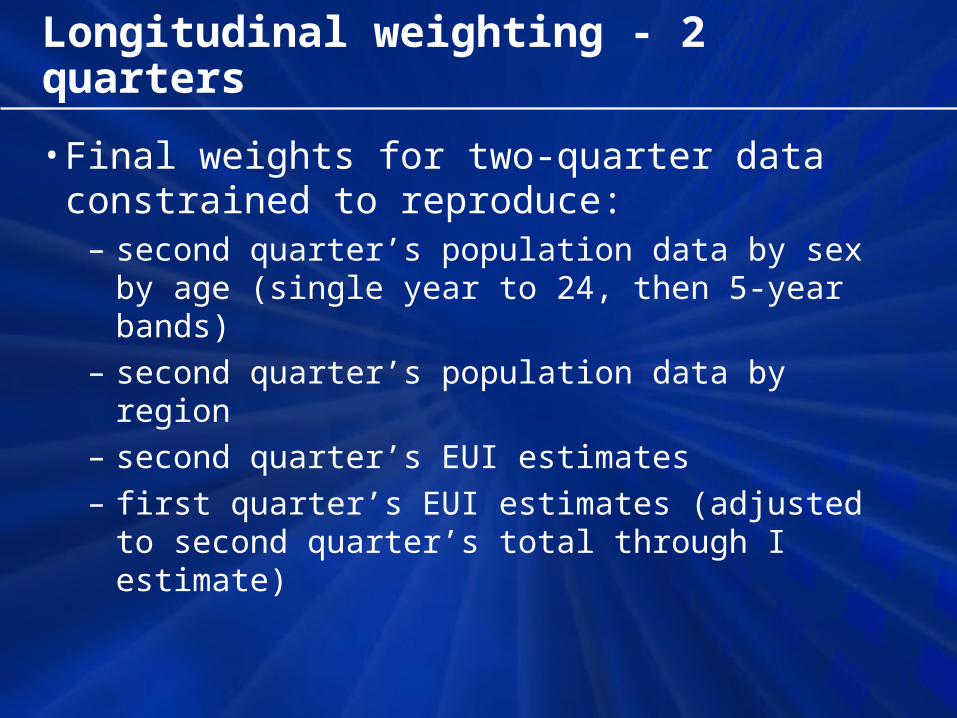
Longitudinal weighting - 2 quarters
• Final weights for two-quarter data constrained to reproduce:
– second quarter’s population data by sex by age (single year to 24, then 5-year bands)
– second quarter’s population data by region– second quarter’s EUI estimates– first quarter’s EUI estimates (adjusted to second
quarter’s total through I estimate)
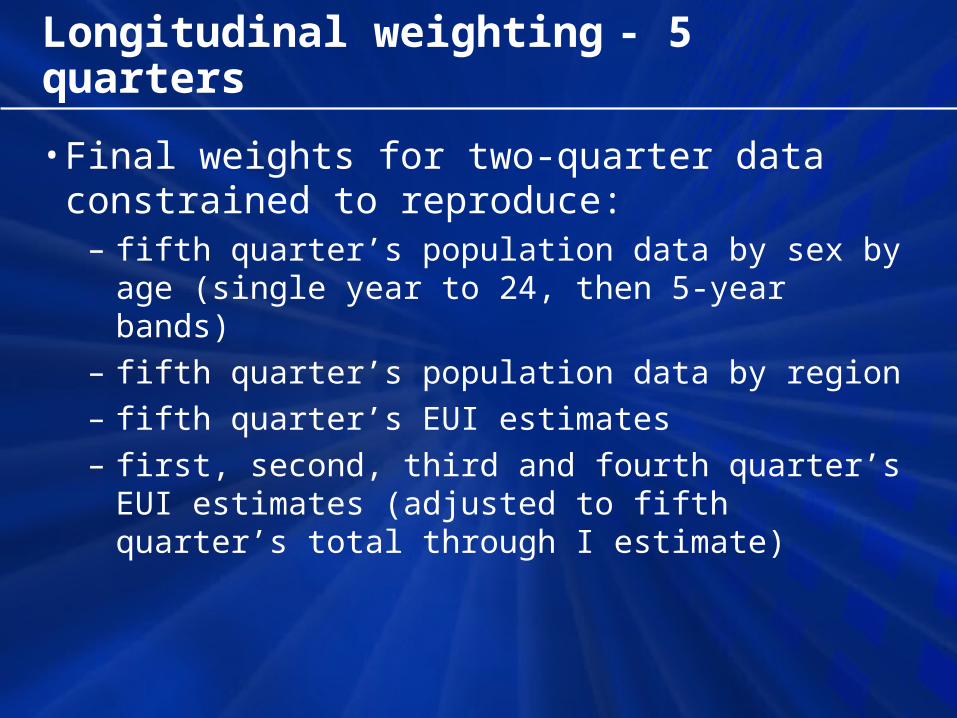
Longitudinal weighting - 5 quarters
• Final weights for two-quarter data constrained to reproduce:
– fifth quarter’s population data by sex by age (single year to 24, then 5-year bands)
– fifth quarter’s population data by region– fifth quarter’s EUI estimates– first, second, third and fourth quarter’s EUI estimates
(adjusted to fifth quarter’s total through I estimate)
How might things be different?
• LFS quality review recommended investigating “all aspects of LFS weighting”
• Household level weighting• Household basis for EUI estimates• Wave-specific weighting
Quality issues in the longitudinal data
• Measurement error • Movers
– LFS has address-based sample– movers into/out of an address do not match - excluded
from longitudinal dataset– too few movers
• Attrition bias– non-response not constant across waves– people responding in all waves more likely to have
certain characteristics– too many of these people
Weighting “solutions”
• Wave-specific weighting helps compensate for attrition bias in cross-sectional (EUI) data…
• …which are used to weight longitudinal data• General use of household weighted datasets would
promote consistency through all LFS databases• requires methodological issues to be resolved
• other solutions require resources and methodological development
Conclusions
• There are biases in gross flows data from non-response, attrition and measurement error
• It is likely that changes in gross flows will be more accurately estimated
• The longitudinal LFS still provides useful information on changing working patterns
• The quality deficiencies should be taken account of when using the data