looking under the hood: ethnic groups, parity, and … under the hood: ethnic groups, parity, and...
TRANSCRIPT

Looking Under the Hood:Ethnic Groups, Parity, and Civil War
Andreas Beger∗
Florida State University
Will H. Moore †
Florida State University
23 March 2008
This study explores the extent to which civil wars exhibit the characteristics that measuresof the ethnic composition of society’s implicitly suggest we should observe. The causalprocesses that connect the ethnic composition of a society to the probability of observing acivil war in that society are poorly articulated in the literature, yet we observe a great deal ofinterest in large-N analyses of that relationship. We examine the ethnic polarization indexin particular with the expectation that it should be a strongpredictor of the incidence of civilwar between the two largest ethnic groups in a country. Empirical analyses show a strongpositive relationship between ethnic polarization and conflict between the two largest ethnicgroups. Thus the empirical relationship between measures of polarization and the incidenceof civil war in general appears to be driven by this very strong relationship with a specificsubset of civil wars.
Paper presented at the annual meeting of the International Studies Association, San Fran-cisco, CA, 26-29 March 2008. An earlier version was presented at the Midwest PoliticalScience Association, Chicago, IL, 12-15 April 2007. This isstill a rather early manuscriptand we would gladly appreciate any comments and feedback.
∗Corresponding author. Ph.D. Student, Department of Political Science, Florida State University, 113 CollegiateLoop, Tallahassee, FL 32306-2230. [email protected].†Professor, Department of Political Science, Florida StateUniversity, 113 Collegiate Loop, Tallahassee, FL32306-2230. [email protected] would like to thank Steve Saideman for comments on an earlier version of this manuscript. All errors areof course our own.

1 Introduction
There has been a beehive of research activity studying the impact of the ethnic composition
of societies and the probability that countries will experience a civil war.1 We submit that
the causal process that connects the ethnic composition of asociety and the probability of
civil war has received inadequate attention. Posen (1993),Roe (1999), and Rose (2001) ar-
gue that when states collapse in multi-ethnic societies a security dilemma will produce civil
war, but this argument tells us nothing about the relationship between ethnic composition
(beyond a homogenous, multi-ethnic dichotomy), nor anything about when states collapse.
The primary argument driving this work appears to be an implicit expectation that seems to
have three components:
• ethnic groups view politics as a zero-sum competition;
• the size of a group’s population is strongly, positively related to its ability to compete
in politics;
• and that the risk of civil war is a positive function of either
– (a) the likelihood that two people randomly drawn from the population are from
different groups;
– or (b) the closeness to parity of the population of the largest two groups in
society.
These two implicit arguments in the third bullet are associated with two different measures
in empirical work. The first is operationalized using the ethno-linguistic fractionalization
(ELF) index, and the second is measured using some sort of a relative group size measure.
Studies that use the ELF measure frequently find that it does not have an influence on the
probability of civil war (e.g., Fearon and Laitin 2003),2 while studies that use measures
of the proportional size of the two largest groups more oftenfind support for the expec-
tation that ethnic structure influences civil war (e.g., Ellingsen 2000, Reynal-Querol 2002,
Montalvo and Reynal-Querol 2005).
1For example, see Ellingsen (2000), Sambanis (2001), Reynal-Querol (2002), Fearon (2003), Fearon and Laitin(2003), Collier and Hoeffler (2004), Fearon (2005), Montalvo and Reynal-Querol (2005), Cederman and Gi-rardin (2007) and Fearon, Kasara and Laitin (2007).2Cederman and Girardin (2007) take issue with the lack of a causal mechanism in work that relies on ELFand propose a new measure,N∗ (aka N-star). Their results appear to support the expectation that the ethniccomposition of society is associated with the probability of observing a civil war, though Fearon, Kasara andLaitin (2007) argue that the findings are specious.
1

Unfortunately, it is not clear how ethnic composition–whether the likelihood of bump-
ing into a co-ethnic or the relative size of the largest groups–might be systematically related
to civil war.3 What is sorely missing is theorizing about mobilization. Work by McGarry
(1998), Posner (2005) and Chandra and Boulet (2005) offer interesting building blocks
upon which to construct a theory connecting ethnic composition to ethnic mobilization, but
at present we lack adequate stylized facts to guide the construction of such a theory. This
paper reports the preliminary steps of a project that seeks to establish a useful set of stylized
facts that might serve such an effort. It is, unfortunately,rather nascent.
Reynal-Querol has proposed an alternative aggregate measure of ethnic diversity which
she calls the ethnic polarization4 index (Reynal-Querol 2002, Montalvo and Reynal-Querol
2005). This new index, unlike the ELF index, seems to be very strongly correlated with the
incidence of civil war. Further, it was constructed with a animplicit substantive explanation
for the relationship between ethnic heterogeneity and civil war in mind. Like power transi-
tion theory in the study of interstate conflict (Organski 1958, Organski and Kugler 1980),
Reynal-Querol argues that two ethnic groups in a country will be more likely to fight each
other as they approach parity, in terms of population size, and when they collectively com-
pose almost all of the country’s population.5 Thus the index, roughly, measures how close
a country’s distribution of ethnic groups comes to an ideal situation of two ethnic groups
that compose 50% of the population each. The expectation, which seems to be empirically
supported, is that highly polarized countries, i.e. countries with high values of the ethnic
polarization index, will be more prone to experience civil war. This RQ measure of parity
is strongly associated with the probability of observing a civil war during the second half
of the twentieth century (Reynal-Querol 2002, Montalvo andReynal-Querol 2005).
3See for example Ward and Bakke (1995, 5).4We prefer the term parity to polarization. As conventionally used polarization refers to a policy space and thedistance between the ideal points of groups. Parity, on the other hand, refers only to group size: it does notinvoke any reference to a policy space and ideal points. While it seems reasonable to think about polarization,as conventionally conceptualized, when studying the impact of the ethnic composition of society on politics,neither Reynal-Querol nor others in the large-N literaturedo so. The ethnic polarization index explicitly as-sumes that the distance between groups is 1, i.e. makes a dichotomous distinction between groups that areethnically different and those that are not (where the latter would be collapsed into the same group), rather thanfor example taking the extent to which two groups differ culturally into account (Montalvo and Reynal-Querol2005, 800)5We observe that there is debate in the literature about the impact that parity will have on war. An alternativeview suggests that a balance of power produces mutual deterrence (e.g., Waltz 1979). The spiral model, onthe other hand, suggests that balance of power produces a security dilemma, and Posen (1993), among others,contends that ethnic conflict can be usefully studied from this perspective. However, see Saideman and Zahar(N.d.) for as assurance and deterrence theory that takes issue with the security dilemma model.
2

Yet, we are struck by the fragility of the inference to some rather strong assumptions
that have yet to receive consideration in the literature. Specifically, the inference that the
ethnic structure of society, as measured by the RQ index (or any other measure of the
relative size of the two largest groups in society), is associated with the likelihood of civil
war rests on the unexamined belief that when we observe a civil war in a given country that:
• the state is dominated by one of the two largest ethnic groupsin society;6
• the other of the two largest ethnic groups has limited political influence;7
• and that the combatants in the civil war include those two groups as one another’s
enemies.
Do all three of these conditions hold for all civil wars? We began this project because we
were near certain that they do not. Do they hold for most or many civil wars? Do they
hold for those civil wars that Sambanis (2001) has identifiedas ethnic civil wars? Do they
even hold for those civil wars that Reynal-Querol’s (2002) model successfully predicts? To
the best of our knowledge, researchers have yet to ‘look under the hood’ and answer these
questions. We set out in this study to do so.
Put another way, the inference that researcher’s like Ellingsen (2000), Reynal-Querol
(2002), Montalvo and Reynal-Querol (2005), and even Cederman and Girardin (2007)8
draw leads us to expect that that the civil wars we observe in highly polarized countries
are in fact fought between the two largest groups, rather than other minor groups or non-
ethnic actors. To do so we begin by replicating Reynal-Querol’s model (albeit in country-
year rather than five year format) and establishing that the findings are robust to a number
of different operational decisions. We specifically createtwo versions of her RQ index.
In addition to using the RQ index created with her data sources, we produced a second
operationalization of her index using Fearon’s (2003) dataas the demographic input. We
use two operational measures of civil war for this replication, both from the Armed Conflict
Data Project (ACD; Uppsala/PRIO) used by Reynal-Querol. The two measures of civil
war differ in the annual death threshold that has to be met foran observation to count as a6More explicitly, we might argue that the inference rests on an implicit claim that the influence that one of thetwo largest groups exercises over national policies ispositivelydisproportionate to its share of the population.7More explicitly, we might argue that the inference rests on an implicit claim that the influence the other of thetwo largest groups exercises over national policies isnegativelydisproportionate to its share of the population.8The Cederman and Girardin (2007) study has a somewhat different causal story than the others, but theirinferences nevertheless rest on the three implicit beliefssketched above. We plan to address bothN∗ and theELF index in a future version of this study.
3

civil war: we use both the 25 deaths and 1000 deaths per year versions of ACD civil war.9
The replication in country-year format, using two versionsof the Armed Conflict Dataset
and two different implementations of the ethnic parity index, shows robust results for both
versions of the index.
Having done so we turn our attention to determining whether the cases which produce
the results meet the conditions specified above. We start with the least stringent inquiry:
we select those cases that the model predicts correctly as country-years that produce civil
war. We then use the Minorities at Risk data, Fearon’s (2003)list of ethnic groups, and
other sources10 to determine whether the state is dominated by one (or more) ethnic groups,
and to the extent that it is, determine whether that group is one of the two largest. We also
use the Minorities at Risk data to determine whether the two largest groups rebelled11, and
whether any of the other groups coded by the Minorities at Risk project for the country
rebelled.
Based on our interpretation of the theoretical underpinning of the ethnic polarization
index, we expect that the index should only predict civil wars involving the two largest
ethnic groups in a country. To further examine this proposition, we next parsed the list
of civil wars in the Armed Conflict Dataset for the subset of civil wars that was fought
between the two largest ethnic groups in a country and estimated several regression models
of the statistical relationship between ethnic polarization and the incidence of these two
different types of civil war (those fought between the two largest ethnic groups and all
others). These analyses indicate support for our proposition and appear to show that the
strong relationship between ethnic polarization and the incidence of civil war is driven by
a very strong relationship between polarization and the incidence of civil war between the
two largest ethnic groups in a country. However, this type ofcivil war only makes up a
small subset of all civil wars, thus indicating that multiple processes are at work to produce
the civil wars we observe at the aggregate country level.
The paper is organized as follows. The second section (afterthe introduction) dis-
cusses the ethnolinguistic fractionalization index (ELF)and the ethnic polarization index in
more detail. In the subsequent section we replicate the statistical relationship between eth-
nic polarization and civil war in Reynal-Querol (2002) and Reynal-Querol and Montalvo
9Although we do not report the results here, in an earlier draft of this manuscript we also examined Sambanis’(2001) ethnic and non-ethnic civil war lists, and a binary measure of civil war that we constructed using theMinorities’ at Risk data (MAR 2005a,b). The empirical findings do not change.
10This is one of the major ways in which this effort is preliminary. Our coding is based on readily available andrather general sources and we would like to devote more time to systematic research that is more case specificin order to increase our confidence in coding decisions.
11We define rebellion as a score of 4 or higher on either of thereb andrebel Minorities at Risk variables.
4

(2005) using a version of the polarization index calculatedwith Fearon’s (2003) ethno-
graphic data and examine several specific cases in some more detail. The fourth section
introduces our coding of the two different types of civil wars and a statistical examination
of how polarization relates to this new dependent variable.The fifth sections discusses
implications we derive from these analyses as well as our conclusions.
2 Some preliminaries
Most large-N studies of civil war are cast at the country level and use country-years as
the unit of observation. This presents the need for a country-level index of the degree of
a country’s ethnic diversity based on the underlying distribution of ethnic groups in that
country. In other words, we need a function to convert information on a country’s ethnic
distribution, i.e. the number of ethnic groups and each group’s population size, into a single
numerical index, usually bounded between 0 and 1 for convenience.
These national level indices of a country’s ethnic structure differ in three important
ways: (1) the conceptual definition or theoretical argumentunderlying that formula, (2) the
formula used to create a numeric index, and (3) the subnational demographic data used to
calculate the index. ELF and RQ indices differ on all three ofthese points.12
The ELF index is not explicitly based on an underlying argument about the effect
of a country’s ethnic distribution on the occurrence of conflict (Fearon, Kasara and Laitin
2007). However, the index is substantively interpreted as representing the chances that two
randomly picked individuals in a society will be from different ethnic groups, and in that
sense it represents a good measure of what we intuitively might think of as ethnic diversity.
It is calculated as:
ELF = 1−n
∑i=1
p2i (1)
wheren is the number of ethnic groups enumerated in a country, andpi is groupi’s pro-
portion of the total country population. As far as the underlying demographic data used to
construct the index is concerned, there have been a variety of different sources over time. It
was originally calculated from data collected by Soviet ethnographers in the 1960’s (Tay-
lor and Hudson 1972, Bruck and Apanchenko 1964), but more recent iterations are based
on demographic data collected by Fearon (2003) as well as Reynal-Querol (2002). Fearon
12While there are more indices of ethnic heterogeneity, we restrict our discussion to the ELF index, because it isthe most common index, and the RQ polarity index, which is thefocus of this paper.
5

(2003) identifies 822 ethnic groups in 160 countries as well as their population shares, us-
ing mainly the CIAWorld Factbook, theEncyclopedia Brittanica, and relevant Library of
Congress Country Studies. The correlation between the resulting ELF and the original ELF
calculated based on theAtlas Naradov Mirais 0.76 (Fearon 2003, 210), not a terribly high
value. We recreated the same index based on Fearon’s ethnic group data, although we made
some minor changes to correct for remainders in country’s population totals, i.e. “others”
categories in the data.13
Reynal-Querol and Montalvo also calculate an ELF index based on their own demo-
graphic data drawn fromL’etat des religions dans le mondeand theWorld Christian Ency-
clopedia(Reynal-Querol 2002, Montalvo and Reynal-Querol 2005). Werecreated an ELF
index in our data from Fearon’s ethnic data, and the correlation between the resulting index
and Reynal-Querol’s index is only 0.56. Thus the underlyingdemographic data one uses to
calcuate the ELF index makes affects the values of the index,and by extension may also
affect substantive results.
The RQ polarization (we prefer parity) index seeks to measure how close a country’s
ethnic distribution corresponds to an ideal of two groups with 50% of a country’s population
each. The underlying argument is that ethnic diversity per se is not what matters, rather it
is the extent to which the two largest ethnic groups in a country dominate the rest of the
country, yet are at or near parity in terms of population witheach other. To an extent,
it is analogous to the power parity argument in interstate relations (e.g., Organski 1958,
Organski and Kugler 1980). It seems plausible that the population size of ethnic groups is
significantly correlated with the potential capabilities of ethnic groups, and hence groups
that are near parity in size may be near parity in terms of capabilities as well. This in turn
13We used the list of ethnic groups available online. The dataset lists all ethnic groups enumerated, the countrythey are in, and the ethnic group’s relative population size, as well as some other variables. The relativepopulation size of a group is the proportion of a country’s overall population that belongs to that ethnic groupand is bound between 0 and 1. However, when summed by country,the relative population sizes in a fewcases returned a total greater than 1, and in many cases did not sum exactly to 1. Where the sum was greaterthan 1, we proportionally readjusted all group sizes so thatthey would return a sum of exactly 1 (i.e. divideeach individual group size by the sum of group sizes). In cases where the total was below one, we created an“other” category for the remainder needed to bring the totalgroup size up to one. When calculating the index,we adjusted it by weighing the contribution of the “other” category by the smallest group size, whether thatbelonged to an enumerated group or “other” category:
ELFad j. = 1−n
∑i=1
p2i6=other− pother·min(pi)
This is equivalent to splitting the “other” category intopother/min(pi) smaller groups with size min(pi), andcalculating the ELF based on that. The rationale is that although we do not know what groups constitute theremainder category, we do know that any of the groups in it will have to be smaller than the smallest enumeratedgroup.
6
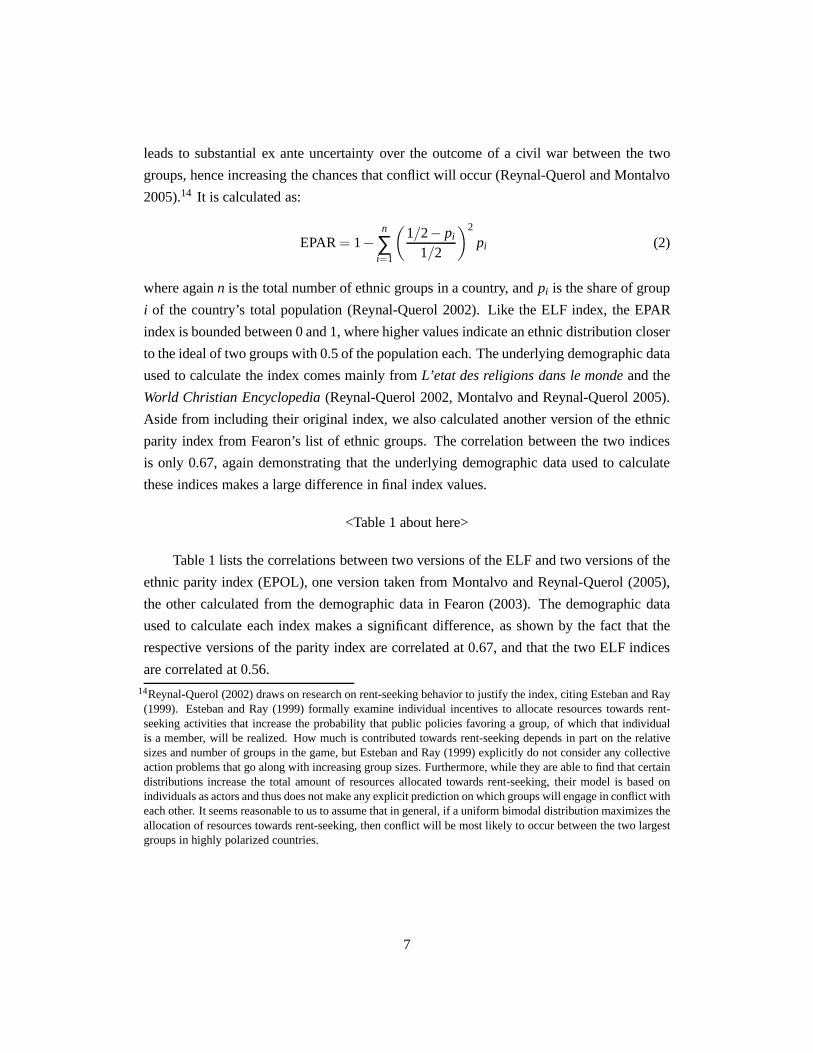
leads to substantial ex ante uncertainty over the outcome ofa civil war between the two
groups, hence increasing the chances that conflict will occur (Reynal-Querol and Montalvo
2005).14 It is calculated as:
EPAR= 1−n
∑i=1
(
1/2− pi
1/2
)2
pi (2)
where againn is the total number of ethnic groups in a country, andpi is the share of group
i of the country’s total population (Reynal-Querol 2002). Like the ELF index, the EPAR
index is bounded between 0 and 1, where higher values indicate an ethnic distribution closer
to the ideal of two groups with 0.5 of the population each. Theunderlying demographic data
used to calculate the index comes mainly fromL’etat des religions dans le mondeand the
World Christian Encyclopedia(Reynal-Querol 2002, Montalvo and Reynal-Querol 2005).
Aside from including their original index, we also calculated another version of the ethnic
parity index from Fearon’s list of ethnic groups. The correlation between the two indices
is only 0.67, again demonstrating that the underlying demographic data used to calculate
these indices makes a large difference in final index values.
<Table 1 about here>
Table 1 lists the correlations between two versions of the ELF and two versions of the
ethnic parity index (EPOL), one version taken from Montalvoand Reynal-Querol (2005),
the other calculated from the demographic data in Fearon (2003). The demographic data
used to calculate each index makes a significant difference,as shown by the fact that the
respective versions of the parity index are correlated at 0.67, and that the two ELF indices
are correlated at 0.56.14Reynal-Querol (2002) draws on research on rent-seeking behavior to justify the index, citing Esteban and Ray(1999). Esteban and Ray (1999) formally examine individualincentives to allocate resources towards rent-seeking activities that increase the probability that public policies favoring a group, of which that individualis a member, will be realized. How much is contributed towards rent-seeking depends in part on the relativesizes and number of groups in the game, but Esteban and Ray (1999) explicitly do not consider any collectiveaction problems that go along with increasing group sizes. Furthermore, while they are able to find that certaindistributions increase the total amount of resources allocated towards rent-seeking, their model is based onindividuals as actors and thus does not make any explicit prediction on which groups will engage in conflict witheach other. It seems reasonable to us to assume that in general, if a uniform bimodal distribution maximizes theallocation of resources towards rent-seeking, then conflict will be most likely to occur between the two largestgroups in highly polarized countries.
7
3 Investigating the Reynal-Querol model
3.1 A replication
To confirm the Reynal-Querol’s ethnic parity index results we estimate a basic conflict inci-
dence model similar to those in Montalvo and Reynal-Querol (2005), and produce two dis-
tinct variables that measure the index by using first the Reynal-Querol and then the Fearon
(2003) data.
The data used to run these analyses are in a country-year format, and the sample con-
sists of all countries listed in the Correlates of War state membership dataset, with a tem-
poral domain spanning 1950 to 1999. This makes for 8,290 country-year observations. The
dependent variable in the basic and subsequent models are all binary indicators of civil war
years, drawn from the UCDP/PRIO Armed Conflict Dataset (Gleditsch et al. 2002, version
4-2006b) for the basic model, but also including variables drawn from Minorities at Risk
and Doyle and Sambanis’ (2000) civil war dataset. The independent variables of interest
are the Reynal-Querol and Fearon ethnic parity indices, andto a minor extent the respective
ELF indices. The control variables include most of the usualsuspects in the civil war lit-
erature: wealth per capita, country population, mountainous terrain, contiguity, and regime
type. Since this is binary time-series cross-section data,there also is the (likely) potential
for time dependence between observations. We address this by including a variable indicat-
ing how many previous conflict years there were, a peace-spell counter, and cubic splines
(Beck, Katz and Tucker 1998).
Civil War. The dependent variable is a binary indicator of whether there was a civil
war ongoing in a given country in a given year. It is drawn fromthe UCDP/PRIO Armed
Conflict Dataset. Most measures of civil war use some arbitrary threshold of death per
annum to identify civil war-years (Sambanis 2004); the Armed Conflict Dataset codes both
low-intensity conflicts with 25 deaths per annum and high-intensity conflicts with 1000
deaths per annum, and we use both as indicated.15
Ethnic Parity and Diversity.We use both the original ethnic polarization index from
Reynal-Querol (2002) as well as one calculated from ethnic data by Fearon (2003). These
will subsequently be denoted as as RQ ethnic parity and Fearon (Fn.) ethnic parity, re-
spectively. Furthermore, we use the ELF measures from Reynal-Querol (2002) and Fearon
(2003) as well, were we again calculated the latter ourselves from Fearon’s ethnic group
15Montalvo and Reynal-Querol (2005) apparently use an older version of the Armed Conflict Dataset in theirarticle that included an intermediate intensity conflict category that was removed in the current version of thedataset (UCDP/PRIO Armed Conflict Dataset Codebook, Version 4-20062006).
8

data, and with the adjustment for remainder populations discussed previously. These two
indices will be denoted by RQ ELF and Fearon (Fn.) ELF, respectively, as well.
Wealth. Wealth, whether as a measure of state capacity (Fearon and Laitin 2003) or
otherwise, is one of the strongest and most consistent predictors of civil war incidence.
Specifically, countries that are wealthy are much less likely to experience civil war than
poorer countries. We measure it using data on real GDP per capita from Gleditsch (2002).
We log-transform (basee) the data and lag the value one year.
Country Population.This variable is also from the Gleditsch (2002) dataset. We log-
transform the variable (basee).
Mountainous Terrain and Territorial Non-contiguity.Both of these indicators come
from the Fearon and Laitin (2003) replication data set. Mountainous terrain indicates
the percentage of a country’s area that is covered by hilly ormountainous terrain. Non-
contiguous indicates whether a country has exclaves, i.e. is not territorially contiguous.
Both situations advantage potential rebels because they either favor guerilla style warfare,
and/or impede access of the central government and its conventional forces that certain
regions of the country.
Regime Type.We use a dichotomous operationalization of regime type thatis set to a
value of one when theDemo variable in the Polity IV data (Marshall and Jaggers 2002) has
a value greater than or equal to six. We also lag the value one year.
Previous wars, peace spells, and cubic splines.These are the variables created by the
Beck, Katz and Tucker (1998) routine in Stata (btscs). Previous wars is the sum of civil
war years up to the current country-year (not including the current country-year), which we
created manually ourselves. Peaceyears is a peace spell counter that increases by one for
each additional year of the country’s time-series in which the country did not experience a
civil war. Finally, we use three cubic splines with equally spaced knots in all regressions.
<Table 2 about here>
Table 2 reports the estimates.16 Both versions of the parity index, regardless of whether
produced using the Reynal-Querol data or the Fearon data, produce statistically and sub-
stantively significant coefficient estimates, thus supporting the parity results reported in
16We also ran estimates for four other dependent variables, drawn from Sambanis (2001) and the Minorities atRisk dataset. These variables are discusses in some furtherdetail below. The Fearon parity index had a signif-icant (95 % significance) and positive effect using all dependent variables, while RQ parity had a significantand positive effect for three dependent variables, failingto have a statistically significant effect when usingSambanis’ ethnic civil wars. Ethnic fractionalization (ELF), both the RQ and Fearon versions, fail to have aconsistent statistically significant effect.
9

Reynal-Querol (2002) and Montalvo and Reynal-Querol (2005). Furthermore, wealth per
capita has the expected negative and significant effect on the probability of civil war inci-
dence. The peace spell-counter and counter of previous civil war years both have statisti-
cally significant effects as well. The longer a peace spell lasts, the lower the probability
of another civil war year occurring, and conversely, the more civil war years a country has
experienced in the past, the higher the chances that it will experience one again.
Our lack of attention to more detailed examinations of the coefficient estimates is
justified by our interest in the models’ performance: the primary purpose of the analysis is to
produce predicted probabilities and then identify those cases that the model predicts well. In
the following subsection we turn to a quick examination of the summary statistics regarding
the two largest groups in countries that experience civil war. In the subsequent section we
turn to a descriptive examination of the cases that the first model predicts correctly. We
specifically determine which group (if any) dominates the state and which of the groups in
the countries engages in rebellion. These cases should reveal that one of the two largest
cases dominates the state and the other groups rebels.
3.2 Some group characteristics
Both the Fn. and R.Q. ethnic parity indices have a positive and statistically significant
impact on the incidence of low- and high-level civil conflict, as coded in the Armed Conflict
Dataset. Substantively, we would expect that the groups that fight in countries with high
parity index values are close to 0.5 of the population each, and near parity with each other.
Using the Fearon version of the ethnic parity index, we examined the sizes of the first
and second largest group in country-years during which there was a low-level civil war
according to the Armed Conflict Dataset and in countries thathad an index value of 0.75 or
above.17 The average size of the plurality group was 0.56, and the average size of the second
largest group was 0.28. The combined size of the two largest groups in a country, relative
to the country’s total population, was 0.84. These aggregate statistics do not necessarily
tell us that much about the actual parity between pairs of largest and second largest ethnic
groups, but as it turns out, on average the second largest group is only half the size of the
plurality group in that country.18 This did not strike us as constituting a particularly high
level of parity, and hence maybe warranting more investigation.
Note that because the Armed Conflict Dataset civil war variable is measured at a coun-17There were a total of 328 such observations.18The mean size of the second largest group in terms of the size of the plurality group is 0.53, with a range thatcovers 0.30 to 0.98.
10

try level, we do not have any information about what groups are actually fighting, whereas
the ethnic parity argument concerns conflict between the twolargest groups in a country.
Thus conceivably, these summary statistics might be misleading. However, when examin-
ing the country-years in high parity countries in which at least one of the two largest ethnic
groups in the country is rebeling according to the Minorities at Risk dataset, the mean size
of the second largest group to the plurality group is only 0.41, lower than before (there are
80 observations). Here, we can expect the second largest group to belessthan half the size
of the plurality group. Finally, even if we restrict ourselves only to those country-years
in which there was a low-intensity civil war according to theArmed Conflict Dataset, as
well as a civil war involving at least one of the two largest groups according to MAR (64
observations total), the mean relative size of the second largest group was 0.40. It seems,
therefore, that even in countries that have high values on the Fearon parity index and that
have experienced a civil war at the country level, or a civil war involving at least one of the
two largest groups, the actual population sizes of the two largest groups are on average not
quite that close to parity. Across these cases, we can expectthe second largest group to be
only half or less the size of the plurality group.
Although the parity argument, which underlies the parity orpolarization index, implies
that the groups fighting a civil war in highly polarized countries will be the largest and
second largest groups and that they will be near parity to each other in terms of population,
a quick glance at some summary statistics raises potential concerns. What we expect to see
at the macro-level might in fact not be what is going on withincountries, at the ethnic-group
level. As a result, we have started to further investigate what exactly is happening by coding
what groups are dominant for any given country-year, and whether a civil war observed at
country level is actually fought between the two largest groups.
3.3 The correctly predicted cases
Model 1 correctly predicts 740 civil war country-years out of 5,050 country-years, while
model 2 correctly predicts 837 out of 6,078 country-years.19 If we took out the time depen-
dence controls in the first and second models, which drive much of the models’ explanatory
19It is not unusual for models in the civil war literature to have a low predictive power. Note that Ward and Bakke(1995) report that the Fearon and Laitin (2003) model fails to produce a single country-year with anin-sampleprediction where the probability of a civil war is greater than 0.5 (the conventional threshold for expecting avalue of 1 in a probit model). In other words, the model fails to predict a single country-year in which a civilwar would occur. Most of the predictive ability of models 1 and 2 in fact comes from the time-dependencecontrols. Identical models without the time-dependence controls would have correctly predicted 74 and 65civil-war country-years respectively.
11

power, we correctly predict 74 and 65 civil war country-years. We used these restricted
models rather than the models including time-dependence controls since these drive so
much of the models’ fit. Rather than restrict our attention toonly the country-yearswe ex-
pand the inquiry to include all years in which a group rebelled (according to the Minorities
at Risk data), thereby increasing the chances that we would find evidence consistent with
the inference Reynal-Querol makes in her studies. The modelcorrectly predicts civil war
during the second half of the 20th Century in seven countries: Burma (Myanmar), China,
the Democratic Republic of Congo (Zaire), Ethiopia, India,Indonesia, and Pakistan. Table
3 reports the extent to which these seven cases exhibit the three characteristics one would
expect: the state is dominated by one of the two largest groups; the other largest group is
politically, economically, or culturally disadvantaged;and the disadvantaged group is (one
of) the rebel group(s) in the civil war. Three of the seven–Burma, China and Ethiopia–do.
This strikes us as less than a ringing endorsement.
<Table 3 about here>
Six of the seven cases meet the first characteristic: in only the Democratic Republic of
the Congo (DRC; formerly known as Zaire) were neither of the two largest groups able to
secure influence over the state equal to or greater than theirpopulation would lead one to
expect.20 But only three of the cases meet the second and third characteristics: Burma (aka
Myanmar), China, and Ethiopia.
Further, each of the three cases is marked with an asterisk inthe table because while
it exhibits the characteristic, that story is rather incomplete. In the Burmese case, while
the Burman (aka Bamar or Burmese) (68% of the population) have dominated the state, the
Minorities at Risk project codes armed groups acting on behalf of the Burman as having
rebeled three times: 1951-54, 1975-80, and 1989-94. A case where the advantaged group
is rebeling against itself does not exactly fit the scenario.That said, the second largest
group, the Shan (9% of the population), have had armed groupsrebeling on their behalf
since 1958. In addition to the Shan, the Karens (7%), the Arakanese (4%), and the Kachins
(1%) have been rebeling since 1951. Finally, the Zomis (aka Chins, 2%) rebeled between
1981 and 1994, and the Mons (2%) rebeled over the years 1985-96. Independent since
1948, Burma experienced 14 years of parliamentary government and since 1962 has been
ruled by a military regime with a socialist bent. While this case fits all three characteristics,
it is not best described as a case where one of the two largest groups dominates the state,
20The Mongo and the Bakongo are the largest two groups in Zaire (Minorities at Risk and Fearon 2003). UnderMobutu’s Zaire (1965-1997), the Ngbandi were dominant (Minorities at Risk).
12

disadvantages the other, and that group rebels, thus producing a civil war.
Turning to China, we are at a loss to explain where Reynal-Querol produced her scores
for the RQ index. Her data report an RQ index score of 0.66, yetFearon (2003) only enu-
merates Han Chinese as a group in China. They make up 92% of thepopulation or there-
abouts. The Minorities at Risk project also lists the Hui Muslims, who make up roughly
1% of the population. The Hui rebelled in 1953, but have been quiescent since. Even if one
groups the Hui with all other non-Han Chinese, the case is about as far from parity as a case
can be, so we assume there is a data entry or coding error in theReynal-Querol data (or
some error that we introduced to her data–we need to verify the source). In any case, while
we report the Chinese case as one in favor of the underlying process needed to support the
inference, we do not expect this result to withstand furtherscrutiny.
Finally, in the Ethiopian case the Oromo (37% of the population) and the Amhara
(23%) are the two largest groups. From the late 19th C throughthe end of the Haile Se-
lassie regime (1974) the Amhara and the Tigre people (9%) dominated Ethiopian politics.
The Amhara continued to be advantaged during the Marxist-oriented rule of Mengitsu, but
the Tigre were no longer so advantaged, and the Tigre rebel movement that began in 1970
successfully displaced Mengitsu in 1991. Since then the Tigrean people have been advan-
taged and the Amhara have lost their dominant status. From 1962-99 the Oromo have been
disadvantaged and have rebelled (i.e., against Selassie, Mengitsu, and the current Tigrean-
dominant regime). Thus, while the Ethiopian case fits the characteristics from the 1960s
through the early 1990s, since 1991 it no longer does. Model 1, using RQ parity, in accor-
dance with the ACD coding of the case correctly predicts civil war between the years 1986
to 1991 and from 1996 to 1999 (right censored in the data). While the first correctly pre-
dicted conflict period did in fact include conflict between the two largest groups in Ethiopia,
i.e. between Amhara and Omoro, the second correctly predicted conflict period does not.
These results are preliminary as our coding of the cases was “quick and dirty" and
is not ready for prime time. A future version of this study will contain proper coding of
the cases. Nevertheless, they cast a shadow of doubt on the validity of the inferences in
the Reynal-Querol studies. It may well be that these particular cases are odd. To probe
the issue further we turn to an evaluation of the ability of the parity index to contribute to
explaining the likelihood that a civil war starts between the two largest groups in society
and also whether it can contribute to the onset of civil war when the two largest groups in
society are not the primary combatants on opposing sides.
13

4 Ethnic and nonethnic wars
Are civil wars fought between the two largest ethnic groups in a country distinct from civil
wars fought along different cleavages? This might well be the case, and if it is, then one
would expect that a parity index would go a long way toward explaining the likelihood of
onset in the former, but have little impact on the probability of the onset of the latter. In this
section we turn our attention to this question.
4.1 The Armed Conflict Data and types of civil wars
To do so we began with the Armed Conflict Dataset (Gleditsch etal. 2002, Harbom and
Wallensteen 2007) civil wars and coded whether the cleavageseparating combatants in
those cases included the two largest ethnic groups fighting on opposite sides. The ACD
project identifies the major combatants, and we consulted the list of ethnic groups in Fearon
(2003) to determine whether any civil wars were fought between the two largest ethnic
groups. Ideally we would like to know whether the combatantsof the major sides listed in
the Armed Conflict Dataset were systematically drawn from among the two largest ethnic
groups, respectively. Of course such data are not readily available. So instead we consulted
a variety of sources, some specific to individual conflict episodes, others to the two largest
ethnic groups in a country (e.g. Minorities at Risk group reports) to identify those conflict
episodes that appear to have been fought between the two largest ethnic groups. Table 4
lists the resulting conflict episodes, including the two largest ethnic groups in that country
according to Fearon’s (2003). Out of the 414 civil war country-years from ACD in our
dataset, 118 were coded as being civil wars that were fought between the two largest ethnic
groups.
<Table 4 about here>
Based on this list we can distinguish between two different forms of civil war now.
First are those that are fought between the two largest ethnic groups in a country. The second
type includes everything else—civil wars that are fought between other ethnic groups or
between on of the two largest groups and a smaller group (e.g.Bosnian Serbs against
Bosnian Croats in the Bosnian civil war) as well as civil warsthat do not have an obvious
or clear ethnic overtone. Any given country-year can experience either form of civil war or
experience no civil war at all, making for a nominal dependent variable with three different
categories. Thus to test our hypothesis that the ethnic polarization index will be significant
(and positive) predictor of civil wars fought between the two largest ethnic groups, but not
14

other types of civil wars, we estimated several multinomialprobit models of the probability
that a given country-year will experience either type of civil war.
4.2 Empirical Results
Table 5 shows the results from two of those multinomial probit models of the probability of
civil war between the two largest ethnic groups (c.w. 2) and other types of civil wars (other
c.w.). Multinomial probit models estimate separate coefficients for each of the possible
outcomes, except the one category is used as a base or reference category. The reference
category is the absence of civil war and coefficients are interpreted in relation to this refer-
ence category. For example, a positive coefficient for (other c.w.) would indicate that that
variable increases the probability of observing a civil warthat did not involve the two largest
ethnic groups relative to the probability of not observing any civil war in that country-year
at all.
The two models shown here have the same specification as the previous models of
civil war incidence. The explanatory variables include thenatural log of per capita wealth
(lagged one year), the natural log of country population (lagged one year), the percentage of
mountainous terrain in that country, a dichotomous indicator for non-contiguous countries,
a dichotomous indicator for democracy (lagged one year), and the ethnic polarization index
(calculated using Fearon’s ethnic group list). It is somewhat less straightforward to include
time control variables in a multinomial probit or logit model because there are different
ways we could think of the time dependence here. For example,does the occurrence or
absence of one form of civil war have an effect over time on theprobability that the other
type of civil war will occur? Instead of using different timecontrols for each of the two
positive outcomes in our dependent variable (civil war between the two largest groups and
any other civil war), we estimated a simple model without time control variables (Model
5) and a second model in which we included three sets of time control variables that were
calculated using the ACD list of civil wars (Model 6; taken together, the two different
types of civil war correspond exactly to the ACD list of civilwars). These time control
variables are a counter of previous conflict years, a spell counter of how many years have
passed since the last country-year in which a civil war occurred (peaceyears), and three
cubic splines. We should note that including or excluding the time control variables does
not change our substantive interpretation of the results except with wealth per capita, which
looses statistical significance as a predictor of civil war between the two largest ethnic
groups when the time control variables are included (Model 6).
15

<Table 5 about here>
As usual, GDP per capita or wealth per capita has a strong and negative association
with the incidence of civil war, except in the case of civil war between the two largest groups
in Model 6. Furthermore, more populous countries are more likely to experience a civil war
that is not fought between the two largest groups in any givencountry year. More populous
countries tend to have a larger number of ethnic groups (correlation 0.32), but these ethnic
minorities also tend to be smaller (the correlation betweencountry population and ethnic
fractionalization is -0.37), so this positive associationmay be a result of a higher incidence
of secession attempts by small ethnic minorities on the periphery of a large country. The
coefficients for the time control variables in Model 6 have a strong association with the
incidence of either type of civil war as well. Countries thathave experience a lot of civil
war in the past are more likely to experience either form of civil war again in the future, and
the longer there has been peace in a country, the less likely the incidence of either type of
civil war.
Of real interest to us however are only the coefficients for ethnic polarization. In both
models, ethnic polarization is a very strong and significantpredictor of the incidence of civil
war between the two largest ethnic groups (both coefficient are larger than 2). At the same
time, the coefficients for the relationship between ethnic polarization and the incidence
of other types of civil war, while positive, fail to reach conventional levels of statistical
significance in both models as well. Thus as we expected, ethnic polarization is a strong
predictor of the incidence of civil war between the two largest ethnic groups in a country,
but not of the incidence of other types of civil war.
One potential implication of this finding is that the strong relationship between ethnic
polarization and the incidence of civil war in general mightbe driven to a large extent by
the very strong relationship between ethnic polarization and the subset of civil wars that
are fought between the two largest ethnic groups in a country. To empirically evaluate
this assertion we estimated two additional probit models ofthe relationship between ethnic
polarization and the incidence of civil wars that are not fought between the two largest
ethnic groups only. The results of these estimations are reported in table 6.
<Table 6 about here>
The model specification is consistent with the previous regressions and the explanatory
variables included are the same. The dependent variable is adichotomous indicator for the
presence of a civil war in any given country-year that wasnot fought between the two
16

largest ethnic groups in that country. Those civil war yearsthat were fought between the
two largest groups were recoded as zeros (alternatively we could have dropped those cases
in which a civil war was fought between the two largest ethnicgroups; this does not affect
the substantive results). There are 304 civil war country-years total, out of a total sample
of 6,078 (observations with missing data are dropped, thus resulting in this sample size).
Model 7 does not include time control variables, while Model8 includes a peace spell
counter, a counter of previous conflict years, and three cubic splines (the results for the
latter are not reported).
In both models, the only significant predictors of civil war incidence (aside from the
peace years spell counter in Model 8) are wealth per capita and country population. Wealth-
ier countries have a lower probability of civil war incidence, as do less populous ones. Both
variables have a high level of statistical significance. However, the coefficient for ethnic
polarization, while in the right (positive) direction, fails to reach any conventional levels of
significance (p = 1.65 and 1.67 respectively, using two-tailed confidence intervals). Thus
indeed, once civil wars fought between the two largest ethnic groups are taken out of the
sample, the relationship between ethnic polarization and civil war disappears.21
The implication of course is that the strong relationship between ethnic polarization
and the incidence of civil war that we found earlier (Section3.1 and results in Table 2)
appears to be driven by the strong association between ethnic polarization and conflict in-
volving the two largest ethnic groups in a country. This finding is satisfying in the sense
that we think it is what one should expect given the theoretical justification for the ethnic
polarization index. But it also raises the interesting issue of aggregating different forms of
civil war, and how to properly use the various new measures ofethnic diversity that pop up.
21We only report the results using the ethnic polarization index calculated using Fearon’s (2003) here. We alsoestimated the same models using the original Reynal-Querolmeasure of polarization, but the results were quitepuzzling—ethnic polarization is a strong predictor of civil wars that arenot fought between the two largestethnic groups, but fails to be significantly associated withthe incidence of civil war involving the two largestgroups. The results also change significantly depending on whether time control variables are included ornot, which is not the case with the Fearon version of the ethnic polarization index. A possible reason forthis discrepancy may lie in the fact that while we used Fearon’s (2003) list of ethnic groups when coding thedifferent types of civil war, Reynal-Querol uses differentethnographic data to calculate her polarization index.Thus with the Fearon version of ethnic polarization, we are using the same underlying ethnographic data toboth calculate the index values and to code the two differenttypes of civil war (fought between the two largestgroups or not). Given that the correlation between the two different versions of the polarization index is only0.67, it may be that a coding of civil wars based on her list of ethic groups would produce results that are moreconsistent with our theoretical expectations. However, wedo prefer using Fearon’s ethnographic data in thisstudy because it is readily available online and more widelyused than Reynal-Querol’s ethnographic data, thusmaking replication of our results and coding easier.
17

5 Discussion and implications
This initial effort to “look under the hood” to determine whether the inferences about the
impact of ethnic parity on the probability of civil war incidence suggests that the additional
research we plan may be fruitful. Specifically, large-N, aggregate studies cannot rule out
the possibility that civil conflict is being produced in a number of countries that have an
ethnic composition consistent with the hypothesis, but that the groups one expects to do the
fighting are not actually doing the fighting. Our project seeks to determine whether we can
rule that out. Using both a descriptive approach and a systematic statistical inquiry we have
found evidence that seems to support what we think is the implicit theoretical underpinning
for the ethnic polarization index. Specifically, we expected that highly polarized countries
should experience a high probability that the two largest ethnic groups will fight each other
in a given year, and that ethnic polarization would be a significant predictor of civil war
between the two largest ethnic groups. At the same time however, the fact that this rela-
tionship only applies in the subset of civil wars that feature conflict between the two largest
ethnic groups (118 out of 412, or 29%) raises interesting questions for the use of ethnic
polarization indices in aggregate, large-N civil war studies.
An additional implication is that different causal mechanisms may be at work to pro-
duce (ethnic) conflict in a country at the same time. There certainly seems to be a significant
subset of civil wars in which demographic parity increases the chances that the two predom-
inant ethnic groups, in their attempts to gain power over state resources, fight each other in
violent conflict. But that still leaves a large number of other civil wars, some involving con-
flicts that are systematically structured around ethnic cleavages, others that are not, to which
the theoretical foundation for ethnic polarization index does not apply. Questions one could
raise in regard to these “other” civil wars include for example whether certain patters in the
demographic distribution of ethnic minorities affect the probability of secession attempts
by ethnic minorities. It seems plausible that geographically concentrated ethnic minorities
at the periphery of a state, with a large enough population size, would be more likely to
attempt secession than groups that lack theses characteristics. Furthermore, as Kalyvas and
Kocher (2007) point out, even many ostensibly ideological conflicts, like the Vietnam War,
do involve ethnic undertones at least at the margins, creating additional room for theorizing
about the link between ethnic diversity and conflict.
This paper only reports results with respect to the ethnic parity measure developed by
Reynal-Querol. The more widely used fractionalization measure also warrants investiga-
tion, as does the recently proposedN∗ measure (Cederman and Girardin 2007). Investi-
18
gating these two indices in more detail, as Fearon, Kasara and Laitin (2007) have done in
regard toN∗, thus are possible extensions similar to this project. Given the findings we
report here, we think that it would be worthwile to examine what is going on with these
indices as well.
Ultimately the goal of research is to produce positive accounts of phenomena. The
causal mechanisms by which the ethnic composition of society might influence the prob-
ability of civil conflict is surely a story about mobilization. To date it has been under-
theorized and though they are not cast this way by the scholars who have conducted them,
large-N analyses have largely been efforts to find associations that merit explanation. Like
Cederman and Girardin (2007) we believe that the way forwardis to make explicit the im-
plicit causal claims that underpin such measures, but as Fearon, Kasara and Laitin (2007)
note, there is often more than one causal story one can tell tosupport a particular opera-
tional indicator in support of a given hypothesis. We believe that we have identified one
such causal mechanism for the parity argument and identifiedsome useful descriptive and
statistical work that will help us determine whether that account is supported by the evi-
dence. It also seems to us that more than one causal mechanismmay lead to observations
of the same outcome, i.e. civil war, at an aggregate country level. Some civil wars may
indicate conflict between the two largest groups that is facilitated by population parity, but
in many other cases, the same process is clearly not at work (e.g. the Chechnya rebellion in
Russia). Thus measures based on different underlying causal processes may not be incom-
patible with one another. But in addition to this work what weneed is efforts to produce
positive accounts. We expect that one potentially fruitfulground for developing positive
causal mechanisms in the future is located in the work of McGarry (1998), Posner (2005)
and Chandra (2006), who show that ethnicity is fluid and multi-dimensional.22 Both of
these factors are currently not reflected in existing ethnicdiversity measures.
Finally, the development of ethnic diversity measures witha more solid theoretical
foundation than the common ELF index is a positive trend in our opinion. At the same time
however, as political scientists, economists, and others continue to develop diversity indices
with explicit theoretical justifications, we think that it will become increasingly important
to actually examine the theoretical underpinnings of such indices. As we have shown in this
paper, aggregate studies using these indices and civil war may be misleading because they
cannot identify whether theoretical expectations about the actors and other characteristics
in a conflict are satisfied at a level of observation below the state/country. This creates the
danger that any statistical relationships may be spurious,and prevents us from gaining the
22See also Chandra (2001) and Chandra and Boulet (2005).
19

kinds of interesting theoretical insights that we cannot distinguish at an aggregate, country
level of observation.
20

6 Tables
Table 1: Correlations between Ethnic Diversity Measures.
Parity ELFRQ Fn. RQ Fn.
Parity, Reynal-Querol 0.67 0.61 0.36Parity, Fearon 0.67 0.50 0.12ELF, Reynal-Querol 0.61 0.50 0.56ELF, Fearon 0.36 0.12 0.56
21

Table 2: Civil War Incidence as a Function of Ethnic Parity and Fractionalization
(1) (2) (3) (4)ACD ACD ACD ACD25 25 1,000 1,000
ln(Wealth per capita)t−1 -0.135∗∗∗ -0.163∗∗∗ -0.116∗∗∗ -0.149∗∗∗
(0.041) (0.036) (0.051) (0.048)ln(Country Population) 0.055 0.052 0.082 0.084
(0.042) (0.032) (0.048) (0.036)Mountainous Terrain 0.002 0.002 0.001 0.002
(0.002) (0.001) (0.002) (0.002)Non-contiguous 0.056 0.081 -0.045 -0.044
(0.128) (0.118) (0.187) (0.161)Democracyt−1 0.039 0.050 -0.111 -0.093
(0.100) (0.094) (0.138) (0.128)Ethnic parity, RQ 0.438∗∗ 0.878∗∗∗
(0.177) (0.309)Ethnic parity, Fn. 0.523∗∗∗ 0.593∗∗∗
(0.164) (0.222)Previous Wars 0.044∗∗∗ 0.044∗∗∗ 0.032∗∗∗ 0.038∗∗∗
(0.008) (0.007) (0.009) (0.009)Peaceyears -0.750∗∗∗ -0.764∗∗∗ -0.518∗∗∗ -0.494∗∗∗
(0.051) (0.478) (0.046) (0.040)
N 5,050 6,078 5,050 6,078Log pseudolikelihood -937.979 -1,093.4558 -540.309 -683.115Wald χ2 1,135.49∗∗∗ 1,491.44∗∗∗ 517.87∗∗∗ 651.75∗∗∗
Pseudo R2 0.597 0.597 0.521 0.491Notes: Probit regression with robust standard errors clustered by country.Significance levels (two-tailed):∗∗∗ p≤ 0.01, ∗∗ p≤ 0.05, ∗ p≤ 0.10.All models include three cubic splines (coefficients not shown).
22

Table 3: Three Characteristics of the Predicted Positive Cases
Question Yes No
State dominated by one of 2 largest Burma DRC (Zaire)China∗
Ethiopia∗
IndiaIndonesiaPakistan
Other group is disadvantaged Burma DRC (Zaire)China India
Ehtiopia IndonesiaPakistan
Disadvantaged group rebels Burma∗ DRC (Zaire)China India
Ehtiopia IndonesiaPakistan
23

Table 4: Civil Wars fought between the two largest ethnic groups.
Country Years Plurality group 2nd group
Guatemala 1969-1987 Mestizo AmerindianYugoslavie 1991 Serbs Croats
1998-1999 Serbs AlbaniansChad 1965-1970 Sara ArabBurundi 1998 Hutu Tutsi
2000-2002 Hutu TutsiRwanda 1991-1992 Hutu Tutsi
1998 Hutu Tutsi2001 Hutu Tutsi
Angola 1975-2001 Ovimbundu-Ovambo Mbundu-MesticoMozambique 1981-1992 Makua-Lomwe TsongaTurkey 1992-1997 Turkish KurdsSyria 1982 Sunni Arab AlawiLebanon 1958 Shi’a Maronite
1976 Shi’a Maronite1980-1982 Shi’a Maronite
Afghanistan 1996-2006 Pashtun TajiksMyanmar 1964-1970 Burman Shan
1994 Burman ShanSri Lanka 1989-2006 Sinhalese Sri Lankan TamilsPhilippines 1978 Lowland Christian Malay Muslim Malay
1981 Lowland Christian Malay Muslim Malay2000 Lowland Christian Malay Muslim Malay
Indonesia 1953 Javanese Sunda
24
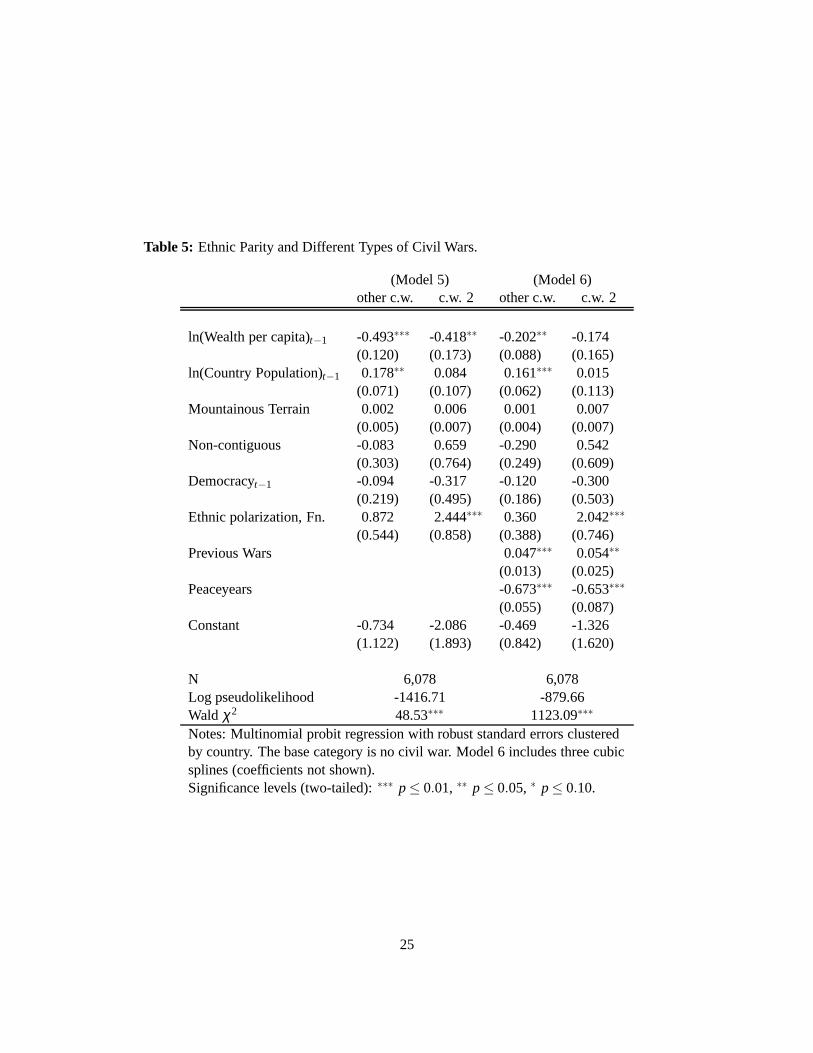
Table 5: Ethnic Parity and Different Types of Civil Wars.
(Model 5) (Model 6)other c.w. c.w. 2 other c.w. c.w. 2
ln(Wealth per capita)t−1 -0.493∗∗∗ -0.418∗∗ -0.202∗∗ -0.174(0.120) (0.173) (0.088) (0.165)
ln(Country Population)t−1 0.178∗∗ 0.084 0.161∗∗∗ 0.015(0.071) (0.107) (0.062) (0.113)
Mountainous Terrain 0.002 0.006 0.001 0.007(0.005) (0.007) (0.004) (0.007)
Non-contiguous -0.083 0.659 -0.290 0.542(0.303) (0.764) (0.249) (0.609)
Democracyt−1 -0.094 -0.317 -0.120 -0.300(0.219) (0.495) (0.186) (0.503)
Ethnic polarization, Fn. 0.872 2.444∗∗∗ 0.360 2.042∗∗∗
(0.544) (0.858) (0.388) (0.746)Previous Wars 0.047∗∗∗ 0.054∗∗
(0.013) (0.025)Peaceyears -0.673∗∗∗ -0.653∗∗∗
(0.055) (0.087)Constant -0.734 -2.086 -0.469 -1.326
(1.122) (1.893) (0.842) (1.620)
N 6,078 6,078Log pseudolikelihood -1416.71 -879.66Wald χ2 48.53∗∗∗ 1123.09∗∗∗
Notes: Multinomial probit regression with robust standarderrors clusteredby country. The base category is no civil war. Model 6 includes three cubicsplines (coefficients not shown).Significance levels (two-tailed):∗∗∗ p≤ 0.01, ∗∗ p≤ 0.05, ∗ p≤ 0.10.
25

Table 6: Ethnic Parity and Civil Wars not involving the two largest groups.
(Model 7) (Model 8)
ln(Wealth per capita)t−1 -0.348∗∗∗ -0.157∗∗∗
(0.085) (0.060)ln(Country Population)t−1 0.124∗∗ 0.131∗∗∗
(0.050) (0.042)Mountainous Terrain 0.001 0.0004
(0.004) (0.003)Non-contiguous -0.112 -0.143
(0.218) (0.169)Democracyt−1 -0.010 -0.086
(0.156) (0.127)Ethnic polarization, Fn. 0.537 0.404
(0.386) (0.292)Previous Wars 0.030
(0.031)Peaceyears -0.485∗∗∗
(0.038)Constant -0.498 -0.249
(0.797) (0.562)
N 6,078 6,078Log pseudolikelihood -963.52 -561.90Wald χ2 27.19∗∗∗ 508.06∗∗∗
Notes: Probit regression with robust standard errors clusteredby country. Model 8 includes three cubic splines (coefficientsnot shown). Significance levels (two-tailed):∗∗∗ p≤ 0.01, ∗∗ p≤ 0.05, ∗ p≤ 0.10.
26

References
Beck, Nathaniel, Jonathan N. Katz and Richard Tucker. 1998.“Taking Time Seriously:
Time-Series-Cross-Section Analysis with a Binary Dependent Variable.”American Jour-
nal of Political Science42(4): 1260–1288.
Bruck, S.I. and V.S. Apanchenko. 1964.Atlas Narodov Mira. Moscow: Glavnoe Upravlenie
Geodezii i Kartografii.
Cederman, Lars-Erik and Luc Girardin. 2007. “Beyond Fractionalization: Mapping Ethnic-
ity onto Nationalist Insurgencies.”American Political Science Review101(1): 173–185.
Chandra, Kanchan. 2001. “Ethnic Bargains, Group Instability, and Social Choice Theory.”
Politics & Society29(3): 337–362.
Chandra, Kanchan. 2006. “What is Ethnic Identity and Does ItMatter?” Annual Review of
Political Science9: 397–424.
Chandra, Kanchan and Cilanne Boulet. 2005. “Ethnic Cleavage Structures, Permanent
Exclusion and Democratic Stability.”. manuscript.
Collier, Paul and Anke Hoeffler. 2004. “Greed and grievance in civil war.” Oxford Economic
Papers56: 563–595.
Doyle, Michael W. and Nicholas Sambanis. 2000. “International Peacebuilding: A Theo-
retical and Quantitative Analysis.”American Political Science Review94(4): 779–801.
Ellingsen, Tanja. 2000. “Colorful Community or Ethnic Witches’ Brew? Multiethnicity
and Domestic Conflict during and after the Cold War.”Journal of Conflict Resolution
44(2): 228–249.
Esteban, Joan and Debraj Ray. 1999. “Conflict and Distribution.” Journal of Economic
Theory87(2): 379–415.
Fearon, James D. 2003. “Ethnic and Cultural Diversity by Country.” Journal of Economic
Growth8: 195–222.
Fearon, James D. 2005. “Civil war since 1945: Some facts and atheory.”. presented at the
annual meeting of the American Political Science Association, Washington, D.C., 1-4
September 2005.
27

Fearon, James D. and David D. Laitin. 2003. “Ethnicity, Insurgency, and Civil War.”Amer-
ican Political Science Review97(1).
Fearon, James D., Kimuli Kasara and David D. Laitin. 2007. “Ethnic Minority Rule and
Civil War Onset.”American Political Science Review101(1): 187–193.
Gleditsch, Kristian S. 2002. “Expanded Trade and GDP Data.”Journal of Conflict Resolu-
tion 46: 712–724.
Gleditsch, Nils Petter, Peter Wallensteen, Mikael Eriksson, Margareta Sollenberge and H
åvard Strand. 2002. “Armed Conflict 1946-2001: A New Dataset.” Journal of Peace
Research39(5): 615–631.
Harbom, Lotta and Peter Wallensteen. 2007. “Armed Conflict,1989U2006.” Journal of
Peace Research44(5): 623–634.
Kalyvas, Stathis N. and Matthew Adam Kocher. 2007. “Ethnic Cleavages and Irregular
War: Iraq and Vietnam.”Politics & Society35(2): 183–223.
MAR. 2005a. College Park, MD: Center for International Development and Conflict Man-
agement. Retrieved from http://www.cidcm.umd.edu/inscr/mar on 31 January 2006.
MAR. 2005b. “Minorities at Risk Dataset User’s Manual 030703.”. College Park,
MD: Center for International Development and Conflict Management. Retrieved from
http://www.cidcm.umd.edu/inscr/mar on 31 January 2006.
Marshall, Monty G. and Keith Jaggers. 2002. “Polity IV Data Set.”. [Computer file; ver-
sion p4v2002] College Park, MD: Center for International Development and Conflict
Management, University of Maryland.
McGarry, John. 1998. “‘Demographic Engineering:’ The State-Directed Movement of Eth-
nic Groups as a Technique of Conflict Regulation.”Ethnic and Racial Studies21(4): 613–
638.
Montalvo, José G. and Marta Reynal-Querol. 2005. “Ethnic polarization, potential conflict
and civil war.”American Economic Review95: 796–816.
Organski, A.F.K. 1958.World Politics. New York: Knopf.
Organski, A.F.K. and Jacek Kugler. 1980.The War Ledger. Chicago: University of Chicago
Press.
28

Posen, Barry R. 1993. “The Security Dilemma and Ethnic Conflict.” Survival35(1): 27–47.
Posner, Daniel N. 2005.Institutions and Ethnic Politics in Africa. New York: Cambridge
University Press.
Reynal-Querol, Marta. 2002. “Ethnicity, Political Systems and Civil War.”Journal of Con-
flict Resolution46: 29–54.
Reynal-Querol, Marta and José G. Montalvo. 2005. “Ethnic Polarization and the Duration
of Civil Wars.”. Manuscript.
Roe, Paul. 1999. “The Intrastate Security Dilemma: Ethnic Conflict as a 1Tragedy’?”
Journal of Peace Research36(2): 183–202.
Rose, William. 2001. “The Security Dilemma and Ethnic Conflict: Some New Hypotheses.”
Security Studies10(2).
Saideman, Stephen M. and Marie-Joëlle Zahar. N.d.Causing Security, Reducing Fear:
Deterring Intra-State Violence and Assuring Government Restraint. chapter 1.
Sambanis, Nicholas. 2001. “Do Ethnic and Nonethnic Civil Wars Have the Same Causes?:
A Theoretical and Empirical Inquiry (Part1).”Journal of Conflict Resolution45(3): 139–
161.
Sambanis, Nicholas. 2004. “What Is Civil War? Conceptual and Empirical Complexities
of an Operational Definition.”Journal of Conflict Resolution48(6): 814–858.
Taylor, C. and M. C. Hudson. 1972.The World Handbook of Political and Social Indicators.
2nd ed. New Haven, CT: Yale University Press.
UCDP/PRIO Armed Conflict Dataset Codebook, Version 4-2006. 2006. Uppsala Conflict
Data Program and Peace Research Institute, Oslo.
Waltz, Kenneth N. 1979.Theory of International Politics. New York: McGraw-Hill.
Ward, Michael D. and Kristin M. Bakke. 1995. “Predicting Civil Conflicts: On the Utility of
Empirical Research.” Presented at the Conference on Disaggregating the Study of Civil
War and Transnational Violence, University of California Institute of Global Conflict and
Cooperation, San Diego, CA, USA, 7-8 March 2005.
29