low-cost laboratory stand for turbidity measurements · elektronika ir elektrotechnika, issn...
TRANSCRIPT
ELEKTRONIKA IR ELEKTROTECHNIKA, ISSN 1392-1215, VOL. 22, NO. 1, 2016
1Abstract—Fresh water becomes scarcity not only worldwidebut also in some developed countries. Therefore there is moreand more attention paid to quality of this exceptional naturalresource. Clarity or its inverse known as turbidity is keyfeature of water characteristic. Smaller, easier to use and moreconvenient device to measure this parameter could beconstructed with significantly lowered costs thanks toimprovements in electronic components. Research presented inthis paper is aimed at constructing a laboratory stand withwhich a progress could be made in development of such device.Construction of optical system with limited set of items isdiscussed as well as design and assembly of opto-electronictransducer.
Index Terms—Optoelectronic devices, laser applications,optical sensors, pollution measurement, environmentalmonitoring.
I. INTRODUCTION
Even though recent century brought huge civilizationaladvancement and technical development, access to cleardrinking water is still an issue. Surprisingly even in Europecountries like Spain and Poland have fresh water resourcesper capita similar to Egypt. It might be postulated thatelectronic measurement systems should become morecommon for better management of this precious resource.
There are many quality factors that determine if water issuitable for specific needs. Clean water requirements areestablished in legal documents created by internationalorganisations like WHO or national bodies like EPA inUSA. To EU countries applies “Drinking Water Directive”that enumerates checklist of parameters which have to bemeasured on regular basis and turbidity is one of them [1].
Light is an electromagnetic wave and it interacts withmatter through which it is travelling. It may scatter on solidparticles that are suspended in water. Presence of suchparticles is simple yet important indicator of water quality.These suspended solid particles when in higherconcentrations cause haziness of water that is visible withnaked eye. However, water expected for consumptionshould have turbidity so low that the haziness must not beobserved without specific equipment.
Characteristic of scattering depends on particles size andwavelength of illuminating light [2]. Measured turbidity T is
Manuscript received 24 February, 2015; accepted 14 September, 2015.This research was funded by a statutory funding from the Faculty of
Electrical Engineering at Warsaw University of Technology. This researchwas performed in cooperation with the Institution.
proportional to inverse of wavelength λ of light which ispenetrating the sample. Smaller particles such as singleatoms or molecules scatter only shorter wavelengths. It isassumed that in such case light is evenly spread in alldirections. This theory is known as Rayleigh scattering andit also explains why sky has blue colour. Mie-Lorenz theorythat was developed later explains thoroughly more generalcase in which particles have size similar to the wavelengthof irradiating light [3].
Many designs of turbidity meters were proposed.Development nowadays is focused on light source, sensorsand effect of angular aligning sensor with lightpath (i.e.angular functions of scattered light) [4], [5]. Introduction oflaser as a light source improved measurements quality byterms of lowering the uncertainty [6]. Advancements inelectronics and particularly the laser technology bothenhances and simplifies multi-angular light scattering byproviding measurements with reduced truncation angle [7].Furthermore, there are in-situ, wireless systems that measurewater parameters including turbidity in fresh waterreservoirs [8], [9].
However, commercially available turbidimeters are stillquite expensive instruments. Cost of devices must dropsignificantly to make turbidity measurements moreaccessible to society. Research presented in this article is ananswer to such demand.
II. OPTICAL SYSTEM ON BREADBOARD
Optical part of stand construction consists of laser lightthat illuminates spectrophotometric cuvette which containstested sample and which is surrounded by pinholes andplastic polarisers. All components were aligned on opticalbreadboard so that light is properly coupled into a fibre.Schematic diagram of the breadboard is shown on Fig. 1.
Fig. 1. Optical breadboard diagram.
An inexpensive class 3B red diode laser module ML-33S-660-80 made by Semicon was used as a beam source. It
Low-cost Laboratory Stand for TurbidityMeasurements
Lukasz Makowski1
1Faculty of Electrical Engineering, Warsaw University of Technology,ul. Koszykowa 75, 00-662 Warszawa
http://dx.doi.org/10.5755/j01.eee.22.1.14108
49

ELEKTRONIKA IR ELEKTROTECHNIKA, ISSN 1392-1215, VOL. 22, NO. 1, 2016
provides light at 660 nm wavelength with power of 80 mW.Laser collimation is possible thanks to one movable lens outof four that form this laser optics. Having no professionallaser holder it was necessary to find another way to hold ittightly yet still maintain its positional control. This issuewas solved with slightly modified laser mount that wasoriginally designed to be an aim helper (a “finder”) forastronomical telescopes. Laser tubular enclosure withdiameter of 20 mm fits well in the holder and leaves somespace (1,5 mm) for adjustment of its position. Laser holdercan be rotated and moved in Z axis. It might be secured inone position with PF175 clamping fork made by Thorlabs.Final assembly of laser in mount is presented on Fig. 2.
Fig. 2. Inexpensive laser mount used in astronomy adapted to opticalbreadboard. Thorlabs PF175 clamping fork holds it in place.
High quality spectrophotometric glass cuvette is used tohold a material under test. Its light path length equals 10mm. Sides of the cuvette are matted to be semitransparent.A cap made of Teflon helps to keep the material clean fromdust that could otherwise contaminate sample. Cuvetteholder was constructed in the lab. Its first version was madeof stiff foam and it also worked as early variant of pinholesmount.
Light beam goes through a round pinholes of 0,6 mmdiameter that were crafted in the lab. These componentsminimize light artefacts and narrow the beam diameter.Former pinholes were made in several layers of polarizingfoil epoxied onto aluminium sheet. Such pinhole was putinto slice in the foam so that it was possible to move it inYZ plane and rotate along X axis. Once placed it remainedin position quite reliably so this solution worked outsurprisingly well. However, impossibility to move pinholesalong X axis - to move it towards or further from cuvettewere reason to try a different approach.
Current pinholes were drilled in steel sheet and then smallpieces of polarizing foil were attached on both pinholes.Such package was epoxied to SM05PT threaded adapterwhich fits SMR05 holder. By rotating an adapter to which apinhole with polariser is attached it is possible to attenuatelight of the laser. Therefore in current system top power thatleaves the pinhole might be set and so a maximum light thatcan enter the fibre as well. Adjusting this value providessome control over peak voltage provided to ADC in light-to-voltage converter circuit. SMR05 is placed on post with postholder so now it is possible to adjust pinholes positions in allplanes and rotate it along Z axis and along beam axis.
As an early version of the cuvette-and-pinholes holder cut
in foam became obsolete it was decided to construct newversion just for the cuvette. Now it is made of bended steelstripe that was covered with heat shrink for glass safety andthen screwed onto solid pedestal pillar. It might be moved inthe breadboard plane. Moving along Z axis is not thatimportant as cuvette height creates tolerance for elevation ofother optical components. Final arrangement of opticalcomponents is shown on Fig. 3. Scattering of laser lightmight be observed in the cuvette that was holding somesample.
Fig. 3. Elements on optical breadboard. Laser (not shown) operates fromthe left. Then from left to right: polariser with pinhole on post, cuvette onpost, second polariser with pinhole, fibre entry point.
Preliminary experiments with professional glass fibre(125 μm of diameter) proved that without more advancedlaunch platform it is hardly possible to correctly couple thelight into fibre. Perhaps it is possible with components thatare currently available to author but so far there was nosuccess. Therefore simpler alternative with plastic fibre wasused and it proved to be low-cost yet reliable solution.
III. CONSTRUCTION OF ELECTRONIC TRANSDUCER
Fibre is used to transmit light to an optoelectronictransducer with which a measurement is performed. Mainelement of the transducer board is Texas InstrumentsOPT101 amplified photodiode. This chip should beconsidered inexpensive but effective solution in manydesigns. Its photodiode area is larger than 5,22 mm2 and ithas responsivity higher than 0,45 A/W at 660 nmwavelength that was used in this project. Thanks to thesefeatures it is relatively easy to couple light coming out of theother side of the fibre. Chip is enclosed in translucent DIPpackage and one must only avoid to illuminate those partswhich are not photodiode.
Fig. 4. Re-used fibre connectors that proved to be very convenient whenlight from fibre needs to be coupled onto DIP8 package (not shown, belowsocket).
50
ELEKTRONIKA IR ELEKTROTECHNIKA, ISSN 1392-1215, VOL. 22, NO. 1, 2016
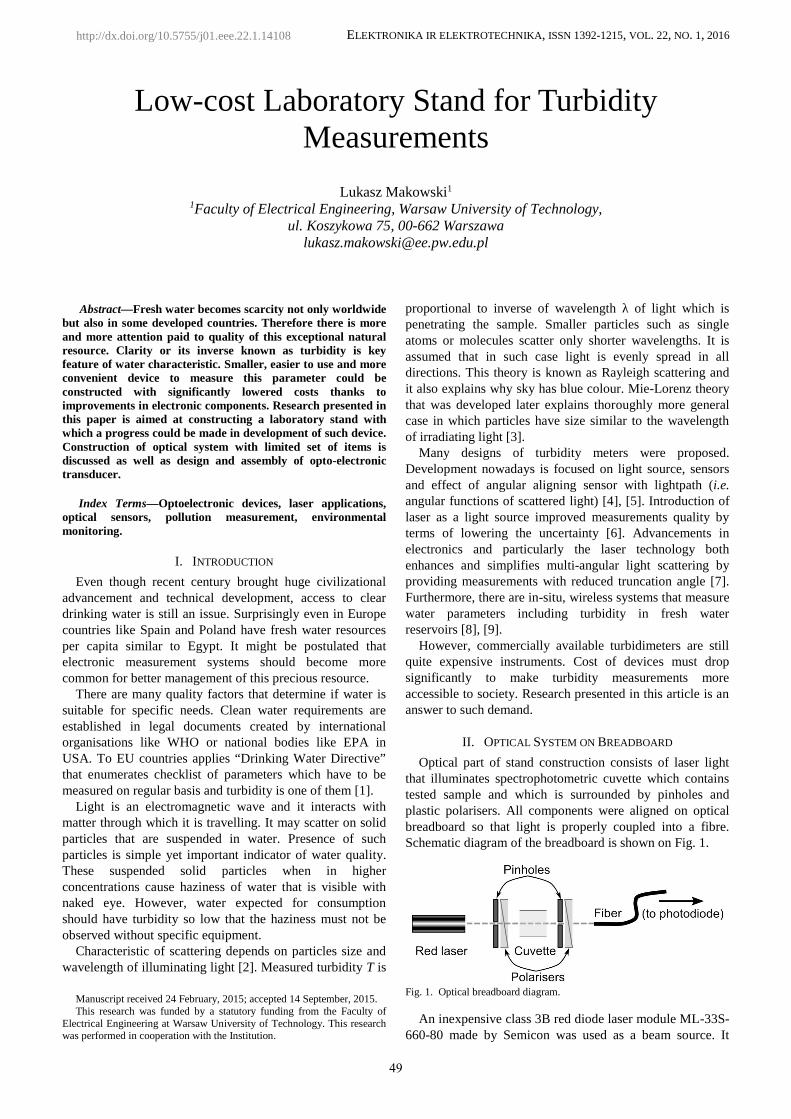
Strong light directed towards non sensitive parts of thechip might alter its behaviour. If one thinks of someprotection against such situation then a small bush or snapfit epoxied to chip should help. OVKD02 female socketmade by Hirschmann (now Belden subsidiary) was reusedhere. It proved to be very handy as it quite accurately snapfits DIP8 package of OPT101 from above. Therefore light islead in a way that it affects only proper area of chip due tosmall distance between end of the fibre and OPT101photodiode. OVKD02 socket embedded in transducer caseand OVKS fibre male connector are shown on Fig. 4.Photodiode, socket and fibre plug still can be easilydisassembled for maintenance and transport.
Fig. 5. Circuit diagram of optoelectronic transducer for turbiditymeasurements. Decoupling capacitors removed to make the figure neat.
Electronic circuit created for this project follows guidepresented in OPT101 datasheet. Its diagram is shown onFig. 5. Bipolar 3,3 V supply was used to match it with XBeeboard.
In turbidimeters an ambient light might cause a problemas it introduces some undesirable base offset. Fighting strayand ambient light which can enter the enclosure would bepointless as the same light might get into the fibre and findits path to photodiode anyway. Therefore an adjustmentcircuit is needed so it is possible to counteract this “darkerror”. With OPT101 it is possible to change referencevoltage at photodiode anode which is accessible at pin 8. Itis supplied through OPA177 that is fed by potentiometervoltage divider. Position of a wiper can be changed with dialthat is installed on the front panel so user can calibrateoutput voltage to 0 V in case when sample is pure, de-ionized water.
OPT101 output is available through unity gain operationalamplifier working as a buffer. It is connected to BNCconnector placed in front panel and also to 10-bit ADC inputof the Xbee which is an inexpensive wireless interface basedon IEEE 802.15.4 standard. Data is collected remotely andtransmitted to PC computer to which a similar XBee boardis connected. Programs to collect and process received datawere written in Python language.
User can choose one of seven gains with a knob switchmounted on front panel. Two lowest gains that are fractional
gains of 0,05 and 0,1 turned out to be the most useful forturbidity values in tested range that was up to 800 NTU(Nephelometric Turbidity Unit). Different and lessexpensive laser with lower power could be used on highergains and for smaller turbidities. To increment board supplyis another choice but then transducer output exceedssampling range of the XBee.
Fig. 6. Prototype version of the device with top lid removed. Transducerboard is in the front with OPT101 visible in the middle. XBee board is atthe back.
Board was designed with popular and cost-free version ofCadSoft Eagle. After manual soldering it was arrangedtogether with XBee board in single enclosure. Finalprototype of the assembled device is presented on Fig. 6.
IV. RESULTS
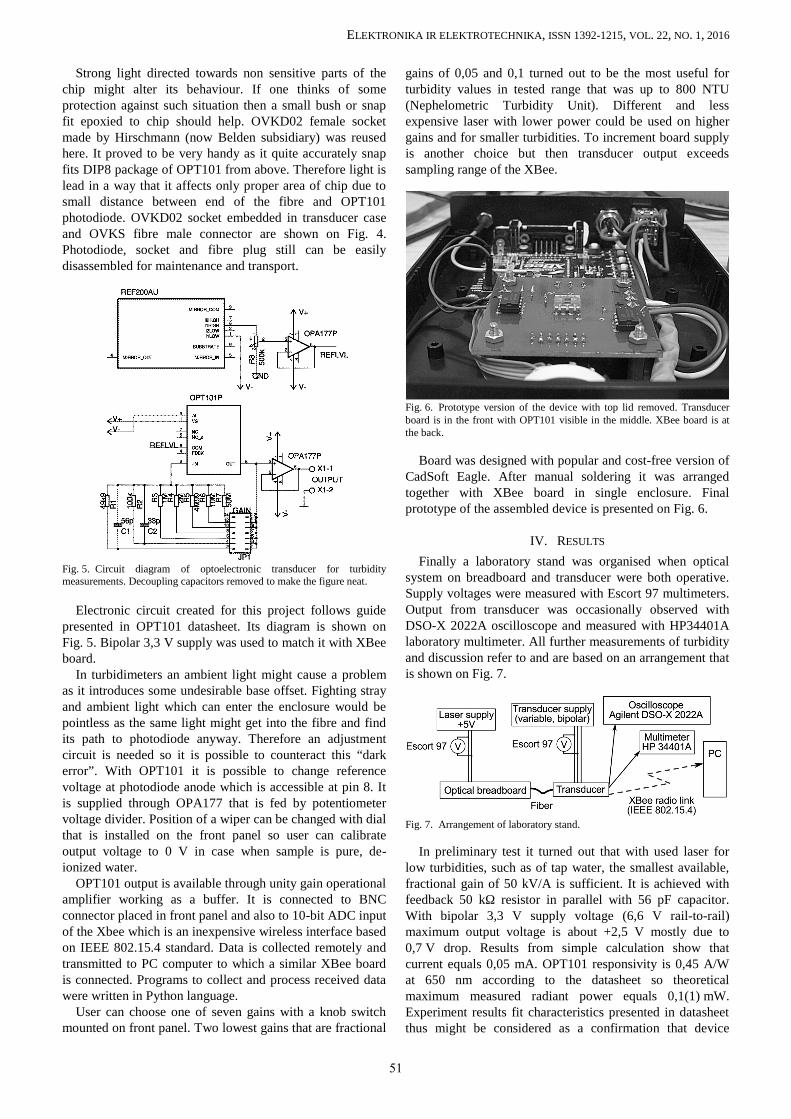
Finally a laboratory stand was organised when opticalsystem on breadboard and transducer were both operative.Supply voltages were measured with Escort 97 multimeters.Output from transducer was occasionally observed withDSO-X 2022A oscilloscope and measured with HP34401Alaboratory multimeter. All further measurements of turbidityand discussion refer to and are based on an arrangement thatis shown on Fig. 7.
Fig. 7. Arrangement of laboratory stand.
In preliminary test it turned out that with used laser forlow turbidities, such as of tap water, the smallest available,fractional gain of 50 kV/A is sufficient. It is achieved withfeedback 50 kΩ resistor in parallel with 56 pF capacitor.With bipolar 3,3 V supply voltage (6,6 V rail-to-rail)maximum output voltage is about +2,5 V mostly due to0,7 V drop. Results from simple calculation show thatcurrent equals 0,05 mA. OPT101 responsivity is 0,45 A/Wat 650 nm according to the datasheet so theoreticalmaximum measured radiant power equals 0,1(1) mW.Experiment results fit characteristics presented in datasheetthus might be considered as a confirmation that device
51

ELEKTRONIKA IR ELEKTROTECHNIKA, ISSN 1392-1215, VOL. 22, NO. 1, 2016
works properly.Base materials for further experiments were 200, 500 and
800 NTU water suspensions of formazine that are traceableto Polish national reference standard. All were ordered fromprofessional chemical laboratory that prepared themaccording to PN-EN ISO 7027 norm [10]. These basesolutions were further diluted by pipetting with pure waterto create series of samples with lower turbidity valuesspanning from 5 NTU up to 800 NTU. Measurements wereperformed on two ranges – with gains 0,05 and 0,1. Everypoint consists of 80 measurements that were done everysecond and then averaged.
Fig. 8. Measurements of lower turbidity samples.
In the first experiment low turbidities that are typical fornatural waters were measured. Tap water should have lessthan 5 NTU while clean lake is usually less than 100 NTU.Preparing standard samples with so low values is tricky.Created samples of 5, 50 and 100 NTU were based on 200NTU standard suspension. Laser light had to be attenuatedwith polariser so for sample with the lowest NTU thevoltage response of the transducer was within ADCsampling range. This characteristic is shown on Fig. 8.
Fig. 9. Measurements of higher turbidity samples.
Two series of higher turbidities that are typical fornatural, inland reservoirs were measured with more irradiantpower (i.e. polariser was “opened”). Second series was from150 to 500 NTU with step of 50 NTU while third was inrange from 300 to 800 NTU with 100 NTU step. These twoseries, each measured on two ranges are shown on Fig. 9.
Series correlate to each other in the subset where theyoverlap at both of used ranges. It means that dilutionprocesses, which started at different points, were doneproperly.
It is visible that one range has twice the gain of the otheras anticipated. Shape of curves confirms that device worksaccording to Lambert-Beer law. Gathered data might befoundation for calibration procedure in future experiments.
V. CONCLUSIONS
In this article it was shown how an integrated circuit ofamplified photodiode might speed up development ofturbidimeter. An inexpensive transducer which is also easyto reproduce is result of this research. Main advantage of thedevice is its quite linear characteristic in range up to 200NTU. This range is especially interesting as such turbidityvalues represent water that can be perceived as clean but infact still requires filtration before consumption.
Some issues were found in the prototype of the transducercircuit. However these concerns are relatively negligiblecompared to overall good performance and significantcapabilities of the stand. Probe that can be immersed orembedded in water pipes is to be developed on this basis.
Development of smaller, cheaper and easier to useturbidimeters will continue. This progress might bring wideradoption of such equipment in ordinary households. Itshould be especially beneficial for rural areas where watersystem is usually more hazardous due to distance from watertreatment plant or due to dubious local sources. Makingdevices that are also capable of wireless transmission willmake them simpler to connect with modern environments of“smart homes” and “smart cities”.
REFERENCES
[1] Council Directive 98/83/EC of 3 November 1998 on the quality ofwater intended for human consumption. [Online]. Available:http://eur-lex.europa.eu/legal-content/EN/TXT/?uri=CELEX:31998L0083
[2] I.R. Kenyon, the Light Fantastic. Oxford University Press, 2008.[3] W. Hergert, T. Wriedt, “The Mie theory. Basics and applications”,
Springer Series in Optical Sciences, vol. 169, 2012.[4] J. Mroczka, D. Szczuczynski, “Improved technique of retrieving
particle size distribution from angular scattering measurements”,Journal of Quantitative Spectroscopy and Radiative Transfer,vol. 129, 2013.
[5] M. Jonasz, G. R. Fournier, Light Scattering by Particles in Water.Theoretical and Experimental Foundations. Elsevier, 2007.
[6] M. Sadar, Introduction to Laser Nephelometry, an Alternative toConventional Particulate Analysis Methods. Hach Company, 2005.
[7] R. Varma, H. Moosmuller, W. P. Arnott, “Toward an ideal integratingnephelometer”, Optics Letters, vol. 28, no. 12, 2003, pp. 1007–1009.[Online]. Available: http://dx.doi.org/10.1364/OL.28.001007
[8] A. Michalski, B. Dziadak, L. Makowski, “Some practical problems ofcommunications reliability in environmental monitoring systems”,Metrology and Measurement Systems, vol. 20, no. 3, pp. 337–350,2013.
[9] B. O'Flyrm, R. Martinez, J. Cleary, C. Slater, F. Regan, D. Diamond,H. Murphy, “SmartCoast: A wireless sensor network for water qualitymonitoring”, 32nd IEEE Conf. on Local Computer Networks, (LCN2007), 2007, pp. 815–816.
[10] “ISO 7027: Water quality -- Determination of turbidity”. InternationalOrganization for Standardization. Geneva, Switzerland. 1999.[Online]. Available: http://www.iso.org/iso/catalogue_detail?csnumber=30123
52