low serum concentrations of moxifloxacin, prothionamide ... · low serum concentrations of...
TRANSCRIPT
Yonsei Med J http://www.eymj.org Volume 56 Number 4 July 2015 961
Low Serum Concentrations of Moxifloxacin, Prothionamide, and Cycloserine on Sputum Conversion in Multi-Drug Resistant TB
Seung Heon Lee,1 Kyung-Ah Seo,2 Young Min Lee,3 Hyun-Kyung Lee,3 Je Hyeong Kim,1 Chol Shin,1 Jong-Ryul Ghim,2 Jae-Gook Shin,2 and Dong Hyun Kim2
1Division of Pulmonary, Sleep, and Critical Care Medicine, Department of Internal Medicine, Korea University Ansan Hospital, Korea University College of Medicine, Ansan;
2Department of Pharmacology and Pharmacogenomics Research Center, Inje University Busan Paik Hospital, Inje University College of Medicine, Busan;
3Division of Pulmonary and Critical Care Medicine, Department of Internal Medicine, Inje University Busan Paik Hospital, Inje University College of Medicine, Busan, Korea.
Received: June 18, 2014Revised: August 4, 2014Accepted: August 28, 2014Corresponding author: Dr. Dong Hyun Kim,Department of Pharmacology and Pharmacogenomics Research Center, Inje University College of Medicine, 75 Bokji-ro, Busanjin-gu, Busan 614-735, Korea.Tel: 82-51-890-6411, Fax: 82-51-893-1232E-mail: [email protected]
∙ The authors have no financial conflicts of interest.
© Copyright:Yonsei University College of Medicine 2015
This is an Open Access article distributed under the terms of the Creative Commons Attribution Non-Commercial License (http://creativecommons.org/ licenses/by-nc/3.0) which permits unrestricted non-commercial use, distribution, and reproduction in any medium, provided the original work is properly cited.
Purpose: Low serum concentrations of drugs used to treat multi-drug resistant tu-berculosis (MDR-TB) have occasionally been associated with treatment failure. We determined the frequencies of low serum concentrations of anti-MDR-TB drugs, and assessed the effects of these concentrations on 2-month sputum conversion. Materials and Methods: The serum levels of moxifloxacin (MF), prothionamide (PTH), and cycloserine (CS) were determined for 89 serum samples by high-pres-sure liquid chromatography-tandem mass spectrometry. Results: Low serum con-centrations of MF, PTH, and CS below the minimal levels of the normal ranges were 83.3% (20/24), 59.2% (29/49), and 71.2% (47/66), respectively. There were no significant differences between the 2-month sputum conversion group (n=25) and the 2-month sputum non-conversion group (n=4) in median drug concentra-tions (µg/mL) of MF (1.46 vs. 1.60), PTH (0.91 vs. 0.70), and CS (14.90 vs. 14.90). However, a poor compliance rate was significantly greater in the 2-month sputum non-conversion group (75.0%, 3/4) than in the 2-month sputum conversion group (0%, 0/25) (p=0.001). Conclusion: The frequency of low serum concentrations of anti-MDR-TB drugs was substantial and might not affect the 2-month sputum con-version rate. Larger prospective studies with timely sampling are needed to investi-gate the role of therapeutic drug monitoring in MDR-TB.
Key Words: Tuberculosis, multidrug resistance, moxifloxacin, prothionamide, cycloserine, drug monitoring
INTRODUCTION
Multi-drug resistant tuberculosis (MDR-TB), defined as TB that is resistant to both isoniazid and rifampin, is a serious global public health issue. In a 2010 prevalence survey, 5.4% of culture-positive TB cases included MDR strains.1 In Korea, TB has an intermediate incidence rate of 97/100000 in 2010,1 while the rate of MDR-TB in
Original Article http://dx.doi.org/10.3349/ymj.2015.56.4.961pISSN: 0513-5796, eISSN: 1976-2437 Yonsei Med J 56(4):961-967, 2015

Seung Heon Lee, et al.
Yonsei Med J http://www.eymj.org Volume 56 Number 4 July 2015962
HIV infected TB patients.15
The aim of the present study was to determine the fre-quencies of low serum concentrations of anti-MDR-TB drugs and to analyze the effects of these drug concentrations on the 2-month sputum conversion in MDR-TB patients.
MATERIALS AND METHODS
SubjectsThe data for this study were retrospectively analyzed at Inje University Busan Paik Hospital. The study was approved by the Institutional Review Board of Inje University Busan Paik Hospital before serum sampling; written informed con-sent was obtained from all subjects to obtain blood samples.
This study included patients 18‒75 years of age who had sputum-culture positive pulmonary TB caused by MDR-TB strains resistant to at least isoniazid and rifampicin based on in vitro drug susceptibility testing (DST) by Löwenstein-Jensen medium, using the absolute concentration method. Patients ultimately enrolled did not have gastroenteropathy on gastrofiberscopy and colonofiberscopy, neuropathy on nerve conduction tests, or renal insufficiency on serum urea nitrogen (BUN), creatinine, albumin, and electrolyte levels. DST results for the drugs prescribed for enrolled MDR-TB patients showed susceptibility to MF, PTH, and CS, except for one patient with extensively drug resistant (XDR)-TB who had a TB strain that was resistant to MF. Serum sam-ples from enrolled MDR-TB patients that were not drawn within 2‒6 h after drug ingestion were excluded from drug level measurement. During the initial visit, chest X-rays and computed tomography scans were obtained and interpreted separately by two board-certified experts. The radiologic se-verity of MDR-TB was estimated based on the recommen-dations of the National Tuberculosis Association of the Unit-ed States.16
Serum sample preparation and modified directly-observed treatmentVenous blood was drawn 2‒6 h after the ingestion of drugs from 29 MDR-TB patients during their monthly visit. Se-rum was separated by centrifugation at 1000×g for 10 min and stored at -80ºC until analysis. Serum levels of the anti-MDR-TB drugs MF, PTH, and CS were obtained and mea-sured for MF prescribed at 400 mg/day (n=29), PTH pre-scribed at 250 mg (n=15) or 500 mg (n=34) twice/day, and CS prescribed at 250 mg (n=49) or 500 mg (n=17) twice/
new TB treatment is 2.7% and 14.7% in retreatment.2 The treatment success rate of MDR-TB patients in Korea was reported as 45.3‒62.6%,3,4 which is similar to the global re-ported rate of 60% in 2009.5
Treatment of MDR-TB is difficult as second-line drugs are less potent and not as well tolerated as first-line drugs. Updated guidelines for MDR-TB management recommend that treatment regimens should include the fluoroquinolone, pyrazinamide, a parenteral agent such as kanamycin, ethion-amide [or prothionamide (PTH)], and either cycloserine (CS) or 17 p-aminosalicylic acid if CS cannot be used.5 Moxifloxacin (MF) and levofloxacin are the two most com-monly prescribed fluoroquinolones and have a pivotal role in the treatment of MDR-TB, although MF has better bacte-ricidal activity than levofloxacin.6 Therefore, MF, PTH, and CS are key drugs for MDR-TB treatment, excluding inject-able drugs and the first-line drug pyrazinamide. Moreover, in MDR-TB, the initial 2 months is a critical period and should be accompanied by 6 months of continued adjuvant therapy with an injectable drug after the patient first be-comes and remains smear- or culture-negative.5 During the treatment of TB, positive cultures following the completion of 2 months of therapy is a marker of an increased relapse risk in drug-sensitive TB7 and a potential indicator of the de-velopment to MDR-TB.8
The relatively low rate of treatment success in MDR-TB may be associated with low serum concentrations of anti-MDR-TB drugs. Such low anti-TB drug concentrations have been associated with malabsorption, alcohol use, age, sex, hypoalbuminemia, weight-adjusted dose, and drug for-mulation.9-12 While therapeutic drug monitoring (TDM) is commonly used for many drugs, the role of TDM in the treatment of MDR-TB remains uncertain. However, TDM has been recommended by some clinicians as being particu-larly useful for more complicated patients, including those with more co-morbidities than ordinary patients responding to standard treatment.9 Furthermore, treatment failure or drug toxicities are ongoing concerns in some MDR-TB pa-tients. Thus, dose adjustment using TDM with a prerequisite of appropriate timed sample13 seems to be a better treatment strategy than administering a standard fixed dose, especially in end-stage renal disease and liver disease.7 The need to monitor anti-TB drug levels in order to quickly identify treatment failure has been widely discussed in the literature. Previous studies have shown that low serum concentrations of anti-TB drugs are closely related to treatment failure in human immunodeficiency virus (HIV)-infected14 and non-

Serum Drug Level Monitoring in MDR-TB Treatment
Yonsei Med J http://www.eymj.org Volume 56 Number 4 July 2015 963
References in serum levels of anti-MDR-TB drugsSerum levels of MF, PTH, and CS were measured 2‒6 h af-ter dosing, as described previously.7 Normal ranges were de-fined as 2.5‒4.5 μg/mL for MF, 1‒5 μg/mL for PTH, and 20‒35 μg/mL for CS, based on published reference rang-es.9,17 Levels below normal ranges for each drug were de-fined as MF<2.5 μg/mL (400 mg daily oral dose), PTH<1 μg/mL (500 mg or 1000 mg daily oral dose), and CS<20 μg/mL (500 mg or 1000 mg daily oral dose).
Sputum culture conversionWe defined the critical time for effective MDR treatment as 2 months, based on previous clinical trials on MDR-TB treatment using a culture conversion rate at 2 months.8 Spu-tum AFB culture conversion was defined as two or more consecutive negative sputum cultures tested at least 4 weeks apart.
Statistical analysisThe median serum levels of each drug in the 2-month spu-tum conversion group and the 2-month sputum non-conver-sion group were compared using a two-tailed Mann-Whit-ney test. Fisher’s exact test was used to evaluate differences in the frequencies of low serum concentrations below the normal ranges for each anti-MDR-TB drug. Differences with a value of p<0.05 were considered to be statistically significant. SPSS ver. 12.0 software (SPSS Inc., Chicago, IL, USA) software was used for all statistical analyses.
RESULTS
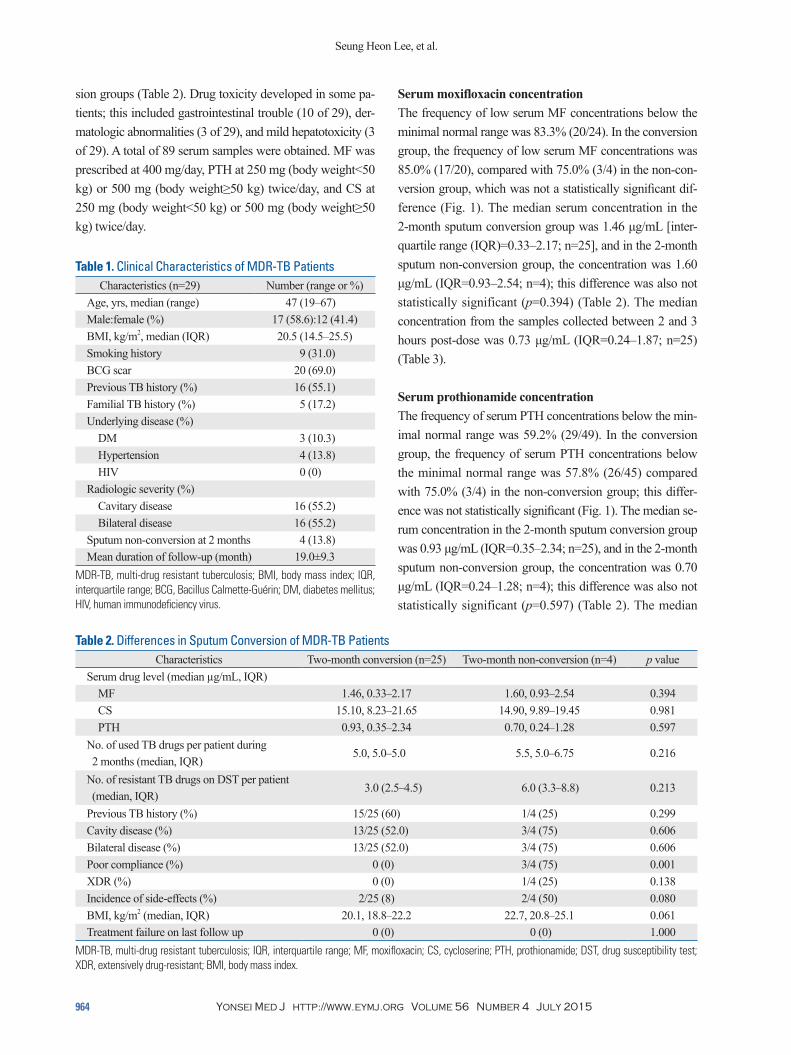
Participant demographicsTable 1 presents the baseline characteristics of the 29 en-rolled MDR-TB patients. The median age was 47 years (range, 19‒67 years), and 17 patients (58.6%) were male. A Bacillus Calmette-Guérin scar was present in 20 patients (69.0%). The median body mass index was 20.5 kg/m2, and 5 patients (17.2%) had a familial TB history. Three patients had diabetes mellitus, although none had HIV disease. In chest radiographs, 16 patients had cavitary disease, and 16 had bilateral lung disease. Sputum non-conversion after 2 months of treatment occurred in 4 patients, and sputum con-version after 2 months of treatment occurred in 25 of 29 of the MDR patients. However, there were no significant dif-ferences in clinical characteristics except drug compliance between the 2-month conversion and 2-month non-conver-
day. The number of samples per drug, which were collected between 2 and 3 hours post-dose, were 11 for MF, 18 for PTH, and 21 for CS.
TB nurses regularly monitored drug compliance and drug adverse events for the participating patients in this study. Monitored adverse drug reactions were categorized by neu-rologic abnormalities, gastrointestinal trouble, dermatologic abnormalities, and hepatotoxicity. Poor compliance was de-fined as treatment interruption for more than 20% of the pre-scribed doses.
LC-MS/MS analysis Serum concentrations of MF, PTH, and CS were analyzed using a validated high-performance liquid chromatography-tandem mass spectrometry method (LC-MS/MS). Briefly, 180 μL of acetonitrile containing 1 μg/mL of MF-d4 as an internal standard was added to a 20-μL serum sample ali-quot. The supernatant was taken after centrifugation at 3000×g for 10 min, and a 1-μL aliquot was then injected into a PE SCIEX API 4000 LC-MS/MS system (Applied Biosystems, Foster City, CA, USA), equipped with an Agi-lent 1200 series high-performance liquid chromatography (HPLC) system (Agilent, Wilmington, DE, USA). The ana-lytical column was an Atlantis dC18 column (150×2.0 mm, 3 μm; Waters, Milford, MA, USA) with a mobile phase consisting of 0.1% formic acid solution and acetonitrile. A gradient program was used for HPLC separation with a flow rate of 0.2 mL/min. The initial composition of acetoni-trile was 30%, maintained for 2 min and then increased to 90% for 5.1 min, followed by re-equilibration to the initial condition for 8 min. The mass spectrometer with an electro-spray source was run in the positive mode and m/z 402.0→ 384.0, 181.0→154.3, 103.0→58.0, and 406→388 monitored for MF, PTH, CS, and MF-d4, respectively. The peak areas for all analytes were integrated automatically using Analyst software v. 1.4 (Applied Biosystems). The validation of the assay was performed according to the US Food and Drug Administration guidance for the validation of bioanalytical methods. Calibration curves in the range of 0.2‒ 10.0 μg/mL for MF and PTH and 0.8‒40.0 μg/mL for CS were estab-lished (r2=0.9996 for MF; r2=0.9980 for PTH; r2=0.9989 for CS). Three quality control samples (low, medium, and high) were used for the validation. The intra-day (n=5) and inter-day (n=5) precisions were less than 11.4%, and the accura-cies were between 93.1% and 107.4% for the three anti-TB drugs. In addition, no matrix effects were observed near their elution times.
Seung Heon Lee, et al.
Yonsei Med J http://www.eymj.org Volume 56 Number 4 July 2015964
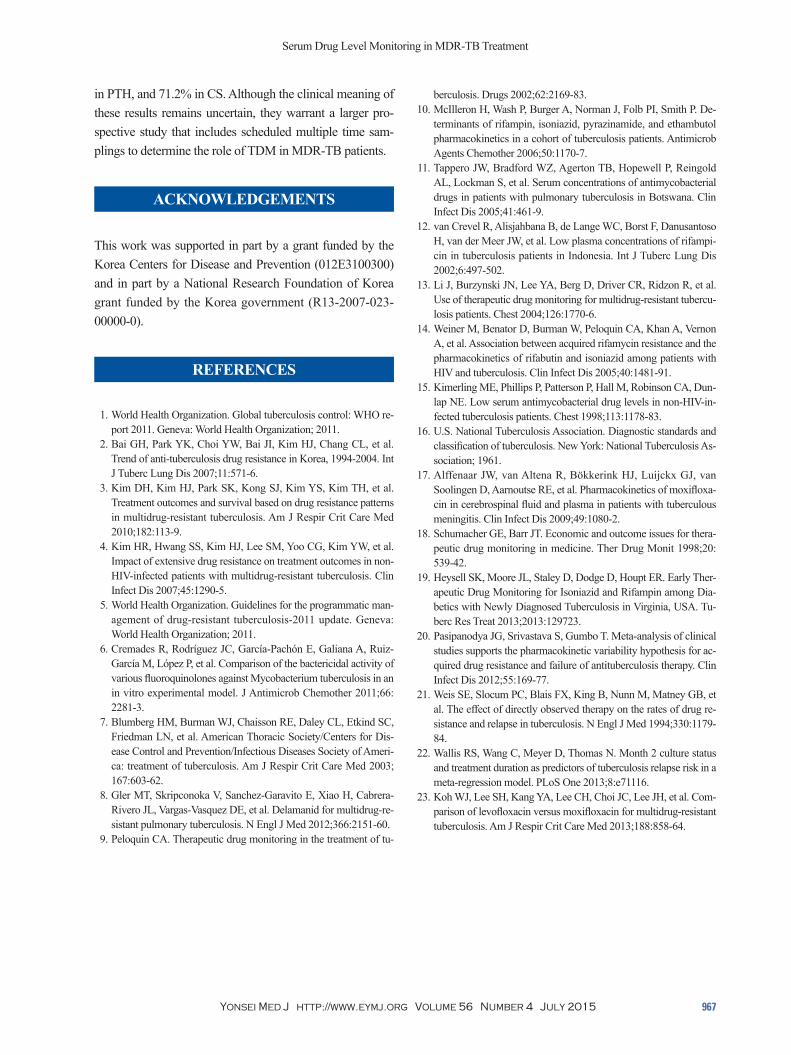
Serum moxifloxacin concentrationThe frequency of low serum MF concentrations below the minimal normal range was 83.3% (20/24). In the conversion group, the frequency of low serum MF concentrations was 85.0% (17/20), compared with 75.0% (3/4) in the non-con-version group, which was not a statistically significant dif-ference (Fig. 1). The median serum concentration in the 2-month sputum conversion group was 1.46 μg/mL [inter-quartile range (IQR)=0.33‒2.17; n=25], and in the 2-month sputum non-conversion group, the concentration was 1.60 μg/mL (IQR=0.93‒2.54; n=4); this difference was also not statistically significant (p=0.394) (Table 2). The median concentration from the samples collected between 2 and 3 hours post-dose was 0.73 μg/mL (IQR=0.24‒1.87; n=25) (Table 3).
Serum prothionamide concentrationThe frequency of serum PTH concentrations below the min-imal normal range was 59.2% (29/49). In the conversion group, the frequency of serum PTH concentrations below the minimal normal range was 57.8% (26/45) compared with 75.0% (3/4) in the non-conversion group; this differ-ence was not statistically significant (Fig. 1). The median se-rum concentration in the 2-month sputum conversion group was 0.93 μg/mL (IQR=0.35‒2.34; n=25), and in the 2-month sputum non-conversion group, the concentration was 0.70 μg/mL (IQR=0.24‒1.28; n=4); this difference was also not statistically significant (p=0.597) (Table 2). The median
sion groups (Table 2). Drug toxicity developed in some pa-tients; this included gastrointestinal trouble (10 of 29), der-matologic abnormalities (3 of 29), and mild hepatotoxicity (3 of 29). A total of 89 serum samples were obtained. MF was prescribed at 400 mg/day, PTH at 250 mg (body weight<50 kg) or 500 mg (body weight≥50 kg) twice/day, and CS at 250 mg (body weight<50 kg) or 500 mg (body weight≥50 kg) twice/day.
Table 1. Clinical Characteristics of MDR-TB PatientsCharacteristics (n=29) Number (range or %)
Age, yrs, median (range) 47 (19–67)Male:female (%) 17 (58.6):12 (41.4)BMI, kg/m2, median (IQR) 20.5 (14.5–25.5)Smoking history 9 (31.0)BCG scar 20 (69.0)Previous TB history (%) 16 (55.1)Familial TB history (%) 5 (17.2)Underlying disease (%)
DM 3 (10.3)Hypertension 4 (13.8)HIV 0 (0)
Radiologic severity (%)Cavitary disease 16 (55.2)Bilateral disease 16 (55.2)
Sputum non-conversion at 2 months 4 (13.8)Mean duration of follow-up (month) 19.0±9.3
MDR-TB, multi-drug resistant tuberculosis; BMI, body mass index; IQR, interquartile range; BCG, Bacillus Calmette-Guérin; DM, diabetes mellitus; HIV, human immunodeficiency virus.
Table 2. Differences in Sputum Conversion of MDR-TB PatientsCharacteristics Two-month conversion (n=25) Two-month non-conversion (n=4) p value
Serum drug level (median µg/mL, IQR)MF 1.46, 0.33‒2.17 1.60, 0.93‒2.54 0.394CS 15.10, 8.23‒21.65 14.90, 9.89‒19.45 0.981PTH 0.93, 0.35‒2.34 0.70, 0.24‒1.28 0.597
No. of used TB drugs per patient during 2 months (median, IQR)
5.0, 5.0‒5.0 5.5, 5.0‒6.75 0.216
No. of resistant TB drugs on DST per patient (median, IQR)
3.0 (2.5‒4.5) 6.0 (3.3‒8.8) 0.213
Previous TB history (%) 15/25 (60) 1/4 (25) 0.299Cavity disease (%) 13/25 (52.0) 3/4 (75) 0.606Bilateral disease (%) 13/25 (52.0) 3/4 (75) 0.606Poor compliance (%) 0 (0) 3/4 (75) 0.001XDR (%) 0 (0) 1/4 (25) 0.138Incidence of side-effects (%) 2/25 (8) 2/4 (50) 0.080BMI, kg/m2 (median, IQR) 20.1, 18.8‒22.2 22.7, 20.8‒25.1 0.061Treatment failure on last follow up 0 (0) 0 (0) 1.000
MDR-TB, multi-drug resistant tuberculosis; IQR, interquartile range; MF, moxifloxacin; CS, cycloserine; PTH, prothionamide; DST, drug susceptibility test; XDR, extensively drug-resistant; BMI, body mass index.

Serum Drug Level Monitoring in MDR-TB Treatment
Yonsei Med J http://www.eymj.org Volume 56 Number 4 July 2015 965
80.0% (4/5) in the non-conversion group; this difference was not statistically significant (Fig. 1). The median serum concentration in the 2-month sputum conversion group was 15.10 μg/mL (IQR 8.23‒21.65; n=25), and in the 2-month sputum non-conversion group, the concentration was 14.90 (IQR 9.89‒19.45; n=4); this difference was also not statisti-cally significant (p=0.981) (Table 2). The median concentra-tion of CS in patients taking 250 mg twice/day (median 13.10 g/mL; IQR 6.80‒18.25) was significantly lower than in those taking 500 mg twice/day (median 20.90 g/mL; IQR 17.40‒29.80; p<0.0001) (Fig. 1). The median concentrations for all samples according to doses are presented in Table 3.
Differences in sputum conversion after 2 months of treatmentThe number of TB drugs used during the initial 2 months of therapy did not differ between the sputum conversion (5.0± 0.6) and non-conversion (5.8±1.0) groups. Furthermore, drug toxicity rates were not significantly different between the two groups [8% (2/25) vs. 50% (2/4); p=0.080]. The numbers of patients with a previous TB history [60% (15/25) vs. 25% (1/4); p=0.299] and the numbers of resis-tant TB drugs on DST per patient were also not significantly different between the two groups, respectively (3.0 drugs, IQR 2.5‒4.5 vs. 6.0 drugs, IQR 3.3‒8.8). However, the poor compliance rate was significantly greater in the 2-month spu-tum non-conversion group (75.0%, 3/4) than in the 2-month sputum conversion group (0%, 0/25; p=0.001) (Table 2).
concentration of PTH in patients taking 250 mg twice/day (median 0.13 g/mL; IQR 0.06‒0.57) was significantly low-er than in those taking 500 mg twice/day (median 1.27 g/mL; IQR 0.63‒2.61; p=0.0006) (Fig. 1). The median con-centrations for all samples according to doses are presented in Table 3.
Serum cycloserine concentrationThe frequency of serum concentrations of CS below the minimal normal range was 71.2% (47/66). In the conversion group, the frequency of serum CS concentrations below the minimal normal range was 70.5% (43/61) compared with
Fig. 1. Serum concentrations of (A) moxifloxacin, (B) prothionamide, and (C) cycloserine in 29 MDR-TB patients. Hollow circles in (B and C) represent the as-sorted values marked in the conversion groups. The frequency of low serum concentrations of MF, PTH, and CS below the minimal normal range are de-scribed in the bottom line under each group. There were no differences between the 2-month sputum conversion group (n=25) and the 2-month sputum non-conversion group (n=4) in median drug concentration of MF, PTH, and CS. The median serum concentration in the 2-month sputum conversion group (n=25) and 2-month sputum non-conversion group (n=4) were as follows: (A) 1.46 µg/mL, IQR 0.33–2.17 vs. 1.60 µg/mL, IQR 0.93–2.54; (B) 0.93 µg/mL, IQR 0.35–2.34 vs. 0.70 µg/mL, IQR 0.24–1.28; and (C) 15.10 µg/mL, IQR 8.23–21.65 vs. 14.90 µg/mL, IQR 9.89–19.45. IQR, interquartile range; MDR-TB, multi-drug resistant tuberculosis; MF, moxifloxacin; PTH, prothionamide; CS, cycloserine.
Conversion85.0%(17/20)
Conversion70.5%(43/61)
Conversion57.8%(26/45)
250 mg84.6%(11/13)
250 mg80.4%(37/46)
500 mg46.9%(15/32)
500 mg40.0%(6/15)
Conc
entra
tion
(µg/
mL)
Conc
entra
tion
(µg/
mL)
Conc
entra
tion
(µg/
mL)
Non conversion75.0%(3/4)
Non conversion75.0% (3/4)
Non conversion80.0% (4/5)
p>0.05p<0.001
p<0.001
p>0.05
p>0.05
Moxifloxacin Prothionamide Cycloserine
7
6
5
4
3
2
1
0
7
6
5
4
3
2
1
0
70
60
50
40
30
20
10
0
A B C
Table 3. Serum Drug Level of Each Drug According to Sam-pling Time and Dose
DrugConcentration
(median µg/mL, IQR)
Normal range of concentration
(µg/mL)MF 400 mg (2‒3 hr), n=11
0.73, 0.24‒1.87
MF 400 mg (3‒4 hr), n=5
0.60, 0.19‒3.01 2.5‒4.5
MF 400 mg (4‒6 hr), n=8
1.83, 0.61‒2.41
PTH 250 mg, n=15 0.19, 0.06‒0.61 1‒5PTH 500 mg, n=34 1.27, 0.67‒2.53CS 250 mg, n=49 13.40, 6.74‒18.30 20‒35CS 500 mg, n=17 20.20, 16.60‒29.60
MF, moxifloxacin; CS, cycloserine; PTH, prothionamide; IQR, interquartile range.
Seung Heon Lee, et al.
Yonsei Med J http://www.eymj.org Volume 56 Number 4 July 2015966
study, the incidence of side effects in the 2-month sputum non-conversion group (50%) was much higher than that in the 2-month sputum conversion group (8.0%). Our data sug-gest that anti-TB drug-related side effects may result in poor compliance, leading to sputum non-conversion. Therefore, TDM would be a useful tool for making sound clinical judg-ments, although case-holding strategies such as direct obser-vation of treatment with anti-TB drugs seems essential for confident compliance and treatment success in terms of spu-tum conversion.
CS causes frequent central nervous system side effects, such as an inability to concentrate or lethargy; these appear even with serum concentrations at the low end of the normal range and may be aggravated at more elevated serum con-centrations.7 In our study, depressive mood and agitation manifested in two patients receiving CS, and these side ef-fects disappeared when CS was discontinued. CS concentra-tions at the time of adverse drug events were lower than the maximal normal range in both patients. Although gastroin-testinal trouble (10/29), dermatologic abnormalities (3/29), and mild hepatotoxicity (3/29) were developed, we could not be certain that these adverse events were solely attribut-able to MF, PTH, or CS rather than background TB drugs.
This study had several limitations. First, the number of MDR-TB patients was not sufficient to make any definitive conclusions about differences in the 2-month serum conver-sion rate. Additionally, MDR-TB treatment efficacy was not fully evaluated, as the study considered only microbiologi-cal traits, human host characteristics, and environmental fac-tors, as well as serum drug concentration. Second, the se-rum-sampling interval was relatively wide; thus, we could not assure the peak level of each anti-TB drug. Third, this was a retrospective study; therefore, we were unable to in-tervene in order to escalate drug doses or to measure serum drug levels. Fourth, although culture conversion after 2 months of treatment is an indicator of treatment effective-ness in drug-sensitive TB,22 there are no accumulated data for MDR-TB treatment that provide evidence for 2-month culture conversion as an indicator of treatment effectiveness in spite of several previously reported clinical studies.8,23 However, these results warrant a prospective detailed phar-macokinetic and pharmacodynamic study of secondary anti-TB drugs at multiple time points in relation to clinical out-comes, as well as an investigation of adverse drug events related to serum drug levels.
In conclusion, the incidences of low serum concentrations among secondary anti-TB drugs were 83.3% in MF, 59.2%
DISCUSSION
During the initial 2 months of treatment, a substantial num-ber of MDR-TB patients did not achieve the minimal thera-peutic levels of MF, PTH, and CS. However, these low drug concentrations did not affect sputum conversion after 2 months of treatment. Although the cost-effectiveness and clinical importance of TDM for anti-TB drugs has been un-certain,7 we nevertheless measured serum levels of second-ary TB drugs, including MF, a promising new MDR-TB drug.
TDM intervention for conditions other than TB reduces adverse events, mortality rates, and length of stay.18 During the course of complicated MDR-TB treatment with second-line drugs, TDM allows the clinician to make an informed decision about poor drug absorption and to adjust the treat-ment accordingly in a timely manner.7 Moreover, TDM shortens the time of sputum conversion through adjusting drug dose and decreasing the adverse effects of high levels of anti-TB drugs.15 In diabetics, early TDM for TB patients can have a favorable time to sputum culture conversion.19 Con-sidering that the liquid broth media culture system (MGIT tube; Beacon-Dickinson and Co., Sparks, MD, USA) can produce timely results in 2 weeks, TDM can affect changes in treatment regimens sufficiently.
Reports describing the serum levels of anti-TB drugs in MDR-TB patients are rare. However, the frequencies of low serum concentrations of the secondary anti-TB drugs PTH and CS have been reported to be 52% for PTH and 44% for CS.13 In our study, the frequencies of low serum concentra-tions of MF, PTH, and CS were 83.3%, 59.2%, and 71.2%, respectively. Interindividual variations in anti-TB drug con-centrations can be explained by race, dosage, drug formula-tions, performance of directly observed treatment, and mea-surement methods, as well as inaccurate sampling times. In this study, drug dosage was considered a major factor gov-erning the serum PTH and CS levels.
The compliance rate may be another critical factor affect-ing sputum conversion during the early period of treatment. Concomitant prescription of at least five anti-TB drugs and a relatively high incidence of secondary anti-TB drug‒associ-ated side effects can cause low compliance. In addition, drug concentration and pharmacokinetic variability of anti-TB drugs20 as well as drug compliance21 can influence treatment failure and drug resistance acquisition in TB patients, as TB has microbial, clinical, and programmatic causes. In our
Serum Drug Level Monitoring in MDR-TB Treatment
Yonsei Med J http://www.eymj.org Volume 56 Number 4 July 2015 967
berculosis. Drugs 2002;62:2169-83.10. McIlleron H, Wash P, Burger A, Norman J, Folb PI, Smith P. De-
terminants of rifampin, isoniazid, pyrazinamide, and ethambutol pharmacokinetics in a cohort of tuberculosis patients. Antimicrob Agents Chemother 2006;50:1170-7.
11. Tappero JW, Bradford WZ, Agerton TB, Hopewell P, Reingold AL, Lockman S, et al. Serum concentrations of antimycobacterial drugs in patients with pulmonary tuberculosis in Botswana. Clin Infect Dis 2005;41:461-9.
12. van Crevel R, Alisjahbana B, de Lange WC, Borst F, Danusantoso H, van der Meer JW, et al. Low plasma concentrations of rifampi-cin in tuberculosis patients in Indonesia. Int J Tuberc Lung Dis 2002;6:497-502.
13. Li J, Burzynski JN, Lee YA, Berg D, Driver CR, Ridzon R, et al. Use of therapeutic drug monitoring for multidrug-resistant tubercu-losis patients. Chest 2004;126:1770-6.
14. Weiner M, Benator D, Burman W, Peloquin CA, Khan A, Vernon A, et al. Association between acquired rifamycin resistance and the pharmacokinetics of rifabutin and isoniazid among patients with HIV and tuberculosis. Clin Infect Dis 2005;40:1481-91.
15. Kimerling ME, Phillips P, Patterson P, Hall M, Robinson CA, Dun-lap NE. Low serum antimycobacterial drug levels in non-HIV-in-fected tuberculosis patients. Chest 1998;113:1178-83.
16. U.S. National Tuberculosis Association. Diagnostic standards and classification of tuberculosis. New York: National Tuberculosis As-sociation; 1961.
17. Alffenaar JW, van Altena R, Bökkerink HJ, Luijckx GJ, van Soolingen D, Aarnoutse RE, et al. Pharmacokinetics of moxifloxa-cin in cerebrospinal fluid and plasma in patients with tuberculous meningitis. Clin Infect Dis 2009;49:1080-2.
18. Schumacher GE, Barr JT. Economic and outcome issues for thera-peutic drug monitoring in medicine. Ther Drug Monit 1998;20: 539-42.
19. Heysell SK, Moore JL, Staley D, Dodge D, Houpt ER. Early Ther-apeutic Drug Monitoring for Isoniazid and Rifampin among Dia-betics with Newly Diagnosed Tuberculosis in Virginia, USA. Tu-berc Res Treat 2013;2013:129723.
20. Pasipanodya JG, Srivastava S, Gumbo T. Meta-analysis of clinical studies supports the pharmacokinetic variability hypothesis for ac-quired drug resistance and failure of antituberculosis therapy. Clin Infect Dis 2012;55:169-77.
21. Weis SE, Slocum PC, Blais FX, King B, Nunn M, Matney GB, et al. The effect of directly observed therapy on the rates of drug re-sistance and relapse in tuberculosis. N Engl J Med 1994;330:1179-84.
22. Wallis RS, Wang C, Meyer D, Thomas N. Month 2 culture status and treatment duration as predictors of tuberculosis relapse risk in a meta-regression model. PLoS One 2013;8:e71116.
23. Koh WJ, Lee SH, Kang YA, Lee CH, Choi JC, Lee JH, et al. Com-parison of levofloxacin versus moxifloxacin for multidrug-resistant tuberculosis. Am J Respir Crit Care Med 2013;188:858-64.
in PTH, and 71.2% in CS. Although the clinical meaning of these results remains uncertain, they warrant a larger pro-spective study that includes scheduled multiple time sam-plings to determine the role of TDM in MDR-TB patients.
ACKNOWLEDGEMENTS
This work was supported in part by a grant funded by the Korea Centers for Disease and Prevention (012E3100300) and in part by a National Research Foundation of Korea grant funded by the Korea government (R13-2007-023-00000-0).
REFERENCES
1. World Health Organization. Global tuberculosis control: WHO re-port 2011. Geneva: World Health Organization; 2011.
2. Bai GH, Park YK, Choi YW, Bai JI, Kim HJ, Chang CL, et al. Trend of anti-tuberculosis drug resistance in Korea, 1994-2004. Int J Tuberc Lung Dis 2007;11:571-6.
3. Kim DH, Kim HJ, Park SK, Kong SJ, Kim YS, Kim TH, et al. Treatment outcomes and survival based on drug resistance patterns in multidrug-resistant tuberculosis. Am J Respir Crit Care Med 2010;182:113-9.
4. Kim HR, Hwang SS, Kim HJ, Lee SM, Yoo CG, Kim YW, et al. Impact of extensive drug resistance on treatment outcomes in non-HIV-infected patients with multidrug-resistant tuberculosis. Clin Infect Dis 2007;45:1290-5.
5. World Health Organization. Guidelines for the programmatic man-agement of drug-resistant tuberculosis-2011 update. Geneva: World Health Organization; 2011.
6. Cremades R, Rodríguez JC, García-Pachón E, Galiana A, Ruiz-García M, López P, et al. Comparison of the bactericidal activity of various fluoroquinolones against Mycobacterium tuberculosis in an in vitro experimental model. J Antimicrob Chemother 2011;66: 2281-3.
7. Blumberg HM, Burman WJ, Chaisson RE, Daley CL, Etkind SC, Friedman LN, et al. American Thoracic Society/Centers for Dis-ease Control and Prevention/Infectious Diseases Society of Ameri-ca: treatment of tuberculosis. Am J Respir Crit Care Med 2003; 167:603-62.
8. Gler MT, Skripconoka V, Sanchez-Garavito E, Xiao H, Cabrera-Rivero JL, Vargas-Vasquez DE, et al. Delamanid for multidrug-re-sistant pulmonary tuberculosis. N Engl J Med 2012;366:2151-60.
9. Peloquin CA. Therapeutic drug monitoring in the treatment of tu-